Attached files
| file | filename |
|---|---|
| 8-K - 8-K - InvenTrust Properties Corp. | a09-36812_18k.htm |
| EX-99.1 - EX-99.1 - InvenTrust Properties Corp. | a09-36812_1ex99d1.htm |
Exhibit 99.2
|
|
www.inlandamerican.com December 2009 Inland American Third Quarter 2009 Update |
|
|
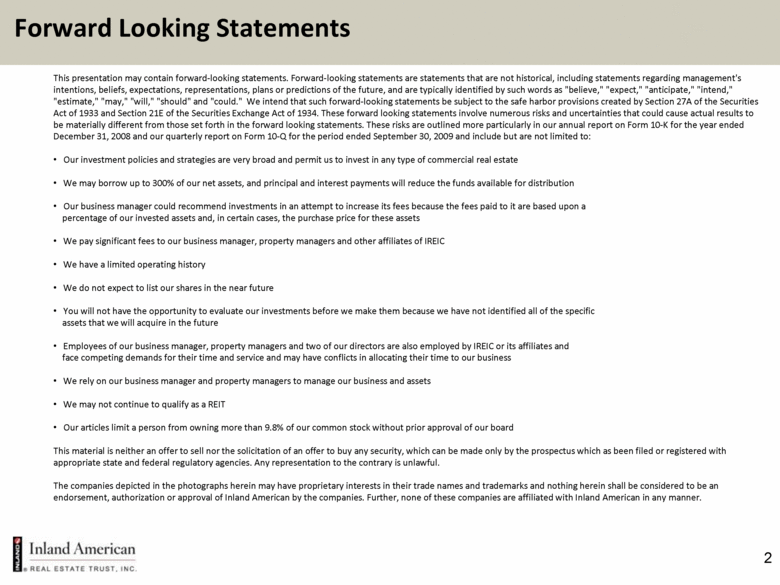
2 This presentation may contain forward-looking statements. Forward-looking statements are statements that are not historical, including statements regarding management's intentions, beliefs, expectations, representations, plans or predictions of the future, and are typically identified by such words as "believe," "expect," "anticipate," "intend," "estimate," "may," "will," "should" and "could." We intend that such forward-looking statements be subject to the safe harbor provisions created by Section 27A of the Securities Act of 1933 and Section 21E of the Securities Exchange Act of 1934. These forward looking statements involve numerous risks and uncertainties that could cause actual results to be materially different from those set forth in the forward looking statements. These risks are outlined more particularly in our annual report on Form 10-K for the year ended December 31, 2008 and our quarterly report on Form 10-Q for the period ended September 30, 2009 and include but are not limited to: Our investment policies and strategies are very broad and permit us to invest in any type of commercial real estate We may borrow up to 300% of our net assets, and principal and interest payments will reduce the funds available for distribution Our business manager could recommend investments in an attempt to increase its fees because the fees paid to it are based upon a percentage of our invested assets and, in certain cases, the purchase price for these assets We pay significant fees to our business manager, property managers and other affiliates of IREIC We have a limited operating history We do not expect to list our shares in the near future You will not have the opportunity to evaluate our investments before we make them because we have not identified all of the specific assets that we will acquire in the future Employees of our business manager, property managers and two of our directors are also employed by IREIC or its affiliates and face competing demands for their time and service and may have conflicts in allocating their time to our business We rely on our business manager and property managers to manage our business and assets We may not continue to qualify as a REIT Our articles limit a person from owning more than 9.8% of our common stock without prior approval of our board This material is neither an offer to sell nor the solicitation of an offer to buy any security, which can be made only by the prospectus which as been filed or registered with appropriate state and federal regulatory agencies. Any representation to the contrary is unlawful. The companies depicted in the photographs herein may have proprietary interests in their trade names and trademarks and nothing herein shall be considered to be an endorsement, authorization or approval of Inland American by the companies. Further, none of these companies are affiliated with Inland American in any manner. Forward Looking Statements |
|
|
3 Owns a diverse portfolio of core commercial real estate including: Retail Lodging Office Multi-Family/Student Housing Industrial • Owns directly or indirectly through joint ventures 946 properties 43 million square feet 8,544 multi-family units 15,125 lodging rooms • Invests in joint ventures, development projects, real estate loans and marketable securities • One of five REITs previously sponsored by an affiliate of The Inland Real Estate Group of Companies, Inc. (“Inland”) Overview As of September 30, 2009 |
|
|
4 A Diverse Real Estate Portfolio Balances Risk Exposure Core assets in several real estate sectors nationwide Investments in joint ventures, developments, loans and marketable securities designed to enhance core stabilized yield Conservative Balance Sheet Management Low leveraged buyer - 44% debt to assets as of September 30, 2009 No corporate level debt – individual loans on each property limits risk Maximize Long-Term Stockholder Value Invest in real estate assets that produce attractive current yields and long-term risk-adjusted returns Generate sustainable and predictable cash flow from our operations Focus on preservation of capital Strategy |
|
|
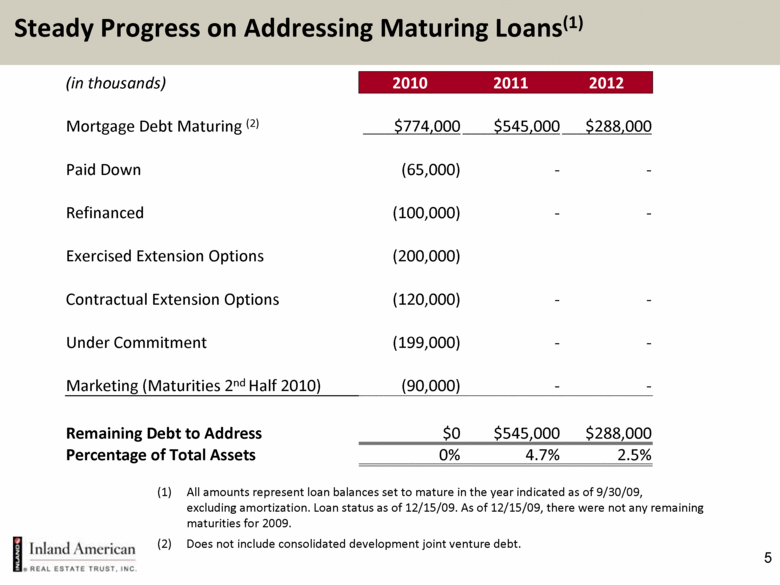
5 Steady Progress on Addressing Maturing Loans(1) (in thousands) 2010 2011 2012 Mortgage Debt Maturing (2) $774,000 $545,000 $288,000 Paid Down (65,000) - - Refinanced (100,000) - - Exercised Extension Options (200,000) Contractual Extension Options (120,000) - - Under Commitment (199,000) - - Marketing (Maturities 2nd Half 2010) (90,000) - - Remaining Debt to Address $0 $545,000 $288,000 Percentage of Total Assets 0% 4.7% 2.5% (1) All amounts represent loan balances set to mature in the year indicated as of 9/30/09, excluding amortization. Loan status as of 12/15/09. As of 12/15/09, there were not any remaining maturities for 2009. (2) Does not include consolidated development joint venture debt. |
|
|
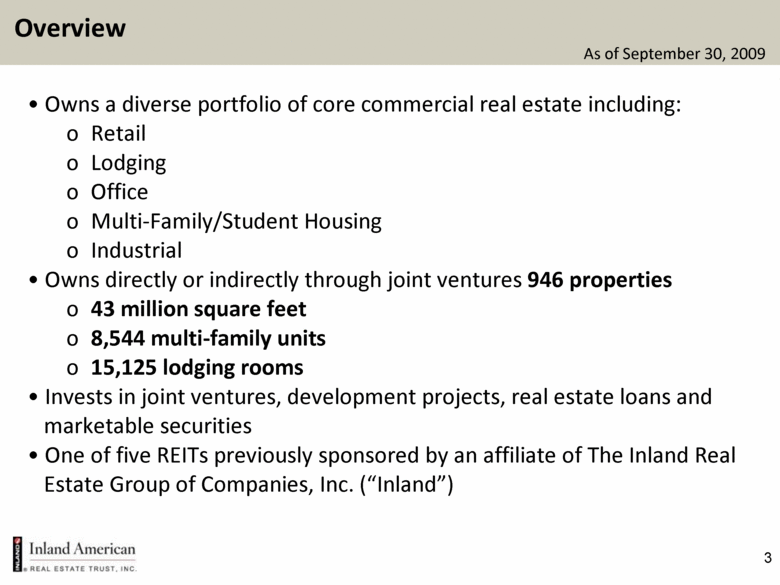
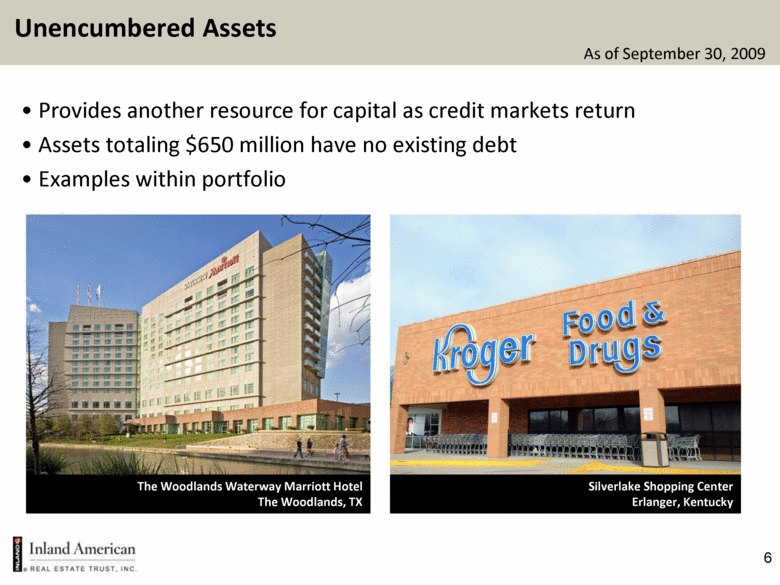
6 • Provides another resource for capital as credit markets return Assets totaling $650 million have no existing debt Examples within portfolio The Woodlands Waterway Marriott Hotel The Woodlands, TX Silverlake Shopping Center Erlanger, Kentucky Unencumbered Assets As of September 30, 2009 |
|
|
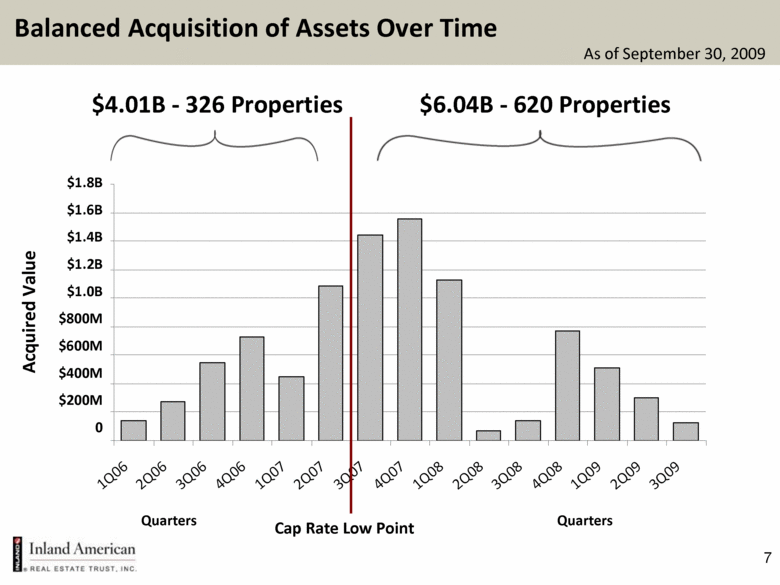
7 Balanced Acquisition of Assets Over Time As of September 30, 2009 Cap Rate Low Point $4.01B - 326 Properties $6.04B - 620 Properties Quarters Acquired Value $1.8B $1.6B $1.4B $1.2B $1.0B $800M $600M $400M $200M 0 Quarters 1Q06 2Q06 3Q06 4Q06 1Q07 2Q07 3Q07 4Q07 1Q08 2Q08 3Q08 4Q08 1Q09 2Q09 3Q09 |
|
|
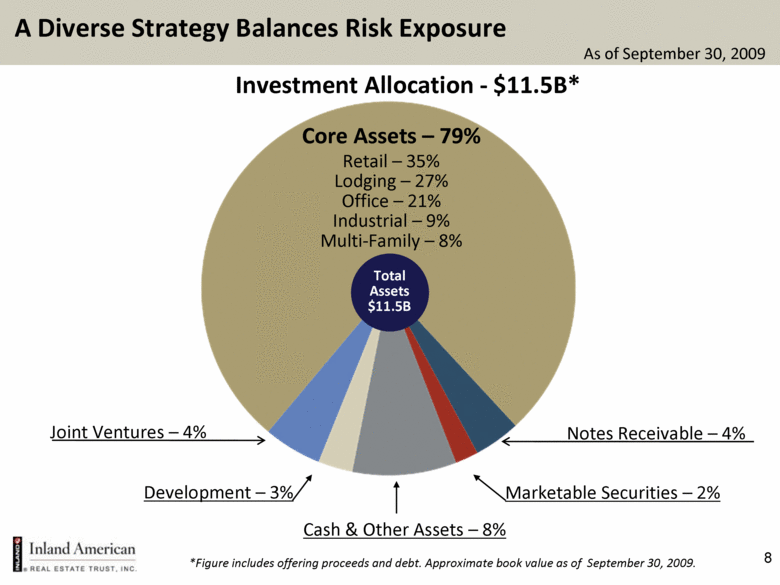
8 Cash & Other Assets – 8% Total Assets $11.5B Core Assets – 79% Retail – 35% Lodging – 27% Office – 21% Industrial – 9% Multi-Family – 8% Notes Receivable – 4% Marketable Securities – 2% Joint Ventures – 4% Development – 3% A Diverse Strategy Balances Risk Exposure As of September 30, 2009 *Figure includes offering proceeds and debt. Approximate book value as of September 30, 2009. Investment Allocation - $11.5B* |
|
|
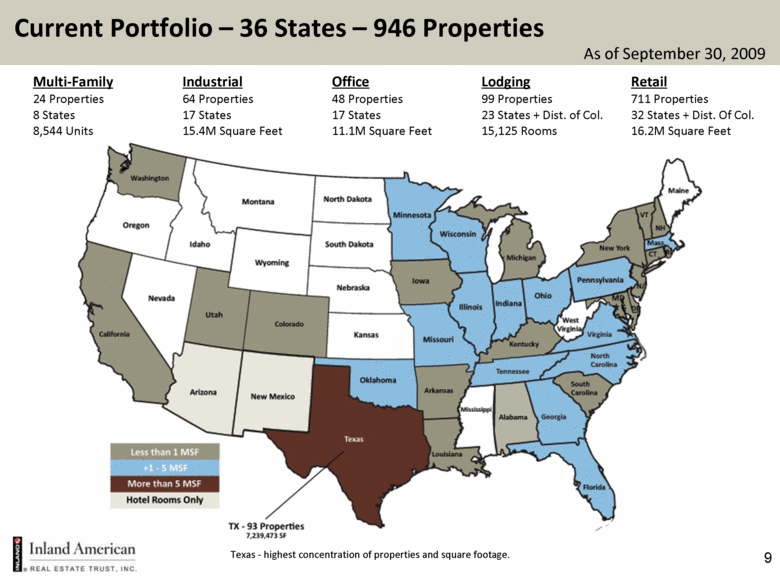
9 Current Portfolio – 36 States – 946 Properties As of September 30, 2009 Texas - highest concentration of properties and square footage. Multi-Family Industrial Office Lodging Retail 24 Properties 64 Properties 48 Properties 99 Properties 711 Properties 8 States 17 States 17 States 23 States + Dist. of Col. 32 States + Dist. Of Col. 8,544 Units 15.4M Square Feet 11.1M Square Feet 15,125 Rooms 16.2M Square Feet |
|
|
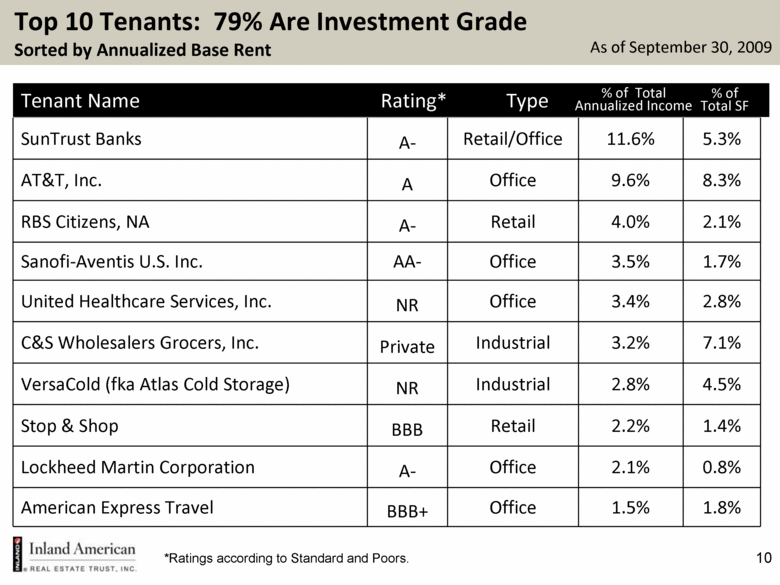
10 Top 10 Tenants: 79% Are Investment Grade Sorted by Annualized Base Rent As of September 30, 2009 SunTrust Banks A- Retail/Office 11.6% 5.3% AT&T, Inc. A Office 9.6% 8.3% RBS Citizens, NA A- Retail 4.0% 2.1% Sanofi-Aventis U.S. Inc. AA- Office 3.5% 1.7% United Healthcare Services, Inc. NR Office 3.4% 2.8% C&S Wholesalers Grocers, Inc. Private Industrial 3.2% 7.1% VersaCold (fka Atlas Cold Storage) NR Industrial 2.8% 4.5% Stop & Shop BBB Retail 2.2% 1.4% Lockheed Martin Corporation A- Office 2.1% 0.8% American Express Travel BBB+ Office 1.5% 1.8% Tenant Name Rating* Type % of Total SF % of Total Annualized Income *Ratings according to Standard and Poors. |
|
|
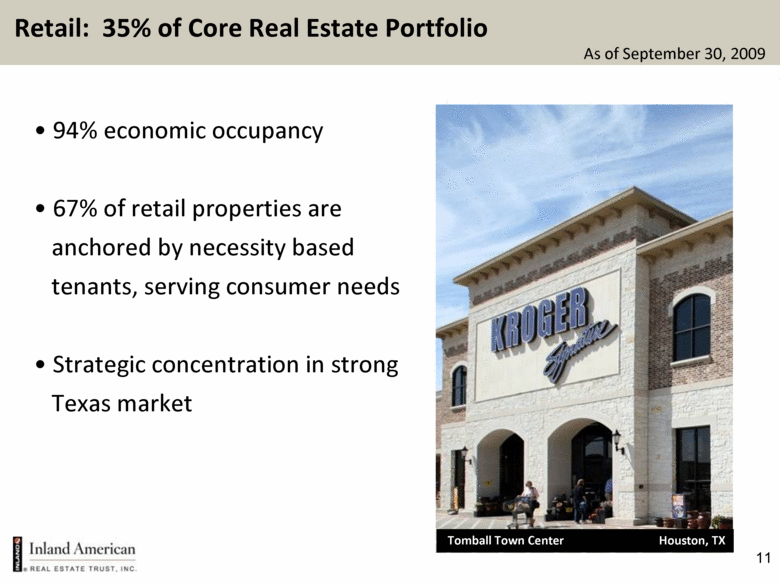
11 Tomball Town Center Houston, TX Retail: 35% of Core Real Estate Portfolio 94% economic occupancy 67% of retail properties are anchored by necessity based tenants, serving consumer needs Strategic concentration in strong Texas market As of September 30, 2009 |
|
|
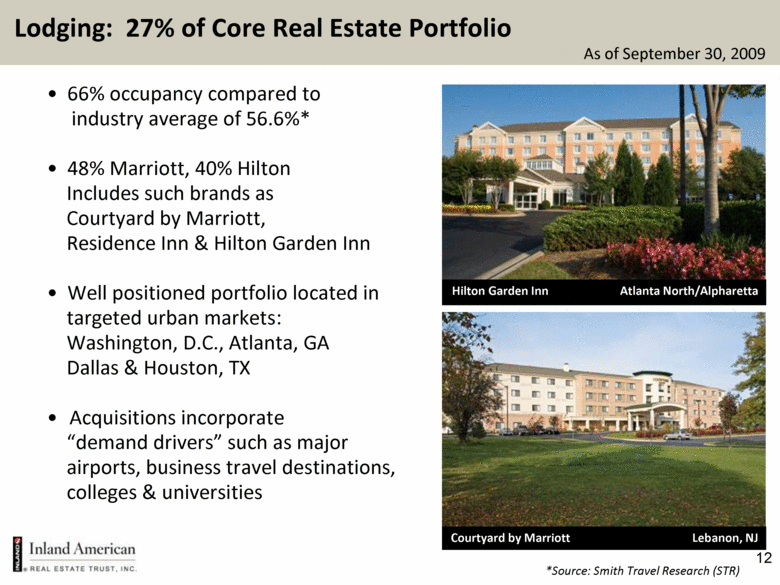
12 • 66% occupancy compared to industry average of 56.6%* • 48% Marriott, 40% Hilton Includes such brands as Courtyard by Marriott, Residence Inn & Hilton Garden Inn • Well positioned portfolio located in targeted urban markets: Washington, D.C., Atlanta, GA Dallas & Houston, TX • Acquisitions incorporate “demand drivers” such as major airports, business travel destinations, colleges & universities Courtyard by Marriott Lebanon, NJ Hilton Garden Inn Atlanta North/Alpharetta *Source: Smith Travel Research (STR) Lodging: 27% of Core Real Estate Portfolio As of September 30, 2009 |
|
|
Lodging is Positioned for Growth We have moved aggressively in meeting the challenges of the downturn, including: Cost cuts in property expenses as a result of occupancy levels Inland American is one of the few owners with cash available to modernize hotels and position us to gain market share 13 |
|
|
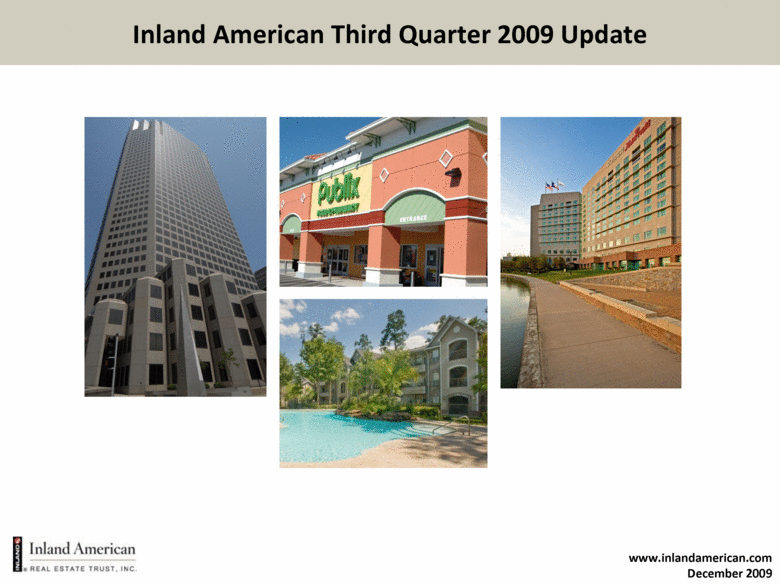
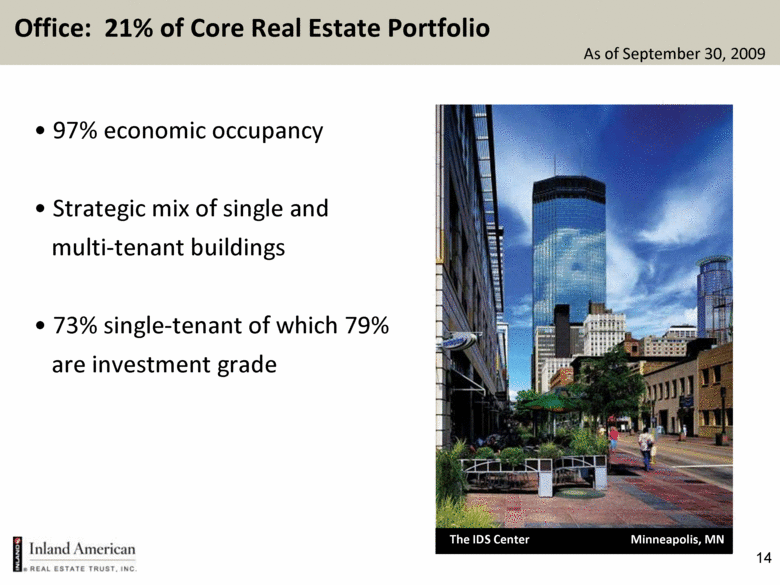
14 The IDS Center Minneapolis, MN Office: 21% of Core Real Estate Portfolio 97% economic occupancy Strategic mix of single and multi-tenant buildings 73% single-tenant of which 79% are investment grade As of September 30, 2009 |
|
|
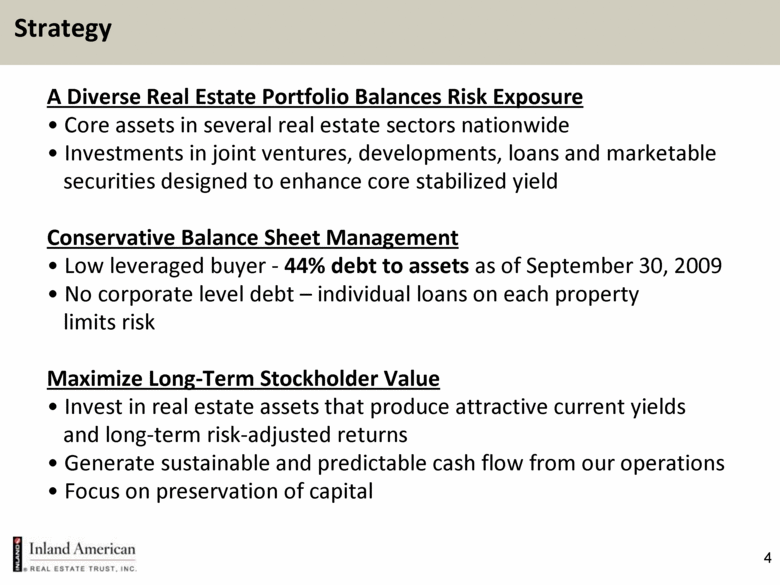
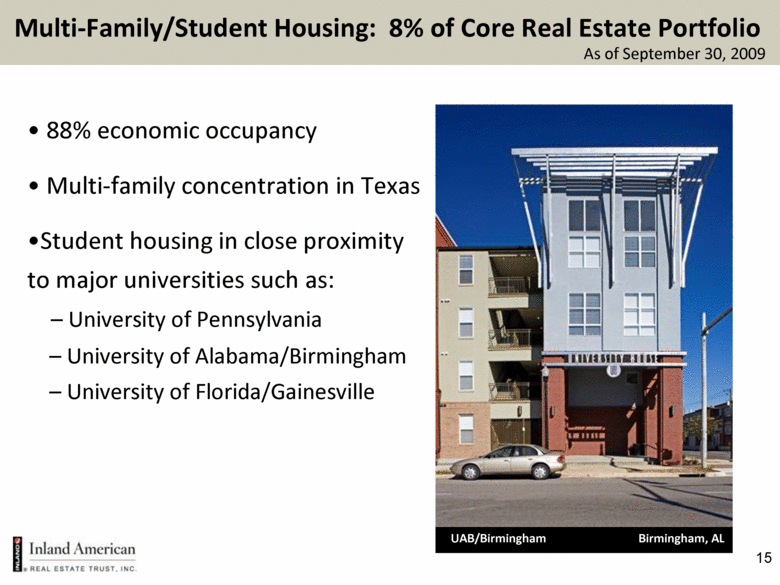
15 88% economic occupancy Multi-family concentration in Texas Student housing in close proximity to major universities such as: – University of Pennsylvania – University of Alabama/Birmingham – University of Florida/Gainesville UAB/Birmingham Birmingham, AL Multi-Family/Student Housing: 8% of Core Real Estate Portfolio As of September 30, 2009 |
|
|
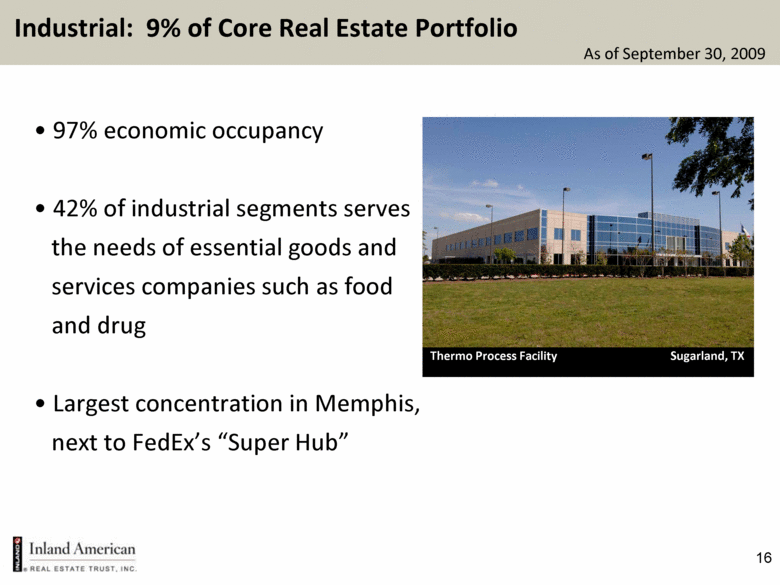
16 Thermo Process Facility Sugarland, TX Industrial: 9% of Core Real Estate Portfolio 97% economic occupancy 42% of industrial segments serves the needs of essential goods and services companies such as food and drug Largest concentration in Memphis, next to FedEx’s “Super Hub” As of September 30, 2009 |
|
|
17 Credit markets improving for certain asset classes (multi-family, community shopping center and “trophy” properties) Buying opportunities at attractive cap rates Continued strength of core real estate portfolio and strength in liquidity Stable and conservative balance sheet Looking Ahead |

