Attached files
| file | filename |
|---|---|
| 8-K - CTWS FORM 8-K DECEMBER 18, 2009 - CONNECTICUT WATER SERVICE INC / CT | form_8-k.htm |

Connecticut Water Service, Inc
December 2009

Forward Looking Statements
Except for the historical statements and
discussions, some statements contained in this
report constitute “forward looking statements”
within the meaning of Section 27A of the Securities
Act of 1933 and Section 21E of the Securities
Exchange Act of 1934. These forward looking
statements are based on current expectations and
rely on a number of assumptions concerning future
events, and are subject to a number of
uncertainties and other factors, many of which are
outside our control, that could cause actual results
to differ materially from such statements.

• Two Principal Subsidiaries
– Connecticut Water Company
– New England Water
Utility Services, Inc.
• NASDAQ GS:CTWS
Connecticut Water Service, Inc.

• Organized in 1956
• 54 Towns
• Serving 300,000 people
• 225 Employees
Connecticut Water Company

Customers by Class
Residential
90.4%
Commercial
6.4%
Fire Protection
1.9%
Public Authority
0.7%
Industrial
0.5%

Service Area Profile
• Suburban/Rural
• Median household income
2007 -2008 $65,644
(US $51,233)
• >500 community water
systems statewide
systems statewide
– 100 municipal/public authority
– > 75% serve less than 500 people
• Connecticut DPUC
– 5 Commissioners (1
vacancy)
• Jack W. Betkoski III
– Lead water commissioner
• Kevin DelGobbo
– DPUC Chairman
– Former state legislator
– Sponsor of WICA Bill
Connecticut DPUC

• 6 month regulatory lag
• Single tariff pricing
• WICA
• Regulatory strategy - engage & educate
Connecticut DPUC

Water Touches Everything
We Care About…
We Care About…

Water Touches Everything
We Care About…
We Care About…

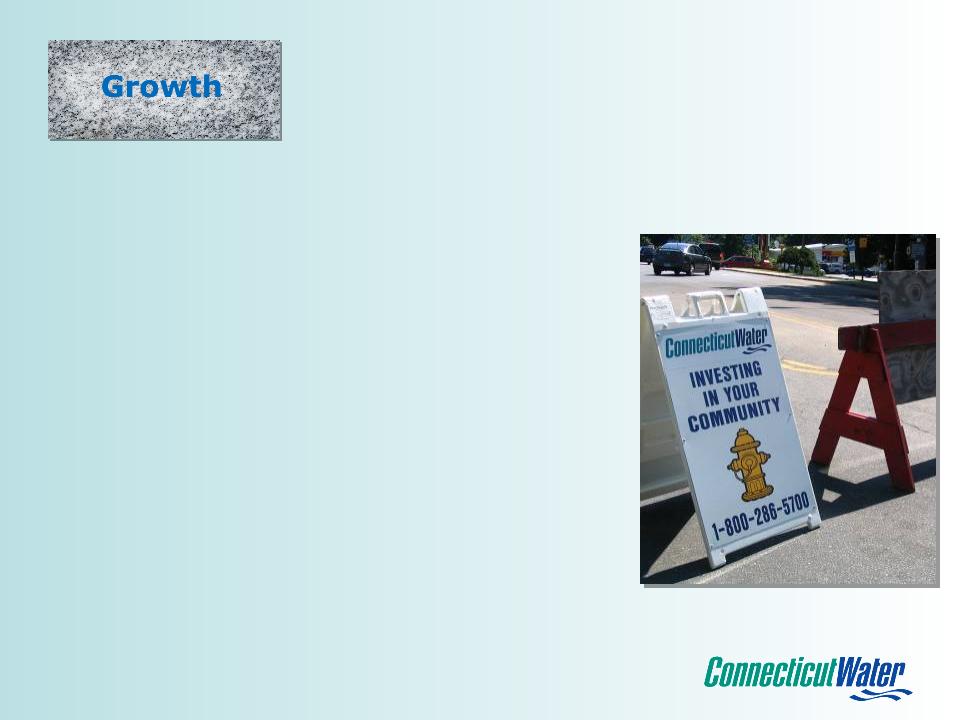
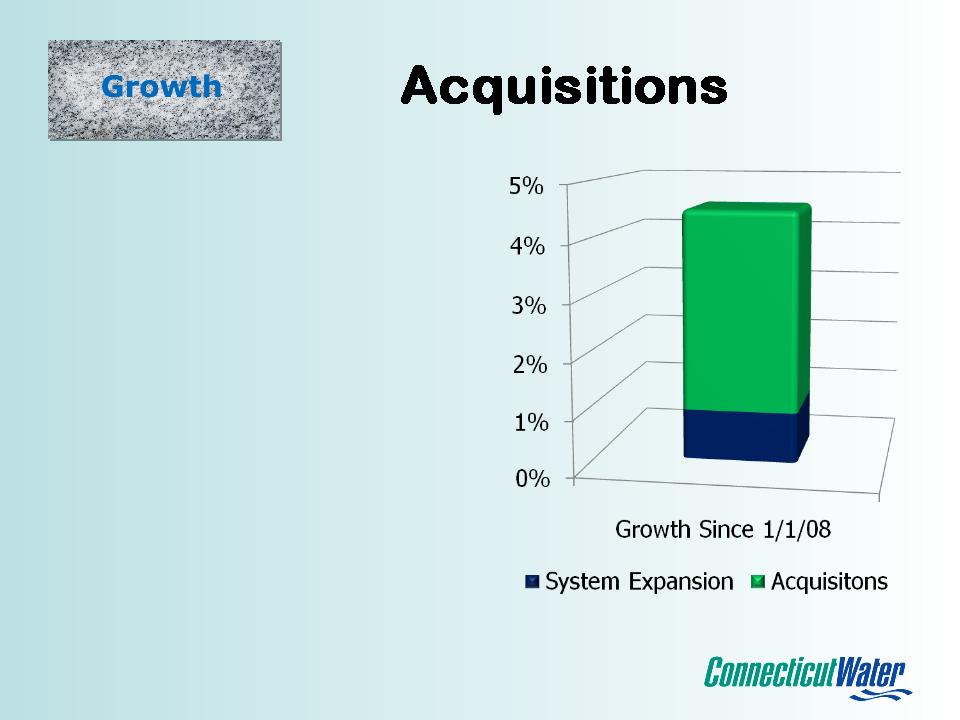
Our Strategy…

• Infrastructure Investment
• Acquisitions
• Utility Services
Infrastructure
• Traditional Rate Cases
– $10.9 Million (22%) - 2006
• 1st case
in 15 years
– $15.5 million in 2007 CapEx
• Next Filing January 2010
Focus -
• Conservation trends
• Infrastructure commitments
• O&M Drivers - pension, healthcare, chemicals

Capital Expenditures

WICA
(Water Infrastructure Conservation Adjustment)
(Water Infrastructure Conservation Adjustment)
• DSIC - type infrastructure
recovery mechanism
– 5% annual cap
– 7.5% maximum adjustment
• 1st Surcharge 0.95% (7/09)
• 2nd Surcharge (1/10)
• $13 - 15 million per year in pipeline replacement
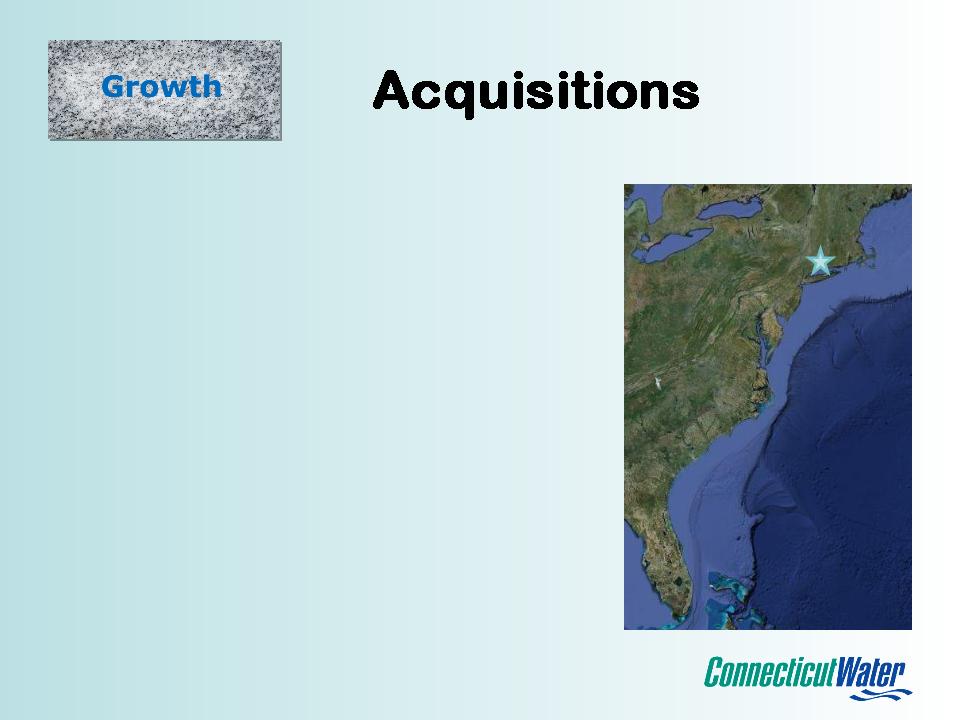
• Acquire Water &
Waste Water Systems
• Connecticut
• Atlantic Coast States
• Fair Regulation
• 60 Acquisitions in 20 years
• Madison, Connecticut - Legend Hills
– Solves quality issues for condominium community
and
two public schools
two public schools
– Equivalent of 120 residential customers
– 750 customers
– $1.5 million cash
– Closed January 2009
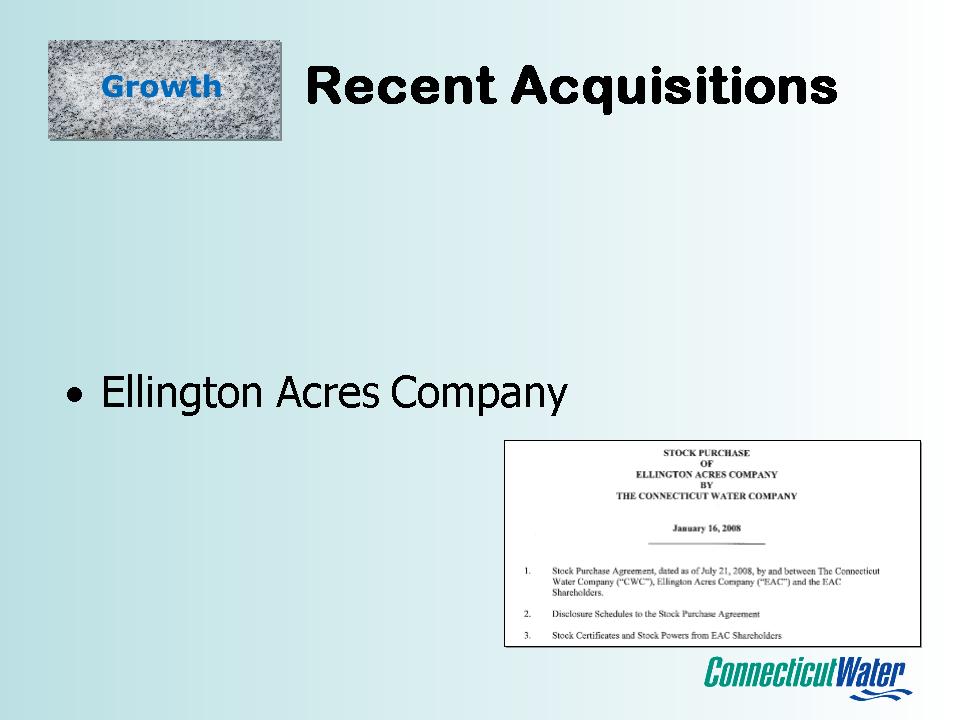
• Pending
– 2 systems in Connecticut
– 500 customers
– Less than $300,000

Utility Services
• 80 client contracts
– O&M
– Leak Detection
– Compliance Reporting
• University of Connecticut

Linebacker®
Service Line Protection
Service Line Protection
Renewal Rate
>90%
Percent of residential
customers enrolled
customers enrolled
2008
2007
2006
2005
2004
2009

• High Quality Water
• Responsive and Courteous Service
• Efficient & Effectively
Delivered
• Environmental Stewardship
• Customer Satisfaction!

• EPA Partnership Award - 10 Years
• Reminder calls on past due bills
• H2O Assistance Program
• Temporary Rate Reduction
• Personal Service
• Reverse 911 notification system
• World Class Customer Service -
>85% satisfaction 4 years in a row
Customer Service

• Corporate Responsibility Committee
• Watershed Forest Management Plan
• Water Supply Planning
– Forecast & Plan supply for next 50 years
• Adopting new technologies
– Hybrid vehicles, videoconferencing, energy
efficient pumps
efficient pumps
Stewardship

• Leadership is a privilege
• Trust based
• Team & service oriented
• Professionals
• “Satisfied Employees
Satisfy Customers”
• Employee Satisfaction
– Executive Compensation Metric
Employee Strategy

Shareholder Strategy
• Strong Dividend Yield
• High Earnings Quality
• Strong Balance Sheet

Performance
• Financial Performance
– 2008 Total Return ranked #2
among publicly traded water utilities
• Dividends
– Dividend yield 4%
– Paid since 1956
– 40 years of increasing dividends
– 2.2% increase in dividend in 2009

Performance
• High Earnings Quality
– 90% of Revenues, 92% of Earnings
from regulated business
• Strong Balance Sheet
– LTD 5.5% Embedded Cost
– 47/53 % Debt-Equity ratio
– Access to Capital Doubled
– S & P Rating “A”

Dividend Growth

Segment Earnings
2006 - 2009
2006 - 2009
EPS
$1.06
$1.12
$1.07
Performance