Attached files
Table of Contents
UNITED STATES
SECURITIES AND EXCHANGE COMMISSION
WASHINGTON, D.C. 20549
FORM 10-K
(Mark One)
| x | ANNUAL REPORT PURSUANT TO SECTION 13 OR 15(d) OF THE SECURITIES EXCHANGE ACT OF 1934 |
For the fiscal year ended October 2, 2009
OR
| ¨ | TRANSITION REPORT PURSUANT TO SECTION 13 OR 15(d) OF THE SECURITIES EXCHANGE ACT OF 1934 |
For the transition period from to
Commission file number 0-27248
LEARNING TREE INTERNATIONAL, INC.
(Exact name of registrant as specified in its charter)
| Delaware | 95-3133814 | |
| (State or other jurisdiction of incorporation or organization) |
(I.R.S. Employer Identification No.) | |
| 1805 Library Street Reston, VA |
20190 | |
| (Address of principal executive offices) | (Zip Code) |
(703) 709-9119
(Registrant’s telephone number, including area code)
Securities registered pursuant to Section 12(b) of the Act:
| Title of each class |
Name of each exchange on which registered | |
| Common Stock, $.0001 par value | the NASDAQ Global Market |
Securities registered pursuant to Section 12(g) of the Act: None
Indicate by check mark if the registrant is a well-known seasoned issuer, as defined in Rule 405 of the Securities Act. Yes ¨ No x
Indicate by check mark if the registrant is not required to file reports pursuant to Section 13 or Section 15(d) of the Act. Yes ¨ No x
Indicate by check mark whether the registrant (1) has filed all reports required to be filed by Section 13 or 15(d) of the Securities Exchange Act of 1934 during the preceding 12 months (or for such shorter period that the registrant was required to file such reports), and (2) has been subject to such filing requirements for the past 90 days: Yes x No ¨
Indicate by check mark whether the registrant has submitted electronically and posted on its corporate Web site, if any, every Interactive Data File required to be submitted and posted pursuant to Rule 405 of Regulation S-T (§232.405 of this chapter) during the preceding 12 months (or for such shorter period that the registrant was required to submit and post such files). Yes ¨ No ¨
Indicate by check mark if disclosure of delinquent filers pursuant to item 405 of Regulation S-K is not contained herein, and will not be contained, to the best of registrant’s knowledge, in definitive proxy or information statements incorporated by reference in Part III of this Form 10-K or any amendment to this Form 10-K. ¨
Indicate by check mark whether the registrant is a large accelerated filer, an accelerated filer, a non-accelerated filer, or a smaller reporting company. See the definitions of “large accelerated filer,” “accelerated filer” and “smaller reporting company” in Rule 12b-2 of the Exchange Act (Check one):
| Large accelerated filer |
¨ |
Accelerated filer | x | |||
| Non-accelerated filer |
¨ (do not check if a smaller reporting company) |
Smaller reporting company | ¨ |
Indicate by check mark whether the registrant is a shell company (as defined in Rule 12b-2 of the Act). Yes ¨ No x
The aggregate market value of the common stock, $.0001 par value, held by non-affiliates of the registrant, as of April 3, 2009 was $76,227,834. (Excludes 7,622,832 shares held by directors and officers of the registrant since such persons may be deemed to be affiliates.)
The number of shares of common stock, $.0001 par value, outstanding as of December 7, 2009, was 13,876,296 shares.
DOCUMENTS INCORPORATED BY REFERENCE
Portions of the definitive Proxy Statement of the registrant to be delivered to stockholders in connection with the 2010 Annual Meeting of Stockholders are incorporated by reference into Part III, Items 10, 11, 12, 13 and 14 of this Form 10-K.
Table of Contents
LEARNING TREE INTERNATIONAL, INC. AND SUBSIDIARIES
ANNUAL REPORT ON FORM 10-K
TABLE OF CONTENTS
2
Table of Contents
SPECIAL NOTE REGARDING FORWARD-LOOKING STATEMENTS
This Report contains forward-looking statements within the meaning of Section 27A of the Securities Act of 1933, as amended, and Section 21E of the Securities Exchange Act of 1934, as amended. You can find many (but not all) of these statements by looking for words such as “approximates,” “believes,” “expects,” “anticipates,” “estimates,” “intends,” “plans,” “would,” “may” or other similar expressions in this Report. Our forward-looking statements relate to future events or our future performance and include, but are not limited to, statements concerning our business strategy, future commercial revenues, market growth, capital requirements, new product introductions, expansion plans and the adequacy of our funding. Other statements contained in this report that are not historical facts are also forward-looking statements.
We claim the protection of the safe harbor contained in the Private Securities Litigation Reform Act of 1995. We caution investors that any forward-looking statements presented in this Report, or that we may make orally or in writing from time to time, are based on our beliefs, assumptions made by us and information currently available to us. Such statements are based on assumptions, and the actual outcome will be affected by known and unknown risks, trends, uncertainties and factors that are beyond our control or ability to predict. Although we believe that our assumptions are reasonable, they are not guarantees of future performance, and some will inevitably prove to be incorrect. As a result, our actual future results can be expected to differ from our expectations, and those differences may be material. Accordingly, investors should use caution in relying on forward-looking statements, which are based on known results and trends at the time they are made, to anticipate future results or trends.
Some of the risks and uncertainties that may cause our actual results, performance or achievements to differ materially from those expressed or implied by forward-looking statements include those related to the following:
| • | the timely development, introduction, and customer acceptance of our courses; |
| • | efficient delivery and scheduling of our courses; |
| • | technology development and new technology introduction; |
| • | competition; |
| • | international operations, including currency fluctuations; |
| • | attracting and retaining qualified personnel; |
| • | intellectual property, including having to defend potential infringement claims; |
| • | changing economic and market conditions; and |
| • | adverse weather conditions, strikes, acts of war or terrorism and other external events. |
For further discussion of these and other factors see “Management’s Discussion and Analysis of Financial Condition and Results of Operations” and “Risk Factors.”
This Report and all subsequent written and oral forward-looking statements attributable to us or any person acting on our behalf are expressly qualified in their entirety by the cautionary statements contained or referred to in this section. We do not undertake any obligation to release publicly any revisions to our forward-looking statements to reflect events or circumstances after the date of this Report.
3
Table of Contents
| Item 1. | BUSINESS |
Overview
Learning Tree International, Inc. is a leading worldwide vendor-independent provider to business and government organizations for the training and education of their managers and information technology (“IT”) professionals. Since our founding in 1974, we have provided high-quality training to nearly 2 million managers and IT professionals. In fiscal year 2009, we trained 76,552 course participants from more than 9,100 organizations worldwide, including large national and multinational companies, government organizations, and small and medium-size companies. As used in this Report (unless the context otherwise requires) “we”, “our”, and “us” refer to Learning Tree International, Inc. and its subsidiaries.
As of October 2, 2009, we offered a broad proprietary library of intensive instructor-led courses from two to five days in length, consisting of 219 different course titles representing 4,986 hours of training, including 143 IT course titles and 76 management course titles. Learning Tree courses provide education and training across a wide range of technical and management disciplines, including operating systems, databases, computer networks, computer and network security, web development, programming languages, software engineering, open source applications, project management, business skills, leadership and professional development.
We market and present our courses through locally staffed operations in the United States, the United Kingdom, France, Canada, Sweden and Japan, and generate approximately half of our revenues internationally. We coordinate, plan and deliver our courses at our own education centers, external hotel and conference facilities and customer sites worldwide. During fiscal year 2009, we presented courses in 54 countries. Additionally, in fiscal year 2009 we implemented our proprietary e-Learning platform, Learning Tree AnyWare™ (patent-pending), which allows individuals located anywhere to attend a live instructor-led class being conducted in a Learning Tree Education Center or at a customer location.
We use a well-defined systematic approach to develop and update the Learning Tree course library so as to provide training that is immediately relevant to course participants working in a broad range of applications and industries. After assessing market need, courses may be translated into French, Swedish and Japanese. Our proprietary course development process also allows us to customize our courses for delivery at our customers’ sites.
Business Strategy
Our long-term objective is to sustain and grow our position as a leading worldwide vendor-independent provider of training and education to managers and IT professionals and become the provider of choice for large national and multinational companies, small and medium-size companies and government organizations. To that end, we focus on providing our customers’ employees with the knowledge and skills they need to contribute to their employers’ key business objectives, and developing and maintaining long-term relationships with our customers and course participants.
Commitment to Quality Training. For the past 35 years, we have set the highest standards of excellence in educating and training managers and IT professionals throughout the world. We believe these standards have driven our long-term success. In fiscal year 2009, course participants rated Learning Tree instructors and courses at the highest levels in our history. These ratings reflect improvements that include our patented MagnaLearn™ instructional enhancement system and the latest up-to-date course equipment, ongoing revision and updating of our course materials, and continuing improvement of instructor skills and capabilities. Our AnyWare e-Learning platform extends the full range of Learning Tree features and standards to our remote participants, so that they enjoy the same experience and results as our in-class participants.
4
Table of Contents
High Quality Instructor Team. At October 2, 2009, we had 610 course instructors located around the world who are practicing professionals with expert subject knowledge and who average over 24 years of “hands-on, real world” experience. Learning Tree instructors teach an average of approximately 10 course events per year on an “as-needed” basis. During the rest of the year they work either as full-time employees or independent consultants for other companies. This “on-demand” structure enables us to quickly schedule additional courses anywhere in the world and to respond efficiently to our customers’ needs for management and IT skills training. In addition, because Learning Tree instructors generally spend the majority of their time working in industry settings, they provide our course participants with up-to-date, practical knowledge and skills in the latest technological and management developments, and provide us with unique access to a large pool of industry experts on management and IT trends throughout the world that is especially valuable in our decisions and development process for new course titles.
Our success depends on our ability to attract and retain highly skilled instructors. We use a highly systemized program in each of our local operating subsidiaries to identify, engage, train, coach, and evaluate our instructor team. Our instructors are highly loyal, as evidenced by our annual instructor retention rate, which exceeds 90%.
Broad Proprietary Course Library. We offer a broad, proprietary course library, which at October 2, 2009 totaled 219 instructor-led two- to five-day course titles comprising a total of 4,986 hours of classroom instruction covering a wide range of management and IT topics. Based on their sophistication and quality, all Learning Tree courses are recommended for one to two semester hours of college credit by the American Council on Education. We are a trusted continuing professional education (CPE) provider of the International Information Systems Security Certification Consortium (ISC)2. In addition, we are on the National Association of State Boards of Accountancy National Registry of CPE sponsors and are a Registered Education Provider of the Project Management Institute (PMI).
The following table itemizes the number of Learning Tree course titles by curriculum at October 2, 2009:
| Curriculum |
Number of Course Titles |
Total Hours of Training | ||
| Windows Systems and Exchange |
19 | 468 | ||
| Networking, Cisco Networks and PC Support |
17 | 438 | ||
| ITIL Certification |
17 | 408 | ||
| Visual Studio and .NET Development |
16 | 378 | ||
| Project Management |
18 | 372 | ||
| SQL Server |
16 | 372 | ||
| Security |
12 | 306 | ||
| Business Analysis |
14 | 282 | ||
| Web Development and XML |
13 | 282 | ||
| SharePoint, Access and Office |
12 | 276 | ||
| Communication and Time Management |
16 | 270 | ||
| RDBMS, and Oracle Databases |
10 | 270 | ||
| Java, C++ and Perl Programming |
11 | 264 | ||
| Software Engineering |
11 | 252 | ||
| UNIX and Linux |
7 | 162 | ||
| Management and Leadership |
8 | 150 | ||
| Apple Macintosh Systems and Support |
2 | 36 | ||
| Total |
219 | 4,986 | ||
As a leading vendor-independent provider of IT training, we design our courses to provide participants an unbiased perspective of software and hardware products and the ability to compare and integrate multiple platforms and technologies from various vendors in a single course. Drawing from the expertise of our
5
Table of Contents
international team of instructors, each course incorporates multiple points of view concerning IT applications used throughout the world. Our IT courses are designed to be highly interactive; most involve “hands-on” training on networked state-of-the-art workstations so that participants can practice and assimilate the skills being taught. Participants spend a significant portion of each hands-on course working on computer-based exercises and participating in group workshops and class interactions. Participants receive extensive printed course materials that facilitate learning and serve as a post-course reference tool.
Our management courses, while including core concepts and theory, focus heavily on providing practical skills, tools, and techniques that participants can apply immediately upon returning to their jobs. Participants work extensively in group exercises that provide the opportunity for them to practice applying the key concepts in real-world situations. These real-world scenarios are primarily delivered through RealityPlus™ , our proprietary performance-based management training platform. RealityPlus™ courses bring the real world to life in the classroom through the use of computer-based and rich-media simulations, supplemented with substantial amounts of hands-on exercises and group activities, facilitated by experts in their respective fields. RealityPlus™ prepares participants to apply the skills and knowledge they learn in our simulated projects, problems, and situations to the real-life management tasks they will perform in the workplace.
At October 2, 2009, we offered 143 titles in our IT curriculum, representing 65.3% of our entire course library, compared to 131 titles, or 70.8% at the end of fiscal year 2008. At the same date, we offered 76 titles in our management curriculum, representing 34.7% of our entire course library, compared to 54 titles, or 29.2% at the end of fiscal year 2008. Our spending on course development was $7.4 million in fiscal year 2009, $9.7 million in fiscal year 2008 and $8.6 million in fiscal year 2007.
To assist participants in their long-term professional development, we offer 25 Learning Tree Professional Certification programs, in which participants earn their certification by successfully completing four Learning Tree courses in a particular field, and demonstrating mastery by passing the examination for each course. Each Professional Certification Program is designed to teach all of the skills necessary to master a specific job function.
Over our 35-year history, we have developed and implemented a well-defined, systematic approach to rapidly develop, customize and update courses in the Learning Tree library and to translate our course content into multiple languages. Courses are organized into curricula that reflect general topics or disciplines. We continuously update and expand our course curriculum structure and course content and add new course titles to keep pace with the introduction of new technologies and to reflect the evolving training needs of our customers. To identify potential new courses for development, we incorporate feedback from the worldwide Learning Tree instructor team, course participants and customers, and from the development groups of leading IT vendors. In fiscal year 2009, we developed 50 new titles and retired 16 titles. We may or may not develop more titles than we retire in any period, and there can be no assurance that we will develop courses that keep pace with the introduction of new hardware, software and networking technologies or the need for key business skills training. We expect course development costs to vary in the future, primarily depending on the number of new titles we introduce in any period, as well as the overall size of the total course library we must maintain.
International Infrastructure and Logistics Capability. We meet customer demand for scheduling flexibility by delivering course events frequently and at multiple locations throughout the world. Our sophisticated infrastructure and logistics capability allow us to coordinate, plan and deliver Learning Tree courses at our education centers and external hotel and conference facilities worldwide. We also present standard or customized courses on demand at customer facilities whenever and wherever desired, with quality standards that are identical to those for courses presented in Learning Tree Education Centers. By using our team of 610 instructors, our course development and customization processes, our team of customer support specialists, our logistics team and our thousands of classroom computer workstations, we can rapidly and effectively deliver any Learning Tree course to any location in the world.
6
Table of Contents
In fiscal year 2009, we presented 6,082 course events at Learning Tree Education Centers and at third-party and customer sites in a total of 54 countries. We currently operate wholly-owned subsidiaries in the United States (since 1974), France (since 1977), the United Kingdom (since 1978), Canada (since 1985), Sweden (since 1986) and Japan (since 1989). Each subsidiary is staffed by local personnel responsible for the sale and delivery of courses in its local country as well as in other designated countries. Our international operations produced approximately half of our revenues in fiscal year 2009. See Note 9 of “Notes to Consolidated Financial Statements” for certain financial data regarding operating segments and geographic regions. See Item 1A, “Risk Factors” for a description of the risks associated with our international operations.
On an on-going basis, we evaluate the advisability of expansion or contraction of our operations both within cities and countries with existing Learning Tree Education Centers and in new cities or countries.
Long-Term Relationships with Global Customer Base. We have built long-standing relationships with our customer base of large national and multinational companies, small and medium-sized companies and government organizations throughout the world, and seek to build continuing relationships both with these employers and with the individual employees who participate in our courses. Our customers operate in a wide range of sectors, including finance, computer, communications, electronics, systems integration, aerospace, government and military, manufacturing, and energy. Every one of our 100 largest clients five years ago in fiscal year 2004 was still one of our clients five years later in fiscal year 2009. In fiscal year 2009, we provided training to 76,552 course participants and over 179 of our corporate and government customers purchased more than $100,000 of Learning Tree training. No customer accounted for 10% or more of our revenues in fiscal years 2009 or 2008.
In fiscal year 2009, we continued our efforts to develop enterprise-wide relationships with many of our large customers. These relationships take various forms, but generally involve a modest discount to our list price in exchange for becoming a preferred supplier, which enables us to provide training services to the individual employees with lower sales and administrative costs.
Backlog. Our sales backlog at November 27, 2009 was $27.0 million. This compares to a sales backlog of $31.5 million at November 28, 2008.
Multi-Tiered Sales and Marketing Organization. We employ a multi-tiered sales and marketing organization that integrates direct mail, electronic marketing, telemarketing and field sales to market and sell our course offerings to existing customers and to attract new customers.
As we have since our inception, we maintain a strong brand image for providing high-quality training for managers and IT professionals through the prominent use of our trademarks in our marketing and course materials. We market our courses primarily through direct mail and electronic mail to our proprietary database of approximately 2.8 million technology professionals and managers who have attended, inquired about, or sent a staff member to Learning Tree courses, and we also use direct mail to reach other managers and IT professionals on rented mailing lists. We also utilize targeted, personalized e-mails through our automated e-mail marketing system to advise prospective course participants of upcoming events. In addition, we use rented e-mail address lists to augment our own database. We also market our products and services over the Internet on our website (www.learningtree.com). (Information contained on our website is not part of this Annual Report on Form 10-K.)
We have a telemarketing sales team that consisted of approximately 101 telemarketers and related support staff at October 2, 2009. Our telemarketers call customer leads generated from direct mailings, e-mail marketing, website inquiries and other sales and marketing programs. In addition, our sales team follows up on customer inquiries, and works to identify key personnel at customers with the potential to become major customers. We use our proprietary automated POSTTM techniques to identify regions of our database that are profitable to mail, email and/or call, and those that are not.
7
Table of Contents
At October 2, 2009, we employed a field sales team of 57 direct field sales representatives and related support staff. Our direct sales force primarily focuses on selling training that is delivered on-site for our customers at their locations.
To remain successful, we must continue to expand our business with both existing and new customers. To encourage repeat purchases from existing customers, we offer three different multiple-course discount programs—Learning Tree “Training Passports”, Learning Tree 10-Day Passes, and Learning Tree “Training Vouchers”—and also provide Professional Certification Programs described earlier. We believe that in addition to generating revenues directly, these programs foster long-term relationships with participants and encourage participants to recommend Learning Tree courses to their colleagues.
Learning Tree Training Passports permit an individual Passport holder to attend up to a specified number of courses, generally three or four, during a one- to two-year period. List prices for Passports are significantly discounted from the list price of the equivalent number of individual courses. Learning Tree 10-Day Passes permit an individual Pass holder to attend up to 10 days of training during a twelve-month period and are priced slightly lower than the Passports. The Learning Tree Training Voucher program allows corporate customers to buy blocks of three or more Vouchers at a fixed discounted price, for future courses to be taken by any person in the customer organization over a six to twelve month period.
Markets and Competition
Instructor-Led Training. The management and IT training markets include outside third-party providers, as well as in-house training conducted by organizations for their own employees. Third-party providers of IT training include “vendor-dependent providers”, who deliver courses developed by the vendors of software and hardware technologies and who depend heavily on those vendors to market their courses. The IT training market also includes “vendor-independent providers”, such as us, who independently develop, market and deliver proprietary courses. In addition, third-party providers of management training include non-profit associations, as well as “for-profit providers”, who provide training largely as a professional development service, and both for-profit and not-for-profit “academic providers”, who offer courses that lead to accredited undergraduate or graduate degrees.
We are a for-profit vendor-independent provider of management education and IT training. Some competitors offer course titles and programs similar to ours at lower prices. In addition, some competitors have greater financial or other resources than we do.
Our main IT training competitors are vendor-dependent and include the IT hardware and software vendors themselves. Many hardware and software vendors supply training, sometimes bundled in the prices of their products. Other vendor-dependent providers are Authorized Technical Education Centers and Certified Technical Education Centers that deliver these vendors’ proprietary courses. Vendor-dependent providers may have, or claim, greater knowledge of upcoming developments in their products, and their certifications are widely recognized. We differentiate ourselves from vendor-dependent providers by maintaining a vendor-independent posture and providing cross-platform training solutions. By being vendor-independent, we can address both the strengths and the weaknesses of a product and teach IT professionals how to integrate one product with those of other vendors in a multi-vendor configuration. We leverage the expertise of Learning Tree instructors and authors, to ensure that we offer a level of expertise that matches or exceeds that of vendor-dependent providers while also providing a vendor-independent platform that provides meaningful product comparisons.
Our principal management education competitors include for-profit and not-for-profit post-secondary educational providers, as well as not-for-profit management associations and training companies who focus—as do we—on providing continuing professional development programs to government and commercial organizations and the employees of those organizations. We believe we differentiate ourselves from these competitors by adopting and implementing a more practical, results-oriented approach to management education than is typical in this market, as well as through our focus on performance-based learning, our patented
8
Table of Contents
MagnaLearn™ Instructional Enhancement Technology, and our RealityPlus™ simulation-centric educational methodology.
We believe that the majority of third-party providers—whether in management or IT—are smaller organizations that often provide training as one of several services or product lines. We differentiate ourselves from these providers based on our experience over more than three decades, the breadth and quality of our proprietary course library, our worldwide delivery capability, and the size, quality and experience of our instructor force.
Internal training departments generally provide companies with the most control over the method and content of training, enabling them to tailor programs to their specific needs. However, we believe that internal trainers find it difficult to keep pace with new technologies, lack the hands-on experience needed to teach the latest technological developments and lack the capacity to meet demand for training, and therefore most organizations must supplement their internal training resources with externally supplied training. This is particularly critical when dealing with new or emerging technologies. Additionally, internal training departments may not operate consistently on a worldwide basis, where we offer consistent management and IT courses, processes and quality around the globe.
Our customers are widely diversified across industries and geographies, with varying fiscal years including many whose fiscal years coincide with the U.S. Government September 30 budget year, many who are on the calendar year, and many whose fiscal years coincide with the UK and Canadian governments’ March 31 budget year. We also see seasonal variations in our business as a result of other factors, including summer vacations, especially in Europe. For a discussion of the seasonal effects on our business, see Item 1A “Risk Factors” and Item 7 “Management’s Discussion and Analysis of Financial Condition and Results of Operations.”
E-Learning and Blended Learning. Management and IT training are primarily delivered by classroom instructors, video, and technology-based training, including Internet-based e-learning and printed means. Based upon extensive research and use of pilot programs as well as our experience, we believe that instructor-led training will continue to fill the largest portion of the market because it provides the greatest foundation and ability for participants to learn, practice and receive feedback on their mastery of new knowledge and skills. Course participants value the personalized interaction and problem solving with their instructor and fellow participants, and the opportunity to get expert advice on the application of the course material to their own projects. Furthermore, instructor-led classroom training insulates course participants from workplace interruptions and accelerates their learning of new technologies. However, the use of technology-based IT training formats, such as Internet-based e-learning, appears to have gained some acceptance in the IT and management training and education market.
As noted last year, we have continued to investigate alternate, technology-based training formats and how they might effectively be integrated into our training programs. Based on extensive testing of alternate delivery formats and training program structures, we developed Learning Tree AnyWare™, our proprietary e-learning platform that integrates participants in remote locations into live class events in another location. Remote attendees use an ordinary Internet connection to connect to our patent-pending classroom interface. Once logged in, remote AnyWare class participants see and hear their instructor and classmates in real time, and view the instructor’s annotations on the two in-class MagnaLearn™ projection screens in real-time. They are able to participate in discussions, ask questions, work in breakout sessions, and complete the same hands-on exercises as their in-class counterparts. They gain the full benefit of our proprietary courseware, and achieve the same level of knowledge and skill transfer as in-class participants. Early customer feedback is that AnyWare is highly differentiated and significantly more effective in promoting job-related learning than other forms of e-Learning. Through AnyWare, we effectively apply technology to leverage the strengths of our classroom offerings.
9
Table of Contents
Employees
Our executive officers have extensive experience in the training and education industry with an average of nearly 16 years of experience with us and nearly 19 years of relevant industry experience.
On October 2, 2009, we had a total of 427 full-time equivalent employees, of whom 183 were employed outside the United States. We also utilized the services of 610 expert instructors to teach our courses on an “as-needed” basis. We consider our relations with our employees and our instructors to be good.
Intellectual Property Rights
Our course development process and course titles are proprietary, and we rely on a combination of copyright, trademark and trade secret laws, customer licensing agreements, employee and third-party nondisclosure agreements and other methods to protect those proprietary rights.
“LEARNING TREE”, “LEARNING TREE INTERNATIONAL”, the Learning Tree “Tree Design” logo, “LEARNING TREE INTERNATIONAL” and Design, “LEARNING TREE PROFESSIONAL CERTIFICATION” and Design, “LEARNING TREE ANYWARE BE THERE WITH ANYWARE” and Design, “LEARNING TREE ANYWARE”, “EDUCATION IS OUR BUSINESS”, “EDUCATION YOU CAN TRUST”, “WE BRING EDUCATION TO LIFE”, “PRODUCTIVITY THROUGH EDUCATION”, “REALITYPLUS” Design, “REALITYPLUS MANAGEMENT EDUCATION FOR THE REAL WORLD”, “TRAINING PASSPORT”, “TRAINING ADVANTAGE”, “ALUMNI GOLD”, “TRAINING YOU CAN TRUST”, “WE BRING LEARNING TO LIFE”, “WWW.LEARNINGTREE.COM”, “MAGNALEARN”, “VENDOR INDEPENDENT TRAINING YOU CAN TRUST”, “LEARNING TREE UNIVERSITY CONSORTIUM” and Design, “ON-SITE COURSES” and Design, “800-LRN-TREE”, and “800-THE-TREE” are among our trademarks and service marks. In addition to the trademarks and service marks, this Annual Report on Form 10-K also contains trademarks and trade names of other companies.
We own the copyright to all course materials we develop. Our copyrighted course materials are a significant differentiator of our services from those of our competitors.
Our MagnaLearn Instructional Enhancement System is covered by various United States and international patents. MagnaLearn™ gives Learning Tree instructors greater flexibility to customize and pace course presentations by allowing them to annotate, highlight and manipulate course materials on two independent projection screens, in real time. The system also provides automated feedback to our course development resources, allowing constant improvement of courses and the ability to consistently update courses immediately on a world-wide basis.
We have applied for patents related to our recently introduced AnyWare e-Learning platform.
We cannot be certain that our means of protecting our proprietary rights will be adequate or that our competitors will not independently develop similar course titles or delivery methods. If substantial unauthorized use of our products were to occur, our business and results of operations could be materially adversely impacted. We may also have to defend against claims that our current or future courses infringe on the proprietary rights of others. Defending and prosecuting these claims could have a material adverse effect on our operating results.
Regulatory Environment
We are paid directly by the employers of Learning Tree course participants and do not receive funding from any government student-aid or loan programs. As a result, we do not depend on government appropriations for programs and are generally exempt from the governmental regulation of public education providers. In contrast, providers of education to the public must comply with many laws and regulations of Federal, state and international governments. However, our results of operations could be affected by current or future licensing or regulatory requirements.
10
Table of Contents
Available Information
We make available on our website (www.learningtree.com), free of charge, our annual report on Form 10-K, quarterly reports on Form 10-Q, current reports on Form 8-K and all amendments to those reports filed or furnished pursuant to Section 13(a) or 15(d) of the Exchange Act, as soon as reasonably practicable after such material is electronically filed or furnished to the Securities and Exchange Commission. (Information contained on our website is not part of this Annual Report on Form 10-K.) Our Annual Report on Form 10-K may also be obtained free of charge by written request to the Chief Financial Officer, Learning Tree International, Inc., 1805 Library Street, Reston, VA 20190.
| Item 1A. | RISK FACTORS |
You should carefully consider the following discussion of various risks and uncertainties, keeping in mind that they are not the only ones that affect us. Additional risks that we do not presently consider material, or of which we are not currently aware, may also have an adverse impact on us.
Common Stock Price Fluctuations
Historically, our common stock price has fluctuated, and we expect fluctuations to continue in the future.
General Factors. We believe some of the reasons for past fluctuations in the price of our stock related to factors such as:
| • | announcements of developments related to our business; |
| • | announcements concerning new products or enhancements by us or our competitors; |
| • | developments in our relationships with our customers; |
| • | market perceptions of new means of delivering training, such as the Internet; |
| • | variations in our revenues, gross margins, earnings or other financial results; |
| • | fluctuations in general conditions in the economy, our market, and the markets served by our customers; and |
| • | introductions of new technologies both by our customers and technology vendors. |
In addition, prices in the stock market, particularly for technology-related stocks, have been volatile in recent years. In some cases, the fluctuations have been unrelated to the operating performance of the affected companies. As a result, the price of our common stock could fluctuate in the future without regard to our operating performance.
Future Sales of Our Common Stock. Sales of our common stock by our founders, officers, directors and employees could adversely and unpredictably affect the price of shares of our common stock. Additionally, the price could be affected even by the potential for sales by these persons. In addition to the 13,876,296 shares outstanding as of December 7, 2009, as of that date we are authorized to issue up to a total of 1,173,053 shares of common stock under our existing Stock Option and Equity Incentive Plan. We cannot predict the effect that any future sales of our common stock, or the potential for those sales, will have on our share price.
11
Table of Contents
Fluctuations in Operating Results
Historically, our operating results have fluctuated, and we expect fluctuations to continue in the future.
Fluctuations in our historical operating results have resulted from many factors, some of which are beyond our control. In the future, these or other factors could have a material adverse impact on our operating results and cause our stock price to decrease. For example:
Timing of Course Development, and Sales and Marketing Expenditures. We try to adjust our expenditures for course development and sales and marketing to maintain our long-term profitability, including our assessment of the potential to influence future customer demand, market conditions, and other factors. This may mean accepting reduced margins in poor economic periods, as we must commit to much of our spending before our attendees enroll in our courses. If revenues fall short of our expectations, we may not be able to adjust our expenditures quickly enough to compensate for lower than anticipated revenues. This could compound the impact of any revenue shortfall and further affect our operating results and the price of our common stock.
Course Scheduling and Marketing Activities. The timing and content of our courses and our marketing activities can affect the number of participants who attend our courses. Some of the activities that can contribute to fluctuations in our operating results include:
| • | the frequency of our course events; |
| • | the number of weeks during which our courses can be conducted in a quarter; |
| • | the timing, timely delivery, frequency and size of, and the response to, our direct mail marketing and advertising campaigns; |
| • | the timing of introduction of new course titles; |
| • | the average length of courses, based on the current mix of course titles, which affects the average revenue per attendee; and |
| • | the mix between course events held at customer locations and course events held in our education centers and hotels due to differing gross profit margins. |
Seasonal Factors. Our quarterly revenues and income fluctuate due to the seasonal spending patterns of our customers, which are affected by factors such as:
| • | cyclic or one-time budgetary considerations; |
| • | factors specific to their business or industry; and |
| • | weather, holiday and vacation considerations. |
Use of Accounting Estimates. The preparation of our financial statements in conformity with Generally Accepted Accounting Principles requires us to make estimates and assumptions in calculating our financial results. As one example, we currently offer our customers a multiple-course sales discount referred to as a Training Passport, which allows an individual passport holder to attend up to a specified number of Learning Tree courses over a one to two-year period for a fixed price. For a Training Passport, the amount of revenue we recognize for each attendance in one of our courses is based upon the selling price of the Training Passport, the list price of the course taken, the average list price of all courses taken, and our estimate of the average number of courses a Passport holder will actually attend. After expiration of a Training Passport, we record the difference, if any, between the revenue previously recognized and the Training Passport selling price. For example, if a Passport holder attends more courses than we had estimated, we would make a negative adjustment to revenues at the expiration of that Passport. We base our estimate of the average number of course events that a Training Passport holder will attend on historical trends. However, these historical trends may not accurately predict the actual number of course events that a Training Passport holder will attend in the future. If average Training Passport attendance rates were to increase, for example, we would have to make negative adjustments to
12
Table of Contents
our revenue, which could be significant. For a summary of some of our key accounting estimates, please see our “Critical Accounting Estimates and Policies” in Management’s Discussion and Analysis.
Changing Regulation of Corporate Governance and Public Disclosure. Changing laws, regulations and standards relating to corporate governance and public disclosure can result in uncertainty regarding compliance matters and higher costs incurred with ongoing revisions to disclosure and governance practices. As a result, our efforts to comply with evolving laws, regulations and standards have resulted in, and are likely to continue to result in, increased general and administrative expenses and a diversion of management time and attention from revenue-generating activities to compliance activities. If our efforts to comply with new or changed laws, regulations and standards differ from the activities intended by regulatory or governing bodies due to ambiguities related to practice, our reputation may be harmed.
Introductions and Adoption of New Technology. Our customers tend to increase their training at times when new technology is being introduced. During periods when fewer new technologies are being introduced, demand for our training courses may decrease, which could have a material adverse effect on our operating results and stock price.
Other Factors. Other factors that may affect our operating results include:
| • | competitive forces within our current and anticipated future markets; |
| • | our ability to attract customers and meet their expectations; |
| • | currency fluctuations and other risks inherent in international operations; |
| • | general economic conditions; |
| • | differences in the timing of our spending on the marketing of our courses, as well as the timing of our spending on the development of our courses and other areas; and |
| • | excess capacity and/or unused space in our education centers and/or administrative office facilities, and our ability to sublease or find other uses for it. |
All or any of these and similar factors could cause our operating results to differ substantially from the expectations of public market analysts and investors, which would likely have a material adverse impact on our stock price.
Risks Associated with Technology Changes
If we do not adequately anticipate or respond to changes in technology, it could have a material adverse effect on our operating results and stock price.
Changes in technology can affect our business in at least two principal ways. First, we must anticipate and keep pace with the introduction of new hardware, software and other information technologies and develop courses that effectively train customers in the technologies they use now and will use in the future. Second, we must adapt to changes in the technologies by which we can deliver training to our customers’ employees. As a result of technology developments, we may have to make substantial and unanticipated expenditures to develop new course titles, buy new equipment, or invest in further course development software and processes to deliver our courses. Further, we may not adequately anticipate or respond successfully to technology changes for many reasons, including misjudging the impact of technology changes, as well as financial, technological or other constraints. A lack of adequate response on our part to changes in information technology platforms, customer preferences or software technology could have a material adverse impact on our operating results and stock price.
13
Table of Contents
Competition
If our customers decide that they prefer training offered by new or existing competitors, it could have a material adverse effect on our operating results and stock price.
The IT and management training markets are highly fragmented, with low barriers to entry. No single competitor holds a dominant market share. We face intense competition from both established entities and new entries in the market. Our primary competitors include:
| • | internal training departments within our current and potential customers; |
| • | computer hardware and software vendors and their Authorized Training and Education Center partners; |
| • | independent education and training companies; |
| • | academic providers; and |
| • | software systems integrators. |
Some of our competitors offer course titles and programs similar to ours at lower prices. In addition, some competitors have greater financial and other resources than us. Additionally, hardware and software vendors, as well as software systems integrators, may combine IT education and training with sales of their products or other services, which could allow them to offer training at lower prices than we do. Furthermore, future consolidation of IT vendors or training companies could have a material impact on our future operations.
The risk of outsourcing of corporate IT administration and software development overseas to countries or firms not currently served by us could have a material adverse impact on our future operations.
Although instructor-led classroom training continues to dominate the worldwide IT and management training markets, technology-based education and training formats, such as Internet-based distance learning, have gained some acceptance. Accordingly, our future results may also depend on the extent to which the market will continue to accept instructor-led IT and management training and on our ability to develop and market instructor-led courses that compete effectively against technology-based courses offered by our competitors.
Risks Associated with International Operations
Approximately half of our annual revenue is generated by courses conducted outside the United States. Therefore, if we do not adequately anticipate and respond to the risks inherent in international operations, it could have a material adverse effect on our operating results and stock price.
Foreign Currency Fluctuations. Our consolidated financial statements are prepared in U.S. Dollars, while the operations of our foreign subsidiaries are conducted in their respective local currencies. Consequently, changes in exchange rates can unpredictably and adversely affect our consolidated operating results and could result in exchange losses. We do not hedge against the risks associated with fluctuations in exchange rates. Even if we were to use hedging techniques in the future, we might not be able to eliminate or reduce the effects of currency fluctuations. Thus, exchange rate fluctuations could have a material adverse impact on our operating results and stock price.
Other Risks Associated with International Operations. Additionally, our results of operations may be adversely affected by other international risks, such as:
| • | difficulties in translating our courses into foreign languages; |
| • | international political and economic conditions; |
| • | changes in government regulation in various countries; |
| • | trade barriers; |
| • | difficulty in staffing our foreign offices, and in training and retaining foreign instructors; |
14
Table of Contents
| • | adverse income tax and transfer pricing consequences; and |
| • | potential costs associated with expansion into new territories. |
We expect that international revenues will continue to be a significant portion of our total revenues. A lack of anticipation and response to the risks associated with international operations could have a material adverse effect on our operating results and stock price.
Dependence on Key Personnel
If we are unable to recruit and retain qualified personnel, it could have a material adverse effect on our operating results and stock price.
Our success depends in large part on the continued services of our executive officers, our senior managers and other key personnel. The loss of these people, especially without advance notice, could have a material adverse impact on our results of operations. It is also very important that we attract and retain highly skilled personnel, including course instructors, to accommodate growth, new course titles and to replace personnel who leave. Competition for qualified personnel can be intense, especially in information technology industries and/or in certain geographic areas, and there are a limited number of people with the requisite knowledge and experience. Under these conditions, we could be unable to recruit, train and retain instructors and employees. If we cannot attract and retain qualified personnel, it could have a material adverse impact on our operating results and stock price.
Risks Associated with Intellectual Property
If substantial unauthorized use of our courses occurs or if we must defend against infringement claims, it could have a material adverse effect on our operating results and stock price.
Our success depends in part on our ability to protect our intellectual property and confidential information. Our course development process and course titles are proprietary and we rely primarily on a combination of statutory and common law copyright, trademark and trade secret laws, customer licensing agreements, employee and third-party nondisclosure agreements and other methods to protect those proprietary rights. Our course materials generally do not include any mechanisms to prohibit or prevent unauthorized use. As a result, someone could copy or otherwise obtain and use our course materials without authorization, either for educational use or to develop competing courses. In addition, we operate in countries that do not provide protection of proprietary rights to the same extent as the United States. Finally, our intellectual property rights will not prevent competitors from independently developing similar course titles or delivery methods. If substantial unauthorized use of our products were to occur, our results of operations and price of our common stock could be materially adversely impacted.
We may also have to defend against claims that our current or future courses infringe on the proprietary rights of others. If such a claim succeeded, we might have to change or eliminate courses, and could be required to pay damages or royalties. In addition, litigation over intellectual property rights, whether brought by us or by someone else, could be time-consuming and expensive, even if we were ultimately to succeed. Accordingly, defending and prosecuting these claims could have a material adverse effect on our operating results and stock price.
Risks Associated with Laws and Regulations
Laws and regulations can affect our operations and may limit our ability to operate in certain states.
Providers of educational programs to the public must comply with many laws and regulations of Federal, state and international governments. Generally, we are exempt from this type of regulation because we contract with the employer of the participants in our courses, and we do not participate in any Federal or state student aid
15
Table of Contents
or loan programs. However, state laws and regulations targeting educational providers could affect our operations in the future and could limit our ability to obtain authorization to operate in certain states. If we were found in violation of a state’s current or future licensing or regulatory requirements, we could be subject to civil or criminal sanctions, including monetary penalties, and we could also be barred from providing educational services in that state. In addition, laws and regulatory decisions in many areas other than education could also adversely affect our operations. Complying with current or future legal requirements could have a material adverse effect on our operating results and stock price.
We are subject to tax audits by state, federal and foreign jurisdictions. Such audits are to be expected and may result in adjustments as a result of the accretion of tax jurisdiction interpretations and changes in operational practices. Any such audits may result in additional taxes being assessed or in the refund of taxes previously paid. Such changes could have a material adverse effect on our operating results and stock price.
Control by Management
Senior personnel, especially our founders, own a majority of our outstanding shares and may therefore have significant influence over our policies and affairs and may be in a position to determine the outcome of corporate actions.
As of December 7, 2009, our executive officers and directors collectively beneficially own approximately 55.2% of our outstanding shares of common stock. As of that date, Mr. Garen, our Chairman of the Board of Directors, beneficially owned approximately 24.4% of our outstanding shares of common stock. Dr. Collins, our Vice Chairman of the Board of Directors, beneficially owned approximately 30.2% of our outstanding shares of common stock as of December 7, 2009. Consequently, senior personnel, and Mr. Garen and Dr. Collins in particular, have significant influence over, and may control, our policies and affairs and may be in a position to determine the outcome of corporate actions requiring stockholder approval. These may include, for example, the election of directors, the adoption of amendments to our corporate documents and the approval of mergers and sales of our assets.
Risks Associated with Possible Acquisitions and Other Strategic Transactions
If we cannot successfully implement any future acquisitions or other strategic transactions, it could have a material adverse effect on our operating results and stock price.
On occasion, we evaluate business opportunities and other strategic transactions that appear to fit within our overall business strategy. We could decide to pursue one or more of these opportunities by acquisition or internal development. Acquisitions and other strategic transactions involve many risks, including:
| • | the difficulty of integrating acquired technologies, operations and personnel with our existing operations; |
| • | the difficulty of developing and marketing new products and services; |
| • | the diversion of our management’s attention as a result of evaluating, negotiating and integrating acquisitions or new business ventures; |
| • | our exposure to unforeseen liabilities of acquired companies; and |
| • | the loss of key employees of an acquired operation. |
In addition, an acquisition or other strategic transactions could adversely impact cash flows and/or operating results, and dilute shareholder interests, for many reasons, including:
| • | charges to our income to reflect the amortization of acquired intangible assets; |
| • | write-offs for the impairment of the carrying value of goodwill or other intangible assets; |
16
Table of Contents
| • | interest costs and debt service requirements for any debt incurred in connection with an acquisition or new business venture; and |
| • | any issuance of securities in connection with an acquisition or other strategic transactions that dilutes or lessens the rights of our current common stockholders. |
We have had no significant experience in executing and implementing acquisitions. Although we have implemented other strategic transactions, those ventures have not always been successful, and we may not succeed in the future. The risks associated with acquisitions and other strategic transactions could have a material adverse impact on our operating results and stock price.
Risks Associated with Changing Economic Conditions
General domestic and international economic conditions could have a material adverse effect on our operating results and common stock price. As a result of the current economic downturn and macro-economic challenges currently affecting the economy of the United States and other parts of the world, some of our customers may choose to delay or postpone purchases of courses from us until the economy and their businesses strengthen.
Domestic and/or International Economic Downturns. A significant part of our revenues comes from Fortune 1000-level companies, their international equivalents, and government organizations. During weak economic conditions, our growth rate generally slows, and in downturns as severe as that of the past year, sales diminish. If the domestic and/or international economy were to continue to weaken, the demand for our services could decline, which could have a material adverse effect on our operating results and stock price.
Industry-Specific Slowdowns. Our customers generally operate in the finance, computer, communications, electronics, systems integration, aerospace, government and military, manufacturing, and energy sectors. If one or more of these industries experiences a slowdown, it could have a material adverse effect on our operating results and stock price.
Globalization Issues. Our operations are concentrated in Europe and North America, which have traditionally been the centers of IT development and implementation. In recent years, there has been increasing IT activity in other parts of the world, such as China and India. If this trend adversely affects IT jobs in regions in which we have our principal operations, it could have a material adverse effect on our operating results and stock price.
Anti-Takeover Provisions
Certain provisions of our Restated Certificate of Incorporation, our Bylaws and Delaware law could adversely impact the interests of our stockholders.
Certain provisions of our Restated Certificate of Incorporation, our Bylaws and Delaware law could, together or separately, discourage, delay or prevent a third party from acquiring us, even if doing so might benefit our stockholders. These provisions may also affect the price investors would receive for their shares of our common stock. Some examples of these provisions in our Restated Certificate of Incorporation and Bylaws are:
| • | the division of our board of directors into three classes; |
| • | the right of our board of directors to issue preferred stock with rights and privileges that are senior to the common stock, without prior stockholder approval; |
| • | certain limitations of the rights of stockholders to call a special meeting of stockholders; and |
| • | the prohibition of stockholder actions by written consent. |
17
Table of Contents
Natural Disasters, External Strikes, Acts of War or Terrorism and Other External Events
Since our founding in 1974, various natural disasters, external labor disruptions, acts of war or terrorism and other adverse external factors have from time to time impaired our ability to conduct our business, resulted in the loss of revenue or otherwise affected our operating results. When these or other external events occur in the future, they could have a material adverse effect on our operating results and stock price.
Natural Disasters. Natural disasters can affect our business. For example, severe weather has at times prevented our course participants from traveling to our courses. In these situations, we try to transfer the course participants to later courses, but we may still lose some potential revenue. Similarly, both weather and floods have also disrupted the printing and transportation of the catalogs we use in our direct mail campaigns. The resulting delays in our mailings may reduce or delay the revenue we realize from courses listed in those catalogs.
External Strikes. We have had to react to postal, transportation, and other strikes in the countries where we operate. Postal strikes delay or reduce the delivery of our direct mail marketing materials, which may result in reduced enrollments in upcoming course events. Transportation strikes can make it difficult for our course participants or our instructors to reach course facilities. Although we try to employ strategies to mitigate the impact of external strikes, these alternative means are rarely completely effective and generally increase our costs, which could adversely affect our operating results.
Acts of War or Terrorism. Threats or acts of war or terrorism can adversely affect our business. The terrorist attacks in the United States on September 11, 2001, the declaration of war by the United States against terrorism, and continuing hostilities in the Middle East have created significant instability and uncertainty in the world. These and future events may have a material adverse effect on world financial markets, including financial markets in the United States. In addition, threats or acts of war or terrorism can cause course participants to be reluctant regarding or prevented from traveling to our course facilities, thereby resulting in lower attendance rates. Additionally, our direct mail marketing materials may be delayed or disrupted from reaching our customers; and suppliers and service providers may be unable to provide required services or materials. These impacts could happen after we have committed to all the costs of our course, so that we would be unable to quickly adjust our cost structure to reflect the changes in revenues caused by these events, which could materially and adversely affect our operating results and stock price.
Other External Factors. Other factors outside our control can affect our operations, including those related to our suppliers and service providers. For example, disruptions of telephone networks can prevent customers from enrolling in our courses; disruptions in transportation services can prevent customers from reaching our facilities, and power outages can prevent us from delivering courses. Similarly, if commodities (for example, the paper used in the printing of our catalogs) that we or our customers need become scarce or more expensive, our operating results may be adversely affected.
| Item 1B. | UNRESOLVED STAFF COMMENTS |
None.
| Item 2. | PROPERTIES |
Our headquarters are located at 1805 Library Street, Reston, VA 20190.
We own a 38,500 square foot office facility in Reston, VA, which is occupied by the sales, administrative and operations groups of our U.S. subsidiary. We lease all of our other offices and education center classroom facilities. The leases expire at various dates over the next 10 years. We also present our courses at rented hotel and conference facilities and customer sites. We typically provide all of the software, hardware and networking systems required for use in our courses.
We believe that our facilities are adequate and suitable for our needs. In general, at current attendee levels, we have some excess capacity at most of our education centers. We have been seeking to deal with excess capacity by reducing the size of some of our facilities and by renting excess classrooms.
18
Table of Contents
We present our classroom courses at Learning Tree Education Centers in Atlanta, Chicago, Los Angeles, New York City, the Washington, D.C. area (three locations), Ottawa, Toronto, London, Paris, Stockholm, and Tokyo as well as in other rented facilities in those and other cities worldwide as well as at our clients’ facilities.
The following table contains certain information regarding Learning Tree Education Centers and offices at October 2, 2009:
| Location (Metropolitan Area) |
Function(s) |
Number of Classrooms |
Total Area in Square Feet |
||||
| Atlanta, GA |
Education Center | 9 | 16,903 | ||||
| Chicago, IL |
Education Center | 5 | 11,017 | ||||
| Los Angeles, CA |
Education Center & Office | 5 | 34,374 | ||||
| New York, NY |
Education Center | 19 | 41,724 | ||||
| Washington, DC area |
Education Centers (3 sites) | 37 | 87,958 | ||||
| Reston, VA |
Offices (3 sites) | — | 45,959 | (a) | |||
| Powell, OH |
Office | — | 400 | ||||
| Kennett Square, PA |
Office | — | 440 | ||||
| Paris, France |
Education Center & Office | 19 | 36,813 | ||||
| London, England |
Education Center | 34 | 56,481 | (b) | |||
| Leatherhead, England |
Office | — | 23,209 | (c) | |||
| Ottawa, Canada |
Education Center & Office | 6 | 20,006 | ||||
| Toronto, Canada |
Education Center | 10 | 17,207 | ||||
| Stockholm, Sweden |
Education Center & Office | 12 | 27,790 | ||||
| Tokyo, Japan |
Education Center & Office | 2 | 3,096 | ||||
| 158 | 423,377 | ||||||
| (a) | Includes a 38,500 square foot office facility, which we own; all other facilities are leased. |
| (b) | Excludes 55,519 square feet that we sublease to various subtenants. Subleases end at various dates prior to the end of our prime lease. See Note 4 of “Notes to Consolidated Financial Statements” for details on subleases. Some subtenants may opt for early termination based on their sublease agreements. |
| (c) | Excludes 7,000 square feet that we sublease to a single subtenant. Sublease ends co-terminus with our prime lease which ends in December 2010. |
| Item 3. | LEGAL PROCEEDINGS |
We are not involved in any pending or threatened legal proceedings, other than routine legal proceedings and claims incidental to our business, that we believe could reasonably be expected to have a material adverse effect on our financial condition or results of operations.
Beginning in 1996, we sold Training Passports and Vouchers to the United States Government under terms similar to those sold to our commercial customers. We have previously disclosed the existence of a claim by the U.S. Government relating to the expiration and prepayment terms of our passport and voucher programs for periods prior to fiscal year 2009. The Government has asserted that the expiration and prepayment terms of those programs in prior years violated the terms of our GSA contract, and that our acceptance of payment under these terms violates the civil False Claims Act, 31 U.S.C. 3729. We do not agree, but in continuing discussions with the Government have offered to settle the dispute by making a cash payment to the Government. In the fourth quarter of fiscal year 2009, we accrued $4.2 million for the estimated cost of such a settlement. Although the positions of the parties are close, there can be no assurance that agreement on a settlement of the matter will be reached, and the ultimate payment could be more or less than the amount reserved. In particular, in the event that the Government were to file suit on this matter, under certain legal theories the Government could seek an award of up to treble damages and other penalties.
| Item 4. | SUBMISSION OF MATTERS TO A VOTE OF SECURITY HOLDERS |
No matters were submitted to a vote of security holders during the fourth quarter of fiscal year 2009 through the solicitation of proxies or otherwise.
19
Table of Contents
| Item 5. | MARKET FOR REGISTRANT’S COMMON EQUITY, RELATED STOCKHOLDER MATTERS AND ISSUER PURCHASES OF EQUITY SECURITIES |
Price Range of Common Stock
Our Common Stock trades on the NASDAQ Stock Market under the symbol “LTRE.” The following table sets forth, for the periods indicated, the range of high and low sales prices for our Common Stock on the NASDAQ Stock Market:
| High | Low | |||||
| Fiscal Year 2008 |
||||||
| First Quarter |
$ | 27.19 | $ | 17.96 | ||
| Second Quarter |
22.96 | 12.43 | ||||
| Third Quarter |
18.12 | 14.02 | ||||
| Fourth Quarter |
17.29 | 10.50 | ||||
| Fiscal Year 2009 |
||||||
| First Quarter |
$ | 12.78 | $ | 7.52 | ||
| Second Quarter |
10.25 | 6.20 | ||||
| Third Quarter |
11.09 | 8.10 | ||||
| Fourth Quarter |
11.58 | 9.63 | ||||
On December 4, 2009, the number of holders of our Common Stock was approximately 1,416, consisting of 54 record holders and approximately 1,362 stockholders whose stock is held by a bank, broker or other nominee.
Dividends
To date, we have not paid any cash dividends on our Common Stock and have no current plans to do so in the foreseeable future. The declaration and payment of dividends are subject to the discretion of our Board of Directors and to compliance with applicable laws. Any determination as to the payment of dividends in the future will depend upon, among other things, general business conditions, the effect such payment would have on our financial condition and other factors that our Board of Directors may in the future consider to be relevant.
Sales of Unregistered Securities.
During fiscal year 2009, we did not make any unregistered sales of our securities.
Purchases of Equity Securities
The following table summarizes information regarding shares purchased during the three months ended October 2, 2009.
| Period |
Total Number of Shares Purchased |
Average Price Paid per Share | |||
| July 4, 2009 – July 31, 2009 |
117,310 | $ | 10.33 | ||
| August 1, 2009 – August 31, 2009 |
151,117 | $ | 11.06 | ||
| September 1, 2009 – October 2, 2009 |
114,071 | $ | 11.18 | ||
| Total |
382,498 | $ | 10.87 | ||
20
Table of Contents
All Common Stock repurchases were made in open-market transactions and not pursuant to any publicly announced plans. We may choose to make additional purchases of our Common Stock in the future, but have no commitment to do so.
Securities Authorized for Issuance under Equity Compensation Plans
| Plan Category |
Number of Securities to be Issued Upon Exercise of Outstanding Options, Warrants and Rights |
Weighted-Average Exercise Price of Outstanding Options, Warrants and Rights |
Number of Securities Remaining Available for Future Issuance Under Equity Compensation Plan (Excluding Securities Reflected in the first Column) | ||||
| Equity compensation plan approved by security holders |
391,949 | $ | 13.32 | 781,104 | |||
| Equity compensation plan not approved by security holders |
— | — | — | ||||
| Total |
391,949 | $ | 13.32 | 781,104 | |||
For a description of the other material features of our equity compensation plan, see Note 6 of “Notes to Consolidated Financial Statements.”
21
Table of Contents
COMPANY STOCK PERFORMANCE
The information contained below shall not be deemed incorporated by reference in any filing under the Securities Act of 1933, as amended, or the Securities Exchange Act of 1934, as amended (the “Exchange Act”), whether made before or after the date hereof and irrespective of any general incorporation language in any such filing (except to the extent that we specifically incorporate this information by reference) and shall not otherwise be deemed “soliciting material” or “filed” with the Securities and Exchange Commission or subject to Regulation 14A or 14C, or to the liabilities of Section 18 of the Exchange Act (except to the extent that we specifically incorporate this information by reference).
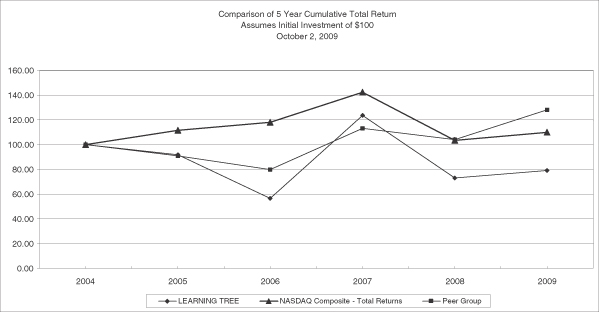
The following graph compares the cumulative total stockholder return on our Common Stock from October 1, 2004 to October 2, 2009 with the cumulative total return on the NASDAQ Stock Market Composite Index and an appropriate “peer group” index (assuming the investment of $100 in our Common Stock and in each of the indexes on October 1, 2004.)
| Fiscal Year Ended | ||||||||||||||||||
| October 1, 2004 |
September 30, 2005 |
September 29, 2006 |
September 28, 2007 |
October 3, 2008 |
October 2, 2009 | |||||||||||||
| Learning Tree International, Inc. |
||||||||||||||||||
| Common Stock |
$ | 100 | $ | 94 | $ | 58 | $ | 126 | $ | 88 | $ | 81 | ||||||
| NASDAQ Stock Exchange |
||||||||||||||||||
| Composite Index |
$ | 100 | $ | 114 | $ | 121 | $ | 146 | $ | 114 | $ | 117 | ||||||
| Peer Group Index (1) |
$ | 100 | $ | 94 | $ | 83 | $ | 117 | $ | 113 | $ | 137 | ||||||
| Peer Group + Learning Tree International, Inc |
$ | 100 | $ | 94 | $ | 82 | $ | 117 | $ | 112 | $ | 136 | ||||||
Data and graph provided by Zacks Investment Research, Inc. Copyright© 2009, NASDAQ, Inc. All rights reserved. Used with permission.
| (1) | Peer Group index includes: Apollo Group, Inc.; Skillsoft Public Limited Company; DeVry, Inc.; and, ITT Education Services, Inc. The returns of each issuer within the Peer Group Index have been weighted according to such issuer’s respective stock market capitalization at the beginning of the period presented. |
22
Table of Contents
| Item 6. | SELECTED FINANCIAL DATA |
The following selected consolidated financial data is qualified in its entirety by reference to, and should be read in conjunction with, the audited consolidated financial statements and notes thereto and other financial data included elsewhere in this Annual Report on Form 10-K. The statement of operations data set forth below for the years ended September 28, 2007, October 3, 2008 and October 2, 2009, and the balance sheet data as of October 3, 2008 and October 2, 2009, are derived from our consolidated financial statements, which are included elsewhere herein. The statement of operations data set forth below for the years ended September 30, 2005 and September 29, 2006, and the balance sheet data as of September 30, 2005, September 29, 2006 and September 28, 2007, are derived from our audited financial statements that are not included in this annual report on Form 10-K. These historical results are not necessarily indicative of the results to be expected in the future. See “Management’s Discussion and Analysis of Financial Condition and Results of Operations.”
We follow a 52- or 53-week fiscal year. Our year-end and quarter-end dates are on the Friday nearest the end of the calendar quarter. Accordingly, our fiscal year 2007 ended on September 28, 2007, fiscal year 2008 ended on October 3, 2008 and fiscal year 2009 ended on October 2, 2009. Fiscal years 2005 through 2007 each consisted of 52 weeks, fiscal year 2008 consisted of 53 weeks and fiscal year 2009 consisted of 52 weeks.
| Fiscal Year Ended (dollars in thousands, except per share data) | |||||||||||||||||
| September 30, 2005 |
September 29, 2006 |
September 28, 2007 |
October 3, 2008 |
October 2, 2009 | |||||||||||||
| SELECTED STATEMENT OF OPERATIONS DATA: |
|||||||||||||||||
| Revenues |
$ | 151,558 | $ | 154,049 | $ | 167,193 | $ | 181,278 | $ | 132,559 | |||||||
| Cost of revenues |
75,966 | 76,164 | 72,936 | 76,807 | 59,243 | ||||||||||||
| Gross profit |
75,592 | 77,885 | 94,257 | 104,471 | 73,316 | ||||||||||||
| Operating expenses: |
|||||||||||||||||
| Course development |
7,952 | 10,080 | 8,613 | 9,656 | 7,442 | ||||||||||||
| Sales and marketing |
42,387 | 42,503 | 41,094 | 43,596 | 31,962 | ||||||||||||
| General and administrative |
27,499 | 27,944 | 30,041 | 33,532 | 31,929 | ||||||||||||
| Total operating expenses |
77,838 | 80,527 | 79,748 | 86,784 | 71,333 | ||||||||||||
| Income (loss) from operations |
(2,246 | ) | (2,642 | ) | 14,509 | 17,687 | 1,983 | ||||||||||
| Other income, net |
2,263 | 3,373 | 4,236 | 4,001 | 1,048 | ||||||||||||
| Income before provision for income taxes |
17 | 731 | 18,745 | 21,688 | 3,031 | ||||||||||||
| Provision for income taxes |
1,713 | 3,853 | 1,755 | 7,888 | 1,828 | ||||||||||||
| Net income (loss) |
$ | (1,696 | ) | $ | (3,122 | ) | $ | 16,990 | $ | 13,800 | $ | 1,203 | |||||
| Income (loss) per common share—basic |
$ | (0.10 | ) | $ | (0.19 | ) | $ | 1.03 | $ | 0.84 | $ | 0.08 | |||||
| Income (loss) per common share—diluted |
$ | (0.10 | ) | $ | (0.19 | ) | $ | 1.03 | $ | 0.83 | $ | 0.08 | |||||
| Weighted average shares outstanding—basic |
16,865 | 16,583 | 16,498 | 16,516 | 15,181 | ||||||||||||
| Weighted average shares outstanding—diluted |
16,865 | 16,583 | 16,498 | 16,580 | 15,181 | ||||||||||||
23
Table of Contents
| As of (dollars in thousands) | |||||||||||||||
| September 30, 2005 |
September 29, 2006 |
September 28, 2007 |
October 3, 2008 |
October 2, 2009 | |||||||||||
| SELECTED BALANCE SHEET DATA: |
|||||||||||||||
| Cash and cash equivalents |
$ | 56,736 | $ | 44,401 | $ | 49,732 | $ | 51,853 | $ | 44,313 | |||||
| Available for sale securities |
$ | 18,555 | $ | 27,800 | $ | 38,775 | $ | 18,909 | $ | 29,497 | |||||
| Income tax receivable |
$ | 682 | $ | 243 | $ | 4,224 | $ | 2,475 | $ | 265 | |||||
| Total current assets |
$ | 100,125 | $ | 98,715 | $ | 120,861 | $ | 101,294 | $ | 96,743 | |||||
| Available for sale securities, long-term |
$ | — | $ | — | $ | — | $ | 23,440 | $ | — | |||||
| Total assets |
$ | 132,638 | $ | 137,200 | $ | 163,976 | $ | 172,424 | $ | 136,820 | |||||
| Deferred revenues |
$ | 44,956 | $ | 47,678 | $ | 50,216 | $ | 47,712 | $ | 38,103 | |||||
| Total current liabilities |
$ | 65,003 | $ | 70,005 | $ | 76,924 | $ | 70,065 | $ | 60,430 | |||||
| Total long-term liabilities |
$ | 7,564 | $ | 10,261 | $ | 9,844 | $ | 15,961 | $ | 13,528 | |||||
| Total stockholders’ equity |
$ | 60,071 | $ | 56,934 | $ | 77,208 | $ | 86,398 | $ | 62,862 | |||||
24
Table of Contents
| Item 7. | MANAGEMENT’S DISCUSSION AND ANALYSIS OF FINANCIAL CONDITION AND RESULTS OF OPERATIONS |
This Management’s Discussion and Analysis of Financial Condition and Results of Operations includes many forward-looking statements. For cautions about relying on such forward looking statements, please refer to the section entitled “Forward Looking Statements” at the beginning of this Report immediately prior to “Item 1”.
OVERVIEW
Nature of the Business. Learning Tree International is a leading worldwide vendor-independent provider of training and education to business and government organizations for their managers and IT professionals. Since our founding in 1974, we have provided high-quality training to nearly 2 million managers and IT professionals. In fiscal year 2009 we trained 76,552 course participants from more than 9,100 organizations worldwide, including large national and multinational companies, government organizations, and small and medium-size companies.
As of October 2, 2009, we offered a broad proprietary library of intensive instructor-led courses from two to five days in length, consisting of 219 different course titles representing 4,986 hours of training, including 143 IT course titles and 76 management course titles. Learning Tree courses provide both breadth and depth of education and training across a wide range of technical and management disciplines, including operating systems, databases, computer networks, computer and network security, web development, programming languages, software engineering, open source applications, project management, business skills, leadership and professional development.
We market and present our courses through local operations in the United States, the United Kingdom, France, Canada, Sweden and Japan, and generate approximately half of our revenues internationally. Each operating subsidiary is staffed by local personnel responsible for the sale and delivery of Learning Tree courses in that country. Our infrastructure and logistical capabilities allow us to coordinate, plan and deliver our courses at our own education centers, external hotel and conference facilities and customer sites worldwide. During fiscal year 2009, we presented courses in 54 countries.
We use a well-defined systematic approach to develop and update the Learning Tree course library so as to provide training that is immediately relevant to course participants working in a broad range of applications and industries. After assessing market need, courses are translated into French, Swedish and Japanese. Our proprietary course development process also allows us to customize our courses for delivery at our customers’ sites.
We design our own vendor-independent IT courses to provide participants an unbiased perspective regarding software and hardware products and the ability to compare and integrate multiple platforms and technologies from various vendors. All Learning Tree courses are highly interactive, and incorporate extensive hands-on exercises or case study workshops. While addressing core concepts and theory, all of our technical and management courses focus primarily on providing skills, tools, and technologies that participants can apply immediately upon returning to their jobs. To accomplish this objective, many of our RealityPlus™ management courses utilize extensive multi-media simulations to teach practical management techniques. This innovative methodology provides an environment in which RealityPlus™ course participants learn entirely by doing. Throughout these courses, they gain extensive experience applying new management skills in life-like, challenging situations, within the confines of the classroom and under the guidance of an expert instructor. As a result, RealityPlus™ course participants can achieve greater mastery of effective management techniques as well as the confidence needed to apply them, and thus return to their jobs both ready and willing to immediately apply their expanded skills in their workplaces.
We had 610 instructors as of October 2, 2009, who are practicing professionals with expert subject knowledge, and who average over 24 years of “hands-on, real world” experience. Learning Tree instructors teach
25
Table of Contents
an average of approximately 10 course events per year on an “as-needed” basis. During the rest of the year they apply the skills that they teach, either as full-time employees for other companies or as independent consultants. When they are not teaching, Learning Tree instructors are using and honing their management and IT skills as either full-time employees for other companies or as independent consultants.
We offer our proprietary courses through wholly owned local subsidiaries in the United States, the United Kingdom, France, Canada, Sweden and Japan, and generate approximately half of our revenues internationally. Each operating subsidiary is staffed by local personnel responsible for the sale and delivery of our courses in that country. Additionally, our Learning Tree AnyWare e-Learning platform enables individuals located anywhere in the world to remotely attend our live instructor-led classes held in these locations, via the Internet.
We have structured our business so that the majority of our course delivery costs are variable and depend primarily upon the number of course events conducted. We schedule our course events throughout the year based on our assessment of demand. Since Learning Tree instructors typically work full-time or as consultants for other business and industry employers, or in the case of management instructors as industry consultants and facilitators, they teach our course events as needed and thus, our instructor-related costs are largely variable. However, expenses associated with our own education centers and course equipment are largely fixed.
We adjust our expenditures for sales and marketing depending on our strategic objectives, which generally include an assessment of our expectations for influencing future customer demand, market conditions and other factors. However, if our expectations regarding the results of our marketing efforts prove to be wrong, any significant revenue shortfall would have a material adverse effect on our results of operations.
In late fiscal year 2007, we implemented a series of growth initiatives which we continued throughout fiscal year 2008. As a result of the external economic environment, during fiscal year 2009 we refocused our goals toward reducing costs and maintaining profitability. We substantially scaled back our growth plans, but maintained some efforts in two key areas which we believe made some contribution to our fiscal year 2009 results and will provide increasing contributions in subsequent years. These areas are:
| 1 | Increasing the size of our course library. We believe that increasing the size of our course library will allow us to serve more customers by meeting a broader set of professional development needs. Performance of new titles has a well-established historical track record, and new titles typically grow to full revenue contribution levels approximately two years after their introduction. In fiscal year 2008 we significantly increased the rate at which we introduce new titles, so that we released 34 new course titles in fiscal year 2008 and 50 new course titles in fiscal year 2009, compared to an average of 27 new titles in fiscal years 2006 and 2007. By the end of fiscal year 2009, we had somewhat slowed the rate of developing new titles, but we will continue to evaluate changing technology, market demand and customer requirements as we develop and introduce new titles in the future. |
| 2 | Expanding our course delivery capability through e-Learning. We remain firmly committed to the value of instructor-led classroom training as the center point of our business model, and believe there is a substantial opportunity to further increase the value of that training format by leveraging technology. In fiscal year 2008, we began focused research in the area of blended learning, and we experimented with a variety of approaches to using technology in conjunction with our instructor-led classroom training. As a result of this research, we determined that our customers responded most positively to an approach which we refined and introduced in fiscal year 2009 as our patent-pending e-Learning platform, Learning Tree AnyWare™. AnyWare allows individuals located anywhere to attend a live instructor-led class being conducted in a Learning Tree Education Center or at a customer location. We are currently marketing more than 140 course titles available through our AnyWare platform in North America and Europe, and we anticipate expanding that number further in fiscal year 2010. We have received positive feedback from our customers based on our initial efforts, and believe that we can expand both our geographic reach and our market share through the continued implementation of AnyWare. |
26
Table of Contents
As we have for the past 35 years, we continue to emphasize excellence in educating and training managers and IT professionals from government and commercial organizations around the world. We believe that quality is a significant differentiator in the eyes of our customers, and that our proven long-term record of exceptional performance is a reason for our clients’ tremendous loyalty. It is worth noting that all of our top 100 customers from five years ago in our fiscal year 2004 were still our customers five years later in fiscal year 2009. We continue our emphasis on excellence by focusing on our core strengths: our expert instructors, proprietary content library, state-of-the-art classrooms, application of technology to education, and worldwide course delivery systems. In fiscal year 2009, course participants rated Learning Tree instructors and courses at the highest levels in our history. Converting our course evaluation scale to a typical grading scale with a maximum possible score of 100%, our instructors received an average “grade” of 97% from their participants in fiscal year 2009.
Our customers have continued to respond positively to our increase in the breadth and depth of our management course offerings. At October 2, 2009, we offered 76 titles in our management curriculum representing 34.7% of our entire course library, compared to 54 titles, which represented 29.2% of our course library, at the end of fiscal year 2008.
The current economic climate has had an effect on our business, and although there are reports of economic stability or even growth in some of the countries where we operate many economists are still predicting a long, challenging period for the global economy. We believe that effective training in information technology and management skills improves our customers’ competitiveness, and many of our customers will continue to invest in training their personnel in these critical competencies. However, we also expect that some customers will continue to restrict their spending on training services as part of their response to the current economic conditions. We therefore believe we must manage our business with the expectation that these conditions may continue to adversely affect our revenues, an impact that will only be partially offset by the positive effects of the growth initiatives we instituted last year. However, there is no guarantee that these approaches will be successful.
We follow a 52- or 53-week fiscal year. Our year-end and quarter-end dates are on the Friday nearest the end of the calendar quarter. Accordingly, our fiscal year 2007 ended on September 28, 2007, our fiscal year 2008 ended on October 3, 2008, and our fiscal year 2009 ended on October 2, 2009. Our fiscal years 2009 and 2007 consisted of 52 weeks, and our fiscal year 2008 was a 53-week fiscal year.
RESULTS OF OPERATIONS
The following table summarizes our consolidated statements of operations for the periods indicated expressed as percentages of revenues:
| Fiscal Year Ended | |||||||||
| September 28, 2007 |
October 3, 2008 |
October 2, 2009 |
|||||||
| Revenues |
100.0 | % | 100.0 | % | 100.0 | % | |||
| Cost of revenues |
43.6 | 42.4 | 44.7 | ||||||
| Gross profit |
56.4 | 57.6 | 55.3 | ||||||
| Operating expenses: |
|||||||||
| Course development |
5.1 | 5.3 | 5.6 | ||||||
| Sales and marketing |
24.6 | 24.0 | 24.1 | ||||||
| General and administrative |
18.0 | 18.5 | 24.1 | ||||||
| Total operating expenses |
47.7 | 47.8 | 53.8 | ||||||
| Income from operations |
8.7 | 9.8 | 1.5 | ||||||
| Other income, net |
2.5 | 2.2 | 0.8 | ||||||
| Income before provision for income taxes |
11.2 | 12.0 | 2.3 | ||||||
| Provision for income taxes |
1.0 | 4.4 | 1.4 | ||||||
| Net income |
10.2 | % | 7.6 | % | 0.9 | % | |||
27
Table of Contents
FISCAL YEAR 2009 COMPARED WITH FISCAL YEAR 2008
Our fiscal year 2009 began October 4, 2008, and from the outset was significantly impacted by the global financial crisis and subsequent economic downturn. In fiscal year 2009, our revenues decreased by 26.9% to $132.6 million compared to $181.3 million in fiscal year 2008. Income from operations decreased by 88.8% to $2.0 million in fiscal year 2009 compared to $17.7 million in fiscal year 2008. Net income for fiscal year 2009 decreased by 91.3% to $1.2 million compared to $13.8 million in fiscal year 2008.
Revenues. Our fiscal year 2009 revenues decreased by 26.9% compared to fiscal year 2008. The decrease in revenues is primarily due to a 19.0% decrease in the number of participants in our courses, and a 10.0% decrease in average revenue per participant. The decrease in revenue per participant was primarily the result of a negative 7.5% effect of changes in foreign exchange rates, and the fact that in fiscal year 2009, compared to fiscal year 2008, we had a higher percentage of participants at courses held at customer locations, where the average revenue per participant is lower than for courses held in our own education centers, as well as a higher percentage of participants at our management courses, which have a shorter average length than our IT courses and accordingly a lower average revenue per participant. These decreases were partially offset by price increases.
During fiscal year 2009, we provided 269,854 attendee-days of training, a decrease of 21.9% from the 345,615 attendee-days in fiscal year 2008. In our management courses in fiscal year 2009, we provided 96,020 attendee-days of training, a 9.8% decrease over the 106,501 attendee-days in fiscal year 2008. In our IT courses during fiscal year 2009, we provided 173,834 attendee-days of IT training, a 27.3% decrease from the 239,114 attendee-days in fiscal year 2008. Because of our 52/53 week accounting convention, our fiscal year 2009 had 52 weeks, while our fiscal year 2008 had 53 weeks.
Revenues in the United States decreased 19.3% from $80.4 million in fiscal year 2008 to $64.9 million in fiscal year 2009, primarily due to a decrease in the number of course participants. Revenues from our international operations decreased 32.9% from $100.9 million in fiscal year 2008 to $67.7 million fiscal year 2009, primarily due to a decrease in the number of course participants and to a 7.5% negative effect of changes in foreign exchange rates.
Cost of Revenues. Our cost of revenues primarily includes the costs of course instructors and their travel expenses, course materials and equipment, freight, classroom facilities and refreshments. During fiscal year 2009, we presented 6,082 events compared to 7,097 events during fiscal year 2008. Our cost of revenues for fiscal year 2009 was $59.2 million compared to $76.8 million in fiscal year 2008. Our cost of revenues as a percentage of our revenues increased to 44.7% for fiscal year 2009 from 42.4% in fiscal year 2008.
Changes in exchange rates do not materially affect our gross profit percentages since exchange rates have essentially the same impact on both revenues and cost of revenues in any time period.
The increase in cost of revenues as a percentage of revenues in fiscal year 2009 reflects a 15.0% decrease in average revenue per event partly offset by a 10.0% decrease in average cost per event. The decrease in our average revenue per event, is the result of a 7.5% effect of changes in foreign exchange rates, and a 5.5% decrease in average participants per event and the decrease in average revenue per participant discussed earlier. The decrease in average cost per event principally results from the effect of changes in foreign exchange rates and the decrease in our average number of days per event held compared to fiscal year 2008, somewhat offset by proportionately higher fixed costs per event due to having fewer events during fiscal year 2009 over which to allocate the expenses associated with our education centers.
Gross profit in the United States decreased 20.0% from $44.1 million in fiscal year 2008 to $35.3 million in fiscal year 2009, primarily due to a decrease in the number of course participants. Gross profit from our international operations decreased 37.1% from $60.4 million in fiscal year 2008 to $38.0 million in fiscal year 2009, primarily due to a decrease in the number of course participants and a 7.5% negative effect of changes in foreign exchange rates.
28
Table of Contents
Course Development Expenses. We maintain a disciplined process to develop new courses and update our existing courses. All costs incurred in that process, principally for internal product development staff and for subject matter experts, are expensed when incurred and are included in course development expenses.
In fiscal year 2008, we began a strategic initiative aimed at significantly increasing the rate at which we develop new course titles, and we began introducing new titles at an accelerated rate in the third quarter of that year. In fiscal year 2009, we introduced 50 new course titles, compared with 34 new course titles introduced in fiscal year 2008. We expect to introduce fewer course titles in fiscal year 2010 than in fiscal year 2009.
During fiscal year 2009, largely due to the decline in our revenues, course development expenses were 5.6% of revenues compared to 5.3% during fiscal year 2008. In fiscal year 2009, we decreased our overall spending on course development by 22.9% to $7.4 million compared with $9.7 million in fiscal year 2008. This decrease reflects both the reduction in costs associated with the development of new titles in fiscal year 2009 compared to the prior fiscal year as well as cost savings in the development process. Our development costs for a course are incurred well before the date the course is first taught.
We introduced 25 new management course titles in fiscal year 2009 compared with nine in fiscal year 2008. During each of fiscal years 2009 and 2008 we introduced 25 new IT courses. During this period, we have continued to research and develop various approaches to delivering “hybrid” learning, which combines instructor-led classroom training with web-based e-learning, culminating with the introduction of Learning Tree AnyWare™, our e-learning platform that allows individuals located anywhere to attend a live instructor-led class being conducted in a Learning Tree Education Center or at a customer location.
At the end of fiscal year 2009, the Learning Tree library of instructor-led courses numbered 219 titles, comprising over 4,986 hours of training, compared with 185 titles at the end of fiscal year 2008. The increase in the number of titles in fiscal year 2009 reflects the net effect of introducing 50 new titles and retiring 16 titles. In general, titles are retired when the profits they generate no longer justify the ongoing cost of marketing them and maintaining their content. Thus, we may or may not develop more titles than we retire in any period.
At October 2, 2009, we had 76 management titles in our course library, compared with 54 management titles at the end of fiscal year 2008. Our library of IT titles numbered 143 as of October 2, 2009 compared to 131 titles at the end of fiscal year 2008.
Sales and Marketing Expenses. Sales and marketing expenses primarily include the cost of designing, producing and distributing direct mail and media advertisements, marketing e-mails and our website; compensation and travel-related costs for sales and marketing personnel; and the cost of information systems to support these activities. Our sales and marketing expense, and in particular our expenditure on course catalogs, is one of our largest expenditures. We have adjusted the market segments to which we mail our catalogs, and are presently evaluating a number of additional ways to increase the efficiency of our marketing expenditures by spending less without materially affecting the response to that marketing. At the same time, in response to changing economic conditions, we have decreased our sales staff in our operating units.
Our sales and marketing expenses were 24.1% and 24.0% of revenues in fiscal years 2009 and 2008, respectively. Sales and marketing expenses decreased to $32.0 million in fiscal year 2009 compared to $43.6 million in fiscal year 2008. The decrease in sales and marketing expenses compared to fiscal year 2008 included: $6.0 million in costs associated with printing and mailing our catalogs; $3.6 million in personnel-related expenses; $1.0 million in professional service fees; $0.3 million in trade show and advertising expense; and $0.7 million for decreases in travel and living, general office expenditures and other items. Changes in foreign exchange rates caused our overall sales and marketing expenses to decline by about 7.4%.
General and Administrative Expenses. Our general and administrative expenses in fiscal year 2009 decreased by $1.6 million over the prior fiscal year, from $33.5 million in fiscal year 2008 to $31.9 million. We have previously disclosed the existence of a claim by the U.S. Government relating to the expiration and prepayment terms of our passport and voucher programs for periods prior to fiscal year 2009. While we continue to believe that we have complied with the terms of our contracts, we have offered to settle the dispute by making
29
Table of Contents
a cash payment to the Government, and accordingly we recorded a charge in the fourth quarter of fiscal year 2009 to reflect the anticipated cost of such a settlement. This resulted in a $4.2 million increase to our G&A expense. Although our respective positions are close on this matter, there can be no assurance that agreement on a settlement will be reached, and the ultimate payment could be more or less than the amount reserved. Offsetting this increase to G&A expense, are the decreases related to: $2.1 million in payroll and benefits; $1.2 million in incentive and stock compensation; $1.1 million in professional service fees; and $0.8 million in facilities and other net decreases. Additionally, fiscal years 2009 and 2008 included the following significant items not associated with current operations:
| • | Fiscal year 2009 included $1.3 million of restructuring costs associated with reconfiguring our business to meet the challenges of the current business environment and $0.7 million for costs associated with the since-discontinued effort to explore the sale of the company, primarily for non-contingent transaction contribution bonuses for certain employees. |
| • | Fiscal year 2008 included $1.0 million for costs associated with the since-discontinued effort to explore the sale of the company, primarily for non-contingent transaction contribution bonuses for certain employees; professional service fees of $0.9 million for tax services and financial consulting; $0.3 million related to lapsed options; $0.2 million for contingency accruals and $0.2 million for severance. |
During fiscal year 2009, changes in foreign exchange rates caused total general and administrative expenses to decline by about 5.2% compared with the same period of fiscal year 2008. Despite the reduction in our absolute expenditure on G&A, the reduction in revenues resulted in G&A expense of 24.1% of revenues in fiscal year 2009 compared with 18.5% in the prior fiscal year.
Other Income (Expense), Net. Other income (expense), net in fiscal year 2009 decreased by $3.0 million over the prior fiscal year, from $4.0 million to $1.0 million. This change was primarily due to a decrease in interest income of $2.6 million due to lower interest rates and lower outstanding cash balances as well as a decrease of $0.2 million because in fiscal year 2008 we recorded the proceeds from the liquidation of our investment in Collegis, Inc.
Income Taxes. In fiscal year 2009, our income tax provision was $1.8 million compared to $7.9 million in fiscal year 2008. Our effective rate for fiscal year 2009 was 60.3% compared to 36.4% in fiscal year 2008. The higher effective rate for fiscal year 2009 was primarily attributable to U.S. income taxes on the dividends from foreign subsidiaries, the write off of deferred tax assets related to equity compensation and other nondeductible items, which increased tax expense by approximately $1.4 million. These increases were partially offset by the tax benefits from valuation allowance reversals of approximately $0.5 million.
In the fourth quarter of fiscal year 2009, several of our foreign subsidiaries paid dividends to our U.S. parent corporation totaling approximately $17.5 million. After taking into account withholding taxes, foreign tax credits, and previously taxed income amounts, we accrued approximately $0.7 million of U.S. income taxes on the dividends from the foreign subsidiaries.
As of the end of the fourth quarter of fiscal year 2009, we reversed the valuation allowance for our foreign tax credit carryovers and for our deferred tax assets in a foreign jurisdiction. Because of changes we made to our intercompany agreements with our foreign subsidiaries and the improved financial performance of their operations, we determined that it is more likely than not that the benefits from the foreign tax credit carryovers will be realized. We also determined that it is more likely than not that we will realize the benefits for the deferred tax assets in the foreign jurisdiction because of the improved financial performance of our operations in the foreign jurisdiction. The reversal of the valuation allowances for these items resulted in a net benefit of approximately $0.5 million.
We have not provided for U.S. federal income and foreign withholding taxes of international subsidiaries’ undistributed earnings as of October 2, 2009, because we currently intend to reinvest such earnings indefinitely. The undistributed earnings were approximately $18.6 million as of October 2, 2009. If these earnings were distributed, we would incur approximately $0.2 million of foreign withholding taxes. Because of the availability of U.S. foreign tax credits, it is not practicable to determine the U.S. federal income tax liability that would be payable if such earnings were not reinvested.
30
Table of Contents
FISCAL YEAR 2008 COMPARED WITH FISCAL YEAR 2007
In fiscal year 2008, our revenues increased by 8.4% to $181.3 million compared to $167.2 million in fiscal year 2007. Income from operations increased by 22.1% to $17.7 million in fiscal year 2008 compared to $14.5 million in fiscal year 2007. Net income for fiscal year 2008 decreased by 18.8% to $13.8 million compared to $17.0 million in fiscal year 2007.
Revenues. Our fiscal year 2008 revenues increased by 8.4% compared to fiscal year 2007. The increase in revenues was primarily due to a 5.2% increase in the number of participants in our courses, a 2.7% increase in average revenue per participant and a 0.5% increase due to higher classroom rental revenues than in fiscal year 2007. The increase in revenue per participant was primarily the result of a 3.4% effect of changes in foreign exchange rates and, to a lesser degree, price increases. These increases were partly offset by a higher percentage of participants at courses held at customer locations, where the average revenue per participant is lower than for courses held in our own education centers, and by a higher percentage of participants at our management courses, which have a shorter average length than our IT courses and accordingly a lower average revenue per participant.
During fiscal year 2008, we provided 345,615 attendee-days of training an increase of 1.8% from the 339,620 attendee-days in fiscal year 2007. In our management courses in fiscal year 2008, we provided 106,501 attendee-days of training, a 4.5% increase over the 101,960 attendee-days in fiscal year 2007. In our IT courses during fiscal year 2008, we provided 239,114 attendee-days of IT training, a 0.6% increase from the 237,660 attendee-days in fiscal year 2007. Because of our 52/53 week accounting convention, our fiscal year 2008 had 53 weeks, while fiscal year 2007 had 52.
Revenues in the United States increased from $74.7 million in fiscal year 2007 to $80.4 million in fiscal year 2008. Revenues from our international operations increased from $92.5 million in fiscal year 2007 to $100.9 million fiscal year 2008.
Cost of Revenues. During fiscal year 2008, we presented 7,097 events compared to 7,023 events during fiscal year 2007. Our cost of revenues for fiscal year 2008 was $76.8 million compared to $72.9 million in fiscal year 2007. Our cost of revenues as a percentage of our revenues declined to 42.4% for fiscal year 2008 from 43.6% in fiscal year 2007.
Changes in exchange rates do not materially affect our gross profit percentages since exchange rates have essentially the same impact on both revenues and cost of revenues in any time period.
The decrease in cost of revenues as a percentage of revenues in fiscal year 2008 reflects a 7.7% increase in average revenue per event partly offset by a 4.8% increase in average cost per event. The increase in our average revenue per event, excluding the effect of exchange rates, is the result of a 4.9% increase in average participants per event and the increase in average revenue per participant discussed earlier. The increase in average cost per event is due primarily to the effect of changes in foreign exchange rates and the increase in participants per event.
Gross profit in the United States increased from $41.3 million in fiscal year 2007 to $44.1 million in fiscal year 2008. Gross profit from our international operations increased from $53.0 million in fiscal year 2007 to $60.4 million in fiscal year 2008.
Course Development Expenses. During fiscal year 2008, course development expenses were 5.3% of revenues compared to 5.1% during the prior fiscal year. In fiscal year 2008, we increased our overall spending on course development by 12.1% to $9.7 million compared with $8.6 million in fiscal year 2007. This increase reflects the costs associated with the development of the greater number of new titles in fiscal year 2008 compared to the prior fiscal year. We introduced 9 new management course titles in each of fiscal years 2008 and 2007. During fiscal year 2008 we introduced 25 new IT courses, compared with 16 in fiscal year 2007.
31
Table of Contents
At the end of fiscal year 2008, our library of instructor-led courses numbered 185 titles, comprising over 4,248 hours of training, compared with 162 titles at the end of fiscal year 2007. The increase in the number of titles in fiscal year 2008 reflects the net effect of introducing 34 new titles and retiring 11 titles.
At October 3, 2008, we had 54 management titles in our course library, compared with 47 management titles at the same point a year earlier. Our library of IT titles numbered 131 as of October 3, 2008 compared to 115 titles at the end of fiscal year 2007.
Sales and Marketing Expenses. Our sales and marketing expenses were 24.0% and 24.6% of revenues in fiscal years 2008 and 2007, respectively. Sales and marketing expenses increased to $43.6 million in fiscal year 2008 compared to $41.1 million in fiscal year 2007. The increase in sales and marketing expenses compared to fiscal year 2007 included: $3.9 million in personnel-related expenses; $0.7 million in professional service fees; $0.6 million in advertising expense; and $0.5 million for increases in travel and living, general office expenditures and other items. These increases were partially offset by a reduction of $3.2 million in costs associated with printing and mailing our catalogs.
General and Administrative Expenses. Our general and administrative expenses in fiscal year 2008 increased by $3.5 million over the prior fiscal year, from $30.0 million to $33.5 million and represented 18.5% of revenues compared to 18.0% in fiscal year 2007. The increase in General and Administrative expenses was due to increases in professional service fees of $1.2 million including amounts for tax assistance in conjunction with the implementation of FIN 48 ($0.5 million), financial advisory services ($0.4 million) and additional legal fees ($0.3 million); and increases of $1.0 million in personnel-related costs including compensation and benefits ($0.9 million), one-time charges related to employee compensation for gains on expired stock options ($0.3 million), increases in stock compensation expense ($0.2 million), and an increase in severance expense ($0.1 million), offset by decreases in incentive compensation ($0.5 million).
For fiscal year 2008, total expenses associated with share based compensation were $1.1 million, compared to $1.0 million in fiscal year 2007. In fiscal year 2008, $0.9 million of share based compensation expense was recorded to general and administrative expense, compared to $0.7 million in fiscal year 2007. The remainder of our share based compensation expense is apportioned among other expense categories, based on where we record the compensation costs for the individuals with whom the stock option compensation expense is associated.
Included in general and administrative expenses for fiscal year 2008 was $1.0 million associated with a process to explore the potential sale of the company, including employee non-contingent-transaction contribution bonuses ($0.6 million), and legal, investment banker and board fees ($0.4 million). We initiated that process on May 28, 2008 and terminated it on October 14, 2008.
Other Income (Expense), Net. Other income (expense), net in fiscal year 2008 decreased by $0.2 million over the prior fiscal year, from $4.2 million to $4.0 million. These changes included foreign currency exchange losses as opposed to prior year gains ($0.6 million) and a decrease in proceeds from the liquidation in fiscal year 2007 of our investment in Collegis, Inc. ($0.2 million), partly offset by a decrease in loss on disposal of assets ($0.4 million) and reductions in interest expense ($0.2 million).
Income Taxes. In fiscal year 2008, our income tax provision was $7.9 million compared to $1.8 million in fiscal year 2007. Our effective rate for fiscal year 2008 was 36% compared to 9% in fiscal year 2007. The low effective rate for fiscal year 2007 was attributable to the reversal of the valuation allowance related to our U.S. deferred tax assets (which reduced our tax provision by $2.8 million) and $3.2 million from favorable adjustments from an audit of our Canadian subsidiary.
As of the end of our fourth quarter of fiscal year 2008, we reversed the valuation allowance for certain state deferred tax assets because we determined it was more likely than not that these deferred tax assets were recoverable because of the improved financial performance in the relevant jurisdictions. The reversal of the
32
Table of Contents
valuation allowance resulted in a net benefit of approximately $0.2 million. As of October 3, 2008, we continued to maintain valuation allowances in the U.S. related to foreign tax credit carryovers, and we continued to maintain valuation allowances for our deferred tax assets in a foreign jurisdiction.
As of the beginning of fiscal year 2008, we adopted the provisions of FIN 48 (codified primarily in Financial Accounting Standards Board (“FASB”) ASC 740, Income Taxes). The cumulative effect of the adoption was a $1.2 million reduction to retained earnings. As of the date of adoption, the amount of unrecognized tax benefits was $1.4 million, all of which would have an impact on our effective tax rate if recognized. As of the date of adoption, we had $0.6 million accrued for interest and $0.6 million accrued for penalties.
We did not provide for U.S. federal income and foreign withholding taxes of international subsidiaries’ undistributed earnings as of October 3, 2008, because such earnings were intended to be reinvested indefinitely. The undistributed earnings were approximately $43.5 million as of October 3, 2008. If these earnings were distributed, we would incur approximately $0.3 million of foreign withholding taxes. Because of the availability of U.S. foreign tax credits, it is not practicable to determine the U.S. federal income tax liability that would be payable if such earnings were not reinvested.
GEOGRAPHIC DATA
Learning Tree Education Centers are located in six countries and we have historically derived roughly half of our revenues from outside the United States. The United States operations recorded revenues of $64.9 million in fiscal year 2009 compared to revenues of $80.4 million in fiscal year 2008. Revenues from our European operations were $51.6 million in fiscal year 2009 compared to $78.3 million in fiscal year 2008. Canadian operations recorded revenues of $13.5 million in fiscal year 2009 compared to revenues of $19.5 million in fiscal year 2008 and our Asian operations recorded revenues of $2.6 million in fiscal year 2009 compared to $3.1 million in fiscal year 2008. See Note 9 of “Notes to Consolidated Financial Statements” for further information on segment reporting.
Although our consolidated financial statements are stated in U.S. dollars, all of our subsidiaries other than in the U.S. have functional currencies other than the U.S. dollar. Gains and losses arising from the translation of the balance sheets of our subsidiaries from the functional currencies to U.S. Dollars are reported as adjustments to stockholders’ equity. Fluctuations in exchange rates may also have an effect on our results of operations. Since both revenues and expenses are generally denominated in the subsidiary’s local currency, changes in exchange rates that have an adverse effect on our foreign revenues are partially offset by a favorable effect on our foreign expenses, and vice versa. The impact of future exchange rates on our results of operations cannot be accurately predicted. To date, we have not sought to hedge the risks associated with fluctuations in exchange rates and therefore we continue to be subject to such risks. In the future, we may undertake such hedging transactions. There can be no assurance that any hedging techniques we implement would be successful in eliminating or reducing the effects of currency fluctuations.
INFLATION
Inflation and changing prices do not have a significant impact on our net sales, revenues and income from continuing operations.
RECENTLY ISSUED ACCOUNTING PRONOUNCEMENTS
Measuring Liabilities at Fair Value. In August 2009, the FASB issued Accounting Standards Update (“ASU”) 2009-5 to provide fair value measurement clarification in circumstances in which a quoted price in an active market for an identical liability is not available. Under the standard, appropriate valuation techniques include a technique that uses the quoted price of the identical liability when traded as an asset or another
33
Table of Contents
valuation technique (an income or a market approach) that is consistent with the principles of Accounting Standards Codification (“ASC”) 820. We adopted this standard in August 2009 with no material impact on our consolidated financial statements.
Accounting Standards Codification. In June 2009, the FASB issued ASU 2009-1 to establish the FASB Accounting Standards Codification (included in ASC 105) as the source of authoritative accounting principles recognized by the FASB to be applied by nongovernmental entities in preparation of financial statements in conformity with generally accepted accounting principles in the United States. The FASB uses ASU to amend ASC. This standard was effective for interim and annual periods ending after September 15, 2009, and did not have a material impact on our consolidated financial statements.
Subsequent Events. In May 2009, the FASB issued standards (included in ASC 855) for accounting and disclosure of events that occur after the balance sheet date but before the financial statements are issued or available to be issued. Companies must disclose the date through which they evaluated subsequent events and whether the date corresponds with the filing of their financial statements. It is effective for fiscal periods ending after June 15, 2009. This standard was effective for our third quarter ended July 3, 2009, and did not have a material impact on our consolidated financial statements.
Determining Fair Value When the Volume and Level of Activity for the Asset or Liability Have Significantly Decreased and Identifying Transactions That Are Not Orderly. In April 2009, the FASB issued standards (included in ASC 820) which provide additional guidance on fair value, and reaffirm the previous definition of fair value as the price that would be received to sell an asset or paid to transfer a liability in an orderly transaction between market participants under current market conditions. This standard requires an evaluation of whether there has been a significant decrease in the volume and level of activity for the asset or liability in relation to normal market activity for the asset or liability. If there has, transactions or quoted prices may not be indicative of fair value and a significant adjustment may need to be made to those prices to estimate fair value. Additionally, an entity must consider whether the observed transaction was orderly (that is, not distressed or forced). If the transaction was orderly, the obtained price can be considered a relevant observable input for determining fair value. If the transaction is not orderly, other valuation techniques must be used when estimating fair value. We adopted this standard on April 4, 2009, with no material impact on our consolidated financial statements.
Interim Disclosures about Fair Value of Financial Instruments. In April 2009, the FASB issued standards (included in ASC 825) requiring disclosures about fair value of financial instruments for interim and annual financial statements. We adopted this standard on April 4, 2009, with no material impact on our consolidated financial statements.
Recognition and Presentation of Other-Than-Temporary Impairments. In April 2009, the FASB issued standards (included in ASC 320) which provide additional guidance designed to create greater clarity and consistency in accounting for and presenting impairment losses on securities. We adopted this standard on April 4, 2009, with no material impact on our consolidated financial statements.
Fair Value Measurement. In October 2008, the FASB issued standards (included in ASC 820) which provide a common definition of fair value and establish a framework to make the measurement of fair value in generally accepted accounting principles more consistent and comparable. The standard does not require new fair value measurements but applies to other standards that require fair value measurement; expanded disclosures are also required. In February 2008, the FASB delayed the effective date of this standard to fiscal years beginning after November 15, 2008 for nonfinancial assets and nonfinancial liabilities, except for items that are recognized or disclosed at fair value in the financial statements on a recurring basis (at least annually). We will adopt the standard for nonfinancial assets and nonfinancial liabilities beginning in the first quarter of fiscal year 2010. We do not currently believe adoption will have a material impact on our consolidated financial statements.
34
Table of Contents
The Fair Value Option for Financial Assets and Financial Liabilities. In February 2007, the FASB issued standards (included in ASC 825) permitting entities to choose to measure many financial instruments and certain other items at fair value. The objective is to improve financial reporting by providing entities with the opportunity to mitigate volatility in reported earnings caused by measuring related assets and liabilities differently without having to apply complex hedge accounting provisions. The standard became effective for us October 4, 2008. We chose not to elect the fair value option.
Other recent accounting pronouncements issued by the FASB did not, or management believes will not, have a material impact on our present or future consolidated financial statements.
QUARTERLY RESULTS OF OPERATIONS
Historically, our quarterly operating results have fluctuated, and that is expected to continue in the future. Typically, our first and third fiscal quarters have higher revenues and income from operations than do our second and fourth fiscal quarters. The fluctuations may be caused by many factors such as: (i) the frequency of course events; (ii) the number of weeks during which courses can be conducted in a quarter; (iii) the timing, timely delivery, frequency and size of and response to our direct mail marketing and advertising campaigns; (iv) the timing of the introduction of new course titles; (v) the mix between course events held at customer sites and course events held in our education centers and hotels due to differing gross profit margins; (vi) competitive forces within markets we serve; (vii) our ability to attract customers and meet their expectations; (viii) currency fluctuations and other risks inherent in international operations; (ix) natural disasters, external strikes, acts of war or terrorism and other external factors; and (x) general economic conditions and industry-specific slowdowns. Fluctuations in quarter-to-quarter results also occur as a result of differences in the timing of our spending on the marketing and development of our courses.
See Note 14 of “Notes to Consolidated Financial Statements” for our unaudited quarterly financial data for the eight fiscal quarters ended October 2, 2009. Our operating results for any quarter are not necessarily indicative of the results for any future period.
LIQUIDITY AND CAPITAL RESOURCES
Our primary sources of liquidity include cash and cash equivalents on hand of $44.3 million at October 2, 2009. During fiscal year 2009, the total of our cash and cash equivalents decreased by $7.5 million, largely as a result of the expenditure of $25.2 million for repurchases of our common stock and $2.1 million of purchases of fixed assets, partly offset by $12.9 million of net proceeds from the sales of available for sale securities, cash provided by operations and the effects of exchange rates on our cash.
Cash Flows. Our cash and cash equivalents decreased $7.5 million to $44.3 million at October 2, 2009 from $51.8 million at October 3, 2008.
| Fiscal Year Ended | Net Change | |||||||||||||||||||
| September 28, 2007 |
October 3, 2008 |
October 2, 2009 |
2008 vs. 2007 | 2009 vs. 2008 | ||||||||||||||||
| Cash provided by operating activities |
$ | 18.5 | $ | 18.0 | $ | 7.5 | $ | (0.5 | ) | $ | (10.5 | ) | ||||||||
| Cash (used in) provided by investing activities |
(16.0 | ) | (12.8 | ) | 10.8 | 3.2 | 23.6 | |||||||||||||
| Cash provided by (used in) financing activities |
0.2 | — | (25.2 | ) | (0.2 | ) | (25.2 | ) | ||||||||||||
| Effects of exchange rates on cash and cash equivalents |
2.6 | (3.1 | ) | (0.6 | ) | (5.7 | ) | 2.5 | ||||||||||||
| Increase (decrease) in cash and cash equivalents |
$ | 5.3 | $ | 2.1 | $ | (7.5 | ) | $ | (3.2 | ) | $ | (9.6 | ) | |||||||
35
Table of Contents
Cash provided by operating activities declined by $10.5 million to $7.5 million in fiscal year 2009 from $18.0 million in fiscal year 2008. Cash provided from investing activities improved $23.6 million during fiscal year 2009 compared to fiscal year 2008 due to higher net proceeds from the disposition of available for sale securities and fewer purchases of equipment and other capital assets. Cash used in financing activities was $25.2 million due to repurchases of our common stock during fiscal year 2009. The negative effect of exchange rates on cash and cash equivalents decreased by $2.5 million to $(0.6) million in fiscal year 2009 from $(3.1) million in fiscal year 2008, primarily reflecting the decline in exchange rates for the British Pound, Euro and Canadian Dollar as applied to our international cash balances.
Cash provided by operating activities declined by $0.5 million to $18.0 million in fiscal year 2008 from $18.5 million in fiscal year 2007. Cash provided from investing activities improved $3.2 million during fiscal year 2008 compared to fiscal year 2007 due to higher net proceeds from the disposition of available for sale securities, partially offset by more purchases of equipment and other capital assets. The effects of exchange rates on cash and cash equivalents decreased $5.7 million to $(3.1) million in fiscal year 2008 from $2.6 million in fiscal year 2007, primarily reflecting the decline in exchange rates for the British Pound, Euro and Canadian Dollar as applied to our international cash balances.
In fiscal year 2009, we generated $5.4 million of “free cash flow,” which we define as net cash provided by operating activities minus purchases of equipment, property and leasehold improvements. This compares to $11.1 million of free cash flow in fiscal year 2008. In fiscal year 2007, free cash flow was $13.0 million. We believe that free cash flow is useful for investors to understand our liquidity. Free cash flow is a non-GAAP financial measure and accordingly should be considered only as a supplement to, and not a replacement of, cash provided by operating activities as a measure of our liquidity. The following is a reconciliation of free cash flow to cash provided by operating activities computed in accordance with GAAP:
| Fiscal Year | ||||||||||||
| September 28, 2007 |
October 3, 2008 |
October 2, 2009 |
||||||||||
| Cash provided by operating activities |
$ | 18.5 | $ | 18.0 | $ | 7.5 | ||||||
| Less: Purchases of equipment, property and leasehold improvements |
(5.5 | ) | (6.9 | ) | (2.1 | ) | ||||||
| Free cash flow |
$ | 13.0 | $ | 11.1 | $ | 5.4 | ||||||
Liquidity. At October 2, 2009 our net working capital (current assets minus current liabilities) was $36.3 million, a $5.1 million increase from our working capital balance at October 3, 2008. The change in net working capital was primarily due to a $7.5 million decrease in cash and cash equivalents, a decrease in deferred revenue of $9.6 million, a decrease in trade accounts receivable of $4.5 million, sales of current available for sale securities of $3.9 million, a decrease in prepaids and other current assets of $3.1 million, a decrease of $2.7 million due to the after-tax effects of our accrual for the prior period claim explained above, and the reclassification of $14.5 million of available for sale securities from long term to current assets.
We have no outstanding debt or line-of-credit agreements. We anticipate we will continue to rely primarily on our balance of cash and cash equivalents on hand and cash flows from operations to finance our operating cash needs. We believe that such funds will be sufficient to satisfy our anticipated cash requirements for the foreseeable future.
At October 2, 2009, we had $17.0 million in face value of auction rate securities (“ARS”). This compares to $29.3 million in ARS at October 2, 2008. Our ARS are long-term debt instruments backed by municipal bonds and student loans. None of our ARS are mortgage-backed debt. All of our ARS had credit ratings of AAA or AA when purchased. Historically, our ARS were highly liquid, using a Dutch auction process that resets the applicable interest rates every 7, 28 or 35 days to provide liquidity at par. As a result of liquidity issues in the global credit and capital markets, it has been difficult to sell ARS in the open market. However, in fiscal year 2008, we did sell $15.8 million of our ARS at their stated value. In fiscal year 2009, we sold an additional $12.3 million of our ARS at their stated value. During the first quarter of fiscal year 2010, we sold an additional $0.1 million of our ARS at their stated value. We have signed a repurchase agreement with UBS under which we have
36
Table of Contents
the right to sell all of our remaining ARS at their stated value at any time during the period from June 30, 2010 through July 2, 2012.
We do not believe that the failure of periodic auctions affects the value of the collateral underlying our ARS, and there have been no defaults on the underlying collateral. We continue to earn and receive interest at contractually set rates in a timely manner. We can finance our operations even if our ARS investments were to be illiquid for an extended period of time.
Based on a valuation performed by an independent expert, Houlihan Smith & Company, Inc., we concluded there was a temporary impairment of $2.4 million in the fair value of our ARS as of October 2, 2009. This valuation is updated at the end of each quarter. Because we believe we will be able to redeem these securities at par in the foreseeable future, we do not consider the impairment to be other than temporary or to be permanent. In November 2008, three of our five ARS were downgraded by several credit agencies from AAA or AA to A, A1 or Baa1. At the end of our first quarter of fiscal year 2009, we updated our evaluation of our ARS based on the evaluation by our independent expert. As a result, the temporary impairment of our ARS increased from $2.6 million to $4.6 million. At the end of our second quarter of fiscal year 2009, based on the evaluation by our independent expert we increased the temporary impairment from $4.6 million to $5.2 million. At the end of our third quarter of fiscal year 2009, because one of our ARS was called on July 30, 2009 for full face value of $9.0 million and based on the evaluation of our remaining ARS by our independent expert, we decreased the temporary impairment from $5.2 million to $2.6 million. At the end of our fourth quarter of fiscal year 2009, based on the evaluation by our independent expert, we decreased the temporary impairment on our four remaining ARS from $2.6 million to $2.4 million. In fiscal year 2009, we recorded an increase on an after tax basis of $0.2 million to other comprehensive income to reflect the reduction in the impairment of the ARS.
Because we intend to exercise our right to sell all of our remaining ARS to UBS under the repurchase agreement within the next twelve months these ARS are classified as current assets as of October 2, 2009.
Capital Requirements. During fiscal year 2009, we made capital expenditures of $2.1 million for the purchase of equipment worldwide, mostly computers. We will continue to invest in our infrastructure to accommodate any increased customer demand, to continue improving the quality and effectiveness of our course delivery, and to incorporate significant changes in technology. We have a number of operating leases for our administrative offices and education center classroom facilities located worldwide. These leases expire at various dates over the next 10 years. In addition to requiring monthly payments for rent, some of the leases contain asset retirement provisions whereby we are required to return the leased facility back to a specified condition at the expiration of the lease.
The following table summarizes our contractual commitments at October 2, 2009:
| Payments Due by Period (in thousands) | |||||||||||||||
| Contractual Obligations |
Total | Less than 1 year (Fiscal 2010) |
1 - 2 years (Fiscal 2011 and 2012) |
3 - 5 years (Fiscal 2013 - 2015) |
More than 5 years (Fiscal 2016 - 2021) | ||||||||||
| Operating leases (i) |
$ | 74,863 | $ | 13,637 | $ | 20,433 | $ | 22,578 | $ | 18,215 | |||||
| Purchase commitments |
668 | 247 | 403 | 18 | — | ||||||||||
| Other lease contractual obligations (ii) |
8,165 | 38 | 665 | 262 | 7,200 | ||||||||||
| Total |
$ | 83,696 | $ | 13,922 | $ | 21,501 | $ | 22,858 | $ | 25,415 | |||||
| (i) | Amounts exclude future minimum sublease rental proceeds of $10.4 million due in the future under non-cancelable subleases. See Note 4 of “Notes to Consolidated Financial Statements” for further details. |
| (ii) | Represents estimated cash flows to satisfy contractual obligations to restore leased space to specified conditions at expiry of the leases. Amounts include $0.7 million expected to be recovered from subtenants. |
37
Table of Contents
OFF-BALANCE SHEET ARRANGEMENTS
We have no off-balance sheet arrangements that have or are reasonably likely to have a material current or future effect on our financial condition, changes in financial condition, revenues or expenses, results of operations, liquidity, capital expenditures or capital resources.
CRITICAL ACCOUNTING ESTIMATES AND POLICIES
Management’s discussion and analysis of our financial condition and results of operations is based upon our consolidated financial statements, which have been prepared in accordance with accounting principles generally accepted in the United States. The preparation of these financial statements requires management to make judgments, estimates and assumptions that affect the amounts reported in the financial statements and accompanying notes. Actual results could differ from those estimates. The following list of critical accounting estimates and policies is not intended to be a comprehensive list of all of our accounting policies. Our significant accounting policies are more fully described in Note 1 of “Notes to Consolidated Financial Statements.” The following represents a summary of our critical accounting estimates and policies, defined as those policies that we believe are the most important to the portrayal of our financial condition and results of operations, and/or require management’s significant judgments and estimates.
Critical Accounting Estimates
Revenue Recognition. We offer our customers a multiple-course sales discount referred to as a Learning Tree Training Passport. A Learning Tree Training Passport allows an individual Passport holder to attend up to a specified number of courses over a one- to two-year period for a fixed price. For a Training Passport, the amount of revenue recognized for each course attendance is based upon the selling price of the Training Passport, the list price of the course taken, the weighted average list price of all courses taken and the estimated average number of courses Passport holders will actually attend. Upon expiration of each individual Training Passport, we record the difference, if any, between the revenues previously recognized and that specific Training Passport’s selling price. The estimated attendance rate is based upon the historical experience of the average number of course events that Training Passport holders have been attending. The actual Training Passport attendance rate is reviewed at least semi-annually, and if the Training Passport attendance rates change, the revenue recognition rate for active Training Passports and for Training Passports sold thereafter is adjusted prospectively.
We believe it is appropriate to recognize revenues on this basis in order to most closely match revenue and related costs, as the substantial majority of our Passport holders do not attend the maximum number of course events permitted under their Training Passports. We believe that the use of recent historical data is reasonable and appropriate because of the relative stability of the average actual number of course events attended by Passport holders.
The average actual attendance rate for all expired Training Passports has closely approximated the estimated rate we utilize. Although we have seen no material changes in the historical rates as the number of course titles has changed, we monitor such potential effects. In general, determining the estimated average number of course events that will be attended by a Training Passport holder is based on historical trends that may not continue in the future. These estimates could differ in the near term from amounts used in arriving at the reported revenue. If the estimates are wrong, we would record the difference between the revenues previously recognized for that Training Passport and the Training Passport selling price upon expiration of that Training Passport. Thus, the timing of revenue recognition may be affected by an inaccurate estimation, but the inaccuracy would have no effect on the aggregate revenue recognized over the one- to two-year life of each Training Passport.
For newer Passport products for which historical utilization data is not available, we assume that the estimated average number of courses to be attended is equal to the number of courses available on the Passport. This assumed utilization rate may be revised in future periods after sufficient time has passed to amass historical trends.
38
Table of Contents
Allowance for Doubtful Accounts Receivable. Trade accounts receivable are reduced by an allowance for amounts that may become uncollectible in the future. We use estimates in determining the allowance for doubtful accounts receivable, based on our analysis of various factors, including our historical collection experience, current trends, specific identification of invoices which are considered doubtful and a percentage of our past due accounts receivable. Although our estimates for this reserve have in the past been reasonably accurate, these estimates could differ from actual collection experience and are subject to adjustment. Our trade accounts receivable are written off when they are deemed uncollectible.
Lease Termination Costs. We lease education center and administrative office space under various operating lease agreements. Certain of these operating leases include space that is not used and which is currently subleased. We calculate and record a liability related to those leases based on the difference between the present value of the net aggregate sublease rental income and the present value of the prime lease costs for the subleased space throughout the remaining term of the leases. Periodically, we evaluate the nature and extent of each of the individual provisions and make adjustments as appropriate, as new information becomes available or subsequent developments occur.
In 1999, we entered into a 20-year lease on a building in London to house our United Kingdom Education Center. This building has space in addition to that required for our current needs, which we attempt to sublet. When space is vacant from time to time, we must estimate the fair value of the liability for the vacant space based upon the remaining lease costs as defined by our operating lease agreement reduced by estimated future sublease rental income that could be reasonably obtained for the property based upon prevailing real estate market conditions. The computed long-term portion of such liabilities is recorded as deferred facilities rent in the accompanying consolidated financial statements with the short-term portion being recorded in other accrued liabilities. Amounts are paid under the master lease to the landlord, netted against subtenant sublease receipts, and applied to our accrued lease liability, reducing the amount of liability recorded with an offset to General and Administrative expenses.
Lease termination activities have historically resulted in accrued liabilities recorded in deferred facilities rent. However, due to the timing of payments due to landlords and payments due from subtenants, certain lease terminations have resulted in assets included in other assets at October 3, 2008 and October 2, 2009.
Asset Retirement Obligations. We record a liability equal to the fair value of the estimated future cost to retire an asset. For us, most asset retirement obligation (“ARO”) liabilities are primarily associated with education facilities leasehold improvements which, at the end of a lease, we are obligated to remove in order to restore the facility back to a condition specified in the lease agreement. At the inception of such a lease, we record the ARO as a liability and also record a leasehold improvement asset in an amount equal to the fair value of the liability. The capitalized leasehold improvement asset is then depreciated on a straight-line basis over 20 years or the term of the lease, whichever is shorter. Any difference between the actual costs incurred for the eventual retirement and the estimated liability previously recorded will be recognized as a gain or loss in our statement of operations at the termination of the lease.
The fair value of any such ARO liability is estimated in three steps: (1) the costs of leasehold restoration are estimated as if they were to be performed at the inception of the lease, (2) the cost is forecast into the future by applying an inflation rate in effect at the time of adoption together with a market-risk premium for a contractor’s risk for performing the work in the future, and (3) the present value of this future cost is computed by discounting it at our credit worthiness interest rate (determined at the inception of the lease).
The ARO liability is subsequently increased annually by interest accretion throughout the term of the lease. In future periods we may also make adjustments to the ARO liability as a result of the availability of new information, technology changes, changes in labor costs and other factors. The estimate of the ARO liability is based on a number of assumptions requiring professional judgment. We cannot predict what revisions to these assumptions will be required in future periods.
39
Table of Contents
The ARO liability is based on a number of assumptions requiring professional judgment. These include estimates for: (1) expected future cash flows related to contractual obligations, primarily to restore leased space back to open floor layouts as required by the lease agreements; (2) our credit-adjusted risk free rate that considers our estimated credit rating as of the date of lease inception; (3) the market risk premium that we determine based on the length of the individual leases; and (4) the relevant inflation factor in each affected country. For the more significant AROs we obtain third-party restoration estimates specific to those leases. We cannot predict the type of revisions to these assumptions that will be required in future periods due to the availability of additional information, technology changes, the price of labor costs and other factors.
Critical Accounting Policies
Revenue Recognition. Learning Tree course events range from two to five days, with an average duration of approximately four days. We use a 52- or 53-week fiscal year in order to better align our external financial reporting with the way we operate our business. Under this method, each fiscal quarter ends on the Friday closest to the end of the calendar quarter. Since all courses have a duration of five days or less, and all courses begin and end within the same calendar week, under the 52- or 53-week fiscal year method all revenues and related direct costs for each course event are recognized in the week and the fiscal quarter in which the event takes place.
We offer our customers a multiple-course sales discount referred to as a Learning Tree Training Passport. A Learning Tree Training Passport allows an individual Passport holder to attend up to a specified number of courses over a one- to two-year period for a fixed price. For a Training Passport, the amount of revenue recognized for each attendance in a course is based upon the selling price of the Training Passport, the list price of the course taken, the weighted average list price of all courses taken and the estimated average number of courses Passport holders will actually attend. Upon expiration of each individual Training Passport, we record the difference, if any, between the revenues previously recognized and that specific Training Passport’s selling price. The estimated attendance rate is based upon the historical experience of the average number of course events that Training Passport holders have been attending. The actual Training Passport attendance rate is reviewed at least semi-annually, and if the Training Passport attendance rates change, the revenue recognition rate for active Training Passports and for Training Passports sold thereafter is adjusted prospectively.
We believe it is appropriate to recognize revenues on this basis in order to most closely match revenue and related costs, as the substantial majority of our Passport holders do not attend the maximum number of course events permitted under their Training Passports. We believe that the use of recent historical data is reasonable and appropriate because of the relative stability of the average actual number of course events attended by Passport holders.
The average actual attendance rate for all expired Training Passports has closely approximated the estimated rate we utilize. Although we have seen no material changes in the historical rates as the number of course titles has changed, we monitor such potential effects. In general, determining the estimated average number of course events that will be attended by a Training Passport holder is based on historical trends that may not continue in the future. These estimates could differ in the near term from amounts used in arriving at the reported revenue. If the estimates are wrong, we would record the difference between the revenues previously recognized for that Training Passport and the Training Passport selling price upon expiration of that Training Passport. Thus, the timing of revenue recognition may be affected by an inaccurate estimation, but the inaccuracy would have no effect on the aggregate revenue recognized over the one- to two-year life of each Training Passport.
For newer Passport products for which historical utilization data is not available, we assume that the estimated average number of courses to be attended is equal to the number of courses available on the Passport. This assumed utilization rate may be revised in future periods after sufficient time has passed to amass historical trends.
In addition to our Learning Tree Training Passports, we also offer a multiple-course sales discount referred to as Learning Tree Training Vouchers. With Learning Tree Training Vouchers, a customer buys the right to send
40
Table of Contents
a specified number of attendees to Learning Tree courses over a six- to twelve-month period for a fixed price. Revenue is recognized on a pro rata basis for each attendance. If a Training Voucher has unused seats at the time of expiration of the Voucher, we record the pro rata selling price of the expired unused seat as revenue. At times we make a business decision to extend a voucher beyond the normal 12-month expiration date.
To provide additional flexibility to meet our customers’ training needs, we offer a multiple-training day sales discount referred to as Learning Tree 10-Day Passes. With Learning Tree 10-Day Passes, a customer buys the right to take up to 10 days of training over a one-year period for a fixed price. Revenue is recognized on a pro-rata basis for each attendance day. If a 10-Day Pass has unused days at expiration, we record the pro-rata value of the unused days as revenue.
Stock-Based Compensation. We estimate the fair value of share-based payment awards on the date of grant using an option-pricing model. The value of the portion of the award that is ultimately expected to vest is recognized as expense over the requisite service periods in our consolidated statements of operations. Our determination of fair value of share-based payment awards on the date of grant using an option-pricing model is affected by assumptions regarding a number of variables including our expected stock price volatility, expected term and risk-free interest rates.
We analyzed our historical volatility to estimate the expected volatility. The risk-free interest rate assumption is based on the U.S. Treasury rate at the date of grant, which most closely resembles the expected life of our options. The estimated expected life represents the weighted-average period the stock options are expected to remain outstanding and has been determined based on the simplified method under ASC 718. We do not have sufficient historical exercise data to provide a reasonable basis upon which to estimate expected term.
As stock-based compensation expense recognized in the consolidated statements of operations is based on awards ultimately expected to vest, it has been reduced for estimated pre-vesting forfeitures. Forfeitures were estimated based on historical experience. During fiscal year 2009, we reduced to zero the estimated forfeiture rate for executive personnel.
Long-Lived Assets. We periodically review the carrying value of our long-lived assets, such as equipment, property and leasehold improvements, for impairment whenever events or changes in circumstances indicate that the carrying value may not be recoverable. In making such evaluations, we compare the expected future cash flows to the carrying amount of the assets. If the total of the expected future cash flows is less than the carrying amount of the assets, we are required to make estimates of the fair value of the long-lived assets in order to calculate the impairment loss equal to the difference between the fair value and the carrying value of the assets. We make significant assumptions and estimates in this process regarding matters that are inherently uncertain, such as estimating cash flows, remaining useful lives, discount rates and growth rates. The resulting cash flows are computed over an extended period of time, which subjects those assumptions and estimates to an even larger degree of uncertainty. While we believe that our estimates are reasonable, different assumptions regarding such cash flows could materially affect the valuation of long-lived assets.
Income Taxes. We provide for income taxes under the provisions of FASB ASC 740, Income Taxes. Deferred income taxes result from temporary differences between the tax basis of assets and liabilities and the basis reported in our consolidated financial statements. Deferred tax liabilities and assets are determined based on the difference between financial statement and tax basis of assets and liabilities using enacted rates expected to be in effect during the year in which the differences reverse. We must then also assess the likelihood that our deferred tax assets will be recovered from future taxable income, and, to the extent we believe that it is more likely than not that some portion or all of our deferred tax assets will not be realized, we must establish a valuation allowance. To the extent we establish a valuation allowance or change the allowance in a period, we must reflect the corresponding increase or decrease within the tax provision in the statement of operations.
In July 2006, the FASB issued Interpretation No. 48, Accounting for Uncertainty in Income Taxes (“FIN 48”; codified primarily in FASB ASC 740, Income Taxes). FIN 48 clarifies the accounting for income
41
Table of Contents
taxes by prescribing the minimum recognition threshold a tax position is required to meet before being recognized in the financial statements. FIN 48 is effective for fiscal years beginning after December 15, 2006.
As of the beginning of fiscal year 2008, we adopted FIN 48. The cumulative effect of the adoption was a $1.2 million reduction to retained earnings. As of the date of adoption, the amount of unrecognized tax benefits was $1.4 million, all of which would have an impact on our effective tax rate if recognized. Our continuing practice is to recognize interest and penalties related to income tax matters in income tax expense. As of the date of adoption, we had $0.6 million accrued for interest and $0.6 million accrued for penalties.
OUTLOOK
Effect of Exchange Rates. One of the effects of the recent economic turmoil was the sudden strengthening of the U.S. dollar during our first and second fiscal quarters of 2009 and its subsequent weakening which has continued into our first fiscal quarter of 2010. Approximately half of our business annually is conducted in currencies other than U.S. dollars and fluctuations in exchange rates will affect future revenues and expenses when translated into dollars. If the exchange rates of December 4, 2009 remain constant for the remainder of our first quarter of fiscal year 2010, we would expect to report a favorable effect of approximately 5.0% on our revenues during our first quarter of fiscal year 2010 compared to the same quarter of fiscal year 2009. We would see an unfavorable, though lesser, effect on our overall expenses. The effect of changes in foreign exchange rates is somewhat less pronounced on operating expenses than on revenues and cost of sales, primarily since our operating expenses are more heavily dollar-denominated, largely because of corporate management and our centralized IT, marketing and course development activities which are located here in the United States and which support our worldwide operations.
Revenues. We currently expect revenues for our first quarter of fiscal year 2010 of between $31.5 million and $33.0 million, which would represent a reduction of between 13% and 17% from revenues of $38.0 million in our first quarter of fiscal year 2009. This includes the 5.0% positive effect of changes in foreign exchange rates.
First Quarter Gross Profit. We expect a gross profit percentage in our first quarter of fiscal year 2010 of between 54.5% and 55.5% compared to 57.0% in our first quarter of fiscal year 2009, largely because the fixed costs of our education centers and classroom equipment will be allocated to fewer expected events this year compared to the same quarter of our prior fiscal year, and because we expect to have somewhat fewer participants per event in our first quarter of fiscal year 2010 than in our first quarter of fiscal year 2009.
First Quarter Operating Expenses. We expect overall operating expenses for our first quarter of fiscal year 2010 to be between $14.5 million and $15.5 million, a reduction of between 18.0% and 24.0% compared to $19.0 million in the same quarter a year earlier.
First Quarter Income From Operations. As a result of the above factors, we expect first quarter operating income of between $2.0 million and $3.5 million compared with $2.7 million in our first quarter of fiscal year 2009.
First Quarter Interest Income. We expect first quarter interest income to be approximately $0.2 million.
First Quarter Pre-Tax Income. Overall, we expect to report pre-tax income for our first quarter of fiscal year 2010 of between $2.2 million and $3.7 million, compared with $3.1 million in the first quarter of our prior fiscal year.
Effective Tax Rate. We estimate that our effective tax rate in our first quarter of fiscal year 2010 will be approximately 39.4%.
42
Table of Contents
| Item 7A. | QUANTITATIVE AND QUALITATIVE DISCLOSURES ABOUT MARKET RISK |
We are exposed to market risk from changes in interest rates and foreign currency exchange rates. For purposes of specific risk analysis, we use sensitivity analysis to determine the effects that market risk exposures may have.
Interest Rate Risk. Our cash equivalents and available for sale securities are diversified and consist primarily of investment grade securities of high-quality financial institutions and corporations. The fair value of our portfolio of marketable securities would not be significantly affected by either a 10% increase or decrease in the rates of interest due primarily to the short-term nature of the portfolio. We do not hold or issue derivative financial instruments.
Foreign Currency Risk. We are exposed to the impact of foreign currency fluctuations. The exposure to exchange rates relates primarily to our foreign subsidiaries. Subsidiaries with material foreign currency exposure are in Canada, the United Kingdom, Sweden and France. For our foreign subsidiaries, exchange rates can have an impact on the United States Dollar value of their reported earnings as well as on the intercompany transactions with the United States and other subsidiaries.
Our consolidated financial statements are prepared in United States Dollars, while the operations of our foreign subsidiaries are conducted in their respective local currencies. Fluctuations in the value of foreign currencies against the United States Dollar may have a significant impact on our reported results. Revenues and expenses denominated in foreign currencies are translated monthly into United States Dollars at the weighted average exchange rate. Consequently, as the value of the Dollar strengthens or weakens relative to other currencies in our major markets the resulting translated revenues, expenses and operating profits become lower or higher, respectively. A hypothetical appreciation of the Canadian Dollar, Euro, British Pound and Swedish Krona of 10% would result in a $0.3 million increase to our consolidated fiscal year 2009 results. This was estimated using a 10% appreciation factor to the average monthly exchange rates applied to the net income or loss for each of our subsidiaries in the respective period.
Fluctuations in currency exchange rates also can have an impact on the United States Dollar amount of our stockholders’ equity. The assets and liabilities of our non U.S. subsidiaries are translated into United States Dollars at the exchange rate of the Balance Sheet for the respective reporting period. The resulting translation adjustments are recorded in stockholders’ equity as accumulated other comprehensive income or loss. Due to unfavorable changes in the U.S. Dollar relative to the Canadian Dollar, the Euro, the British Pound and the Swedish Krona, the foreign currency translation component of accumulated other comprehensive income declined $0.4 million during fiscal year 2009.
Additionally, we are exposed to the impact of foreign currency gains or losses due to short term intercompany transactions between the United States and its consolidated subsidiaries. While these intercompany balances are eliminated in consolidation, exchange rate changes do affect consolidated earnings. These balances generated a foreign exchange loss of $0.3 million in fiscal year 2009. To perform a sensitivity analysis, we assessed the risk of loss in fair values from the effect of a hypothetical 10% change in the value of foreign currencies, assuming no change in interest rates. As of October 2, 2009, the result of a uniform 10% change in the values of foreign currency exchange rates against the United States Dollar for intercompany exposures with all other variables held constant would be immaterial to our results of operations.
To date, we have not sought to hedge the risks associated with fluctuations in exchange rates. In the future, we may undertake such transactions; however, any hedging techniques we might implement might not be successful in eliminating or reducing the effects of currency fluctuations.
Credit Risk. Financial instruments that potentially subject us to concentrations of credit risk consist primarily of investments in available for sale securities, restricted interest bearing long-term investments and trade accounts receivable. We have policies that limit investments to investment grade securities and the amount
43
Table of Contents
of credit exposure to any one issuer. We do not require collateral or other security to support client receivables since most of our customers are large, well-established companies and government agencies. Our credit risk is also mitigated because our customer base is diversified both by geography and industry, and no single customer accounted for more than 10% of our consolidated revenues on an annual or quarterly basis. We maintain an allowance for doubtful accounts for any potential credit losses related to our trade receivables. We do not use foreign exchange contracts to hedge the risk in receivables denominated in foreign currencies and we do not hold or issue derivative financial instruments for trading or speculative purposes.
As discussed in Note 1 of “Notes to Consolidated Financial Statements” and in the Liquidity and Capital Resources section, we held $17.0 million in ARS at October 2, 2009. Due to the turmoil in the worldwide credit markets since mid February 2008, we were not able to sell these securities in the scheduled auctions that occur every 7, 28 or 35 days. Since the end of fiscal year 2009, we have sold $0.1 million of our ARS that were redeemed at their stated value pursuant to a repurchase agreement with UBS under which we have the right to sell our remaining $16.9 million of ARS at their stated value at any time during the period from June 30, 2010 through July 2, 2012.
44
Table of Contents
| Item 8. | FINANCIAL STATEMENTS AND SUPPLEMENTARY DATA |
LEARNING TREE INTERNATIONAL, INC. AND SUBSIDIARIES
INDEX TO CONSOLIDATED FINANCIAL STATEMENTS
| Page | ||
| 46 | ||
| Consolidated Balance Sheets at October 3, 2008 and October 2, 2009 |
47 | |
| 48 | ||
| 49 | ||
| 50 | ||
| 51 | ||
45
Table of Contents
REPORT OF INDEPENDENT REGISTERED PUBLIC ACCOUNTING FIRM
Board of Directors and Stockholders
Learning Tree International, Inc.
Reston, Virginia
We have audited the accompanying consolidated balance sheets of Learning Tree International, Inc. and subsidiaries as of October 2, 2009 and October 3, 2008 and the related consolidated statements of operations, stockholders’ equity and comprehensive income, and cash flows for each of the three years in the period ended October 2, 2009. These financial statements are the responsibility of the Company’s management. Our responsibility is to express an opinion on these financial statements based on our audits.
We conducted our audits in accordance with the standards of the Public Company Accounting Oversight Board (United States). Those standards require that we plan and perform the audit to obtain reasonable assurance about whether the financial statements are free of material misstatement. An audit includes examining, on a test basis, evidence supporting the amounts and disclosures in the financial statements, assessing the accounting principles used and significant estimates made by management, as well as evaluating the overall financial statement presentation. We believe that our audits provide a reasonable basis for our opinion.
In our opinion, the consolidated financial statements referred to above present fairly, in all material respects, the financial position of Learning Tree International, Inc. and subsidiaries at October 2, 2009 and October 3, 2008, and the results of their operations and their cash flows for each of the three years in the period ended October 2, 2009, in conformity with accounting principles generally accepted in the United States of America.
As discussed in Note 3 of the consolidated financial statements, effective September 29, 2007, the Company adopted the provisions of FASB Interpretation No. 48, Accounting for Uncertainty in Income Taxes—an interpretation of FASB Statement No. 109 (codified primarily in FASB ASC 740, Income Taxes).
We also have audited, in accordance with the standards of the Public Company Accounting Oversight Board (United States), the effectiveness of Learning Tree International, Inc. and subsidiaries’ internal control over financial reporting as of October 2, 2009, based on criteria established in Internal Control—Integrated Framework issued by the Committee of Sponsoring Organizations of the Treadway Commission (COSO) and our report dated December 16, 2009 expressed an unqualified opinion thereon.
/s/ BDO Seidman, LLP
Bethesda, Maryland
December 16, 2009
46
Table of Contents
LEARNING TREE INTERNATIONAL, INC. AND SUBSIDIARIES
CONSOLIDATED BALANCE SHEETS
(amounts in thousands, except share and per share data)
| October 3, 2008 |
October 2, 2009 |
|||||||
| Assets |
||||||||
| Current Assets: |
||||||||
| Cash and cash equivalents |
$ | 51,853 | $ | 44,313 | ||||
| Available for sale securities |
18,909 | 29,497 | ||||||
| Trade accounts receivable, less allowances of $194 and $224, respectively |
19,685 | 15,157 | ||||||
| Income tax receivable |
2,475 | 265 | ||||||
| Prepaid expenses |
4,750 | 4,601 | ||||||
| Deferred income taxes |
— | 1,461 | ||||||
| Other current assets |
3,622 | 1,449 | ||||||
| Total current assets |
101,294 | 96,743 | ||||||
| Equipment, Property and Leasehold Improvements: |
||||||||
| Education and office equipment |
42,658 | 40,379 | ||||||
| Transportation equipment |
206 | 231 | ||||||
| Property and leasehold improvements |
27,663 | 28,134 | ||||||
| 70,527 | 68,744 | |||||||
| Less: accumulated depreciation and amortization |
(46,523 | ) | (49,068 | ) | ||||
| 24,004 | 19,676 | |||||||
| Available for sale securities |
23,440 | — | ||||||
| Restricted interest-bearing investments |
10,222 | 9,387 | ||||||
| Deferred income taxes |
11,080 | 9,558 | ||||||
| Other assets |
2,384 | 1,456 | ||||||
| Total assets |
$ | 172,424 | $ | 136,820 | ||||
| Liabilities |
||||||||
| Current Liabilities: |
||||||||
| Trade accounts payable |
$ | 9,915 | $ | 8,229 | ||||
| Deferred revenues |
47,712 | 38,103 | ||||||
| Accrued payroll, benefits and related taxes |
4,921 | 4,023 | ||||||
| Other accrued liabilities |
5,254 | 7,831 | ||||||
| Income taxes payable |
1,011 | 1,091 | ||||||
| Current portion of deferred facilities rent |
1,063 | 1,153 | ||||||
| Deferred income taxes |
189 | — | ||||||
| Total current liabilities |
70,065 | 60,430 | ||||||
| Asset retirement obligations |
3,319 | 3,458 | ||||||
| Deferred income taxes |
277 | 283 | ||||||
| Deferred facilities rent |
5,650 | 4,756 | ||||||
| Noncurrent tax liabilities |
6,715 | 5,031 | ||||||
| Total liabilities |
86,026 | 73,958 | ||||||
| Commitments and contingencies |
||||||||
| Stockholders’ Equity |
||||||||
| Preferred Stock, $.0001 par value; 10,000,000 shares authorized; 0 shares issued and outstanding |
— | — | ||||||
| Common Stock, $.0001 par value; 75,000,000 shares authorized; 16,556,607 and 13,942,750 shares issued and outstanding, respectively |
2 | 1 | ||||||
| Additional paid-in capital |
3,220 | 3,875 | ||||||
| Accumulated other comprehensive loss |
(852 | ) | (1,085 | ) | ||||
| Retained earnings |
84,028 | 60,071 | ||||||
| Total stockholders’ equity |
86,398 | 62,862 | ||||||
| Total liabilities and stockholders’ equity |
$ | 172,424 | $ | 136,820 | ||||
The accompanying notes are an integral part of these consolidated financial statements.
47
Table of Contents
LEARNING TREE INTERNATIONAL, INC. AND SUBSIDIARIES
CONSOLIDATED STATEMENTS OF OPERATIONS
(amounts in thousands, except per share data)
| Fiscal Year Ended | |||||||||||
| September 28, 2007 |
October 3, 2008 |
October 2, 2009 |
|||||||||
| Revenues |
$ | 167,193 | $ | 181,278 | $ | 132,559 | |||||
| Cost of revenues |
72,936 | 76,807 | 59,243 | ||||||||
| Gross profit |
94,257 | 104,471 | 73,316 | ||||||||
| Operating expenses: |
|||||||||||
| Course development |
8,613 | 9,656 | 7,442 | ||||||||
| Sales and marketing |
41,094 | 43,596 | 31,962 | ||||||||
| General and administrative |
30,041 | 33,532 | 31,929 | ||||||||
| 79,748 | 86,784 | 71,333 | |||||||||
| Income from operations |
14,509 | 17,687 | 1,983 | ||||||||
| Other income (expense), net: |
|||||||||||
| Interest income, net |
3,940 | 4,133 | 1,502 | ||||||||
| Foreign exchange gains (losses) |
196 | (373 | ) | (347 | ) | ||||||
| Other |
100 | 241 | (107 | ) | |||||||
| 4,236 | 4,001 | 1,048 | |||||||||
| Income before provision for income taxes |
18,745 | 21,688 | 3,031 | ||||||||
| Provision for income taxes |
1,755 | 7,888 | 1,828 | ||||||||
| Net income |
$ | 16,990 | $ | 13,800 | $ | 1,203 | |||||
| Income per common share—basic |
$ | 1.03 | $ | 0.84 | $ | 0.08 | |||||
| Income per common share—diluted |
$ | 1.03 | $ | 0.83 | $ | 0.08 | |||||
| Weighted average shares outstanding—basic |
16,498 | 16,516 | 15,181 | ||||||||
| Weighted average shares outstanding—diluted |
16,498 | 16,580 | 15,181 | ||||||||
The accompanying notes are an integral part of these consolidated financial statements.
48
Table of Contents
LEARNING TREE INTERNATIONAL, INC. AND SUBSIDIARIES
CONSOLIDATED STATEMENTS OF STOCKHOLDERS’ EQUITY
AND COMPREHENSIVE INCOME
(amounts in thousands)
| Common Stock | Additional Paid-In Capital |
Accumulated Other Comprehensive Income (Loss) |
Retained Earnings |
Total Stockholders’ Equity |
|||||||||||||||||||
| Shares Outstanding |
Amount | ||||||||||||||||||||||
| Balance, September 29, 2006 |
16,496 | $ | 2 | $ | 1,042 | $ | 1,424 | $ | 54,466 | $ | 56,934 | ||||||||||||
| Comprehensive income: |
|||||||||||||||||||||||
| Net income |
— | — | — | — | 16,990 | 16,990 | |||||||||||||||||
| Foreign currency translation |
— | — | — | 2,198 | — | 2,198 | |||||||||||||||||
| Comprehensive income |
19,188 | ||||||||||||||||||||||
| Stock options exercised |
12 | — | 155 | — | — | 155 | |||||||||||||||||
| Share based compensation |
— | — | 967 | — | — | 967 | |||||||||||||||||
| Deferred tax option adjustment |
— | — | (36 | ) | — | — | (36 | ) | |||||||||||||||
| Restricted stock grants |
26 | — | — | — | — | — | |||||||||||||||||
| Balance, September 28, 2007 |
16,534 | 2 | 2,128 | 3,622 | 71,456 | 77,208 | |||||||||||||||||
| Comprehensive income: |
|||||||||||||||||||||||
| Net income |
— | — | — | — | 13,800 | 13,800 | |||||||||||||||||
| Unrealized loss on available-for sale securities, net of tax |
— | — | — | (1,595 | ) | — | (1,595 | ) | |||||||||||||||
| Foreign currency translation |
— | — | — | (2,879 | ) | — | (2,879 | ) | |||||||||||||||
| Comprehensive income |
9,326 | ||||||||||||||||||||||
| Stock options exercised |
2 | — | 24 | — | — | 24 | |||||||||||||||||
| Share based compensation |
— | — | 1,068 | — | — | 1,068 | |||||||||||||||||
| FIN 48 adoption |
— | — | — | — | (1,228 | ) | (1,228 | ) | |||||||||||||||
| Restricted stock grants |
21 | — | — | — | — | — | |||||||||||||||||
| Balance, October 3, 2008 |
16,557 | 2 | 3,220 | (852 | ) | 84,028 | 86,398 | ||||||||||||||||
| Comprehensive income: |
|||||||||||||||||||||||
| Net income |
— | — | — | — | 1,203 | 1,203 | |||||||||||||||||
| Unrealized gain on available-for sale securities, net of tax |
— | — | — | 187 | — | 187 | |||||||||||||||||
| Foreign currency translation |
— | — | — | (420 | ) | — | (420 | ) | |||||||||||||||
| Comprehensive income |
970 | ||||||||||||||||||||||
| Share based compensation |
— | — | 655 | — | — | 655 | |||||||||||||||||
| Restricted stock grants |
28 | — | — | — | — | — | |||||||||||||||||
| Stock repurchases |
(2,642 | ) | (1 | ) | (25,160 | ) | (25,161 | ) | |||||||||||||||
| Balance, October 2, 2009 |
13,943 | $ | 1 | $ | 3,875 | $ | (1,085 | ) | $ | 60,071 | $ | 62,862 | |||||||||||
The accompanying notes are an integral part of these consolidated financial statements.
49
Table of Contents
LEARNING TREE INTERNATIONAL, INC. AND SUBSIDIARIES
CONSOLIDATED STATEMENTS OF CASH FLOWS
(amounts in thousands)
| Fiscal Year Ended | ||||||||||||
| September 28, 2007 |
October 3, 2008 |
October 2, 2009 |
||||||||||
| Cash flows—operating activities: |
||||||||||||
| Net income |
$ | 16,990 | $ | 13,800 | $ | 1,203 | ||||||
| Adjustments to reconcile net income to net cash provided by operating activities: |
||||||||||||
| Depreciation and amortization |
6,529 | 6,522 | 6,061 | |||||||||
| Share based compensation |
967 | 1,068 | 655 | |||||||||
| Deferred income taxes |
(3,575 | ) | 382 | (139 | ) | |||||||
| Provision for doubtful accounts |
(45 | ) | 103 | 151 | ||||||||
| Accretion of asset retirement obligations |
326 | 201 | 180 | |||||||||
| Loss on disposals of equipment and leasehold improvements |
304 | 10 | 47 | |||||||||
| Gain on liquidation of Investment in Collegis, Inc |
(418 | ) | (232 | ) | — | |||||||
| Unrealized foreign exchange (gain) loss |
(29 | ) | 411 | (6 | ) | |||||||
| Deferred facilities rent and other charges |
212 | (98 | ) | (711 | ) | |||||||
| Gain on settlement of asset retirement obligation |
— | (86 | ) | — | ||||||||
| Change in operating assets and liabilities: |
||||||||||||
| Trade accounts receivable |
(2,118 | ) | (1,255 | ) | 4,365 | |||||||
| Prepaid expenses and other assets |
2,102 | (620 | ) | 3,262 | ||||||||
| Income taxes receivable / payable |
(2,839 | ) | (924 | ) | 708 | |||||||
| Trade accounts payable |
(848 | ) | (2,059 | ) | (1,345 | ) | ||||||
| Deferred revenues |
278 | 342 | (8,662 | ) | ||||||||
| Asset retirement obligations |
(1,482 | ) | 49 | — | ||||||||
| Other accrued liabilities |
2,206 | 417 | 1,725 | |||||||||
| Net cash provided by operating activities |
18,560 | 18,031 | 7,494 | |||||||||
| Cash flows—investing activities: |
||||||||||||
| Purchases of equipment, property and leasehold improvements |
(5,466 | ) | (6,859 | ) | (2,134 | ) | ||||||
| Purchases of available for sale securities |
(16,725 | ) | (24,601 | ) | (8,587 | ) | ||||||
| Sales of available for sale securities |
5,750 | 18,350 | 21,466 | |||||||||
| Sales of equipment and leasehold improvements |
34 | 59 | 2 | |||||||||
| Liquidation of Investment in Collegis, Inc |
418 | 232 | — | |||||||||
| Net cash (used in) provided by investing activities |
(15,989 | ) | (12,819 | ) | 10,747 | |||||||
| Cash flows—financing activities: |
||||||||||||
| Repurchases of common stock |
— | — | (25,161 | ) | ||||||||
| Proceeds from exercise of stock options |
155 | 24 | — | |||||||||
| Net cash provided by (used in) financing activities |
155 | 24 | (25,161 | ) | ||||||||
| Effects of exchange rates on cash and cash equivalents |
2,605 | (3,115 | ) | (620 | ) | |||||||
| Net increase (decrease) in cash and cash equivalents |
5,331 | 2,121 | (7,540 | ) | ||||||||
| Cash and cash equivalents at the beginning of the fiscal year |
44,401 | 49,732 | 51,853 | |||||||||
| Cash and cash equivalents at the end of the fiscal year |
$ | 49,732 | $ | 51,853 | $ | 44,313 | ||||||
| Supplemental disclosures: |
||||||||||||
| Income taxes paid |
$ | 5,000 | $ | 13,169 | $ | 4,616 | ||||||
| Interest paid |
$ | 3 | $ | 4 | $ | 1 | ||||||
The accompanying notes are an integral part of these consolidated financial statements.
50
Table of Contents
LEARNING TREE INTERNATIONAL, INC. AND SUBSIDIARIES
NOTES TO CONSOLIDATED FINANCIAL STATEMENTS
(amounts in thousands, except share and per share data)
| 1. | NATURE OF THE BUSINESS AND SUMMARY OF SIGNIFICANT ACCOUNTING POLICIES |
| a. | Nature of the Business |
Learning Tree International, Inc. and subsidiaries (“we”) develop, market and deliver a broad proprietary library of instructor-led classroom courses which are designed to meet the professional development needs of managers and information technology (“IT”) professionals worldwide. These courses are delivered primarily at our leased education centers located in the United States, the United Kingdom, Canada, France, Sweden and Japan. Such course events are also conducted in hotel and conference facilities and at customer sites throughout the world. In fiscal year 2009 we began offering some of our courses to individuals located worldwide through Learning Tree AnyWare, our patent-pending e-Learning interface that allows individuals at any location to attend a live instructor-led Learning Tree class via the Internet. Our courses provide both breadth and depth of education across a wide range of technical and management disciplines, including operating systems, databases, computer networks, computer and network security, web development, programming languages, software engineering, open source applications, project management, business skills, and leadership and professional development.
We follow a 52- or 53-week fiscal year-end date from September 30th to the Friday nearest the end of the month of September. Our year-end and quarter-end dates are on the Friday nearest the end of the calendar quarter. Accordingly, our fiscal year 2007 ended on September 28, 2007, our fiscal year 2008 ended on October 3, 2008, and our fiscal year 2009 ended on October 2, 2009. Thus, these consolidated financial statements report our consolidated financial position as of October 3, 2008, and October 2, 2009 and the related consolidated statements of operations, stockholders’ equity and comprehensive income and cash flows for the fiscal years ended September 28, 2007, October 3, 2008 and October 2, 2009. Fiscal years 2007 and 2009 were 52-week years, while fiscal year 2008 was a 53-week year.
| b. | Principles of Consolidation |
The accompanying consolidated financial statements include the accounts of Learning Tree International, Inc. and our subsidiaries. All significant intercompany accounts and transactions have been eliminated. The following is a summary of our subsidiaries:
Learning Tree International USA, Inc. (U.S.)
Learning Tree International, K.K. (Japan)
Learning Tree International, Ltd. (United Kingdom)
Learning Tree Limited (United Kingdom)
Learning Tree International S.A. (France)
Learning Tree International AB (Sweden)
Learning Tree International Inc. (Canada)
Learning Tree International Ltd. (Hong Kong)
Advanced Technology Marketing, Inc. (U.S.)
| c. | Revenue Recognition and Accounts Receivable |
Our revenues are received from business entities and government agencies for the professional training of their employees. Course events range in length from two to five days, and average approximately four days. As stated above, we follow a 52- or 53-week fiscal year. This method is used in order to better align our external
51
Table of Contents
financial reporting with the way we operate our business. Under this method, each fiscal quarter ends on the Friday closest to the end of the calendar quarter. Since all courses have a duration of five days or less, and all courses begin and end within the same calendar week, under the 52- or 53-week fiscal year method all revenues and related direct costs for each course event are recognized in the week and the fiscal quarter in which the event takes place.
We offer our customers a multiple-course sales discount referred to as a “Learning Tree Training Passport.” A Learning Tree Training Passport allows an individual Passport holder to attend up to a specified number of Learning Tree courses over a one or two-year period for a fixed price. For a Training Passport, the amount of revenue recognized for each attendance in a course is based upon the selling price of the Training Passport, the list price of the course taken, the weighted average list price of all courses taken and the estimated average number of courses Passport holders will actually attend. Upon expiration of each individual Training Passport, we record the difference, if any, between the revenues previously recognized and that specific Training Passport’s selling price. The estimated attendance rate is based upon the historical experience of the average number of course events that Training Passport holders have been attending. The actual Training Passport attendance rate is reviewed at least semi-annually, and if the Training Passport attendance rates change the revenue recognition rate for active Training Passports and for Training Passports sold thereafter is adjusted prospectively.
We believe it is appropriate to recognize revenues on this basis in order to most closely match revenue and related costs, as the substantial majority of our Passport holders do not attend the maximum number of course events permitted under their Training Passport. We believe that the use of recent historical data is reasonable and appropriate because of the relative stability of the average actual number of course events attended by Passport holders.
The average attendance rate for all expired Training Passports has closely approximated the estimated rate we utilize. Although we have seen no material changes in the historical rates as the number of course titles has changed, we monitor such potential effects. In general, determining the estimated average number of course events that will be attended by a Training Passport holder is based on historical trends that may not continue in the future. These estimates could differ in the near term from amounts used in arriving at the reported revenue. If the estimates are wrong, we would record the difference between the revenues previously recognized for that Training Passport and the Training Passport selling price upon expiration of that Training Passport. Thus, the timing of revenue recognition may be affected by an inaccurate estimation, but the inaccuracy would have no effect on the aggregate revenue recognized over the one- to two-year life of each Training Passport.
For newer Passport products for which historical utilization data is not available, we assume that the estimated average number of courses to be attended is equal to the number of courses available on the Passport. This assumed utilization rate may be revised in future periods after sufficient time has passed to amass historical trends.
In addition to our Learning Tree Training Passports, we also offer a multiple-course sales discount referred to as Learning Tree Training Vouchers. With Learning Tree Training Vouchers, a customer buys the right to send a specified number of attendees to Learning Tree courses over a six to twelve-month period for a fixed price. Revenue is recognized on a pro rata basis for each attendance. For the majority of Training Vouchers with unused seats at the expiration of the Voucher, we record the pro rata selling price of the expired unused seats as revenue. At times we make a business decision to extend a Voucher beyond the normal twelve month expiration date. Certain Training Vouchers purchased under government rate schedules have no expiration date.
To provide additional flexibility to meet our customers’ training needs, we offer a multiple-training day sales discount referred to as Learning Tree 10-Day Passes. With Learning Tree 10-Day Passes, a customer buys the right to take up to 10 days of training over a one-year period for a fixed price. Revenue is recognized on a pro-rata basis for each attendance day. If a 10-Day Pass has unused days at expiration, we record the pro-rata value of the unused days as revenue.
52
Table of Contents
Trade accounts receivable are reduced by an allowance for amounts that may become uncollectible in the future. We use estimates in determining the allowance for doubtful accounts receivable, based on our analysis of various factors, including our historical collection experience, current trends, specific identification of invoices which are considered doubtful, and a percentage of our past due accounts receivable. These estimates could differ from actual collection experience and are subject to adjustment. Our trade accounts receivable are written off when they are deemed uncollectible.
| d. | Stock-Based Compensation |
We estimate the fair value of share-based payment awards on the date of grant using an option-pricing model. The value of the portion of the award that is ultimately expected to vest is recognized as expense over the requisite service periods in our consolidated statements of operations. Our determination of fair value of share-based payment awards on the date of grant using an option-pricing model is affected by assumptions regarding a number of variables, including our expected stock price volatility, expected term and risk-free interest rates.
We analyzed our historical volatility to estimate the expected volatility. The risk-free interest rate assumption is based on the U.S. Treasury rate at the date of grant, which most closely resembles the expected life of our options. The estimated expected life represents the weighted-average period the stock options are expected to remain outstanding and has been determined based on the simplified method under ASC 718. We do not have sufficient historical exercise data to provide a reasonable basis upon which to estimate expected term.
As stock-based compensation expense recognized in the consolidated statements of operations is based on awards ultimately expected to vest, it has been reduced for estimated pre-vesting forfeitures. Forfeitures were estimated based on historical experience. During fiscal year 2009, we reduced to zero the estimated forfeiture rate for executive personnel.
| e. | Course Development Costs |
Course development costs are charged to operations in the period incurred.
| f. | Advertising |
Advertising costs are charged to expense in the period incurred. Advertising costs totaled $495, $1,021 and $759 in fiscal years 2007, 2008 and 2009, respectively.
| g. | Cash and Cash Equivalents, Available for Sale Securities, and Interest-bearing Investments |
We consider highly liquid investments with remaining maturities of ninety days or less when purchased to be cash equivalents.
We classify certain of our investments in marketable securities as “available for sale”. We do not have any investments classified as “trading” or “held-to-maturity.” Our policy is to invest cash with issuers that have high credit ratings and to limit the amount of credit exposure to any one issuer.
As of October 2, 2009, we had a total of available for sale securities of $29,497 stated at fair market value, net of unrealized gains and losses.
Current available for sale securities includes $14,897 of highly liquid investments. We may sell our investments prior to their stated maturities for strategic purposes, in anticipation of credit deterioration or for duration management. These investments consist primarily of municipal bonds, municipal floating rate securities, U.S. Government Agencies securities, both state taxable and tax-exempt issues.
Current available for sale securities also includes $14,500 of auction rate securities (“ARS”) (variable rate municipal debt securities) that have failed at their periodic auctions. These investments generally have a final
53
Table of Contents
maturity of 20 to 30 years, with interest reset dates every seven to thirty five days. These investments were designed to be liquidated under an auction process on the interest reset dates if a sufficient number of bids were submitted. These securities are valued every quarter by an independent expert (Houlihan Smith & Company, Inc.), and are stated at fair value, net of unrealized gains and losses. The cost of securities sold is based on the specific identification method. We have signed a repurchase agreement with UBS under which we have the right to sell our remaining $14,500 of ARS at their stated value at any time during the period from June 30, 2010 through July 2, 2012. Because we intend to exercise our right to sell all of our remaining ARS to UBS under the repurchase agreement within the next twelve months these ARS are classified as current assets as of October 2, 2009.
Current available for sale securities includes $100 of ARS that were redeemed subsequent to year end at par.
Proceeds from sales of available-for-sale securities during fiscal years 2007, 2008 and 2009 were $5,750, $18,350 and $21,466 respectively. We earn interest income on these securities which is recorded as interest income in the consolidated statements of operations.
Restricted interest-bearing investments at October 2, 2009 consist of cash deposits of $7,937 (5,000 British Pounds) and $1,450 which have been pledged as collateral to secure our obligations under leases for education center facilities located in the United Kingdom and the United States, respectively. The deposits are in our name and are in interest-bearing accounts with interest accruing to us and paid on an annual basis in the United Kingdom and on a monthly basis in the United States.
In the United Kingdom, our representatives and the landlords’ representatives control the deposit (all are solicitors). They act jointly in the operation of the deposit account. The deposit will be released to us at the earlier of the end of the lease period or when certain financial ratios have been met.
In the United States, the deposit will be returned at the end of the lease term.
| h. | Prepaid Marketing Expenses |
Prepaid marketing expenses primarily include the external costs associated with the design, printing, postage, list rental and handling of direct mail advertising materials to be mailed in the future. These costs are charged to expense in the month in which the advertising materials are mailed since the benefit period for such costs is short and the amount of future benefit is not practically measurable. Marketing expenses for fiscal years 2007, 2008 and 2009 were $22,718, $22,141 and $14,793, respectively.
| i. | Equipment, Property and Leasehold Improvements |
Equipment, property and leasehold improvements are recorded at cost and depreciated or amortized using the straight-line method over the following estimated useful lives:
| Education and office equipment | 3 to 5 years | |
| Transportation equipment | 4 years | |
| Accounting software | 7 years | |
| Leasehold improvements | 20 years or the life of the lease, if shorter | |
| Building | 30 years |
Land, stated at cost, amounted to $1,342 during all periods presented.
Software amortization amounted to $421, $435, and $494 in fiscal years 2007, 2008 and 2009, respectively. Total depreciation and amortization expense amounted to $6,529, $6,522, and $6,061 in fiscal years 2007, 2008, and 2009, respectively. Costs of normal maintenance and repairs and minor replacements are normally charged to expense as incurred. In those instances where we have determined we are contractually obligated to incur recurring repairs and maintenance costs related to our leased facilities, a provision is made in the financial
54
Table of Contents
statements at the earlier of the date the expense is incurred or the date of the obligation. The costs of assets sold or retired are eliminated from the accounts along with the related accumulated depreciation or amortization, and any resulting gain or loss is included in the statements of operations.
The fair value of a liability for an asset retirement obligation associated with a leased facility is recorded as an asset (leasehold improvements) and a liability when there is a legal obligation associated with the retirement of a long-lived asset and the amount can be reasonably estimated. See also Note 2 relating to asset retirement obligations.
| j. | Long-Lived Assets |
We periodically review the carrying value of our long-lived assets, such as equipment, property and leasehold improvements for impairment or whenever events or changes in circumstances indicate that the carrying value may not be recoverable. In making such evaluations, we compare the expected future cash flows to the carrying amount of the assets. If the total of the expected future cash flows is less than the carrying amount of the assets, we are required to make estimates of the fair value of the long-lived assets in order to calculate the impairment loss equal to the difference between the fair value of the assets and their book value. We make significant assumptions and estimates in this process regarding matters that are inherently uncertain, such as estimating cash flows, remaining useful lives, discount rates and growth rates. The resulting cash flows are computed over an extended period of time, which subjects those assumptions and estimates to an even larger degree of uncertainty. While we believe that our estimates are reasonable, different assumptions regarding such cash flows could materially affect the valuation of long-lived assets.
| k. | Deferred Revenues |
Deferred revenues primarily relate to unearned revenues associated with Training Passports, Training Vouchers and advance payments received from customers for course events to be held in the future.
| l. | Comprehensive Income |
We report comprehensive income in the Consolidated Statements of Stockholders’ Equity and Comprehensive Income. Other comprehensive income (loss) represents changes in stockholders’ equity from non-owner sources and is comprised of foreign currency translation adjustments and unrealized losses on available-for-sale securities, net of tax. At the end of fiscal year 2009, accumulated other comprehensive income (loss) consisted of foreign currency translation adjustments of $323 and unrealized losses on available for sale securities of $(1,408), compared to foreign currency translation adjustments of $743 and unrealized losses on available for sale securities of $(1,595) in fiscal year 2008.
| m. | Income Taxes |
We provide for income taxes under the provisions of Financial Accounting Standards Board (“FASB”) ASC 720, Income Taxes. Deferred income taxes result from temporary differences between the tax basis of assets and liabilities and the basis reported in our consolidated financial statements. Deferred tax liabilities and assets are determined based on the difference between financial statement and tax basis of assets and liabilities using enacted rates expected to be in effect during the year in which the differences reverse. Valuation allowances are provided against assets, including net operating losses, if it is anticipated that some or the entire asset may not be realized through future taxable earnings or implementation of tax planning strategies.
In July 2006, the FASB issued Interpretation No.48, Accounting for Uncertainty in Income Taxes (“FIN 48”; codified primarily in FASB ASC 740, Income Taxes). FIN 48 clarifies the accounting for income taxes by prescribing the minimum recognition threshold a tax position is required to meet before being recognized in the financial statements and applies to all tax positions related to income taxes subject to FASB ASC 740. FIN 48 is effective for fiscal years beginning after December 15, 2006.
As of the beginning of fiscal year 2008, we adopted FIN 48 (see Note 3).
55
Table of Contents
| n. | Foreign Currency |
We translate the financial statements of our foreign subsidiaries from the local (functional) currencies to United States dollars. The rates of exchange at each fiscal year end are used for translating the assets and liabilities and the average monthly rates of exchange for each year are used for the statements of operations. Gains or losses arising from the translation of the foreign subsidiaries’ financial statements are included in the accompanying consolidated balance sheets as a separate component of stockholders’ equity. Gains or losses resulting from foreign currency transactions are included in the consolidated statements of operations.
To date, we have not sought to hedge the risk associated with fluctuations in currency exchange rates, and therefore we continue to be subject to such risk.
| o. | Deferred Facilities Rent |
Operating Lease Activities:
We lease education center and administrative office space under various operating lease agreements. Certain lease agreements include provisions that provide for cash incentives, graduated rent payments and other inducements. We recognize rent expense on a straight-line basis over the related terms of such leases. The value of lease incentives and/or inducements, along with the excess of the rent expense recognized over the rentals paid, is recorded as deferred facilities rent in the accompanying consolidated balance sheets.
Lease Termination Activities:
We record liabilities for costs that will be incurred under a contract without economic benefit at estimated fair value. In the United Kingdom we have vacated space in leased facilities subject to operating leases and recorded the estimated liability associated with future rentals at the cease-use date. The fair value of the liability at the cease-use date was determined based on the remaining cash flows for lease rentals, and minimum lease payments, reduced by estimated sublease rentals and certain subtenant reimbursements that could be reasonably obtained for the property, discounted using a credit-adjusted risk-free rate. The liability is adjusted for changes, if any, resulting from revisions to estimated cash flows after the cease-use date, measured using the current credit-adjusted risk-free rate. Changes due to the passage of time are recognized as an increase in the carrying amount of the liability and as accretion expense.
The lease termination activities have historically resulted in accrued liabilities recorded in deferred facilities rent. However, due to the timing of payments due to landlords and payments due from subtenants, certain lease terminations have resulted in assets included in other assets at October 3, 2008 and October 2, 2009.
| p. | Fair Value of Financial Instruments |
The carrying values of cash and cash equivalents, accounts receivable, accounts payable, and accrued liabilities approximate their fair values because of the short-term nature of these instruments. Available for sale securities are carried at market or appraised value.
| q. | Use of Estimates |
The preparation of financial statements in conformity with accounting principles generally accepted in the United States requires management to make judgments, estimates and assumptions that affect the amounts reported in the financial statements and accompanying notes. Actual results could differ from those estimates.
| r. | Other Accrued Liabilities |
As of October 3, 2008, $1,053 was reclassified from trade accounts payable to other accrued liabilities to conform to the presentation for fiscal year 2009.
56
Table of Contents
| s. | Recently Issued Accounting Pronouncements |
Measuring Liabilities at Fair Value. In August 2009, the FASB issued Accounting Standards Update (“ASU”) 2009-5 to provide fair value measurement clarification in circumstances in which a quoted price in an active market for an identical liability is not available. Under the standard, appropriate valuation techniques include a technique that uses the quoted price of the identical liability when traded as an asset or another valuation technique (an income or a market approach) that is consistent with the principles of Accounting Standards Codification (“ASC”) 820. We adopted this standard in August 2009 with no material impact on our consolidated financial statements.
Accounting Standards Codification. In June 2009, the FASB issued ASU 2009-1 to establish the FASB Accounting Standards Codification (included in ASC 105) as the source of authoritative accounting principles recognized by the FASB to be applied by nongovernmental entities in preparation of financial statements in conformity with generally accepted accounting principles in the United States. The FASB uses ASU to amend ASC. This standard was effective for interim and annual periods ending after September 15, 2009, and did not have a material impact on our consolidated financial statements.
Subsequent Events. In May 2009, the FASB issued standards (included in ASC 855) for accounting and disclosure of events that occur after the balance sheet date but before the financial statements are issued or available to be issued. Companies must disclose the date through which they evaluated subsequent events and whether the date corresponds with the filing of their financial statements. It is effective for fiscal periods ending after June 15, 2009. This standard was effective for our third quarter ended July 3, 2009, and did not have a material impact on our consolidated financial statements.
Determining Fair Value When the Volume and Level of Activity for the Asset or Liability Have Significantly Decreased and Identifying Transactions That Are Not Orderly. In April 2009, the FASB issued standards (included in ASC 820) which provide additional guidance on fair value, and reaffirm the previous definition of fair value as the price that would be received to sell an asset or paid to transfer a liability in an orderly transaction between market participants under current market conditions. This standard requires an evaluation of whether there has been a significant decrease in the volume and level of activity for the asset or liability in relation to normal market activity for the asset or liability. If there has, transactions or quoted prices may not be indicative of fair value and a significant adjustment may need to be made to those prices to estimate fair value. Additionally, an entity must consider whether the observed transaction was orderly (that is, not distressed or forced). If the transaction was orderly, the obtained price can be considered a relevant observable input for determining fair value. If the transaction is not orderly, other valuation techniques must be used when estimating fair value. We adopted this standard on April 4, 2009, with no material impact on our consolidated financial statements.
Interim Disclosures about Fair Value of Financial Instruments. In April 2009, the FASB issued standards (included in ASC 825) requiring disclosures about fair value of financial instruments for interim and annual financial statements. We adopted this standard on April 4, 2009, with no material impact on our consolidated financial statements.
Recognition and Presentation of Other-Than-Temporary Impairments. In April 2009, the FASB issued standards (included in ASC 320) which provide additional guidance designed to create greater clarity and consistency in accounting for and presenting impairment losses on securities. We adopted this standard on April 4, 2009, with no material impact on our consolidated financial statements.
Fair Value Measurement. In October 2008, the FASB issued standards (included in ASC 820) which provide a common definition of fair value and establish a framework to make the measurement of fair value in generally accepted accounting principles more consistent and comparable. The standard does not require new fair value measurements but applies to other standards that require fair value measurement; expanded disclosures are also required. In February 2008, the FASB delayed the effective date of this standard to fiscal years beginning
57
Table of Contents
after November 15, 2008 for nonfinancial assets and nonfinancial liabilities, except for items that are recognized or disclosed at fair value in the financial statements on a recurring basis (at least annually). We will adopt the standard for nonfinancial assets and nonfinancial liabilities beginning in the first quarter of fiscal year 2010. We do not currently believe adoption will have a material impact on our consolidated financial statements.
The Fair Value Option for Financial Assets and Financial Liabilities. In February 2007, the FASB issued standards (included in ASC 825) permitting entities to choose to measure many financial instruments and certain other items at fair value. The objective is to improve financial reporting by providing entities with the opportunity to mitigate volatility in reported earnings caused by measuring related assets and liabilities differently without having to apply complex hedge accounting provisions. The standard became effective for us October 4, 2008. We chose not to elect the fair value option.
Other recent accounting pronouncements issued by the FASB did not, or management believes will not, have a material impact on our present or future consolidated financial statements.
| 2. | ASSET RETIREMENT OBLIGATIONS |
We record a liability equal to the fair value of the estimated cost to retire an asset. The asset retirement obligation (“ARO”) liability is recorded in the period in which the obligation meets the definition of a liability, which is generally when the asset is placed in service and whereby we have contractual commitments to remove leasehold improvements and to return the leased facility back to a specified condition when the lease terminates. For a facility lease, this is typically at the inception of the lease.
When the ARO liability is initially recorded, we increase the carrying amount of the related long-lived asset (leasehold improvements) by an amount equal to the calculated liability. The liability is subsequently accreted to its present value each period, and the capitalized cost is depreciated over the useful life of the related asset, which is the lease term. The ARO liability is recorded at fair value, and accretion expense (included in general and administrative expenses) is recognized over time as the discounted liability is accreted to its expected settlement value. The fair value of the ARO liability is measured using the expected future cash outflows related to the lease and calculated by using inflation rates in effect at the time of adoption and incorporating a market-risk premium, and discounted at our credit-adjusted risk-free interest rate at the time of adoption. Any difference between costs incurred upon settlement of an asset retirement obligation and the recorded liability will be recognized as a gain or loss in our earnings.
Each ARO liability is based on a number of assumptions requiring judgment. We cannot predict the type of revisions to these assumptions that will be required in future periods due to the availability of additional information, technology changes, the price of labor costs and other factors.
The following table presents the activity for the asset retirement obligations, which primarily consist of classroom facilities at our education centers:
| Fiscal Year Ended | ||||||||
| October 3, 2008 |
October 2, 2009 |
|||||||
| ARO balance, beginning of year |
$ | 3,523 | $ | 3,319 | ||||
| Liabilities incurred |
— | 233 | ||||||
| Accretion expense |
201 | 180 | ||||||
| Liabilities satisfied |
(1 | ) | — | |||||
| Gain on settlement of ARO liability |
(86 | ) | — | |||||
| Revisions in expected cash flows |
49 | — | ||||||
| Foreign currency translation |
(367 | ) | (274 | ) | ||||
| ARO balance, end of year |
$ | 3,319 | $ | 3,458 | ||||
58
Table of Contents
| 3. | INCOME TAXES |
We file a consolidated U.S. Federal income tax return which includes all of our domestic operations. Our domestic subsidiaries also file income tax returns based on our operations in certain state and local jurisdictions. We file separate tax returns for each of our foreign subsidiaries in the countries in which they operate.
Income before provision for income taxes consists of the following:
| Fiscal Year Ended | ||||||||||
| September 28, 2007 |
October 3, 2008 |
October 2, 2009 |
||||||||
| Domestic |
$ | 12,515 | $ | 14,358 | $ | (748 | ) | |||
| Foreign |
6,230 | 7,330 | 3,779 | |||||||
| Total |
$ | 18,745 | $ | 21,688 | $ | 3,031 | ||||
The provision for income taxes is comprised of the following:
| Fiscal Year Ended | ||||||||||||
| September 28, 2007 |
October 3, 2008 |
October 2, 2009 |
||||||||||
| Current tax provision: |
||||||||||||
| U.S. Federal |
$ | 5,954 | $ | 5,345 | $ | 1,061 | ||||||
| State |
320 | 509 | 197 | |||||||||
| Foreign |
(944 | ) | 1,652 | 709 | ||||||||
| 5,330 | 7,506 | 1,967 | ||||||||||
| Deferred tax provision: |
||||||||||||
| U.S. Federal |
(3,780 | ) | 304 | 295 | ||||||||
| State |
(52 | ) | (10 | ) | (217 | ) | ||||||
| Foreign |
257 | 88 | (217 | ) | ||||||||
| (3,575 | ) | 382 | (139 | ) | ||||||||
| Provision for income taxes |
$ | 1,755 | $ | 7,888 | $ | 1,828 | ||||||
The following is a reconciliation of the provision for income taxes to the U.S. Federal statutory tax rate:
| Fiscal Year Ended | |||||||||||||||||||||
| September 28, 2007 |
Effective Tax rate % |
October 3, 2008 |
Effective Tax rate % |
October 2, 2009 |
Effective Tax rate % |
||||||||||||||||
| Income taxes at the U.S. statutory rate |
$ | 6,373 | 34 | % | $ | 7,591 | 35 | % | $ | 1,061 | 35 | % | |||||||||
| Tax-exempt interest |
(326 | ) | -1 | (253 | ) | -1 | (114 | ) | -4 | ||||||||||||
| Equity compensation |
44 | — | 167 | 1 | 482 | 16 | |||||||||||||||
| Penalties |
2 | — | 1 | — | 140 | 5 | |||||||||||||||
| Other permanent differences |
32 | — | 120 | — | 124 | 4 | |||||||||||||||
| Effects of foreign taxes and tax credits |
310 | 2 | 72 | — | (131 | ) | (4 | ) | |||||||||||||
| Dividend from foreign subsidiaries |
— | — | — | — | 666 | 22 | |||||||||||||||
| State income taxes |
538 | 3 | 492 | 2 | (21 | ) | (1 | ) | |||||||||||||
| Uncertain tax positions |
(2,298 | ) | (13 | ) | (81 | ) | — | 90 | 3 | ||||||||||||
| Change in valuation allowance |
(2,920 | ) | (16 | ) | (221 | ) | (1 | ) | (469 | ) | (16 | ) | |||||||||
| Total provision for income taxes |
$ | 1,755 | 9 | % | $ | 7,888 | 36 | % | $ | 1,828 | 60 | % | |||||||||
59
Table of Contents
In the fourth quarter of fiscal year 2009, several of our foreign subsidiaries paid dividends to our U.S. parent corporation totaling $17,451. After taking into account withholding taxes, foreign tax credits, and previously taxed income amounts, we paid $666 of U.S. income taxes on the dividends from the foreign subsidiaries.
During fiscal year 2006, our Canadian subsidiary underwent a transfer pricing tax examination by the Canada Revenue Agency (CRA) with respect to fiscal years 2002 and 2003. In September 2006, CRA proposed a preliminary assessment in the amount of $347 for additional taxes and interest. In December 2006, we accepted the proposed assessment and included this amount in our tax provision for fiscal year 2006. In July 2007, we requested that CRA adjust our Canadian income taxes for fiscal years 2000, 2001, 2004, and 2005 in a manner consistent with the adjustments CRA required for fiscal years 2002 and 2003. In addition, we filed our Canadian income tax return for fiscal year 2006 consistent with the methodology used by CRA. The impact of adjusting the four additional years and filing the fiscal year 2006 return consistently with the adjusted years, when netted against the assessments for fiscal years 2002 and 2003, resulted in a net benefit to us of approximately $3,224 in fiscal year 2007.
Deferred income tax assets and liabilities consist of the following:
| Fiscal Year Ended | ||||||||
| October 3, 2008 |
October 2, 2009 |
|||||||
| Domestic operations: |
||||||||
| Deferred tax assets: |
||||||||
| Deferred facilities rent charges |
$ | 1,855 | $ | 1,475 | ||||
| Foreign tax credit carryforwards |
301 | 342 | ||||||
| State tax operating loss carryforwards |
4 | 3 | ||||||
| Accrued vacation |
306 | 366 | ||||||
| Equity compensation |
807 | 568 | ||||||
| Investments |
1,150 | 922 | ||||||
| Depreciation and amortization |
1,932 | 2,159 | ||||||
| Deferred benefits for uncertain tax positions |
3,654 | 2,259 | ||||||
| Accrued legal settlement |
— | 1,519 | ||||||
| Other |
256 | 58 | ||||||
| Deferred tax liabilities: |
||||||||
| Prepaids |
(536 | ) | (481 | ) | ||||
| Domestic net deferred tax assets |
9,729 | 9,190 | ||||||
| Foreign operations: |
||||||||
| Deferred tax assets: |
||||||||
| Deferred benefits for uncertain positions |
780 | 637 | ||||||
| Depreciation and other |
769 | 1,137 | ||||||
| Deferred tax liabilities: |
||||||||
| Deferred revenue |
(195 | ) | (228 | ) | ||||
| Foreign net deferred tax assets |
1,354 | 1,546 | ||||||
| Domestic and foreign deferred tax assets |
11,083 | 10,736 | ||||||
| Valuation allowances |
(469 | ) | — | |||||
| Net deferred tax assets |
$ | 10,614 | $ | 10,736 | ||||
As of October 2, 2009, we had foreign tax credit carry forwards of approximately $342, which expire, if unused, in the years 2013 to 2019.
Significant management judgment is required in determining our provision for income taxes and in determining whether any deferred tax assets will be realized in full or in part. When it is more likely than not that all or some portion of specific deferred tax assets such as net operating losses or foreign tax credit carry forwards will not be realized, a valuation allowance must be established for the amount of the deferred tax assets that cannot be realized. Realization is based on our ability to generate sufficient future taxable income.
60
Table of Contents
As of the end of the fourth quarter of fiscal year 2007, we determined that it was more likely than not that certain U.S. deferred tax assets were recoverable, based on the improved financial performance of the U.S. entities during fiscal year 2007 and our expectations for the future. Accordingly, we reversed the valuation allowance for the assets of the U.S. entities, except for the assets related to foreign tax credit carryovers and the deferred tax assets for certain state jurisdictions. This reversal of the valuation allowance resulted in a net benefit of approximately $2,754 recognized in the fiscal year 2007 tax provision. Our total valuation allowance decreased by $2,920, with the additional decrease attributable to fiscal year 2007 results from operations. As of September 28, 2007, we continued to maintain valuation allowances in the U.S. related to the foreign tax credit carryovers and certain state deferred tax assets, and we continued to maintain a valuation allowance for our deferred tax assets in a foreign jurisdiction.
As of the end of the fourth quarter of fiscal year 2008, we reversed the valuation allowance for certain state deferred tax assets because we determined that it was more likely than not that these deferred tax assets are recoverable because of the improved financial performance in the relevant jurisdictions. The reversal of the valuation allowance resulted in a net benefit of approximately $242. As of October 3, 2008, we continued to maintain valuation allowances in the U.S. related to the foreign tax credit carryovers, and we continued to maintain valuation allowances for our deferred tax assets in a foreign jurisdiction.
As of the end of the fourth quarter of fiscal year 2009, we reversed the valuation allowance for our foreign tax credit carryovers and for our deferred tax assets in a foreign jurisdiction. Because of changes we made to our intercompany agreements with our foreign subsidiaries and the improved financial performance of their operations, we determined that it is more likely than not that the benefits from the foreign tax credit carryovers will be realized. We also determined that it is more likely than not that we will realize the benefits for the deferred tax assets in the foreign jurisdiction because of the improved financial performance of our operations in the foreign jurisdiction. The reversal of the valuation allowances for these items resulted in a net benefit of approximately $469.
For years prior to fiscal year 2008, we established reserves for our global tax contingencies. These reserves reflected our best estimate of the deductions and credits that we may have been able to sustain, or that we would be willing to concede as part of a broader tax settlement.
We adopted FIN 48 (codified primarily in FASB ASC 740, Income Taxes) as of the beginning of fiscal year 2008. FIN 48 clarifies the accounting for income taxes by prescribing the minimum recognition threshold a tax position is required to meet before being recognized in the financial statements. The cumulative effect of the adoption was a $1,228 reduction to retained earnings. As of the date of adoption, the net amount of unrecognized tax benefits was $1,418, all of which would have an impact on our effective tax rate if recognized. The gross amount of unrecognized benefits was $6,690, which was reduced by deferred tax benefits associated with the uncertain tax positions of $5,272. Our continuing practice is to recognize interest and penalties related to income tax matters in income tax expense. As of the date of adoption, we had $642 accrued for interest and $623 accrued for penalties.
The aggregate change in the balance of gross unrecognized tax benefits, which excludes interest and penalties, is as follows:
| Fiscal Year Ended | ||||||||
| October 3, 2008 |
October 2, 2009 |
|||||||
| Balance, beginning of year |
$ | — | $ | 5,391 | ||||
| Increases related to tax positions taken during a prior period |
6,690 | — | ||||||
| Decreases related to tax positions taken during a prior period |
— | — | ||||||
| Increases related to tax positions taken during the current period |
— | 20 | ||||||
| Decreases related to settlements with taxing authorities |
— | — | ||||||
| Decreases related to expiration of the statute of limitations |
(1,299 | ) | (1,603 | ) | ||||
| Balance end of year |
$ | 5,391 | $ | 3,808 | ||||
61
Table of Contents
For fiscal year 2009, $70 of our released unrecognized tax benefits favorably affected our effective tax rate. As of October 2, 2009, $1,121 of our total unrecognized tax benefits would favorably affect our effective tax rate if recognized. For fiscal year 2009, we recognized $139 of expense attributable to interest and penalties for uncertain tax positions. As of October 2, 2009, we had $859 accrued for interest and $564 accrued for penalties for uncertain tax positions. We do not believe it is reasonably possible that the amount of unrecognized tax benefits will significantly change within the next 12 months due to changes in circumstances other than the normal expiration of the statute of limitations.
We file income tax returns in the United States and various state, local, and foreign jurisdictions, and remain subject to examinations by these jurisdictions for fiscal years 2005 through 2009.
We have not provided for U.S. federal income and foreign withholding taxes of international subsidiaries’ undistributed earnings as of October 2, 2009, because such earnings are intended to be reinvested indefinitely. The undistributed earnings were approximately $18,600 as of October 2, 2009. If these earnings were distributed, we would incur approximately $155 of foreign withholding taxes. Because of the availability of U.S. foreign tax credits, it is not practicable to determine the U.S. federal income tax liability that would be payable if such earnings were not reinvested.
| 4. | COMMITMENTS AND CONTINGENCIES |
| a. | Commitments |
We have various non-cancelable operating leases for facilities that expire at various dates through 2019 and certain leases for office equipment requiring annual payments as follows:
| Fiscal Year Ending |
Minimum Lease Payments |
Less Sublease Proceeds |
Net Lease Commitments | ||||||
| 2010 |
$ | 13,637 | $ | 2,652 | $ | 10,985 | |||
| 2011 |
11,630 | 1,416 | 10,214 | ||||||
| 2012 |
8,804 | 1,384 | 7,420 | ||||||
| 2013 |
7,751 | 1,384 | 6,367 | ||||||
| 2014 |
7,669 | 1,384 | 6,285 | ||||||
| Thereafter |
25,372 | 2,133 | 23,239 | ||||||
| $ | 74,863 | $ | 10,353 | $ | 64,510 | ||||
Rental expense, not including sublease income, was $14,547, $14,219, and $12,693 for fiscal years 2007, 2008, and 2009, respectively. Sublease rental income for fiscal years 2007, 2008, and 2009 was $2,230, $2,889 and $2,806, respectively.
| b. | Contingencies |
Currently, and from time to time, we are involved in litigation incidental to the conduct of our business. We are not a party to any lawsuit or proceeding that, in the opinion of management, is likely to have a material adverse effect on our consolidated financial position or results of operations, except as noted below.
Beginning in 1996, we sold Training Passports and Vouchers to the United States Government under terms similar to those sold to our commercial customers. We have previously disclosed the existence of a claim by the U.S. Government relating to the expiration and prepayment terms of our passport and voucher programs for periods prior to fiscal year 2009. The Government has asserted that the expiration and prepayment terms of those programs in prior years violated the terms of our GSA contract, and that our acceptance of payment under these
62
Table of Contents
terms violates the civil False Claims Act, 31 U.S.C. 3729. We do not agree, but in continuing discussions with the Government have offered to settle the dispute by making a cash payment to the Government. In the fourth quarter of fiscal year 2009, we accrued $4,233 for the estimated cost of such a settlement. Although the positions of the parties are close, there can be no assurance that agreement on a settlement of the matter will be reached, and the ultimate payment could be more or less than the amount accrued. In particular, in the event that the Government were to file suit on this matter, under certain legal theories the Government could seek an award of up to treble damages and other penalties.
| 5. | STOCKHOLDERS’ EQUITY |
During fiscal years 2007 and 2008, we did not make any repurchases of our Common Stock. During fiscal year 2009 we purchased 2,642,386 shares of Common Stock at a cost of $25,161. All of our Common Stock repurchases were made in open-market transactions and not pursuant to any publicly traded plans. We may make purchases of common stock in the future, but we have no commitments to do so. See also Note 15.
| 6. | STOCK-BASED COMPENSATION |
Effective January 23, 2007, our stockholders approved the 2007 Equity Incentive Plan (our “2007 Plan”). Our 2007 Plan is administered by the Compensation and Stock Option Committee of our Board of Directors. Our 2007 Plan permits the granting of nonqualified stock options, incentive stock options, stock appreciation rights (or SARs), restricted stock, restricted stock units, performance units and performance shares to our employees, officers, directors and consultants in an amount up to an aggregate of 1,000,000 shares of Common Stock. Option awards have been granted with an exercise price equal to the market price of our stock at the date of grant and generally vest one third per year over three years (in some instances, subject to achieving certain financial targets in the year with respect to which they are granted) and have five-year contractual terms. However, the exercise price, vesting schedule and period required for full exercisability of the options is at the discretion of the Compensation and Stock Option Committee of our Board of Directors. We recognize compensation cost for these awards on a straight-line basis (or, on a graded basis for those options with performance conditions) over the requisite service period for the entire award, which is equal to the vesting period. We have a policy of issuing new shares of Common Stock to satisfy share option exercises.
Our 1999 Stock Option Plan terminated upon shareholder approval of our 2007 Plan, and no further grants of awards can be made under that plan although the rights of holders of options previously granted and outstanding under that plan were not affected. The fair value of each option award was estimated on the date of grant using a Black-Scholes option-pricing formula that uses the assumptions noted in the following table. Expected volatilities are based on the historical volatility of our stock measured over a period commensurate with the expected life of granted stock options. The expected term of options represents the period of time that options granted are expected to be outstanding and has been determined based on the simplified method as discussed in ASC 718, as we do not have sufficient historical exercise data to provide a reasonable basis upon which to estimate expected term. The risk-free interest rate assumption is based on the U.S. Treasury rate at the date of the grant, which most closely resembles the expected life of options. The expected dividend yield is 0%.
| Year Ended September 28, 2007 |
Year Ended October 3, 2008 |
Year Ended October 2, 2009 | ||||
| Expected volatility |
27% - 29% | 28% - 36% | 41% - 46% | |||
| Expected dividends |
— | — | — | |||
| Expected life (in years) |
3.25 - 4.00 | 3.40 - 3.60 | 3.60 - 3.70 | |||
| Risk-free interest rate |
4.6% - 4.9% | 2.5% - 4.3% | 1.3% - 2.2% |
63
Table of Contents
A summary of option activity under the 2007 Plan and previous plans during fiscal years 2007, 2008, and 2009 is presented below:
| Options |
Shares | Weighted- Average Exercise Price |
Weighted- Average Remaining Contractual Term |
Aggregate Intrinsic Value | |||||||
| Outstanding at September 29, 2006 |
1,118,000 | $ | 16.28 | ||||||||
| Options granted |
119,000 | $ | 12.00 | ||||||||
| Options exercised |
(13,000 | ) | $ | 12.34 | |||||||
| Options forfeited and expired |
(424,000 | ) | $ | 20.31 | |||||||
| Outstanding at September 28, 2007 |
800,000 | $ | 13.94 | ||||||||
| Options granted |
120,000 | $ | 19.09 | ||||||||
| Options exercised |
(2,000 | ) | $ | 12.77 | |||||||
| Options forfeited, expired and unearned |
(275,000 | ) | $ | 13.95 | |||||||
| Outstanding at October 3, 2008 |
643,000 | $ | 14.04 | ||||||||
| Options granted |
225,000 | $ | 10.52 | ||||||||
| Options exercised |
— | — | |||||||||
| Options forfeited, expired and unearned |
(476,000 | ) | $ | 12.97 | |||||||
| Outstanding at October 2, 2009 |
392,000 | $ | 13.32 | 1.9 | $ | 84 | |||||
| Vested and expected to vest at October 2, 2009 |
392,000 | $ | 13.32 | 1.9 | $ | 84 | |||||
| Exercisable at October 2, 2009 |
284,000 | $ | 13.41 | 1.3 | $ | 27 | |||||
The weighted average grant-date fair value of options granted during fiscal years 2007, 2008 and 2009 was $3.77, $5.28 and $3.57, respectively. The total intrinsic value of options exercised during fiscal years 2007 and 2008 was $12 and $10, respectively. There were no options exercised in fiscal year 2009.
We had 108,000 nonvested options outstanding as of October 2, 2009.
Stock-based compensation expense related to employee stock options is included in cost of revenues and operating expenses consistent with the respective employee salary costs. These costs totaled $912, $785 and $655 for fiscal years 2007, 2008 and 2009, respectively. As stock-based compensation expense recognized in the consolidated statement of operations is based on awards ultimately expected to vest, it has been reduced for estimated pre-vesting forfeitures. During fiscal year 2009, we reduced to zero the estimated forfeiture rate for executive personnel.
The total income tax benefit relating to stock options and recognized in the consolidated statement of operations was $240, $247 and $187 for fiscal years 2007, 2008 and 2009, respectively. As of October 2, 2009, there was $194 of total unrecognized compensation costs related to non-vested stock options granted under the 2007 Plan and previous plans. That cost is expected to be recognized over a weighted-average remaining period of 1.4 years.
No cash was received from the exercise of stock options during fiscal year 2009.
Restricted Stock
As noted above, our 2007 Plan permits the granting of shares of restricted stock. Shares awarded under the plan entitle the shareholder to all rights of common stock ownership except that the shares may not be sold, transferred, pledged, exchanged or otherwise disposed of during the restriction period, and may be repurchased by us for nominal consideration if the employee ceases to be employed by us during that period. The restriction period is determined by the Compensation and Stock Option Committee of our Board of Directors.
64
Table of Contents
During fiscal year 2007, we issued 25,914 shares of restricted common stock to certain employees and outside directors. The vesting of these shares was subject to meeting certain financial performance targets during fiscal year 2007, which were met, and consequently one third of the shares vested on December 31, 2007 and one third of the shares vested on December 31, 2008. Subject to continued employment of the grantee, the remaining shares will vest on December 31, 2009.
During fiscal year 2008, we issued 22,291 shares of restricted common stock to certain employees and outside directors. The vesting of these shares was subject to meeting certain financial performance targets during fiscal year 2008, which were not fully met. As a result, only 8,301 shares were earned; one third of these shares vested on December 31, 2008. Subject to continued employment of the grantee, one third of the shares will vest on each of December 31, 2009 and December 31, 2010.
During fiscal year 2009, we issued 42,519 shares of restricted stock to certain employees and outside directors. The vesting of these shares was subject to meeting certain financial performance targets during fiscal year 2009, which were not met. As a result, none of these shares will vest.
The fair value of our restricted stock awards is equal to the market price of our stock on the date of grant. The following table provides a summary of restricted stock activity for fiscal years 2008 and 2009:
| Shares | Weighted Average Grant Date Fair Value | |||||
| Nonvested at September 28, 2007 |
25,914 | $ | 12.66 | |||
| Granted |
22,291 | $ | 20.70 | |||
| Vested |
(8,632 | ) | $ | 12.66 | ||
| Cancelled and forfeited |
(15,746 | ) | $ | 20.36 | ||
| Nonvested at October 3, 2008 |
23,827 | $ | 15.10 | |||
| Granted |
42,519 | $ | 10.61 | |||
| Vested |
(10,705 | ) | $ | 14.46 | ||
| Cancelled and forfeited |
(42,519 | ) | $ | 10.61 | ||
| Nonvested at October 2, 2009 |
13,122 | $ | 15.61 | |||
For fiscal year 2009 we recognized $96 in compensation cost related to restricted stock awards. Unrecognized compensation cost related to nonvested restricted stock awards totaled approximately $36 and is expected to be recognized over a weighted-average period of 1.4 years.
| 7. | EMPLOYEE BENEFIT PLANS |
We have adopted a defined contribution plan for the benefit of our domestic employees who have met the eligibility requirements. The Learning Tree International 401(k) Plan (our “401(k) Plan”) is a profit-sharing plan qualifying under Section 401(k) of the Internal Revenue Code.
Qualified employees may elect to contribute to our 401(k) Plan on a pre-tax basis. The maximum amount of employee contribution is subject only to statutory limitations. Prior to April 1, 2009, we made contributions at a rate of 75% of the first 6% of employee compensation contributed. Starting April 1, 2009 we made contributions at a rate of 50% of the first 2% of employee compensation contributed. As of October 1, 2009 we make contributions at a rate of 30% of the first 6% of employee compensation contributed. We contributed $630, $741, and $532 to our 401(k) Plan for fiscal years 2007, 2008, and 2009, respectively.
We have adopted or participate in country-sponsored defined contribution plans for the benefit of our employees of all of our foreign subsidiaries. Contributions to these plans are subject to tenure and compensation level criteria, as well as certain limitations. For fiscal years 2007, 2008 and 2009 our cost for these plans was approximately $546, $663, and $576, respectively.
65
Table of Contents
| 8. | EARNINGS PER SHARE |
Income per share—basic is computed by dividing net income by the weighted average number of shares of Common Stock outstanding during the period. Income per share—diluted includes the dilutive effect, if any, of nonvested restricted stock grants and of outstanding options to purchase common stock, using the treasury stock method. For fiscal years 2007, 2008, and 2009, 800,361, 31,302 and 391,949 stock options, respectively, were anti-dilutive and excluded from the Income per share—diluted calculation. For fiscal years 2007, 2008 and 2009, nonvested restricted common stock grants of 25,914, 23,827 and 13,122 respectively, were anti-dilutive and excluded from the Income per share—diluted calculation.
The following table sets forth the calculation of basic and diluted earnings per share:
| Fiscal Year Ended | |||||||||
| September 28, 2007 |
October 3, 2008 |
October 2, 2009 | |||||||
| Numerator: |
|||||||||
| Net income |
$ | 16,990 | $ | 13,800 | $ | 1,203 | |||
| Denominator: |
|||||||||
| Weighted-average shares outstanding—basic |
16,498 | 16,516 | 15,181 | ||||||
| Dilutive effect of nonvested restricted stock and stock options |
— | 64 | — | ||||||
| Weighted-average shares outstanding—diluted |
16,498 | 16,580 | 15,181 | ||||||
| Income Per Share: |
|||||||||
| Income per common share—basic |
$ | 1.03 | $ | 0.84 | $ | 0.08 | |||
| Income per common share—diluted |
$ | 1.03 | $ | 0.83 | $ | 0.08 | |||
| 9. | OPERATING SEGMENT INFORMATION |
Our worldwide operations involve the design and delivery of instructor-led classroom training courses and related services to business and government organizations. The training and education we offer is presented by our instructors in a virtually identical manner in every country in which we operate, regardless of whether presented in leased classroom space or external facilities, of the content of the class being taught, the language of the presentation or the printed course materials, or of the location or method of distribution. We did not have sales to any single customer that amounted to 10% or more of our revenues in fiscal years 2007, 2008 or 2009.
We conduct and manage our business globally, and our management makes financial decisions and allocates resources based on the information we receive from our internal management systems. Our reportable segments are: the United States, Canada, the United Kingdom, France, Sweden and Japan. As a measure of segment performance, our Chief Operating Decision Maker reviews revenues and gross profit for each segment. Intersegment sales were $974, $1,109 and $605 in 2007, 2008 and 2009, respectively.
66
Table of Contents
Summarized financial information by reportable segment for fiscal years 2007, 2008 and 2009, is as follows:
| Fiscal Year Ended | |||||||||
| September 28, 2007 |
October 3, 2008 |
October 2, 2009 | |||||||
| Revenues: |
|||||||||
| United States |
$ | 74,714 | $ | 80,437 | $ | 64,939 | |||
| Canada |
16,329 | 19,491 | 13,468 | ||||||
| United Kingdom |
44,884 | 47,225 | 30,651 | ||||||
| France |
18,313 | 19,247 | 14,535 | ||||||
| Sweden |
10,213 | 11,826 | 6,333 | ||||||
| Japan |
2,740 | 3,052 | 2,633 | ||||||
| Total |
$ | 167,193 | $ | 181,278 | $ | 132,559 | |||
| Gross profit: |
|||||||||
| United States |
$ | 41,338 | $ | 44,082 | $ | 35,347 | |||
| Canada |
10,457 | 12,810 | 8,487 | ||||||
| United Kingdom |
24,844 | 26,117 | 15,438 | ||||||
| France |
9,346 | 11,720 | 8,520 | ||||||
| Sweden |
6,451 | 7,790 | 3,765 | ||||||
| Japan |
1,821 | 1,952 | 1,759 | ||||||
| Total |
$ | 94,257 | $ | 104,471 | $ | 73,316 | |||
| Depreciation and amortization (included in gross profit): |
|||||||||
| United States |
$ | 1,970 | $ | 2,019 | $ | 2,130 | |||
| Canada |
294 | 373 | 323 | ||||||
| United Kingdom |
1,037 | 1,129 | 935 | ||||||
| France |
1,047 | 467 | 491 | ||||||
| Sweden |
189 | 219 | 165 | ||||||
| Japan |
24 | 18 | 22 | ||||||
| Total |
$ | 4,561 | $ | 4,225 | $ | 4,066 | |||
67
Table of Contents
Summarized financial information by reportable segment for fiscal years 2007, 2008 and 2009 is as follows:
| Fiscal Year Ended | |||||||||
| September 28, 2007 |
October 3, 2008 |
October 2, 2009 | |||||||
| Total assets: |
|||||||||
| United States |
$ | 86,371 | $ | 105,055 | $ | 92,505 | |||
| Canada |
19,073 | 15,993 | 5,374 | ||||||
| United Kingdom |
39,810 | 33,348 | 23,381 | ||||||
| France |
8,642 | 8,280 | 9,035 | ||||||
| Sweden |
8,484 | 8,403 | 5,115 | ||||||
| Japan |
1,596 | 1,345 | 1,410 | ||||||
| Total |
$ | 163,976 | $ | 172,424 | $ | 136,820 | |||
| Long-lived assets: |
|||||||||
| United States |
$ | 16,046 | $ | 16,403 | $ | 13,397 | |||
| Canada |
1,093 | 1,038 | 601 | ||||||
| United Kingdom |
6,487 | 6,261 | 4,624 | ||||||
| France |
2,191 | 1,788 | 1,919 | ||||||
| Sweden |
869 | 774 | 494 | ||||||
| Japan |
70 | 124 | 97 | ||||||
| Total |
$ | 26,756 | $ | 26,388 | $ | 21,132 | |||
| Capital expenditures: |
|||||||||
| United States |
$ | 2,649 | $ | 3,894 | $ | 952 | |||
| Canada |
215 | 463 | 72 | ||||||
| United Kingdom |
2,177 | 1,643 | 376 | ||||||
| France |
59 | 626 | 687 | ||||||
| Sweden |
366 | 160 | 46 | ||||||
| Japan |
— | 73 | 1 | ||||||
| Total |
$ | 5,466 | $ | 6,859 | $ | 2,134 | |||
| 10. | AVAILABLE FOR SALE SECURITIES |
Securities are classified consistent with how we manage, monitor, and measure them on the basis of the nature and risks of the security. The amortized cost of these securities and their respective fair values are as follows:
| October 2, 2009: |
Amortized Cost Basis |
Gross Unrealized Gains |
Gross Unrealized Losses |
Fair Value | |||||||||
| U.S. Government and Agency Securities |
$ | — | $ | — | $ | — | $ | — | |||||
| Municipal Securities |
13,822 | 62 | — | 13,884 | |||||||||
| Corporate Securities |
1,006 | 7 | — | 1,013 | |||||||||
| Auction Rate Securities |
17,000 | — | (2,400 | ) | 14,600 | ||||||||
| $ | 31,828 | $ | 69 | $ | (2,400 | ) | $ | 29,497 | |||||
| October 3, 2008: |
Amortized Cost Basis |
Gross Unrealized Gains |
Gross Unrealized Losses |
Fair Value | |||||||||
| U.S. Government and Agency Securities |
$ | 5,336 | $ | — | $ | (7 | ) | $ | 5,329 | ||||
| Municipal Securities |
10,415 | — | (35 | ) | 10,380 | ||||||||
| Corporate Securities |
— | — | — | — | |||||||||
| Auction Rate Securities |
29,275 | — | (2,635 | ) | 26,640 | ||||||||
| $ | 45,026 | $ | — | $ | (2,677 | ) | $ | 42,349 | |||||
68
Table of Contents
The scheduled maturities of available for sale debt securities were as follows as of October 2, 2009:
| Fair Value | |||
| Due within a year |
$ | 20,998 | |
| Due after one year through five years |
2,244 | ||
| Due after five years through ten years |
1,000 | ||
| Due after ten years |
5,255 | ||
| $ | 29,497 | ||
The amounts due within one year include ARS of $100 that were called on October 6 and November 3, 2009, as well as $14,500 (net of impairment of $2,400) which can be sold under our agreement with UBS at any time during the period from June 30, 2010 through July 2, 2012.
Net proceeds from sales of available for sale securities less purchases of available for sale securities for the year ended October 2, 2009 were $12,879, and gains of $22 were recognized. Net purchases of available for sale securities for the year ended October 3, 2008 were $6,251, and no gains or losses were recognized.
The aggregate fair value and unrealized losses of securities that have been in a continuous unrealized-loss position for less than 12 months and for 12 months or more, and are not other than temporarily impaired, are as follows:
| Less than 12 months | 12 Months or Greater | Total | ||||||||||||||||||
| October 2, 2009: |
Fair Value | Unrealized Loss |
Fair Value | Unrealized Loss |
Fair Value | Unrealized Loss |
||||||||||||||
| Auction Rate Securities |
— | — | 14,500 | (2,400 | ) | 14,500 | (2,400 | ) | ||||||||||||
| $ | — | $ | — | $ | 14,500 | $ | (2,400 | ) | $ | 14,500 | $ | (2,400 | ) | |||||||
| Less than 12 months | 12 Months or Greater | Total | ||||||||||||||||||
| October 3, 2008: |
Fair Value | Unrealized Loss |
Fair Value | Unrealized Loss |
Fair Value | Unrealized Loss |
||||||||||||||
| Auction Rate Securities |
— | — | 23,440 | (2,635 | ) | 23,440 | (2,635 | ) | ||||||||||||
| $ | — | $ | — | $ | 23,440 | $ | (2,635 | ) | $ | 23,440 | $ | (2,635 | ) | |||||||
At October 2, 2009 we had $17,000 in face value of ARS which were classified as current. This compares to $29,275 in face value of ARS at October 3, 2008, of which $26,075 were long-term and $3,200 were current. Historically, our ARS were highly liquid. As a result of liquidity issues in the global credit and capital markets, it has been difficult to sell ARS at their stated value. However, we did sell $15,772 of our ARS in fiscal year 2008, an additional $9,075 in fiscal year 2009 and an additional $100 in the first quarter of fiscal year 2010, all at their stated value. We have signed a repurchase agreement with UBS under which we have the right to sell our remaining $16,900 of ARS at their stated value at any time during the period from June 30, 2010 through July 2, 2012. Because we intend to exercise our right to sell all of our remaining ARS to UBS under the repurchase agreement within the next twelve months these ARS are classified as current assets as of October 2, 2009. Current available for sale securities includes $100 of ARS that were redeemed subsequent to year end at par.
We do not believe the failure of periodic auctions affects the value of the collateral underlying our ARS, and there have been no defaults on the underlying collateral. We continue to earn and receive interest at contractually set rates in a timely manner. We can finance our operations even if our ARS investments were to be illiquid for an extended period of time.
Based on a valuation performed by Houlihan Smith & Company, Inc., we concluded there was a temporary impairment of $2,400 in the fair value of our ARS as of October 2, 2009. Because we believe we will be able to
69
Table of Contents
redeem these securities at par in the foreseeable future, we do not consider the impairment to be other than temporary or to be permanent. In fiscal year 2009, we recorded an increase on an after-tax basis of $187 to other comprehensive income to reflect the reduction in the impairment of the ARS.
| 11. | FAIR VALUE MEASUREMENTS |
We adopted the provisions of FASB ASC 820, Fair Value Measurements and Disclosure (“FASB ASC 820”) in the first quarter of fiscal year 2009 for all financial assets and liabilities and nonfinancial assets and liabilities that are recognized or disclosed at fair value in the financial statements on a recurring basis (at least annually). FASB ASC 820 defines fair value, establishes a framework for measuring fair value, and expands disclosures about fair value measurements.
Fair value is defined as the price that would be received to sell an asset or paid to transfer a liability in an orderly transaction between market participants at the measurement date in the principal market for the asset or liability, or in the absence of a principal market, the most advantageous market for the asset or liability. The fair value is measured on assumptions that market participants would use, including assumptions about non performance risk and credit risk.
FASB ASC 820 establishes a fair value hierarchy for valuation inputs and prioritizes them based on the extent to which the inputs are observable in the marketplace. Categorization is based on the lowest level of input that is available and significant to the measurement. These levels are:
Level 1—Quoted prices in active markets for identical assets and liabilities.
Level 2—Observable inputs other than quoted prices in active markets, including quoted prices for similar assets or liabilities in active markets, quoted prices for identical or similar assets or liabilities in markets that are not active, inputs other than quoted prices that are observable for the asset or liability and market corroborated inputs.
Level 3—Unobservable inputs that reflect management’s assumptions about the estimates and risks that market participants would use in pricing the asset or liability.
The following sections describe the valuation methodologies we use to measure different financial assets at fair value.
| • | U.S. Government and Agency Securities—Because of the readily available markets for these instruments, we use quoted prices and other relevant information generated by market transactions involving identical or comparable assets provided by our investment broker/advisor to establish fair values. |
| • | Municipal Securities—Since these securities are not as liquid, with the assistance of our investment broker/advisor, the fair values are determined using valuation models that include assumptions about interest rates, yield curves, credit risks, and default rates. |
| • | Corporate Securities—Because of the readily available markets for these instruments, we use quoted prices and other relevant information generated by market transactions involving identical or comparable assets provided by our investment broker/advisor, as well as our independent research, to establish fair values. |
| • | Auction Rate Securities—Given the complexity of our investments in ARS, we engaged an independent investment advisor to assist in determining the fair value of our investments. We, with the assistance of our advisor, estimated the fair value of the ARS based on the following: (i) the underlying structure of each security; (ii) the present value of future principal and interest payments discounted at |
70
Table of Contents
| rates consistent with current market conditions; (iii) consideration of the probabilities of default, auction failure, or repurchase at par for each period; and (iv) estimates of the recovery rates in the event of default for each security. The estimated fair values could change based on future market conditions. |
Assets Measured at Fair Value on a Recurring Basis
The following table presents our assets measured at fair value on a recurring basis at October 2, 2009:
| Quoted Prices in Active Markets for Identical Assets (Level 1) |
Significant Other Observable Inputs (Level 2) |
Significant Unobservable Inputs (Level 3) | |||||||
| Municipal Securities |
$ | — | $ | 13,884 | $ | — | |||
| Corporate Securities |
1,013 | — | — | ||||||
| Auction Rate Securities |
— | — | 14,600 | ||||||
| $ | 1,013 | $ | 13,884 | $ | 14,600 | ||||
Changes in Level 3 Assets Measured at Fair Value on a Recurring Basis
The following table presents the changes in Level 3 assets measured on a recurring basis for the year ended October 2, 2009. All of our level 3 assets consist of ARS, with changes in fair value included in other comprehensive income (loss).
| Auction Rate Securities |
||||
| Balance, beginning of period |
$ | 26,640 | ||
| Total unrealized gains: |
||||
| Included in other comprehensive income |
235 | |||
| Purchases, issuances, and settlements |
(12,275 | ) | ||
| Balance, end of period |
$ | 14,600 | ||
| Change in unrealized gains relating to assets still held at October 2, 2009 |
$ | 235 | ||
Non Financial Liabilities Measured at Fair Value on a Nonrecurring Basis
We measure our asset retirement obligations at fair value on a nonrecurring basis, when we believe there has been an indication the fair value has changed. We did not adjust the values of those liabilities during the year ended October 2, 2009.
| 12. | VALUATION AND QUALIFYING ACCOUNTS |
Activity with respect to our provision for doubtful accounts is summarized as follows:
| Fiscal Year Ended | ||||||||||||
| September 28, 2007 |
October 3, 2008 |
October 2, 2009 |
||||||||||
| Beginning balance |
$ | 298 | $ | 195 | $ | 194 | ||||||
| Provision for doubtful accounts |
(45 | ) | 103 | 151 | ||||||||
| Charges against allowance |
(73 | ) | (100 | ) | (140 | ) | ||||||
| Other |
15 | (4 | ) | 19 | ||||||||
| Ending balance |
$ | 195 | $ | 194 | $ | 224 | ||||||
71
Table of Contents
Activity with respect to our valuation allowance for deferred tax assets is summarized as follows:
| Fiscal Year Ended | ||||||||||||
| September 28, 2007 |
October 3, 2008 |
October 2, 2009 |
||||||||||
| Beginning balance |
$ | 3,610 | $ | 690 | $ | 469 | ||||||
| Provisions |
(2,920 | ) | (221 | ) | (469 | ) | ||||||
| Charges against allowance |
— | — | — | |||||||||
| Ending balance |
$ | 690 | $ | 469 | $ | — | ||||||
| 13. | RELATED PARTY TRANSACTIONS |
Dr. David C. Collins, our Vice Chairman and former Chief Executive Officer, oversees (with the concurrence of the Nominating and Governance Committee of our Board of Directors) a charitable program under which we donated $250, $150, and $180 during fiscal years 2007, 2008 and 2009, respectively, to public charitable organizations of which Dr. Collins is a member of the board.
| 14. | QUARTERLY DATA (UNAUDITED) |
| Q1 December 28, 2007 |
Q2 March 28, 2008 |
Q3 June 27, 2008 |
Q4 October 3, 2008* | |||||||||
| Revenues |
$ | 50,890 | $ | 39,236 | $ | 46,928 | $ | 44,224 | ||||
| Cost of revenues |
20,331 | 17,709 | 19,599 | 19,168 | ||||||||
| Gross profit |
30,559 | 21,527 | 27,329 | 25,056 | ||||||||
| Operating expenses: |
||||||||||||
| Course development |
2,072 | 2,574 | 2,620 | 2,390 | ||||||||
| Sales and marketing |
10,543 | 10,519 | 11,227 | 11,307 | ||||||||
| General and administrative |
9,466 | 7,745 | 8,118 | 8,203 | ||||||||
| Total operating expenses |
22,081 | 20,838 | 21,965 | 21,900 | ||||||||
| Income from operations |
8,478 | 689 | 5,364 | 3,156 | ||||||||
| Other income, net |
921 | 1,518 | 725 | 837 | ||||||||
| Income before provision for income taxes |
9,399 | 2,207 | 6,089 | 3,993 | ||||||||
| Provision for income taxes |
3,504 | 874 | 2,270 | 1,240 | ||||||||
| Net income |
$ | 5,895 | $ | 1,333 | $ | 3,819 | $ | 2,753 | ||||
| Income per common share—basic |
$ | 0.36 | $ | 0.08 | $ | 0.23 | $ | 0.17 | ||||
| Income per common share—diluted |
$ | 0.35 | $ | 0.08 | $ | 0.23 | $ | 0.17 | ||||
| * | Consists of 14 weeks compared to 13 weeks for all other quarters presented in this table. |
72
Table of Contents
| Q1 January 2, 2009 |
Q2 April 3, 2009 |
Q3 July 3, 2009 |
Q4 October 2, 2009 ** |
|||||||||||
| Revenues |
$ | 37,966 | $ | 30,526 | $ | 32,279 | $ | 31,788 | ||||||
| Cost of revenues |
16,317 | 14,398 | 14,439 | 14,089 | ||||||||||
| Gross profit |
21,649 | 16,128 | 17,840 | 17,699 | ||||||||||
| Operating expenses: |
||||||||||||||
| Course development |
2,211 | 1,977 | 1,627 | 1,627 | ||||||||||
| Sales and marketing |
9,111 | 8,846 | 6,994 | 7,011 | ||||||||||
| General and administrative |
7,655 | 7,766 | 6,022 | 10,486 | ||||||||||
| Total operating expenses |
18,977 | 18,589 | 14,643 | 19,124 | ||||||||||
| Income (loss) from operations |
2,672 | (2,461 | ) | 3,197 | (1,425 | ) | ||||||||
| Other income, net |
378 | 344 | 295 | 31 | ||||||||||
| Income (loss) before provision (benefit) for income taxes |
3,050 | (2,117 | ) | 3,492 | (1,394 | ) | ||||||||
| Provision (benefit) for income taxes |
1,208 | (756 | ) | 1,352 | 24 | |||||||||
| Net income (loss) |
$ | 1,842 | $ | (1,361 | ) | $ | 2,140 | $ | (1,418 | ) | ||||
| Income (loss) per common share—basic |
$ | 0.11 | $ | (0.09 | ) | $ | 0.15 | $ | (0.10 | ) | ||||
| Income (loss) per common share—diluted |
$ | 0.11 | $ | (0.09 | ) | $ | 0.15 | $ | (0.10 | ) | ||||
| ** | In the fourth quarter of fiscal year 2009, we increased general and administrative expense by $4,233 to reflect the anticipated cost of the settlement of a previously disclosed claim made by the U.S. Government (see also Notes 4 and 15) and we paid approximately $666 of U.S. income taxes on tax dividends from foreign subsidiaries. |
| 15. | SUBSEQUENT EVENTS |
We have evaluated all events subsequent to the balance sheet date of October 2, 2009 through the date of issuance of these condensed consolidated financial statements, December 16, 2009, and have determined that except as set forth below, there are no subsequent events that require disclosure.
Subsequent to October 2, 2009 we offered to settle a previously disclosed claim by the U.S. Government relating to the expiration and prepayment terms of our passport and voucher programs for periods prior to fiscal year 2009 by making a cash payment to the Government. Although we continue to believe that we have complied with the terms of our contracts, we recorded a charge in our fourth quarter of fiscal year 2009 to reflect the anticipated cost of such a settlement. This resulted in a $4,233 increase to our G&A expense in that quarter. Although our respective positions are close on this matter, there can be no assurance that agreement on a settlement will be reached, and the ultimate payment could be more or less than the amount reserved.
Subsequent to October 2, 2009 and through December 16, 2009 we repurchased 81,692 shares of Common Stock at a cost of $933. We may make purchases of common stock in the future through open market transactions or otherwise, but we have no commitments to do so.
Subsequent to October 2, 2009 we sold $100 of ARS that were redeemed at their par value.
| Item 9. | CHANGES IN AND DISAGREEMENTS WITH ACCOUNTANTS ON ACCOUNTING AND FINANCIAL DISCLOSURE |
None.
| Item 9A. | CONTROLS AND PROCEDURES |
We maintain disclosure controls and procedures that are designed to ensure that information required to be disclosed in our reports filed or submitted under the Securities Exchange Act of 1934, as amended (the
73
Table of Contents
“Exchange Act”), is recorded, processed, summarized and reported within the time periods specified in the Securities and Exchange Commission’s rules and forms, and that such information is accumulated and communicated to management, including our Chief Executive Officer and Chief Financial Officer, as appropriate, to allow timely decisions regarding required disclosures.
An evaluation was carried out under the supervision and with the participation of management, including our Chief Executive Officer and Chief Financial Officer, of the effectiveness of our disclosure controls and procedures, as such term is defined in Rules 13a-15(e) and 15d-15(e) under the Exchange Act as of October 2, 2009. Based on this evaluation, our Chief Executive Officer and Chief Financial Officer concluded that our disclosure controls and procedures were effective as of October 2, 2009.
Management’s Annual Report on Internal Control over Financial Reporting
Our management is responsible for establishing and maintaining adequate internal control over financial reporting as defined in Rule 13a-15(f) under the Exchange Act. Under Section 404 of the Sarbanes-Oxley Act of 2002, our management is required to assess the effectiveness of our internal control over financial reporting as of the end of each fiscal year and report, based on that assessment, whether our internal control over financial reporting is effective.
Our internal control over financial reporting is a process designed to provide reasonable assurance regarding the reliability of financial reporting and the preparation of our financial statements for external reporting purposes in accordance with U.S. generally accepted accounting principles. Under the supervision and with the participation of management, including our Chief Executive Officer and Chief Financial Officer, we conducted a review, evaluation, and assessment of the effectiveness of our internal control over financial reporting as of October 2, 2009, based upon the criteria set forth in Internal Control—Integrated Framework issued by the Committee of Sponsoring Organizations of the Treadway Commission.
Based on these review activities, our management concluded that our internal control over financial reporting was effective as of October 2, 2009.
BDO Seidman, LLP, the independent registered public accounting firm who also audited our consolidated financial statements, has issued an attestation report on the effectiveness of internal control over financial reporting as of October 2, 2009, which is filed herewith.
Changes in Internal Control over Financial Reporting
There has been no change in our internal control over financial reporting (as defined in Rules 13a-15(f) and 15d-15(f) of the Exchange Act) during the fourth quarter of 2009 that has materially affected, or is reasonably likely to materially affect, our internal control over financial reporting.
74
Table of Contents
REPORT OF INDEPENDENT REGISTERED PUBLIC ACCOUNTING FIRM
Board of Directors and Shareholders
Learning Tree International, Inc.
Reston, Virginia
We have audited Learning Tree International, Inc. and subsidiaries’ internal control over financial reporting as of October 2, 2009, based on criteria established in Internal Control—Integrated Framework issued by the Committee of Sponsoring Organizations of the Treadway Commission (the COSO criteria). Learning Tree International, Inc. and subsidiaries’ management is responsible for maintaining effective internal control over financial reporting and for its assessment of the effectiveness of internal control over financial reporting, included in the accompanying Item 9A, Management’s Annual Report on Internal Control Over Financial Reporting. Our responsibility is to express an opinion on the company’s internal control over financial reporting based on our audit.
We conducted our audit in accordance with the standards of the Public Company Accounting Oversight Board (United States). Those standards require that we plan and perform the audit to obtain reasonable assurance about whether effective internal control over financial reporting was maintained in all material respects. Our audit included obtaining an understanding of internal control over financial reporting, assessing the risk that a material weakness exists, and testing and evaluating the design and operating effectiveness of internal control based on the assessed risk. Our audit also included performing such other procedures as we considered necessary in the circumstances. We believe that our audit provides a reasonable basis for our opinion.
A company’s internal control over financial reporting is a process designed to provide reasonable assurance regarding the reliability of financial reporting and the preparation of financial statements for external purposes in accordance with generally accepted accounting principles. A company’s internal control over financial reporting includes those policies and procedures that (1) pertain to the maintenance of records that, in reasonable detail, accurately and fairly reflect the transactions and dispositions of the assets of the company; (2) provide reasonable assurance that transactions are recorded as necessary to permit preparation of financial statements in accordance with generally accepted accounting principles, and that receipts and expenditures of the company are being made only in accordance with authorizations of management and directors of the company; and (3) provide reasonable assurance regarding prevention or timely detection of unauthorized acquisition, use, or disposition of the company’s assets that could have a material effect on the financial statements.
Because of its inherent limitations, internal control over financial reporting may not prevent or detect misstatements. Also, projections of any evaluation of effectiveness to future periods are subject to the risk that controls may become inadequate because of changes in conditions, or that the degree of compliance with the policies or procedures may deteriorate.
In our opinion, Learning Tree International, Inc. and subsidiaries maintained, in all material respects, effective internal control over financial reporting as of October 2, 2009, based on the COSO criteria.
We also have audited, in accordance with the standards of the Public Company Accounting Oversight Board (United States), the consolidated balance sheets of Learning Tree International, Inc. and subsidiaries as of October 2, 2009 and October 3, 2008, and the related consolidated statements of operations, stockholders’ equity and comprehensive income, and cash flows for each of the three years in the period ended October 2, 2009 and our report dated December 16, 2009 expressed an unqualified opinion thereon.
/s/ BDO Seidman, LLP
Bethesda, Maryland
December 16, 2009
75
Table of Contents
| Item 9B. | OTHER INFORMATION |
None.
76
Table of Contents
| Item 10. | DIRECTORS, EXECUTIVE AND CORPORATE GOVERNANCE |
The information required by this item is incorporated by reference to the sections entitled “Proposal 1: Election of Directors-Information Concerning Nominees and Other Directors,” “Our Executive Officers,” “Section 16(a) Beneficial Ownership Reporting Compliance,” “Code of Ethics,” and “Board Meetings and Committees and Corporate Governance” of our definitive Proxy Statement to be delivered to stockholders in connection with our 2010 Annual Meeting of Stockholders.
| Item 11. | EXECUTIVE COMPENSATION |
The information required by this item is incorporated by reference to the sections entitled “Compensation of Non-Employee Directors,” “Compensation of Employee Directors,” “Executive Compensation,” “Compensation and Stock Option Committee Report,” and “Compensation Committee Interlocks and Insider Participation,” of our definitive Proxy Statement to be delivered to stockholders in connection with our 2010 Annual Meeting of Stockholders.
| Item 12. | SECURITY OWNERSHIP OF CERTAIN BENEFICIAL OWNERS AND MANAGEMENT AND RELATED STOCKHOLDER MATTERS |
| Plan Category |
Number of Securities to be Issued Upon Exercise of Outstanding Options, Warrants and Rights |
Weighted-Average Exercise Price of Outstanding Options, Warrants and Rights |
Number of Securities Remaining Available for Future Issuance Under Equity Compensation Plan (Excluding Securities Reflected in the first Column) | ||||
| Equity compensation plan approved by security holders |
391,949 | $ | 13.32 | 781,104 | |||
| Equity compensation plan not approved by security holders |
— | — | — | ||||
| Total |
391,949 | $ | 13.32 | 781,104 | |||
The remaining information required by this item is incorporated by reference to the section entitled “Voting Securities and Principal Stockholders-Security Ownership of Certain Beneficial Owners and Management” of our definitive Proxy Statement to be delivered to stockholders in connection with our 2010 Annual Meeting of Stockholders.
| Item 13. | CERTAIN RELATIONSHIPS AND RELATED TRANSACTIONS, AND DIRECTOR INDEPENDENCE |
The information required by this item is incorporated by reference to the section entitled “Related Party Transactions” of our definitive Proxy Statement to be delivered to stockholders in connection with our 2010 Annual Meeting of Stockholders.
| Item 14. | PRINCIPAL ACCOUNTING FEES AND SERVICES |
The information required by this item is incorporated by reference to the section entitled “Independent Registered Public Accounting Firm” of our definitive Proxy Statement to be delivered to stockholders in connection with our 2010 Annual Meeting of Stockholders.
77
Table of Contents
| Item 15. | EXHIBITS AND FINANCIAL STATEMENT SCHEDULES |
| (a) | Financial Statements and Schedules |
The financial statements of Learning Tree International, Inc. as set forth under Item 8 are filed as part of this report.
All schedules for which provision is made in the applicable accounting regulations of the Securities and Exchange Commission are omitted because such schedules are not required under the related instructions, are not applicable or the required information is given in the financial statements.
| (b) | Exhibits |
The exhibits set forth in the Exhibit Index are filed as part of this Annual Report on Form 10-K.
78
Table of Contents
Pursuant to the requirements of Section 13 or 15(d) of the Securities Exchange Act of 1934, as amended, the registrant, Learning Tree International, Inc., a corporation organized and existing under the laws of the State of Delaware, has duly caused this Annual Report on Form 10-K to be signed on its behalf by the undersigned, thereunto duly authorized, in the Town of Reston, Commonwealth of Virginia, on the 16th day of December 2009.
| LEARNING TREE INTERNATIONAL, INC. | ||
| By: | /s/ NICHOLAS R. SCHACHT | |
| Name: | Nicholas R. Schacht | |
| Title: | President and Chief Executive Officer | |
Pursuant to the requirements of the Securities Exchange Act of 1934, as amended, this annual report on Form 10-K has been signed by the following persons on behalf of the registrant and in the capacities and on the dates indicated.
| Signature |
Title |
Date | ||
| /s/ ERIC R. GAREN |
Chairman of the Board | December 16, 2009 | ||
| Eric R. Garen | ||||
| /s/ DAVID C. COLLINS, PH.D. |
Vice Chairman of the Board | December 16, 2009 | ||
| David C. Collins, Ph.D. | ||||
| /s/ NICHOLAS R. SCHACHT |
President, Chief Executive Officer and Director | December 16, 2009 | ||
| Nicholas R. Schacht | ||||
| /s/ CHARLES R. WALDRON |
Chief Financial Officer and Chief Accounting Officer |
December 16, 2009 | ||
| Charles R. Waldron | ||||
| /s/ W. MATHEW JUECHTER |
Director | December 16, 2009 | ||
| W. Mathew Juechter | ||||
| /s/ HOWARD A. BAIN III |
Director | December 16, 2009 | ||
| Howard A. Bain III | ||||
| /s/ CURTIS A. HESSLER |
Director | December 16, 2009 | ||
| Curtis A. Hessler | ||||
| /s/ STEFAN C. RIESENFELD |
Director | December 16, 2009 | ||
| Stefan C. Riesenfeld | ||||
| /s/ GEORGE T. ROBSON |
Director | December 16, 2009 | ||
| George T. Robson | ||||
79
Table of Contents
| Number |
Document Description | |
| ** | This exhibit is a management contract, compensatory plan or arrangement. | |
| 3.1 | Restated Certificate of Incorporation, filed October 6, 1995, as amended by Certificate of Amendment filed June 6, 1997, Certificate of Amendment filed January 24, 2002, and Certificate of Amendment filed June 19, 2007 (filed herewith) | |
| 3.4 | Bylaws of Registrant, adopted August 29, 1995, as amended through November 8, 2006 (xi) | |
| 4.1 | Form of Common Stock Certificate (filed herewith) | |
| 10.1 | Employment Agreement between Registrant and Eric R. Garen, dated November 16, 2003 (iii) ** | |
| 10.2 | Written description of amended oral agreement between Registrant and Dr. David C. Collins (filed herewith) ** | |
| 10.3 | Employment Agreement between Registrant and Nicholas R. Schacht, dated as of October 1, 2005 (vii) ** | |
| 10.4 | Employment Agreement between Registrant and Magnus Nylund, dated as of October 1, 2005 (vii) ** | |
| 10.5 | Employment Agreement between Registrant and Charles R. Waldron, dated as of August 29, 2007 (xvi) ** | |
| 10.6 | Employment Agreement between Registrant and David A. Booker, dated as of October 15, 2007 (xvii) ** | |
| 10.7 | Amended and Restated Learning Tree International, Inc. 1999 Stock Option Plan (i) ** | |
| 10.8 | Amended and Restated 1999 Stock Option Plan Form of Grant of Stock Option (Consultant), Form of Grant of Stock Option (Instructor), Form of Grant of Stock Option (Employee) (iv) ** | |
| 10.9 | 2007 Equity Incentive Plan (xv) ** | |
| 10.10 | 2007 Equity Incentive Plan Form of Restricted Stock Award Agreement (xviii) ** | |
| 10.11 | 2007 Equity Incentive Plan Form of Stock Option Award Agreement (xviii) ** | |
| 10.12 | 2007 Equity Incentive Plan Form of Stock Award Agreement (xix) ** | |
| 10.13 | Lease between Learning Tree International Limited and Westinghouse Brake and Signal Holdings Limited (vi) ** | |
| 10.14 | Office Lease between Registrant and Metropolitan Life Insurance Company (vi) ** | |
| 10.15 | Lease between Registrant and Bombardier Transportation International Limited (vi) ** | |
| 10.16 | Rental Lease between Registrant and Förvaltningsbolaget Marievik HB (vi) ** | |
| 10.17 | Facility Sublease between Learning Tree International Limited and Metronet Rail BCV Limited (viii) ** | |
| 10.18 | Lease Agreement between Registrant and Reston Town Center Phase I Associates (ix) ** | |
| 10.19 | Office Lease between Registrant and TrizecHahn One NY Plaza LLC (x) ** | |
| 10.20 | Lease among Registrant, Learning Tree International Limited and Courtlands Developments Limited (x) ** | |
| 10.21 | Office Underleases between Learning Tree International Limited and Digital Equipment Co. Limited (x) ** | |
80
Table of Contents
| Number |
Document Description | |
| 10.22 | First Amendment to Leasing Agreement by and between Registrant and PRIM 1801 Rockville Pike, LLC (xii) ** | |
| 10.23 | Lease between Learning Tree International Limited and Westinghouse Brake and Signal Holdings Limited (xiii) ** | |
| 10.24 | Counterpart Guarantee and Rent Deposit Deed among Registrant, Learning Tree International Limited and Courtlands Developments Limited (vii) ** | |
| 10.25 | Lease Agreement (Deed of Lease) by and between Registrant and Carlyle-Lane-CFRI Venture II, LLC (xiv) ** | |
| 10.26 | Form of Indemnification Agreement (v) ** | |
| 14 | Code of Business Conduct and Ethics (ii) | |
| 21.1 | Subsidiaries of the Registrant (xi) | |
| 23.1 | Consent of BDO Seidman, LLP Independent Registered Public Accounting Firm (filed herewith) | |
| 23.2 | Consent of Appraisal Firm (filed herewith) | |
| 31.1 | Rule 13a-14(a)/15d-14(a) Certification of Chief Executive Officer (filed herewith) | |
| 31.2 | Rule 13a-14(a)/15d-14(a) Certification of Chief Financial Officer (filed herewith) | |
| 32.1 | Section 1350 Certification by Principal Executive Officer (filed herewith) | |
| 32.2 | Section 1350 Certification by Chief Financial Officer (filed herewith) | |
| (i) | Incorporated by reference from Registrant’s Definitive Proxy Statement on Form 14A filed January 25, 2002. |
| (ii) | Incorporated by reference from Registrant’s Annual Report on Form 10-K for the fiscal year ended September 30, 2002. |
| (iii) | Incorporated by reference from Registrant’s Quarterly Report on Form 10-Q for the period ended December 31, 2003. |
| (iv) | Incorporated by reference from Registrant’s Registration Statement on Form S-8 filed February 21, 2003. |
| (v) | Incorporated by reference from Registrant’s Annual Report on Form 10-K for the fiscal year ended October 1, 2004. |
| (vi) | Incorporated by reference from Registrants Quarterly Report on Form 10-Q for the period ended July 1, 2005. |
| (vii) | Incorporated by reference from Registrant’s Current Report on Form 8-K filed October 3, 2005. |
| (viii) | Incorporated by reference from Registrant’s Current Report on Form 8-K filed October 11, 2005. |
| (ix) | Incorporated by reference from Registrant’s Quarterly Report on Form 10-Q for the period ended December 31, 2005. |
| (x) | Incorporated by reference from Registrant’s Quarterly Report on Form 10-Q for the period ended March 31, 2006. |
| (xi) | Incorporated by reference from Registrant’s Annual Report on Form 10-K for the fiscal year ended September 29, 2006. |
| (xii) | Incorporated by reference from Registrant’s Current Report on Form 8-K filed March 1, 2007. |
| (xiii) | Incorporated by reference from Registrant’s Current Report on Form 8-K filed March 23, 2007. |
| (xiv) | Incorporated by reference from Registrant’s Current Report on Form 8-K filed May 4, 2007. |
| (xv) | Incorporated by reference from Registrant’s Definitive Proxy Statement Amendment #2 on Schedule 14A filed May 7, 2007. |
| (xvi) | Incorporated by reference from Registrant’s Current Report on Form 8-K filed August 29, 2007. |
| (xvii) | Incorporated by reference from Registrant’s Annual Report on Form 10-K filed December 11, 2007. |
| (xviii) | Incorporated by reference from Registrant’s Registration Statement on Form S-8 filed January 9, 2008. |
| (xix) | Incorporated by reference from Registrant’s Current Report on Form 8-K filed November 6, 2009. |
81