Attached files
| file | filename |
|---|---|
| 8-K - DELL INC. 8-K - DELL INC | a6121612.htm |
| EX-99.1 - EXHIBIT 99.1 - DELL INC | a6121612ex99_1.htm |
Exhibit 99.2
1 Brian Gladden Steve Schuckenbrock Senior Vice President and CFO President, Large Enterprise Peter Altabef Paul Bell President, Dell Services President, Public December 16, 2009
2 Safe Harbor Statements in this presentation that relate to future results and events (including statements about our future financial and operating performance, anticipated purchase accounting impacts, and any statements of the plans, strategies and objectives of management for future operations, including the execution of integration plans) are forward-looking statements based on Dell's current expectations. Actual results and events in future periods may differ materially from those expressed or implied by these forward-looking statements because of a number of risks, uncertainties and other factors, including: weakening global economic conditions and instability in financial markets; our ability to reestablish a cost advantage over our competitors; our ability to generate substantial non-U.S. net revenue; our ability to accurately predict product, customer and geographic sales mix and seasonal sales trends; information technology and manufacturing infrastructure failures and breaches in data security; our ability to effectively manage periodic product transitions; disruptions in component or product availability; our reliance on vendors for quality product components, including reliance on several single-source or limited-source suppliers; our ability to access the capital markets; risks relating to our internal controls; potential unfavorable outcomes of tax matters and legal proceedings, including the continuing SEC investigation into certain accounting and financial reporting matters; our acquisition of other companies; our ability to properly manage the distribution of our products and services; the success of our cost-cutting measures; effective hedging of our exposure to fluctuations in foreign currency exchange rates and interest rates; counterparty default risks; obtaining licenses to intellectual property developed by others on commercially reasonable and competitive terms; our ability to attract, retain and motivate key personnel; loss of government contracts; expiration of tax holidays or favorable tax rate structures; changing environmental laws; and the effect of armed hostilities, terrorism, natural disasters and public health issues. For a discussion of those and other factors affecting our business and prospects, see Dell’s periodic filings with the Securities and Exchange Commission. We assume no obligation to update forward-looking statements.The discussions during this conference call will include non-GAAP net income and non-GAAP earnings per share, which are not measurements of financial performance prepared in accordance with U.S. generally accepted accounting principles. We have provided a reconciliation of non-GAAP net income and non-GAAP earnings per share to their most directly comparable GAAP financial measure and we encourage investors to review the reconciliation in conjunction with the presentation of non-GAAP financial measures. A detailed discussion of our use of non-GAAP financial measures can be found in Dell’s Form 8-K dated December 16, 2009.
3 Dell SERVICES Dell & PEROT SYSTEMS Peter Altabef President, Dell Services
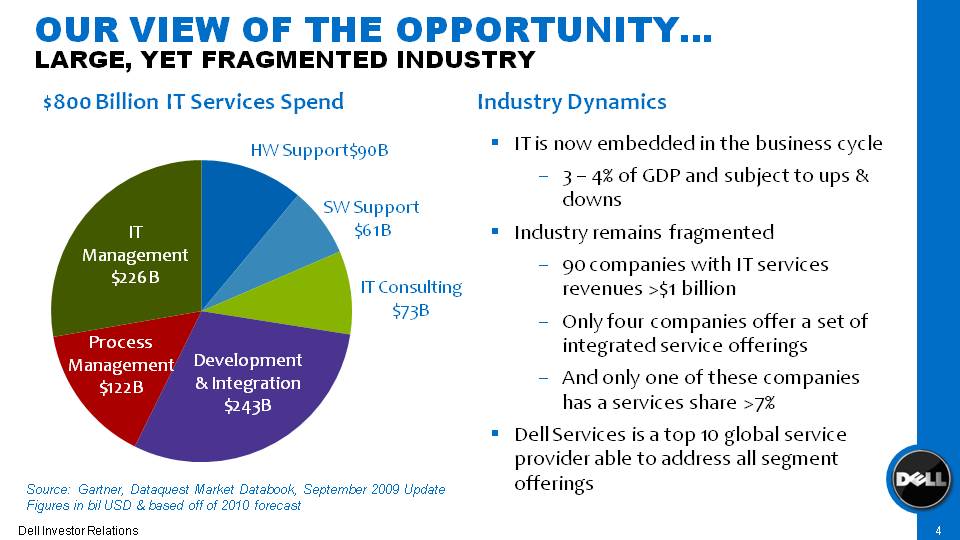
4 Our view of the opportunity… Large, yet fragmented industry IT is now embedded in the business cycle 3 – 4% of GDP and subject to ups & downsIndustry remains fragmented 90 companies with IT services revenues >$1 billion Only four companies offer a set of integrated service offerings And only one of these companies has a services share >7% Dell Services is a top 10 global service provider able to address all segment offerings $800 Billion IT Services Spend HW Support$90B SW Support$61B IT Consulting$73B Development & Integration$243B Process Management$122B IT Management$226B Industry Dynamics Source: Gartner, Dataquest Market Databook, September 2009 UpdateFigures in bil USD & based off of 2010 forecast
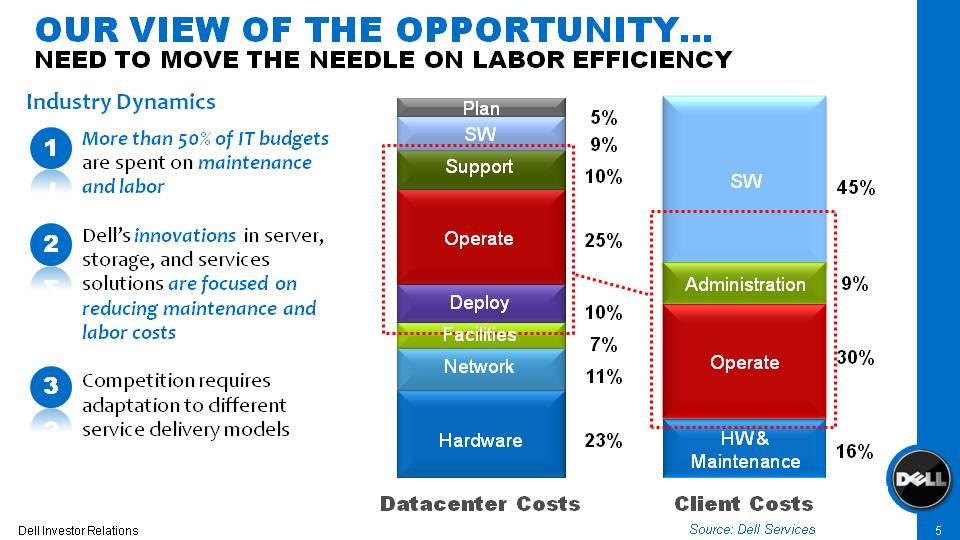
5 Our view of the opportunity… Need to move the needle on labor efficiency More than 50% of IT budgets are spent on maintenance and labor Dell’s innovations in server, storage, and services solutions are focused on reducing maintenance and labor costs Competition requires adaptation to different service delivery models Industry Dynamics HW & Maintenance SW Administration Operate 9% 45% 30% 16% Client Costs Datacenter Costs 5% 10% 25% 10% 7% 11% 9% 23% Network Deploy Operate Facilities Support Hardware SW Plan Source: Dell Services 1 2 3
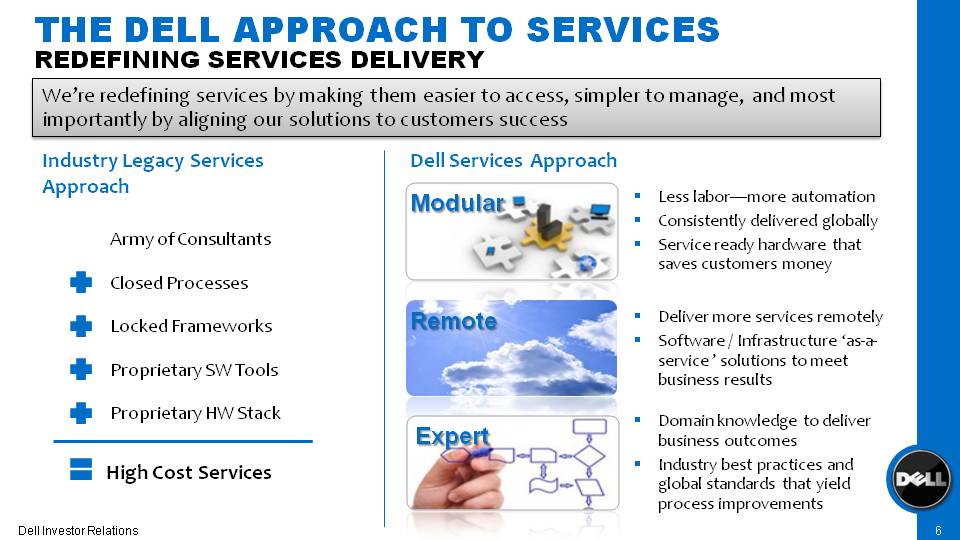
6 The Dell approach to services Redefining services delivery Modular Less labor—more automation Consistently delivered globally Service ready hardware that saves customers money Domain knowledge to deliver business outcomes Industry best practices and global standards that yield process improvements We’re redefining services by making them easier to access, simpler to manage, and most importantly by aligning our solutions to customers success Deliver more services remotely Software / Infrastructure ‘as-a-service ’ solutions to meet business results Industry Legacy Services Approach Dell Services Approach High Cost Services Army of Consultants Closed Processes Proprietary SW Tools Proprietary HW Stack Locked Frameworks Remote Expert
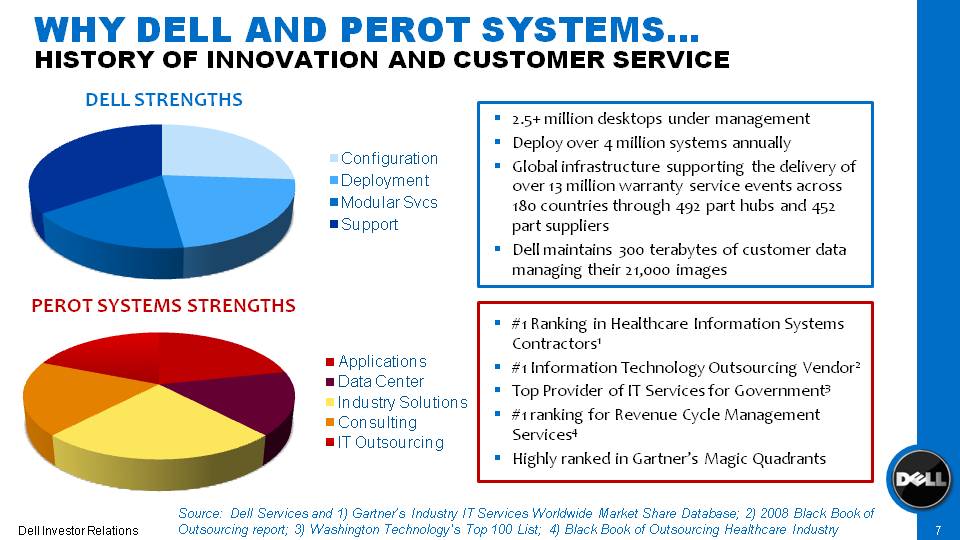
7 Dell Strengths Configuration Deployment Modular Svcs Support Perot Systems Strengths Applications Data Center Industry Solutions Consulting IT Outsourcing 2.5+ million desktops under management Deploy over 4 million systems annually Global infrastructure supporting the delivery of over 13 million warranty service events across 180 countries through 492 part hubs and 452 part suppliers Dell maintains 300 terabytes of customer data managing their 21,000 images #1 Ranking in Healthcare Information Systems Contractors1 #1 Information Technology Outsourcing Vendor2 Top Provider of IT Services for Government3 #1 ranking for Revenue Cycle Management Services4 Highly ranked in Gartner’s Magic Quadrants Why Dell and Perot systems… History of innovation and customer service Source: Dell Services and 1) Gartner’s Industry IT Services Worldwide Market Share Database; 2) 2008 Black Book of Outsourcing report; 3) Washington Technology's Top 100 List; 4) Black Book of Outsourcing Healthcare Industry
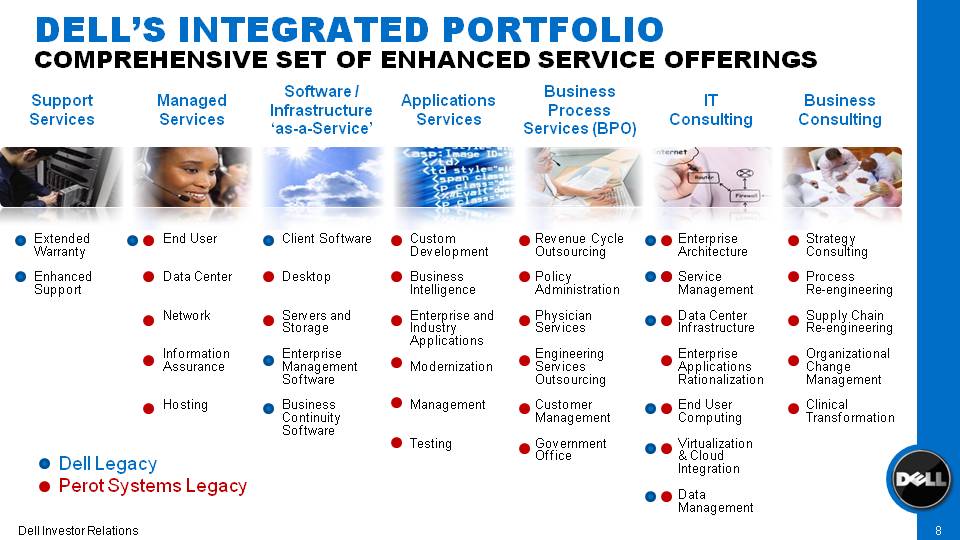
8 Dell’s Integrated Portfolio Comprehensive set of enhanced service offerings Support Services Extended Warranty Enhanced Support Managed Services End User Data Center Network Information Assurance Hosting Software/Infrastructure ‘as-a-Service’ Client Software Desktop Servers and Storage Enterprise Management Software Business Continuity Software Applications Services Custom Development Business Intelligence Enterprise and Industry Applications Modernization Management Testing Business Process Services (BPO) Revenue Cycle Outsourcing Policy Administration Physician Services Engineering Services Outsourcing Customer Management Government Office IT Consulting Enterprise Architecture Service ManagementData Center InfrastructureEnterprise Applications RationalizationEnd User ComputingVirtualization & Cloud Integration Data Management Business Consulting Strategy Consulting Process Re-engineering Supply Chain Re-engineering Organizational Change Management Clinical Transformation Dell Legacy Perot Systems Legacy
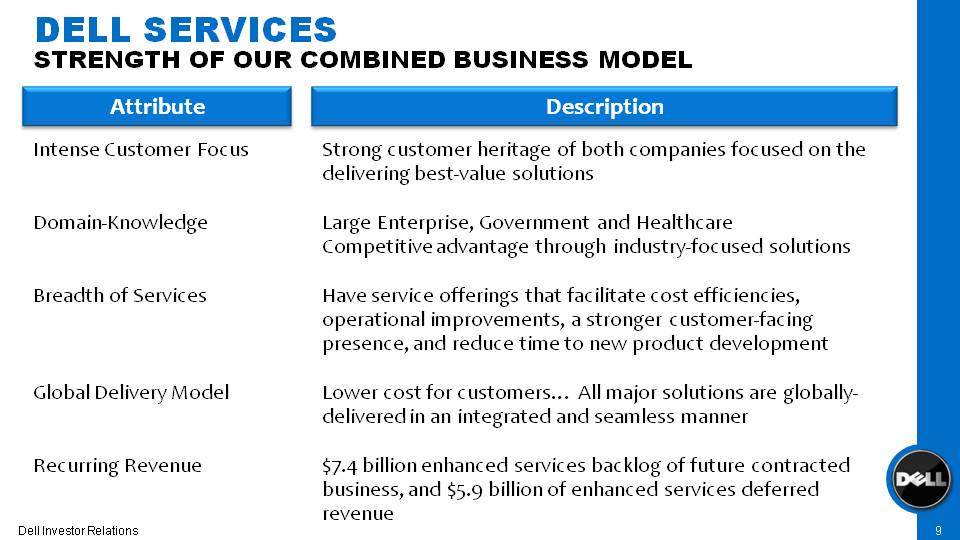
9 Dell Services Strength of our Combined Business Model Intense Customer Focus Domain-Knowledge Breadth of Services Global Delivery Model Recurring Revenue Attribute Description Strong customer heritage of both companies focused on the delivering best-value solutions Large Enterprise, Government and HealthcareCompetitive advantage through industry-focused solutions Have service offerings that facilitate cost efficiencies, operational improvements, a stronger customer-facing presence, and reduce time to new product development Lower cost for customers… All major solutions are globally-delivered in an integrated and seamless manner $7.4 billion enhanced services backlog of future contracted business, and $5.9 billion of enhanced services deferred revenue
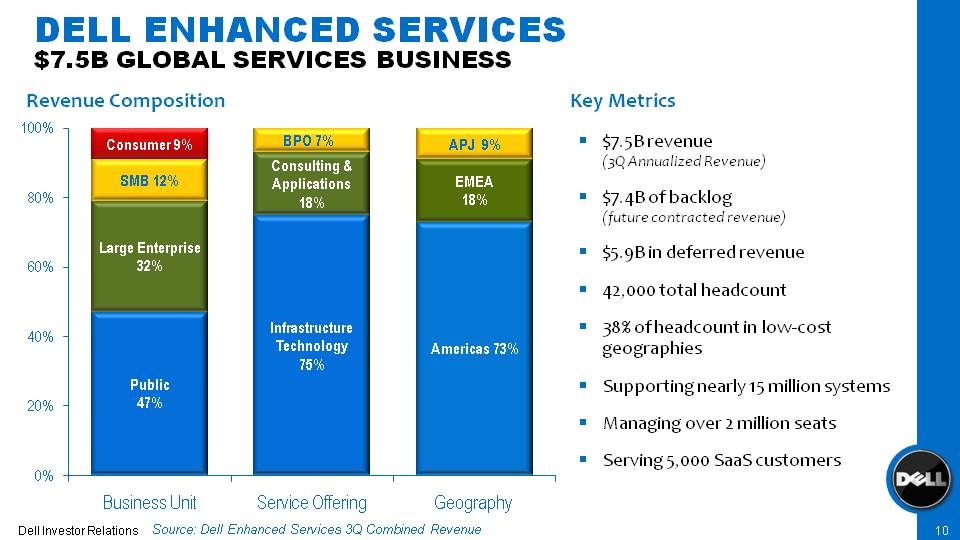
10 Dell Enhanced Services $7.5B Global Services Business Revenue Composition $7.5B revenue (3Q Annualized Revenue) (future contracted revenue) $5.9B in deferred revenue 42,000 total headcount 38% of headcount in low-cost geographies Supporting nearly 15 million systems Managing over 2 million seats Serving 5,000 SaaS customers Key Metrics Consumer 9% SMB 12% Large Enterprise 32% Public 47% BPO 7% Consulting & Applications 18% Infrastructure Technology 75% APJ 9% EMEA 18% Americas 73% Business Unit Service Offering Geography Source: Dell Enhanced Services 3Q Combined Revenue
11 Dell Services Public Paul Bell President, Public
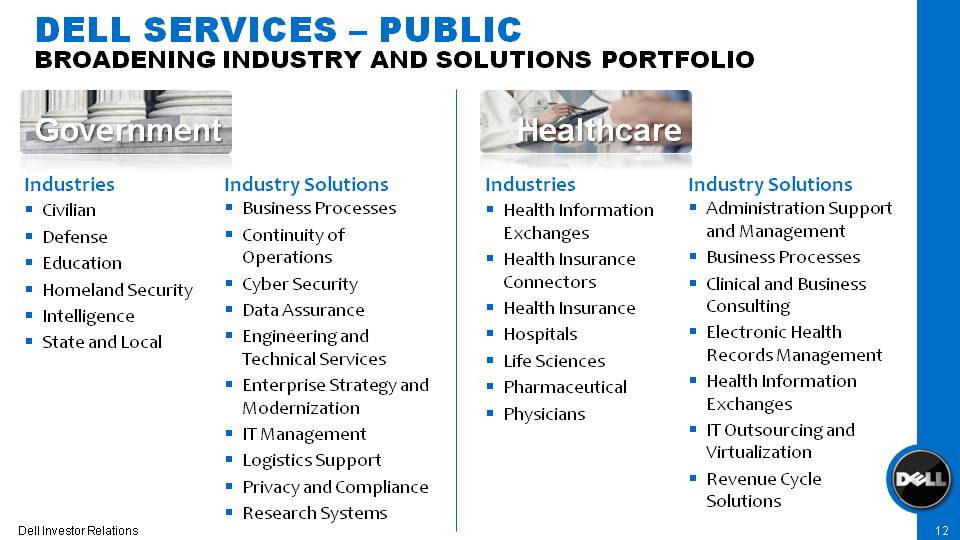
12 Dell Services – Public Broadening Industry and Solutions Portfolio Civilian Defense Education Homeland Security Intelligence State and Local Health Information Exchanges Health Insurance Connectors Health Insurance Hospitals Life Sciences Pharmaceutical Physicians Business Processes Continuity of Operations Cyber Security Data Assurance Engineering and Technical Services Enterprise Strategy and Modernization IT Management Logistics Support Privacy and Compliance Research Systems Administration Support and Management Business Processes Clinical and Business Consulting Electronic Health Records Management Health Information Exchanges IT Outsourcing and Virtualization Revenue Cycle Solutions Industries Industry Solutions Industries Industry Solutions Healthcare Government
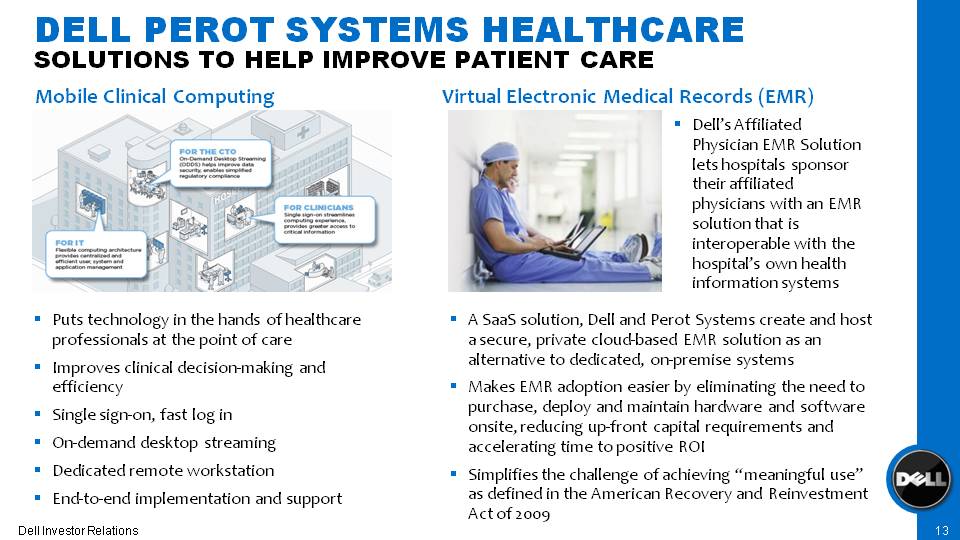
13 Dell Perot Systems Healthcare Solutions to help improve patient care Puts technology in the hands of healthcare professionals at the point of care Improves clinical decision-making and efficiency Single sign-on, fast log in On-demand desktop streaming Dedicated remote workstation End-to-end implementation and support Mobile Clinical Computing Virtual Electronic Medical Records (EMR) A SaaS solution, Dell and Perot Systems create and host a secure, private cloud-based EMR solution as an alternative to dedicated, on-premise systems Makes EMR adoption easier by eliminating the need to purchase, deploy and maintain hardware and software onsite, reducing up-front capital requirements and accelerating time to positive ROI Simplifies the challenge of achieving “meaningful use” as defined in the American Recovery and Reinvestment Act of 2009 Dell’s Affiliated Physician EMR Solution lets hospitals sponsor their affiliated physicians with an EMR solution that is interoperable with the hospital’s own health information systems
14 Dell Services Large Enterprise Steve Schuckenbrock President, Large Enterprise
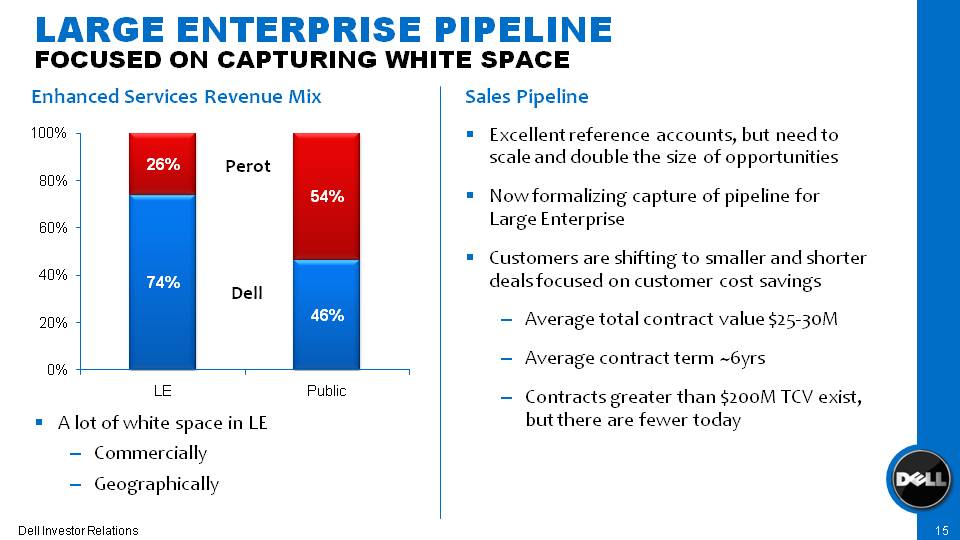
15 Large Enterprise Pipeline Focused on capturing white space Excellent reference accounts, but need to scale and double the size of opportunities Now formalizing capture of pipeline for Large Enterprise Customers are shifting to smaller and shorter deals focused on customer cost savings Average total contract value $25-30M Average contract term ~6yrs Contracts greater than $200M TCV exist, but there are fewer today Sales Pipeline Enhanced Services Revenue Mix A lot of white space in LE Commercially Geographically Dell Perot 26% 74% 54% 46% LE Public
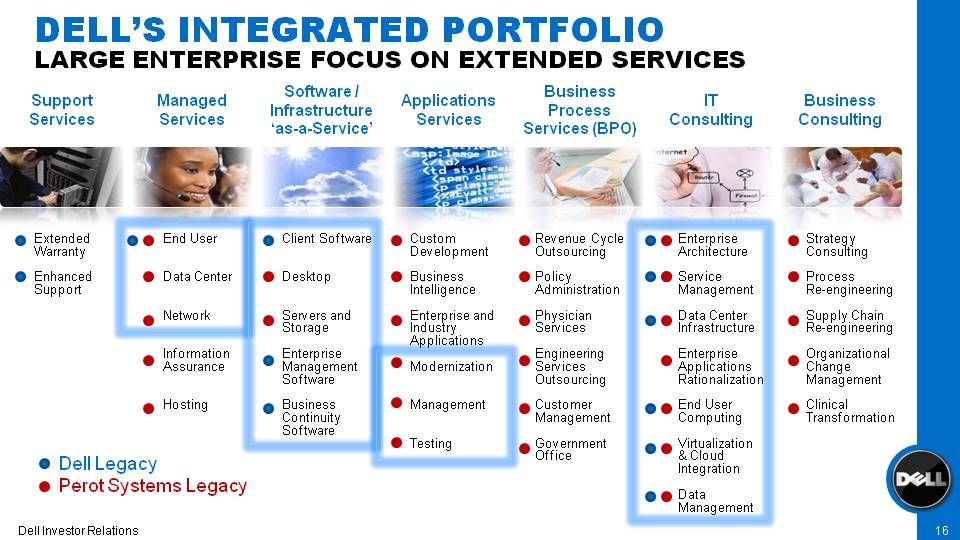
16 Dell’s Integrated Portfolio Large Enterprise focus on extended services Support Services Extended Warranty Enhanced Support Managed Services End User Data Center Network Information Assurance Hosting Software / Intrastructure ‘as-a-Service’ Client Software Desktop Servers and Storage Enterprise Management Software Business Continuity Software Applications Services Custom Development Business Intelligence Enterprise and Industry Applications Modernization Management Testing Business Process Services (BPO) Revenue Cycle Outsourcing Policy Administration Physician Services Engineering Services Outsourcing Customer Management Government Office IT Consulting Enterprise Architecture Service Management Data Center Infrastructure Enterprise Applications Rationalization End User Computing Virtualization & Cloud Integration Data Management Business Consulting Strategy Consulting Process Re-engineering Supply Chain Re-engineering Organizational Change Management Clinical Transformation Dell Legacy Perot Systems Legacy
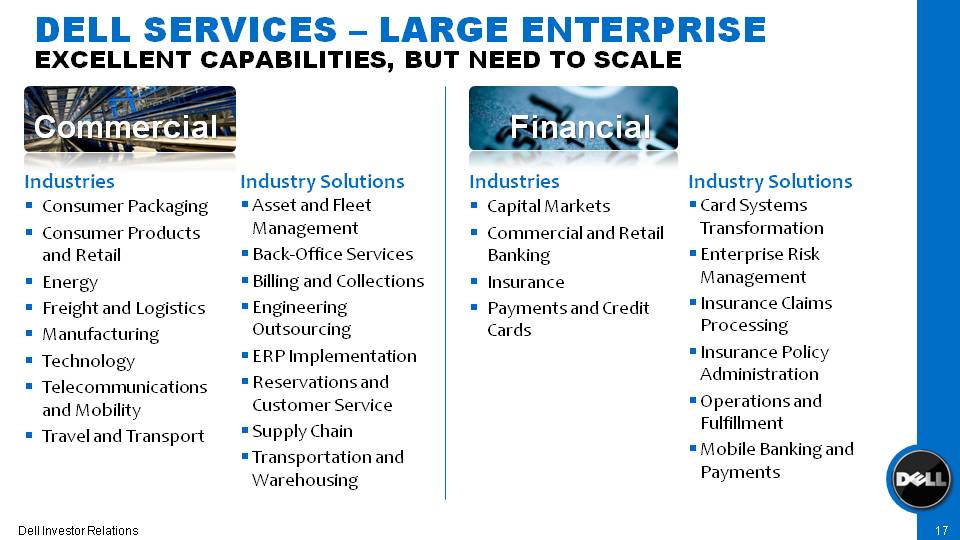
17 Dell Services – Large Enterprise Excellent capabilities, But need to scale Consumer Packaging Consumer Products and Retail Energy Freight and Logistics Manufacturing Technology Telecommunications and Mobility Travel and Transport Commercial Capital Markets Commercial and Retail Banking Insurance Payments and Credit Cards Asset and Fleet Management Back-Office Services Billing and Collections Engineering Outsourcing ERP Implementation Reservations and Customer Service Supply Chain Transportation and Warehousing Financial Card Systems Transformation Enterprise Risk Management Insurance Claims Processing Insurance Policy Administration Operations and Fulfillment Mobile Banking and Payments Industries Industry Solutions Industries Industry Solutions
18 Dell Services Financial Implications Brian Gladden Senior Vice President and CFO
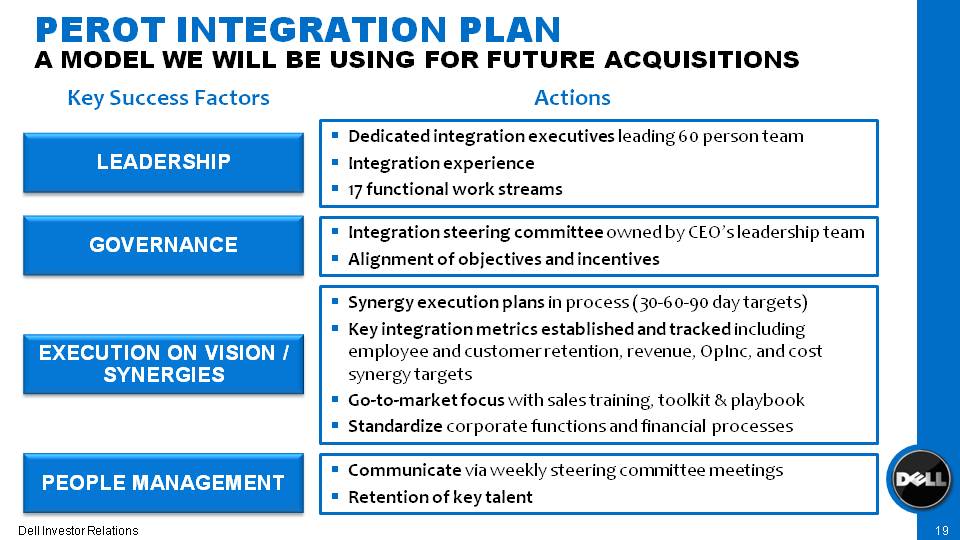
19 Perot Integration Plan A model we will be using for future acquisitions GOVERNANCE Integration steering committee owned by CEO’s leadership team Alignment of objectives and incentives EXECUTION ON VISION / SYNERGIES Synergy execution plans in process (30-60-90 day targets) Key integration metrics established and tracked including employee and customer retention, revenue, OpInc, and cost synergy targets Go-to-market focus with sales training, toolkit & playbook Standardize corporate functions and financial processes PEOPLE MANAGEMENT Communicate via weekly steering committee meetings Retention of key talent Dedicated integration executives leading 60 person team Integration experience 17 functional work streams LEADERSHIP Key Success Factors Actions
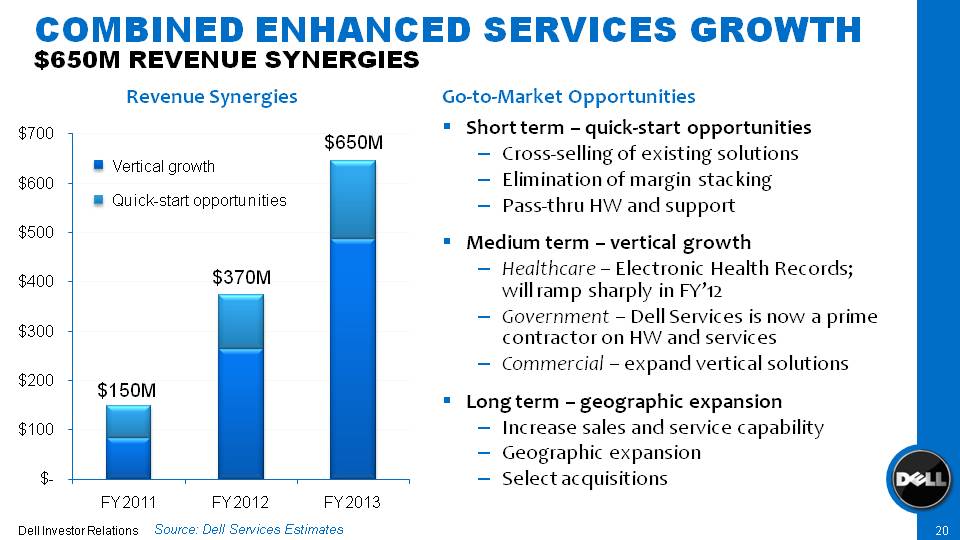
20 Combined Enhanced Services Growth $650M Revenue Synergies Go-to-Market Opportunities Short term – quick-start opportunities Cross-selling of existing solutions Elimination of margin stacking Pass-thru HW and support Medium term – vertical growthHealthcare – Electronic Health Records; will ramp sharply in FY’12 Government – Dell Services is now a prime contractor on HW and services Commercial – expand vertical solutions Long term – geographic expansionIncrease sales and service capability Geographic expansion Select acquisitions Revenue Synergies $150M $370M $650M Vertical growth Quick-start opportunities FY 2011 FY 2012 FY 2013 $- $100 $200 $300 $400 $500 $600 $700 Source: Dell Services Estimates
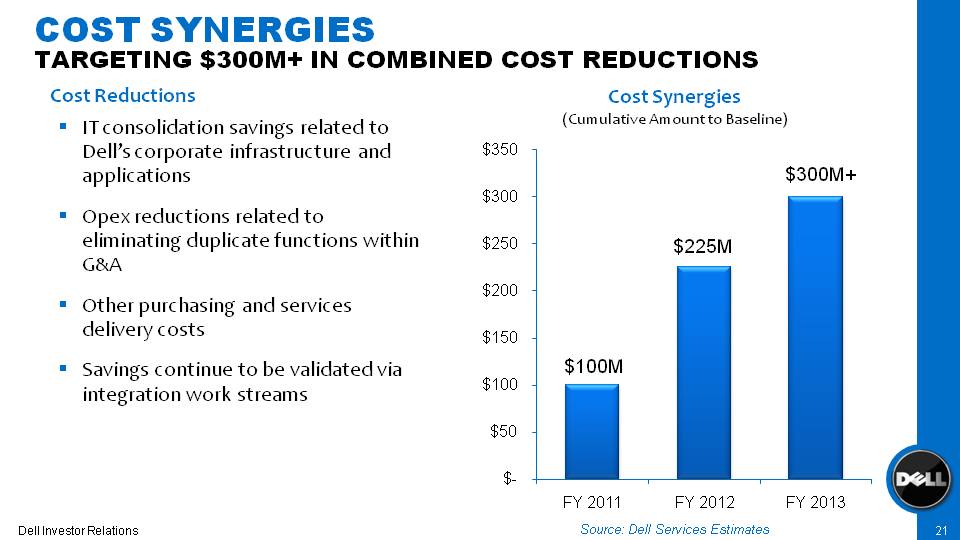
21 Cost Synergies Targeting $300M+ in combined Cost Reductions IT consolidation savings related to Dell’s corporate infrastructure and applications Opex reductions related to eliminating duplicate functions within G&A Other purchasing and services delivery costs Savings continue to be validated via integration work streams Cost Reductions Cost Synergies (Cumulative Amount to Baseline) Source: Dell Services Estimates $100M $225M $300M+ FY 2011 FY 2012 FY 2013 $- $50 $100 $150 $200 $250 $300 $350
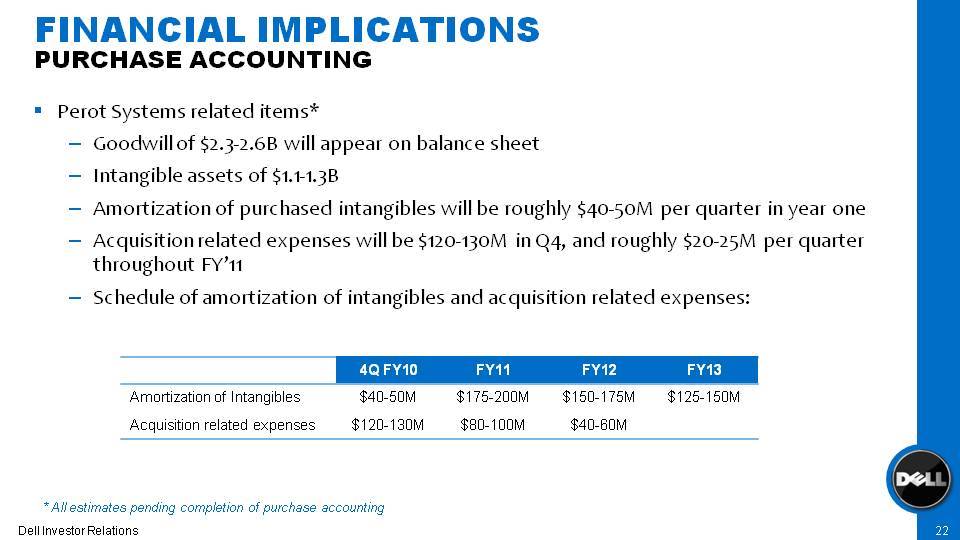
22 Financial Implications Purchase Accounting Perot Systems related items* Goodwill of $2.3-2.6B will appear on balance sheet Intangible assets of $1.1-1.3B Amortization of purchased intangibles will be roughly $40-50M per quarter in year one Acquisition related expenses will be $120-130M in Q4, and roughly $20-25M per quarter throughout FY’11 Schedule of amortization of intangibles and acquisition related expenses: Amortization of Intangibles Acquistion related expenses 4Q FY10 FY 11 FY 12 FY 13 $40-50M $175-200M $150-175M $125-150M $120-130M $80-100M $40-60M * All estimates pending completion of purchase accounting
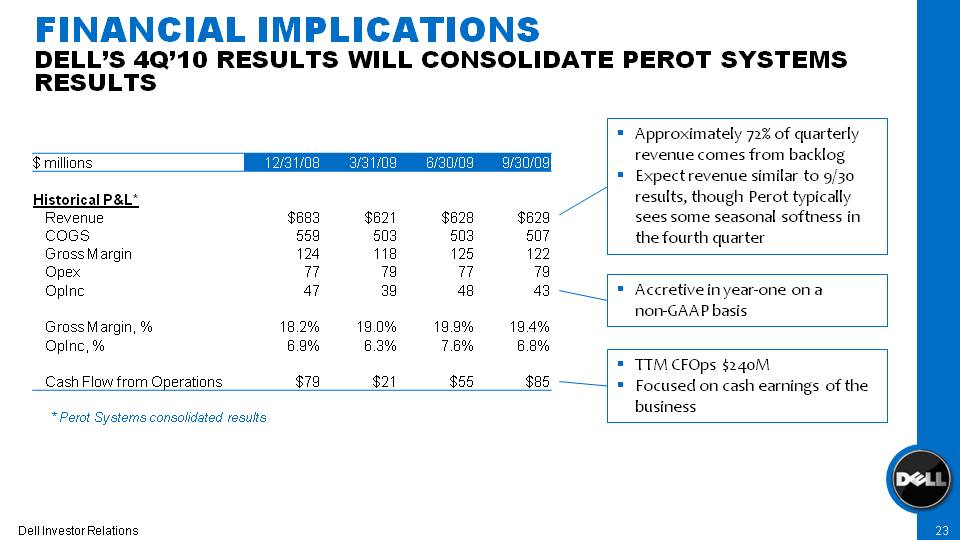
23 Financial Implications Dell’s 4Q’10 results will consolidate Perot Systems results Approximately 72% of quarterly revenue comes from backlog Expect revenue similar to 9/30 results, though Perot typically sees some seasonal softness in the fourth quarter Accretive in year-one on a non-GAAP basis TTM CFOps $240M Focused on cash earnings of the business $ millions 12/31/08 3/31/09 6/30/09 9/30/09 Historical P&L* Revenue $683 $621 $628 $629 COGS 559 503 503 507 Gross Margin 124 118 125 122 Opex 77 79 77 79 OpInc 47 39 48 43 Gross Margin, % 18.2% 19.0% 19.9% 19.4% OpInc, % 6.9% 6.3% 7.6% 6.8% Cash Flow from Operations $79 $21 $55 $85 * Perot Systems consolidated results
24 Supplemental Non-GAAP measures Definition* Non-GAAP financial measures exclude the effects of the following items from GAAP net income and GAAP earnings per share Amortization of purchased intangible assets Organizational effectiveness actions Acquisition related costs * A detailed discussion of our use of non-GAAP financial measures can be found in Dell’s Form 8-K dated December 16, 2009.
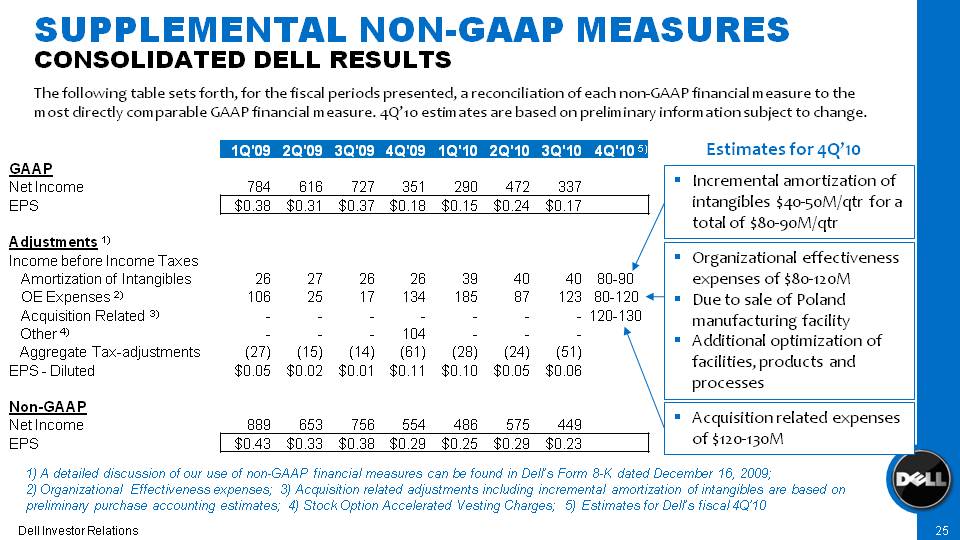
25 Supplemental Non-GAAP Measures Consolidated Dell Results The following table sets forth, for the fiscal periods presented, a reconciliation of each non-GAAP financial measure to the most directly comparable GAAP financial measure. 4Q’10 estimates are based on preliminary information subject to change. 1Q'09 2Q'09 3Q'09 4Q'09 1Q'10 2Q'10 3Q'10 4Q'10 5) GAAP Net Income 784 616 727 351 290 472 337 EPS $0.38 $0.31 $0.37 $0.18 $0.15 $0.24 $0.17 Adjustments 1) Income before Income Taxes Amortization of Intangibles 26 27 26 26 39 40 40 80-90 OE Expenses 2) 106 25 17 134 185 87 123 80-120 Acquisition Related 3) - - - - - - - 120-130 Other 4) - - - 104 - - - Aggregate Tax-adjustments (27) (15) (14) (61) (28) (24) (51) EPS - Diluted $0.05 $0.02 $0.01 $0.11 $0.10 $0.05 $0.06 Non-GAAP Net Income 889 653 756 554 486 575 449 EPS $0.43 $0.33 $0.38 $0.29 $0.25 $0.29 $0.23 1) A detailed discussion of our use of non-GAAP financial measures can be found in Dell’s Form 8-K dated December 16, 2009; 2) Organizational Effectiveness expenses; 3) Acquisition related adjustments including incremental amortization of intangibles are based on preliminary purchase accounting estimates; 4) Stock Option Accelerated Vesting Charges; 5) Estimates for Dell’s fiscal 4Q’10 Estimates for 4Q’10 Incremental amortization of intangibles $40-50M/qtr for a total of $80-90M/qtr Organizational effectiveness expenses of $80-120M Due to sale of Poland manufacturing facility Additional optimization of facilities, products and processes Acquisition related expenses of $120-130M
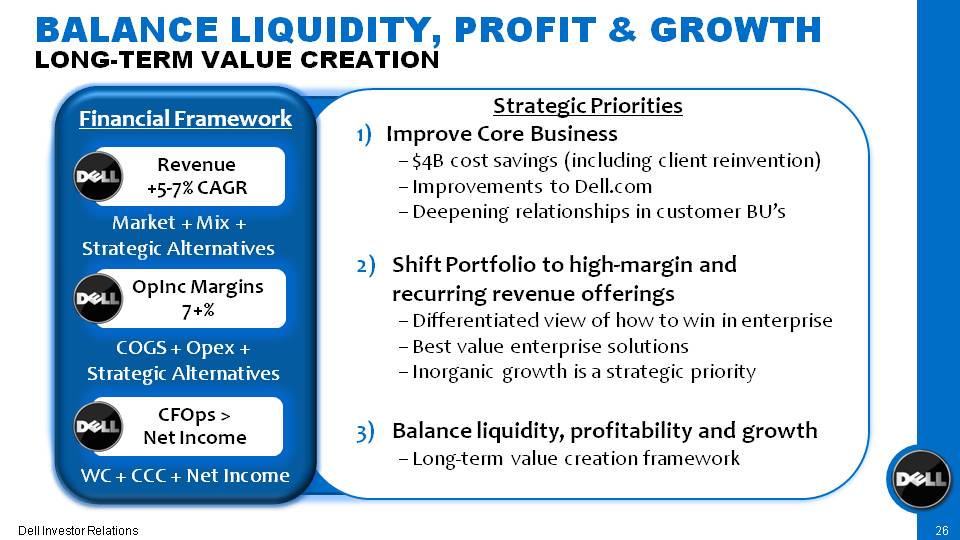
26 Balance Liquidity, Profit & Growth LONG-TERM VALUE CREATION Improve Core Business – $4B cost savings (including client reinvention) – Improvements to Dell.com – Deepening relationships in customer BU’s 2) Shift Portfolio to high-margin and recurring revenue offerings – Differentiated view of how to win in enterprise – Best value enterprise solutions – Inorganic growth is a strategic priority 3) Balance liquidity, profitability and growth – Long-term value creation framework Financial Framework Market + Mix + Strategic Alternatives COGS + Opex + Strategic Alternatives WC + CCC + Net Income Revenue +5-7% CAGR OpInc Margins 7+% CFOps > Net Income Strategic Priorities

27 Q&A
28 Summary Dell Services is… A top 10 global service provider Only one of 4 integrated service providersFocused on improving labor efficiency and reducing costRedefining services delivery by making them modular, easier to access, and simpler to managePositioned in key verticals with compelling growth trendsStrategic and financially accretive on a non-GAAP basis