Attached files
Table of Contents
UNITED STATES
SECURITIES AND EXCHANGE COMMISSION
Washington, D.C. 20549
Form 10-K
(Mark One)
| x | ANNUAL REPORT PURSUANT TO SECTION 13 OR 15(d) OF THE SECURITIES EXCHANGE ACT OF 1934. |
For the fiscal year ended September 30, 2009
| ¨ | TRANSITION REPORT PURSUANT TO SECTION 13 OR 15(d) OF THE SECURITIES EXCHANGE ACT OF 1934. |
For the transition period from to .
Commission file number 000-31089
Virage Logic Corporation
(Exact name of registrant as specified in its charter)
| Delaware | 77-0416232 | |
| (State or other jurisdiction of incorporation or organization) |
(I.R.S. Employer Identification Number) |
47100 Bayside Parkway, Fremont, California 94538
(Address of principal executive offices)
Registrants’ telephone number, including area code:
(510) 360-8000
Securities registered pursuant to Section 12(b) of the Act:
Common stock, $0.001 par value
(Title of class)
Securities registered pursuant to Section 12(g) of the Act:
None
Indicate by check mark if the registrant is a well-known seasoned issuer, as defined in Rule 405 of the Securities Act. Yes ¨ No x
Indicate by check mark if the registrant is not required to file reports pursuant to Section 13 or Section 15(d) of the Act. Yes ¨ No x
Indicate by check mark whether the registrant (1) has filed all reports required to be filed by Section 13 or 15(d) of the Securities Exchange Act of 1934 during the preceding 12 months (or for such shorter period that the registrant was required to file such reports), and (2) has been subject to such filing requirements for the past 90 days. Yes x No ¨
Indicate by check mark whether the registrant has submitted electronically and posted on its corporate Web site, if any, every Interactive Data File required to be submitted and posted pursuant to Rule 405 of Regulation S-T during the preceding 12 months (or for such shorter period that the registrant was required to submit and post such files). Yes ¨ No ¨
Indicate by check mark if disclosure of delinquent filers pursuant to Item 405 of Regulation S-K is not contained herein, and will not be contained, to the best of registrant’s knowledge, in definitive proxy or information statements incorporated by reference in Part III of this Form 10-K or any amendment to this Form 10-K. ¨
Indicate by check mark whether the registrant is a large accelerated filer, an accelerated filer, or non-accelerated filer (as defined in Exchange Act Rule 12b-2).
| Large accelerated filer ¨ |
Accelerated filer x | Non-accelerated filer ¨ (Do not check if a smaller reporting company) |
Small reporting company ¨ |
Indicate by check mark whether the registrant is a shell company (as defined in Rule 12b-2 of the Act). Yes ¨ No x
The aggregate market value of the issuer’s common stock held by non-affiliates as of March 31, 2009 was approximately $60 million based upon the closing price of $3.36 reported for such date on the Nasdaq Global Market. For purposes of this disclosure, shares of common stock held by persons who hold more than 5% of the outstanding shares of common stock and shares held by officers and directors of the issuer have been excluded because such persons may be deemed to be affiliates. This determination of affiliate status is not necessarily a conclusive determination for other purposes.
The number of shares of the registrant’s common stock outstanding as of November 30, 2009 was 26,539,267.
DOCUMENTS INCORPORATED BY REFERENCE
Portions of the registrant’s proxy statement for its 2010 Annual Meeting of Stockholders are incorporated by reference into Part III of this Annual Report on Form 10-K as noted.
Table of Contents
INDEX TO
ANNUAL REPORT ON FORM 10-K
FOR YEAR ENDED SEPTEMBER 30, 2009
TABLE OF CONTENTS
2
Table of Contents
With the exception of statements of historical fact, all statements made in this report on Form 10-K, including those in “Management’s Discussion and Analysis of Financial Condition and Results of Operations” in Item 7, are forward-looking statements within the meaning of the Private Securities Litigation Reform Act of 199 that involve risks and uncertainties. These forward-looking statements include statements relating to strategy, products, customers, business prospects, relationships and trends, and statements of the assumptions underlying or relating to any of the foregoing statements. In some cases, forward-looking statements can be identified by terminology such as “may,” “will,” “should,” “expect,” “anticipate,” “intend,” “plan,” “believe,” “estimate,” “potential,” or “continue,” the negative of these terms or other comparable terminology. Forward-looking statements are subject to a number of known and unknown risks and uncertainties which might cause actual results to differ materially from those expressed or implied by such statements. These risks include an ability to forecast our business, including our revenue, income and order flow outlook, to meet financial expectations, to deliver products that meet customer specifications, to deliver our customized products in the time-frame demanded by our customers, to execute on our strategy of serving as the semiconductor industry’s trusted provider of a broad line of semiconductor IP products, to continue to develop new products and maintain and develop new relationships with pure-play foundries, integrated device manufacturers, and fabless companies, to overcome the challenges associated with establishing licensing relationships with semiconductor companies, to obtain royalty revenues from customers in addition to license fees, to receive accurate information necessary for calculation of royalty revenues and to collect royalty revenues from customers, business and economic conditions generally and in the semiconductor industry in particular, pace of adoption of new technologies by our customers, competition in the market for semiconductor IP, to execute on our growth strategy including through acquisitions and to effectively integrate acquired businesses and product lines into our business, and other risks and uncertainties including those set forth below under “Risk Factors”. These forward-looking statements speak only as of the date hereof; we do not intend, and undertake no obligation to release publicly any updates or revisions to any forward-looking statements contained herein. The discussion of our financial condition and results of operations in this report on Form 10-K should be read together with the consolidated financial statements and the notes thereto included elsewhere in this filing.
General
Founded in 1995, Virage Logic Corporation (Virage Logic or the Company) provides semiconductor intellectual property (IP) and services to more than 400 semiconductor companies worldwide. Historically we were primarily engaged in the development and marketing of embedded memory IP products. After the acquisition of In-Chip Systems, Inc. (In-Chip Systems or In-Chip) in May 2002, we expanded our physical IP product offering to also include standard cell logic component products. In August 2007, we acquired Ingot Systems, Inc. (Ingot Systems or Ingot), a privately held provider of functional, or application specific IP (ASIP), including Double Data Rate (DDR) memory controllers, Physical Interfaces (PHYs), and Delay Locked Loops (DLLs). In June 2008, we further expanded our product portfolio when we acquired the non-volatile embedded memory (NVM) IP business of Impinj Inc. (Impinj). Impinj’s AEON® product line complements Virage Logic’s NOVeA® NVM products and we believe it essentially establishes Virage Logic as the multiple-time programmable NVM market leader.
In 2009, we accelerated the expansion of our product line. First, in January 2009, we announced a licensing agreement with AMD that grants Virage Logic the rights to license, modify and sell standards-based advanced interface IP that AMD designed for use in its extensive graphics processor product line. This agreement enabled Virage Logic to expand its product line to include complete standards-based solutions for PCI Express (PCIe) and Mobile Industry Processor Interface (MIPI®) as well as a unique multi-protocol IP solution for High-Definition Multimedia Interface (HDMI), Digital Visual Interface (DVI) and DisplayPort interfaces. Second, in September 2009, we acquired publicly held ARC International plc (ARC International or ARC), a leading provider of consumer IP to OEM and semiconductor companies globally. The ARC acquisition, which closed in
3
Table of Contents
September 2009, expanded Virage Logic’s ability to serve the global semiconductor market by complementing our existing portfolio of physical IP and standards-based advanced interface IP with ARC’s widely accepted processor IP, a necessary component for complex System-on-Chip (SoC) integrated circuits. Finally, in November 2009 we acquired from NXP B.V., a leading semiconductor company founded by Royal Philips Electronics Inc., certain rights to IP assets associated with selected NXP advanced CMOS libraries, IP blocks and SoC infrastructure along with other classes of semiconductor IP, including approximately 25 associated patent families and certain related equipment. We believe the continuing expansion of our product portfolio positions us to be even more attractive to our customers’ semiconductor design efforts by providing high value IP across a broad spectrum of the functional elements of the chip, made available on a broad offering of technology nodes and manufacturing processes.
The various forms of IP we offer are utilized by our customers to design and manufacture System-on-Chip (SoC) integrated circuits that are the foundation of today’s consumer, communications and networking, hand-held and portable devices, computer and graphics, automotive, and defense applications. Our semiconductor IP offering consists of (1) compilers that allow chip designers to configure our memories, or SRAMs, into different sizes and shapes on a single silicon chip, (2) IP and development solutions for embedded test and repair of on-chip memory instances, (3) software development tools used to design memory compilers, (4) NVM instances, (5) logic cell libraries, (6) DDR memory controller, PCIe, HDMI/DVI/DisplayPort and MIPI® interface IP components, and (7) configurable 32-bit processor cores and vertical application solutions. We also provide design services related to our IP to the semiconductor industry.
Our customers include:
| • | leading fabless semiconductor companies such as 3Leaf Systems (3Leaf), Agilent Technologies, Inc. (Agilent), Broadcom Corporation (Broadcom), Conexant Systems, Inc. (Conexant), Ikanos Communications, Inc. (Ikanos), Kawasaki Microelectronics (K-Micro), LSI Corporation (formerly LSI Logic and Agere), Marvell Technology Group, Ltd (Marvell), Movidia, Ltd (Movidia), NextIO, Inc (NextIO), PMC-Sierra, Inc. (PMC-Sierra), TranSwitch Corporation (TranSwitch), Thomson Silicon Components (Thomson), and Via Technologies, Inc. (Via Technologies); |
| • | leading integrated device manufacturers (IDMs) such as Analog Devices, Inc. (ADI), Atmel Corporation (Atmel), Avago Technologies (Avago), Freescale Semiconductor, Inc. (Freescale), Fujitsu Limited (Fujitsu), Hewlett-Packard Company (HP), Infineon Technologies, Inc. (Infineon), Intel Corporation (Intel), Lenovo Group (Lenovo), NEC Corporation (NEC), NXP Semiconductors (formerly Philips Semiconductor B.V.), Sharp Electronics Corporation (Sharp), Sony Corporation (Sony), STMicroelectronics (STMicro), Texas Instruments (TI), and Toshiba Corporation (Toshiba); |
| • | semiconductor foundries such as Taiwan Semiconductor Manufacturing Company (TSMC), Chartered Semiconductor Manufacturing (Chartered), Dongbu HiTek Ltd. (Dongbu HiTek), Grace Semiconductor (Grace), HeJian Technology (HeJian), IBM Corporation (IBM), MagnaChip Semiconductor (MagnaChip), SilTerra Malaysia Sdn. Dhd. (SilTerra), Silicon Manufacturing International Corporation (SMIC), Tower Semiconductor, Ltd. (Tower), and United Microelectronics Company (UMC). |
We develop our embedded memory, logic, NVM, DDR PHY, and DLL, and PCIe, HDMI/DVI/DisplayPort and MIPI products to comply with the silicon manufacturing processes used for our customers’ products. For our integrated device manufacturer customers, we develop our products to comply with the processes used by their internal manufacturing facilities. For our fabless semiconductor customers, we develop our products to comply with the processes of the pure-play semiconductor manufacturing facilities or foundries, which these companies rely on to manufacture the integrated circuits (ICs) for their products. We also pre-test certain products before their release to the market by designing and manufacturing specialty ICs containing our semiconductor IP targeted for specific processes, so that we can provide our customers with silicon data and help ensure that ICs designed with our semiconductor IP will be manufacturable, while providing desired production yields. Our products are certified for production by several of the established pure-play foundries such as Chartered, IBM,
4
Table of Contents
TSMC, and UMC, as well as some of the emerging pure-play foundries such as Dongbu HiTek, Grace, HeJian, MagnaChip, SilTerra, SMIC, and Tower that are used by fabless semiconductor companies. Because we ensure that certain products are silicon-proven and production ready, our customers can proceed with confidence and benefit from shorter design times for new product development and reduced design and manufacturing costs.
Corporate Information
We incorporated in California on November 27, 1995. We reincorporated in Delaware on July 25, 2000. Our principal executive offices are located at 47100 Bayside Parkway, Fremont, California 94538. Our telephone number is (510) 360-8000. Our website address is www.viragelogic.com. Information on or linked to our website is not intended to be part of this report and shall not be deemed to be incorporated herein. We make available free of charge on our website our annual report on Form 10-K, quarterly reports on Form 10-Q, current reports on Form 8-K and amendments to those reports filed or furnished pursuant to Section 13(a) or 15(d) of the Securities Exchange Act of 1934, as amended, as soon as reasonably practicable after we electronically file such material with, or otherwise furnish it to, the Securities and Exchange Commission, or the SEC.
The public may also read and copy any materials we file with the SEC at the SEC’s Public Reference Room at 100 F Street, N.E., Room 1580, Washington, D.C. 20549. The public may obtain information on the operation of the Public Reference Rooms by calling the SEC at 1-800-SEC-0330. The SEC also maintains an Internet website that contains reports, proxy and information statements and other information regarding issuers that file electronically with the SEC. The SEC’s Internet website is located at http://www.sec.gov.
Industry Background
The proliferation of consumer and wireless products, the growth of the Internet, and the development of higher speed computers and more robust visual communication systems as well as the increasing electronics content in automotive and defense applications, is increasingly creating demand for electronic devices that offer higher complexity and higher performance while consuming less power in order to meet complex functional requirements. The designers of these products are seeking semiconductor process technologies that will enable them to minimize the power, decrease the size, reduce the manufacturing costs and enhance the performance of their products. In response to this demand, semiconductor companies have developed technologies that permit entire electronic systems, including the microprocessor, communications, custom function logic, graphics and memory elements, to be contained on a single silicon chip, called System-on-Chip (SoC), rather than on a circuit board.
Successful SoC design depends upon the reliable integration of the various components of the chip. Each component must comply with the manufacturing standards, or design rules, of the manufacturing facility that will produce the chip. Since different technical expertise and IP is required for each component of a SoC, it is excessively expensive for many companies to internally develop all of the various IP needed for these components. In addition, the designers of products that use SoCs are facing increased market pressure to rapidly introduce new products, which shortens the time available for research and development involved in the design of a SoC and to reduce development costs. In order to meet the continuously increasing technical expertise requirements for the design of a SoC and the time constraints involved in such design, an increasing number of semiconductor companies are focusing on their core competencies, or value-add, and are relying on external providers for the technical expertise and IP for various other non-core components of their SoC designs. The use of silicon-proven third party IP components helps enable semiconductor companies to meet market pressures while allowing them to continue to focus on the components of the SoC that constitute their core competencies. This industry trend is important as it plays to Virage Logic’s strengths and provides a growing opportunity for the company to serve as a trusted IP provider.
The increasing demand for a broad range of consumer electronics, high-performance computing and communications applications and the availability of increased bandwidth for Internet applications has made memory an increasingly critical element of the overall operation of SoCs used for these applications.
5
Table of Contents
Historically, integrated circuit designs were dominated by the logic function, while memory storage was typically provided in external devices. However, the market demand for increased system operating speed and increasingly smaller consumer devices results in increased integration of the memory storage elements inside the SoCs, resulting in smaller, faster and more power efficient products. This trend of embedding memory also resulted in the requirement for more specialized memory elements. The need for this proximity, as well as advances in semiconductor technology and the ability to customize the size and configuration of memory functions within a SoC, is creating increased demand for embedded memory components. It is now common for SoCs to contain many memories with different functions configured in different sizes and shapes to optimize the area and functionality of the chip. The Semiconductor Industry Association (SIA) forecasts that the amount of area dedicated to memory in a typical SoC will grow to more than 80 percent by 2010.
Semiconductor companies face significant challenges in designing low power, high-performance and area efficient memories that can be easily integrated with other components for their SoC devices. Due to continuing advancements in the semiconductor manufacturing lithography processes, new circuit design elements have generally been required every few years. The internal design teams of semiconductor companies typically lack the dedicated resources necessary to keep pace with rapidly evolving memory design technology advancements. These factors have created a market need for third-party providers of highly reliable, low power, high-performance and area efficient IP components such as memory and logic IP, as well as a variety of functional IP components such as high-speed interfaces and processor cores and vertical application solutions.
Finally, there are a number of markets–power management, secure media, wireless, sensors and precision analog–that are of significant interest to semiconductor manufacturers. These markets have two distinct characteristics in common: they are large, rapidly growing markets that drive wafer start demands at the world’s leading foundries and they demand features and functions facilitated by the addition of relatively small bit-count embedded NVM. To address this growing opportunity, in June 2008, Virage Logic acquired Impinj’s NVM IP business to complement its NOVeA® NVM product line. Together, the combined product line establishes a broad logic NVM IP product portfolio ranging from 250- to 65-nanometer solutions, servicing markets ranging from high volume consumer and industrial to automotive and security conscious applications including military. In September 2009, Virage Logic acquired ARC International, a leading provider of microprocessor IP and solutions to OEM and semiconductor companies globally. The addition of ARC as part of Virage Logic offers the potential for the creation of larger, more highly evolved IP blocks to better meet the needs of a changing marketplace, all available from a single source.
The Virage Logic Strategy
Our objective is to be the premier broad line supplier of semiconductor IP solutions to the global semiconductor industry and our mission is to serve as the semiconductor industry’s trusted IP partner. With this in mind, in early fiscal 2007, the Company identified four key goals that provide the foundation for building a scalable, profitable business.
Build Virage Logic into the Company that is truly the Semiconductor Industry’s Trusted IP Partner
As the semiconductor industry continues to streamline and specialize in order to maximize differentiation and ultimately competitiveness and profitability, leading semiconductor companies are looking for reliable suppliers, or partners, that can become a virtual extension of their internal research and development (R&D) groups. We see an increasing opportunity for Virage Logic to serve as the semiconductor industry’s trusted IP partner. Over the last decade, we have become a highly specialized and therefore highly efficient developer of semiconductor IP. Today more than 400 customers look to Virage Logic to provide much of the core building blocks of their SoC designs.
6
Table of Contents
We believe there are four key qualifications that enable us to serve as the semiconductor industry’s trusted IP partner:
| • | Technology Leadership—Engineering and R&D comprise more than 75 percent of our company’s headcount, which has enabled Virage Logic to establish a long history of being first-to-market with innovative, leading IP solutions. We have a proven track record of being first-to-market with products at the advanced manufacturing process technologies such as 65-nanometer, 45/40-nanometer, and most recently at 32/28-nanometer. We were the first IP company with silicon-proven IP for TSMC’s 65-nanometer and 45/40-nanometer processes and at 45/40-nanometer processes, TSMC named Virage Logic as their Early Development Partner. As of September 30, 2009, we had three 32/28-nanometer customers. |
| • | Proven Execution—In order to streamline our product development process and improve our operational execution, we established an organizational structure in 2007 that separated our R&D efforts from our Engineering activities. This involved establishing an Advanced Development group that has been focused on building next generation standard products. These changes have enabled the Engineering group to accelerate the development of our standard, off-the-shelf products and allowed the R&D group to focus on advanced product technology development. We have reaped the benefits of this organizational structure in terms of a greater percentage of our revenues coming from standard products on advanced process nodes, which contribute higher gross margins than custom development projects. In 2009, we furthered the efficiency of our product development process through a restructuring that involved closing two of our smaller R&D centers located in New Jersey and Minnesota. The development previously done at these locations was transferred to our Fremont, California headquarters or our development centers in Armenia and India. In addition, we consolidated our non-volatile memory development to our Seattle R&D center that was established as a result of the acquisition of Impinj Inc.’s NVM IP business in June of 2008. These transformational changes that we have been driving over the past two years have focused our execution on developing market-driven, feature-rich, standard and less-customized products. We are continuing to analyze future additional restructurings, in particular in light of new employees hired as a result of the ARC and NXP transactions. |
In 2009, we also aligned our global sales organization to better meet current customer requirements and future market opportunities. Through a mix of direct sales staff and sales representatives, we were able to optimize market penetration and minimize selling expenses.
| • | An Integral Part of the SoC Design and Manufacturing Ecosystem—As a provider of third-party semiconductor IP, we work closely with our partners–including Design Services, Electronic Design Automation (EDA) and Test, IP and foundry companies–to help increase interoperability and provide access to complete solutions that enable mutual customers to reduce their design time and improve manufacturability of their electronics products. |
We work with all of the established pure-play foundries to qualify our semiconductor IP for high-volume production in their manufacturing processes. In this manner, we are in a position to provide embedded memories, logic and high-speed interface IP elements that are silicon-proven for a specific foundry’s manufacturing process, directly to that foundry’s customer base. Our close associations with these foundries also give us early access to information for advanced processes, thereby enabling us to be among the first-to-market products on smaller process geometries.
| • | Portfolio of Business and Engagement Models—We offer a variety of business and engagement models that provide fabless, IDM and foundry customers the flexibility to engage with us in a manner that is most beneficial for their business objectives. From a single transaction or project based engagement to a multi-year, multi-product engagement, we offer engagement models that suit the broad range of end-customer requirements. |
7
Table of Contents
We are particularly proud of a strategic partnership that we announced in January 2009 with AMD because it represents a new and innovative engagement model. The agreement granted Virage Logic the rights to license, modify and sell the standards-based advanced interface IP that AMD developed for use in their extensive graphics processor product line. The agreement provided for silicon proven technology and expertise for PCIe, HDMI and MIPI interfaces at advanced process nodes which enabled us to hit the ground running in this new product area and rapidly bring to market a proven interface IP product line. These new products expanded our existing DDR Memory interface IP offering—established as a result of our acquisition of Ingot Systems in August 2007—which enabled us to increase our Interface IP product portfolio four-fold. This innovative collaboration with our ecosystem partner is an example of how we can maximize return on investment and help ensure profitability while meeting the increasing demands for complex products that must be delivered in narrow market windows.
Make Virage Logic the Company that is Always First to Market
As a result of our early leadership at 40-nanometer and more recently at 28-nanometer, we believe our SiWare™ Memory and SiWare™ Logic products offer the industry’s broadest portfolio of silicon proven IP on this technology node. By the end of fiscal 2009, about 15 of our customers were actively designing SoCs with our 40nm IP, representing about 25 tape-outs over the next six months. This level of activity is resulting in continued growth in 45/40-nanometer royalty revenues. Also, during the fourth quarter of fiscal 2009, we booked our third deal in the 32/28-nanometer node. This deal was especially significant as it represented our first multi-year, multi-million dollar 28-nanometer engagement with an end customer, a leading IDM.
Broaden Virage Logic’s Product Portfolio
Through a combination of ongoing R&D efforts and inorganic growth initiatives, the number of our product offerings has quadrupled since fiscal year 2007. Based on reports by industry analysts, we believe that the resulting non-captive served available market (SAM) will grow from $200 million in 2007 to approximately $1 billion in 2010, positioning us well to serve as a single source supplier of a broad range of semiconductor IP. As two examples, the recent acquisition of ARC International expanded our product portfolio to include microprocessor cores and media subsystems and software, representing the largest segment of the semiconductor IP market, and the recent acquisition of the products from NXP expanded our product portfolio to include advanced CMOS libraries, IP blocks and SoC infrastructure. With approximately $24 million in revenue for the trailing twelve months ended June 30, 2009 and over 150 customers, ARC should contribute meaningful scale to our business. In addition, in connection with the acquisition of the NXP products in November 2009, we entered into a master license agreement and a technology service agreement with NXP, pursuant to which they have agreed to pay us $60 million for IP rights, support and engineering services over the next four years.
Build a Strong Demand Creation Capability
In fiscal 2009, we continued to improve overall efficiency and strengthen our global demand creation capability. We also continued to expand our existing distribution channels by both selectively hiring direct sales force members and signing on representatives to service key markets worldwide. Finally, we intend to continue developing deeper strategic engagements with our SoC design ecosystem partners to leverage their extensive United States and international sales organizations. As a result of these on-going initiatives, our license pipeline has grown throughout the year and we begin fiscal 2010 with a strong license opportunity pipeline.
In summary, fiscal 2009 marked an inflection point and represented a pivotal year for Virage Logic. We executed well on our inorganic growth initiatives, made continued significant progress on becoming a standard product company versus custom shop, and established deeper, strategic engagements. Our sales pipeline continued to increase and points to strong future growth in terms of both dollar value and individual deal size. Finally, the continuing shift the large semiconductor IDMs are making towards a ‘fabless’ or ‘fab-lite’ business model, plays to our core strengths and enables us to serve as an increasingly trusted IP partner.
8
Table of Contents
The Virage Logic Overview
Founded in 1995, Virage Logic rapidly established itself as a technology and market leader in providing advanced embedded memory IP for the design of complex integrated circuits. In 2002, the Company acquired In-Chip Systems and added logic libraries to its growing product portfolio.
In 2005, to help SoC designers address the complex predictability and manufacturability challenges at advanced process nodes, Virage Logic pioneered a new class of semiconductor IP called Silicon Aware IP™. The Company’s Silicon Aware IP™ offering (embedded memories and logic libraries) incorporates silicon behavior knowledge for increased predictability and manufacturability. This intelligence includes hardware implementations for optimal yield in the design phase and extends to include test, repair, and diagnostics for manufacturability. Because Silicon Aware IP understands the behavior of silicon and is able to address post-silicon issues, it is key in helping designers maximize yield, increase test quality, increase reliability, decrease time-to-volume, and improve overall manufacturability.
In 2007, through its acquisition of Ingot, Virage Logic further expanded its product offering to include Application Specific IP solutions such as DDR memory controllers and design services. This product line extended Virage Logic’s Silicon Aware IP offering into a new class of IP we call System Aware IP™. System Aware IP helps systems designers address the challenges of the environment–SoC core to interface, interface to package, package to board, and other SoCs–including the impact on the system behavior and performance. System Aware IP is designed to mitigate any impact the environment may have on the overall system to ensure performance and functionality requirements are met.
In 2008, the Company acquired Impinj’s NVM IP business. The products from this business complement our NOVeA Non-Volatile Reprogrammable memory products and the purchase extends Virage Logic’s embedded memory leadership position into the rapidly growing NVM market for standard CMOS processes. In particular, the Impinj’s NVM IP broadens our reach into the higher density Few Times Programmable market, as well as the high voltage NVM market. Both products are critical for advanced semiconductor power management applications.
In 2009, the Company signed an agreement with AMD which enables the Company to provide AMD’s silicon-proven technology for PCIe, HDMI and MIPI interfaces at advanced process nodes to companies seeking to leverage existing IP in order to help speed product development. In the fourth quarter, the Company also acquired ARC International. This acquisition expanded the Company’s product portfolio to include microprocessor cores and media subsystems and software. Finally, in November 2009 we acquired from NXP B.V., a leading semiconductor company founded by Royal Philips Electronics Inc., certain rights to IP assets associated with selected NXP advanced CMOS libraries, IP blocks and SoC infrastructure along with other classes of semiconductor IP, including approximately 25 associated patent families and certain related equipment.
As the semiconductor industry’s trusted IP partner, more than 400 foundries, IDMs and fabless customers rely on Virage Logic to achieve higher performance, lower power, higher density and optimal yield, as well as shorten time-to-market and time-to-volume. Our customers develop products for the consumer, communications and networking, hand-held and portable, computer and graphics, automotive and defense markets.
The Company makes its products available for the manufacturing processes of both the established and emerging pure-play semiconductor foundries in order to provide customers with flexibility in manufacturing choices. Furthermore, the Company uses its FirstPass-Silicon Characterization Lab™ for certain products to help ensure high quality, reliable IP across a wide range of foundries and process technologies. Finally, the Company prides itself on providing superior customer support and was named the 2006 Customer Service Leader of the Year in the Semiconductor IP Market by Frost & Sullivan.
9
Table of Contents
Key benefits of Virage Logic’s solution include the following:
| • | Single Source Broad Line Supplier. The Company’s highly differentiated product portfolio includes embedded SRAMs, embedded NVMs, embedded test and repair, logic libraries, memory development software, DDR memory controller subsystems. |
| • | Memory Design Expertise. Our memory design expertise allows us to provide our customers with leading-edge memory technologies for advanced manufacturing processes. We have assembled a global team of engineers focused exclusively on memory design. This team includes senior level engineers with significant expertise in various types of memory design, including SRAM, DRAM and NVM. |
| • | Logic Design Expertise. Our Logic cell libraries are developed based on patented technology that addresses the key challenges of advanced manufacturing processes. We have a dedicated team of engineers focused exclusively on logic cell library research, development and design. |
| • | Interface IP Design Expertise. Through the acquisition of Ingot Systems in August 2007, we gained an engineering team specialized in the specification and design of highly efficient DDR memory controllers, a critical component for efficient utilization of on-board dynamic memory devices. In 2009, through our licensing agreement with AMD, we furthered our interface IP expertise with the addition of PCIe, HDMI/DVI/DisplayPort and MIPI IP solutions. |
| • | Processor and Vertical Application Solutions Expertise. Through the recent acquisition of ARC International, Virage Logic added processor, audio post processing and vertical application solutions expertise. |
| • | Broad Product Line. Virage Logic is a leading provider of both functional and physical semiconductor IP for the design of complex integrated circuits. Our broad, highly differentiated product portfolio includes processor solutions, interface IP solutions, embedded SRAMs and NVMs, embedded memory test and repair, logic libraries, and memory development software. |
| • | Silicon Verified Solutions. Many of our physical IP products are verified and tested at a particular manufacturing process using specialized ICs (commonly referred to as silicon-proven), before being delivered to a customer. This verification substantially reduces the risk that the physical IP element will be incompatible with the host manufacturing process and thereby reduces development costs and manufacturing delays that our customers might experience when using IP that has not been silicon-proven. |
Virage Logic’s Semiconductor IP Product Portfolio
We offer a wide range of semiconductor IP including the following:
| • | Embedded memories including SRAM and NVM; |
| • | Logic libraries; |
| • | IP and development infrastructure for embedded test and repair of on-chip memory instances; |
| • | Software development tools used to build memory compilers; |
| • | DDR memory controllers, PHYs, DLLs, PCIe, HDMI/DVI/DisplayPort and MIPI interface IP components; and |
| • | Configurable 32-bit processor cores and vertical application solutions. |
Our Embedded Memory Semiconductor IP. We provide embedded memory semiconductor IP in predetermined shapes, sizes and types that can be incorporated by semiconductor designers into their SoC designs. We deliver our memory semiconductor IP to our customers through downloads from secure servers or on computer disks in a form that can be integrated directly into the design of the SoC.
10
Table of Contents
Our Embedded Memory Compilers. A compiler is a software program that allows semiconductor designers to configure memories to the desired specifications for their SoC designs. Our compiler products include:
| • | SiWare™ Memory—Virage Logic’s SiWare Memory product line provides what we believe to be the world’s most area, performance, power, and yield-optimized memories for 65nm and below process nodes. The SiWare Memory product portfolio delivers the smallest area and we believe the highest performance for a wide range of applications such as wireless, graphics, and high-performance ASICs. These memory compilers have state-of-the-art power management features to achieve the lowest static and dynamic power consumption. |
| • | ASAP™ Memory—We believe Virage Logic’s Area, Speed and Power (ASAP) Memory product line provides the largest selection of embedded memories at 90nm and above process nodes. It includes High-Density compilers optimized for area, High-Speed compilers optimized for speed-critical applications, and Ultra-Low-Power memory compilers optimized for battery-powered and hand-held applications. |
| • | STAR™ Memory—The Self-Test and Repair (STAR) Memory product line provides embedded memories designed for testability and manufacturability to optimize yield. Building on the ASAP Memory product line, and offered at the 90nm and above process nodes, STAR memories include redundancy capabilities for repair purposes. STAR Memory products are an integral component of the STAR Memory System. |
| • | STAR™ Memory System—As the industry’s first commercially available integrated embedded memory test and repair system, the STAR Memory System provides a complete test and repair solution. Designers are able to optimize both time-to-market and time-to-volume requirements through a broad set of advanced capabilities. The STAR Memory System can help save millions of dollars in recovered silicon, substantially reduce test costs, and shorten time-to-volume. |
| • | STAR™ Yield Accelerator—Virage Logic’s STAR Yield Accelerator delivers a complete solution for automated silicon verification, vector generation, silicon analysis, and yield ramping of embedded memories. Integrated with the industry leading STAR Memory System embedded test and repair solution, STAR Yield Accelerator dramatically reduces silicon time-to-test, time-to-product bring-up, and time-to-volume production. |
| • | Embedded NVM—Virage Logic’s embedded NVM product line offers multiple time programmable non-volatile memory in standard CMOS processing. The AEON® product supports commercial fabless and IDM customers in the power management, wireless / RF, security, precision analog, and MEMS markets. The NOVeA® product is targeted for government and military applications that require IP at a Trusted Foundry. |
Our Logic Semiconductor IP. We provide logic libraries through our SiWare™ Logic and ASAP™ Logic product lines. These products are designed to improve logic block area utilization and SoC performance while decreasing the price and power consumption of the overall chip. We deliver our logic semiconductor IP to our customers through the same manner as our embedded memory semiconductor IP.
| • | SiWare™ Logic—The SiWare Logic product line includes yield-optimized standard cells for a wide variety of design applications for 65nm and below process nodes with multiple threshold process variants. SiWare Logic libraries are offered using three separate architectures to optimize circuits for Ultra-High-Density, High-Speed, or High-Performance. SiWare Power Optimization Kits provide designers with the most advanced power management capabilities. |
| • | ASAP™ Logic—The ASAP Logic product line is offered at 90nm and above process nodes. The ASAP Standard Cell Libraries deliver up to 30 percent area improvement over conventional standard cells. The ASAP Metal Programmable Cell Libraries save configuration costs by reprogramming only a few masks. The ECO Cell Libraries use Virage Logic’s proprietary metal programmable technology to provide a high level of flexibility in implementing engineering changes in standard cell designs. |
11
Table of Contents
Our Software Development Tools. Our memory development environment, Embed-It!®, offers a proven software suite for automated memory compiler development and memory instance distribution enabling designers to create solutions more rapidly. The software suite includes a comprehensive automated compiler and instance-based characterization tool to quickly and accurately measure a memory’s performance.
Our Application Specific IP Product Portfolio. Our Application Specific IP (ASIP) products are designed to meet the highest quality and performance standards for functional IP. Virage Logic ASIP products contain application specific functional IP targeted to a variety of market requirements. ASIP products are commonly based on Virage Logic’s proprietary and patented logic libraries, memory, routing methodology, and cell architecture.
| • | Intelli™ DDR—The Intelli DDR memory interface product family offers the highest performance, lowest latency intelligent memory controllers for DDR1, DDR2, and DDR3; the lowest power, highest bandwidth Mobile SDR, Mobile DDR, Low Power DDR (LPDDR) and LPDDR2 memory controllers; high-speed, full digital DDR SDRAM PHY+DLL solutions and memory models for popular DRAM parts. |
| • | Intelli™ PHY+DLL—The Intelli PHY+DLL companion for the Intelli DDR memory interface products is an all-digital DDR PHY+DLL hard macro GDSII solution optimized for high performance and low power applications. The all digital PHY+DLL consumes up to 25% lower power and is up to 20% smaller in area to comparable analog solutions. |
| • | SiPro™ Advanced Interface IP Portfolio—By meeting market needs at advanced process nodes such as TSMC 40LP, Virage Logic leads the industry with a production proven standards-based IP product portfolio. The SiPro product line delivers complete standards-based solutions for PCI Express (PCIe), Mobile Industry Processor Interface (MIPI®), a unique multi-protocol IP solution for High-Definition Multimedia Interface (HDMI), Digital Visual Interface (DVI) and DisplayPort interfaces. Virage Logic’s SiPro product line includes PHYs and controllers that are optimized for mass production, rigorously verified and characterized to reduce risk, improve time-to-market, and improve yield. The PHYs offer high-performance and low power production proven implementation at the most advanced process nodes, and are designed to help lower cost, improve performance, and reduce power for the most constrained SoC or ASIC designs. |
Our ARC Processor Solutions. We believe the recently acquired ARC 32-bit processor family provides a full range of configurable solutions from the world’s smallest, lowest power, licensable 32-bit core to a full-featured host processor that delivers over 1000 DMIPS of performance with half the die size and power of competing cores. Implemented with Virage Logic’s 40nm SiWare Memory and SiWare Logic, the ARC processor family takes energy efficiency to a new level with dramatic battery life extension. The processor family is supported by a full portfolio of award-winning multimedia subsystem solutions, enabling designers to deliver high quality audio and video capabilities. The ARC product line’s end-to-end suite of software and development tools allows designers to quickly “close the loop” for faster time-to-market. Shipping in more than 400 million products annually, the ARC processors are the first choice for a broad range of consumer and portable applications including: digital and mobile TVs, portable media players, personal computers, laptops, flash storage, digital cameras and music, and smart phones.
Audio IP Vertical Application Solutions Portfolio. A part of the recently acquired ARC product line, is Sonic Focus, a consumer facing brand of robust audio IP solutions. Sonic Focus Audio Enrichment Technology significantly enhances a consumer’s multimedia experience, resulting in greater clarity and superior realism of digital media content, while delivering market differentiating audio performance for SoC and OEM companies. Sonic Focus post processing technology runs on a variety of platforms and has been highly optimized for ultimate performance on our industry leading ARC Sound Subsystems.
During fiscal year 2009, our license and maintenance revenue for 45-nanometer technology accounted for 37 percent of our total license and maintenance revenues, license and maintenance revenue for 65-nanometer
12
Table of Contents
technology was 29 percent of total license and maintenance revenue, license and maintenance revenue for 90-nanometer technology was 16 percent of total license and maintenance revenue, license and maintenance revenue for 0.13 micron technology was 8 percent of total license and maintenance revenue, license and maintenance revenue for 0.18 micron technology was 5 percent of total license and maintenance revenue and license and maintenance revenue from the sale of other products was 5 percent of total license and maintenance revenue. Included within the 5 percent other products category are our products on the older process nodes, 0.25 and 0.35 micron technology. We expect royalty revenue from these products to be declining and license revenue to be insignificant in future periods. During fiscal year 2008, our license and maintenance revenue for 45-nanometer technology accounted for 21 percent of our total license and maintenance revenues, license and maintenance revenue for 65-nanometer technology was 36 percent of total license and maintenance revenue, license and maintenance revenue for 90-nanometer technology was 20 percent of total license and maintenance revenue, license and maintenance revenue for 0.13 micron technology was 9 percent of total license and maintenance revenue, license and maintenance revenue for 0.18 micron technology was 4 percent of total license and maintenance revenue and license and maintenance revenue from the sale of other products was 10 percent of total license and maintenance revenue. Included within the 10 percent other products category are our products on the older process nodes, 0.25 and 0.35 micron technology.
ARC-Based, ASAP Memory, ASAP Logic, SiWare Memory, SiWare Logic, Silicon Aware IP, System Aware IP, STAR Memory System, STAR Memory, STARY Yield Accelerator, Intelli DDR, Intelli PHY, Intelli DLL, SiPro PCIe, SiPro HDMI/DVI/DisplayPort, SiPro MIPI are trademarks of Virage Logic Corporation. ARC, AEON, Embed-It! and NOVeA are registered trademarks of Virage Logic Corporation in the United States.
Markets and Applications
We focus on markets and companies that utilize SoC technologies with high-performance, low power architectures and high-density requirements where we believe our semiconductor IP offering provides customers with significant time-to-market, design, and manufacturing cost advantages. Examples of the markets and applications in which our IP is implemented include the following:
| • | Consumer Products. Digital appliances increasingly require more functionality, Internet connectivity and low power consumption. Our IP can be found in video game players, cellular phones, MP3 players, PDAs, digital cameras, high-definition televisions, cable set-top boxes and DVD players. For OEM and SoC companies building products for cell phones, portable media players, and other consumer electronics devices, our recently acquired ARC multimedia IP solutions are fully integrated and enable the rapid creation of lower-cost, highly differentiated products. By combining ARC’s unique software, codecs, and hardware IP in a single optimized solution, OEMs can lower bill of materials costs by selecting fewer and lower cost components, and semiconductor companies can reduce costs by creating smaller ARC-based silicon chips that consume less power. |
| • | Communications and Networking Products. Communications and networking SoCs are used throughout the Internet, including in routers, switches, DSL modems, gigabit ethernet equipment, and high-bandwidth set-top boxes. |
| • | Computers and Graphics Products. Computation and graphics equipment such as personal computers, workstations and servers require more complex chip sets and embedded memory to achieve new features, such as advanced 3D graphics and digital signal processing, or DSP. |
| • | Automotive Products. Future vehicles will be expected to have data connectivity while in motion and drivers will require ever increasing interaction with information such as infotainment, navigation, and traffic monitoring as well as assistance in complex or dangerous traffic situations such as with an automated emergency braking system. As the automotive industry looks to SoCs to provide this ever increasing set of functionalities, while reducing overall costs and handling the complexity of in-car electronic systems, our semiconductor IP is well suited to help them meet these SoC design requirements. |
13
Table of Contents
| • | Defense Products. Development of the next generation of military, aerospace, security devices and special communications devices sponsored by government agencies, also known as high reliability devices, are increasingly based on complex SoCs due to the increased functionality requirements. We continue to experience increased interest and business opportunities in this market segment. |
| • | Security, Digital Rights Management (DRM), and Radio Frequency Identification (RFID) Products. With our NOVeA product, we are able to address customers’ needs for small amounts of embedded, multiple time programmable memories to enable DRM for such applications as wired and wireless network cards, secure memory cards, video games, DVD players and recorders, set-top boxes, PDAs, cellular phones, bridges and routers, DSL and cable modems, and Bluetooth-enabled devices. Radio Frequency Identification applications require ultra-low-power and a small footprint. We believe that NOVeA provides the most cost-effective way to meet these requirements because it is available on standard CMOS logic processes. |
Research and Development
We believe that our future success will depend in large part on our ability to continue developing new products and expanding our existing products for advanced manufacturing processes. To this end, we have assembled a team of engineers with significant experience in the design and development of semiconductor IP. Currently, we are focusing our research and development efforts on semiconductor IP products that support the latest manufacturing processes such as 45/40-nanometer and 32/28-nanometer.
We have entered into agreements with Chartered, Dongbu HiTek, Grace, IBM, SilTerra, SMIC, Tower, TSMC, and UMC for the development and licensing of various semiconductor IP products that are targeted to these foundries’ design rules. Leveraging our relationship with these foundries, we are able to shape the focus of our research and development activities. Under our agreement with each foundry, generally, Virage Logic owns its own IP and the foundry owns its own IP, however, both Virage Logic and the foundry jointly own any IP that is co-developed by the parties during the term of the agreement. Following any such development, we license the developed IP to third-parties that manufacture their silicon chips at the foundry. As consideration for our development efforts, the foundries pay us licensing fees, as well as royalties based on silicon chips manufactured at the foundries using our semiconductor IP. In addition, both parties agree to provide technical, marketing and sales support as appropriate.
As of November 30, 2009, we had 530 employees focused in the engineering-related activities within research, development and operations. We expect to identify and hire additional technical personnel in fiscal year 2010 to fulfill anticipated future needs in our research and development activities, and we expect that these personnel-related costs will increase in the future in order to maintain a lead position as a third-party provider of silicon infrastructure in the form of semiconductor IP.
Sales and Marketing
We are primarily engaged in direct sales in North America, Europe and Asia. In Asia, and more recently in Europe and North America, we also derive indirect sales through distributors or representatives. In fiscal 2009, we expanded our global sales channel with additional distributors or representatives. Direct Sales. We maintain a network of direct sales representatives and field application engineers serving the United States, Asia, and EMEA. Substantially all of our direct sales representatives and field application engineers are located in North America, Europe, and Asia and serve our customers in those regions. Our sales force is distributed throughout North America with employees in the following locations: Austin, Texas; Londonderry, New Hampshire; Fremont, California; and West Palm Beach, Florida. To serve our European customers, we have a direct sales organization based in the United Kingdom and Israel. We also have direct sales personnel in Japan and Taiwan. Our sales force’s primary responsibility is to secure and maintain direct account relationships with fabless semiconductor companies and integrated device manufacturers for the license of our products. Developing a customer relationship typically involves weeks or months and can extend well beyond this timeframe.
14
Table of Contents
Indirect Sales. In addition to our direct sales force, we also sell our technologies through representatives in China, Korea, Malaysia, Singapore, Taiwan, Europe and in North America. These indirect sales organizations have expertise in selling semiconductor IP and software design tools. None of these relationships are exclusive.
For our ASAP Memory, ASAP Logic, SiWare Memory, SiWare Logic, and STAR Memory products, in addition to collecting license and consulting fees from customers, we receive royalties from pure-play foundries that manufacture chips for our customers. For our STAR Memory products, we receive both license and royalty fees directly from our customers, as well as royalties from the pure-play foundries that manufacture their chips. For our AEON, NOVeA and ARC processor products, we receive both license and royalty fees directly from our customers.
We have developed relationships through the Virage Logic IP (VIP) Partner Program with the following types of companies:
| • | Pure-Play Foundries. We have entered into marketing and technology relationships with several pure-play foundries, including Chartered, Dongbu HiTek, Grace, HeJian, IBM, MagnaChip, SilTerra, SMIC, Tower, TSMC, and UMC. These strategic, collaborative relationships provide us with early access to new process technologies and endorsements from their direct sales force to our mutual customer base. |
| • | EDA and Test Vendors. We have entered into joint marketing relationships with a number of electronic design automation (EDA) and test vendors, including Cadence Design Systems, Inc. (Cadence), Magma Design Automation, Inc. (Magma), Mentor Graphics Corporation (Mentor Graphics) and Synopsys, Inc. (Synopsys). These relationships allow us to validate our interoperability with these EDA vendors’ software design tools. |
| • | Design Services. We have developed technology alliances with several design service companies, including Alchip Technologies, eSilicon, Global Unichip (GUC) and OpenSilicon, who have experience with Virage Logic semiconductor IP. This allows our customers to augment their design teams or outsource their chip designs to these design service companies. |
| • | IP Providers. We have established technology and joint marketing relationships with numerous IP providers including MIPS Technologies (MIPS) and Tensilica, Inc. (Tensilica), and in some cases offer Virage Logic Core Optimized IP Kits that complement the microprocessor IP products these vendors provide. By working in partnership with other leading IP suppliers to test silicon and provide reference designs, we help customers access the functionality of the IP prior to committing it to their design. |
Customers
Our customers are semiconductor companies that use our semiconductor IP to design complex SoCs. Purchasers of our semiconductor IP products include fabless semiconductor companies, integrated device manufacturers and pure-play foundries. For fabless semiconductor and integrated device manufacturer customers, we license our semiconductor IP on either a single or multiple-project basis. The following provides a representative list of our major customers by customer type.
| Fabless Semiconductor Companies |
2Wire, 3DLABS, Accel Semiconductor, Advanced Semiconductor Technology, Ltd., Advasense, Agilent, Alfred Mann Foundation, Applied Micro Circuits*, Aquantia, Atheros Communications, Bay Microsystems, Beijing Innofidei, Beijing Tongfang Microelectronics Ltd., Brightscale, Brocade Communications Systems, Inc., Cambridge Silicon Radio (CSR)*, Cirrus Logic, Cisco Systems, ClariPhy Communications, Coherent Logix, Comsys Communication & Signal Processing, Cortina Systems, Cray, DSP Group, Dune Networks, Entropic Communications, ESS Technology, Focus Enhancements, Gennum, Gigle Semiconductor SL, Global |
15
Table of Contents
| Unichip, HISILICON Technologies, Hyperstone Electronics GmbH, Ikanos, Integrated System Solutions, IntellaSys, Intersil, InvenSense, InVisage, K-Micro, Let it Wave, LSI*, Magnum Semiconductor, Marvell Semiconductor, Matrox Graphics, MediaTek, Mellanox Technologies, Micronas GmbH, Microsoft, Mitsumi Electric, Mobilygen, Movidia Ltd., MStar Semiconductor, M-Systems, Mtekvision, NemeriX SA, Neology, NetEffect, Newisys, NextIO, NexusChips, Novafora, NVIDIA, OmniVision Technologies, Oticon A/S, Oxford Semiconductor, Parkervision, picoChip Designs Limited, PLX Technology, PMC-Sierra*, Princeton Technology, QuickLogic, Ralink Technology, Realtek Semiconductor, Redpine Signals, Richtek Technology, Rockwell Collins, SanDisk, Sensor Design Automation, Sensor Platforms, Sensory, SEQUANS Communications, Shenzhen Huawei Communications, SiCortex. Sigma Designs, Sigmatel, Silicon Image, Silicon Integrated Systems, Silicon Laboratories, Silicon Motion, Silicon Optix, Silicon Optix Canada, SiRF Technology, Sitronix Technology, Skymedi, Skyworks Solutions, SolarFlare Communications, Sony, Stretch, Sunplus Technology, Telegent Systems, Teradici, Teranetics, Thomson Multimedia, TranSwitch, Ubicom, Unisys, Verigy, Via Technologies, ViXS Systems, Wilocity, Wintegra, Xelerated AB, XMOS Limited, Yamaha, Zarlink Semiconductor AB |
| Integrated Device Manufacturers |
Advanced Micro Devices*, Analog Devices, Austria Micro Systems International AG, Avago Technologies, Canon, Conexant Systems, Cypress Semiconductor, Dallas Semiconductor, Freescale Semiconductor*, Fujitsu Ltd., Hewlett-Packard, IHP GmbH, Infineon Technologies AG, Integrated Device Technology, Intel, Lenovo, LG Electronics, MagnaChip Semiconductor, Matsushita Electric Industrial Co. Ltd., NEC Electronics*, NXP Semiconductors Netherlands BV, Oki Electric Industry Co. Ltd., ON Semiconductor, Renesas Technology, Sharp, STMicroelectronics SA, Texas Instruments, Toshiba |
| Pure-Play Foundries |
Chartered*, Dongbu HiTek, Grace, HeJian, IBM, MagnaChip, SilTerra, SMIC, Tower, TSMC*, UMC* |
| * | Indicates the top ten customers that generated the highest level of revenues for us in fiscal year 2009. |
We expect a small number of companies to collectively represent between 20% and 40% of our revenues for the next few years. In fiscal year 2009, Texas Instruments and TSMC represented 11% and 10% of our revenues, respectively. In each of fiscal year 2008 and 2007, TSMC represented 11% of our revenues. As our customer base grows and the number of fabless semiconductor companies increases, we are hopeful that our dependence on any one customer for revenues to decline, although we expect NXP to be a significant customer during the term of our agreement with them. We expect that our sales to fabless semiconductor companies will grow, and as a result we will become more dependent on the availability of new manufacturing process technologies and capacity from pure-play foundries to manufacture our customers’ products.
Proprietary and Intellectual Property
We rely on a combination of nondisclosure agreements and other contractual provisions, as well as patent, trademark, trade secret and copyright law to protect our proprietary rights. Our general policy has been to seek
16
Table of Contents
patent protection for those inventions and improvements likely to be incorporated in our technologies or otherwise expected to be of value. We have an active program to protect our proprietary technology through the filing of patents.
As of October 31, 2009, we had 215 U.S. patents issued and 120 U.S. patent applications on file with the U.S. Patent and Trademark Office (USPTO). Our patents expire at various dates between 2019 and 2029, and we expect that once granted, the duration of patents covered by patent applications will be 20 years from the filing of the application. These patents will allow us to prevent others from infringing on some of our core technologies in the United States. We intend to continue to file patent applications as appropriate in the future. We cannot be sure, however, that our pending patent applications will be allowed, that any issued patents will protect our IP or will not be challenged by third parties, or that the patents of others will not seriously harm our ability to do business. In addition, others may independently develop similar or competing technology or design around any of our patents. We also have not secured patent protection in foreign countries, and we cannot be certain that the steps we have taken to protect our IP abroad will be effective.
In addition to our patents, as of October 31, 2009, we had seven U.S. trademarks registered and three pending U.S. trademark applications on file with the USPTO. If the applications mature to registrations, these registrations would allow us to prevent others from using other confusingly similar marks on similar goods and services in the United States. We cannot be sure, however, that the USPTO will issue trademark registrations for any of our pending applications. Furthermore, any trademark rights we hold or may hold in the future may be challenged or may not be of sufficient scope to provide meaningful protection. In addition, we had five foreign trademarks registered: two in the European Community, two in Japan and one in China as of October 31, 2009.
We protect the source code of our technologies as both trade secrets and unpublished copyrighted works. We license the object code to our customers for limited uses and maintain contractual controls over the use of our software, but we may not have the resources to enforce such controls, and further such contractual controls may be declared invalid or unenforceable. Wide dissemination of our software makes protection of our proprietary rights difficult, particularly outside the United States, and we may not be able to assert equivalent rights with respect to source code developed by our employees in the Republic of Armenia (Armenia), India or other foreign countries as we could if it were developed in the United States.
We protect our trade secrets and other proprietary and confidential information through non-disclosure agreements with our employees, partners and customers and other similar measures, although others may still gain access to our trade secrets, proprietary information and confidential information or discover or develop them independently.
Although we believe that our technologies do not infringe any patent, copyright or other intellectual proprietary rights of third parties, from time to time, third parties, which may include our competitors, may assert claims of infringement of patent, copyright or other IP rights to technologies that are important to us. We are aware of no such claim to date.
Competition
The semiconductor IP industry is very competitive and is characterized by constant technological change, rapid rates of technology obsolescence and the emergence of new suppliers. Our primary competition comes from the internal development groups of large IDMs that develop semiconductor IP for their own use. In addition, we face competition from other third-party providers of semiconductor IP, such as ARM Ltd.’s Physical IP Division (formerly Artisan Components which was acquired by ARM in December 2004), Dolphin Technologies (Dolphin), and MoSys, Inc. (MoSys). Additionally, electronic design automation companies such as Cadence Design Systems, Mentor Graphics, Magma Design Automation and Synopsys, Inc., could play a more significant role in the IP marketplace as they elect to either acquire third-party IP providers or develop their own IP product offerings. An example of this is Synopsys’ July 2007 acquisition of MOSAID Technologies, Inc.,
17
Table of Contents
a provider of DDR memory controller, PHY and DLL semiconductor IP products. This product offering is competitive to the DDR, PHY and DLL product line that Virage Logic acquired through our acquisition of Ingot Systems.
Finally, pure-play foundries may decide to expand their distribution of embedded memories and logic libraries themselves, in addition to manufacturing chips containing third-party IP. TSMC, one of our pure-play foundry customers and strategic partner, has historically produced IP components for use by third-parties in designs to be manufactured at TSMC’s foundry. These components are designed to serve the same purpose as components produced by Virage Logic. The IP components developed by TSMC compete, and are expected to continue to compete with our products. We believe that TSMC is more aggressively developing and distributing these products to encourage its customers to use TSMC to manufacture their current and future designs. TSMC has substantially greater financial, manufacturing and other resources, name recognition and market presence than we do, and the internal design group at TSMC has greater access to technical information about TSMC’s manufacturing processes than we do. If TSMC is successful in supplying its own IP components to third-parties, either directly or through distribution arrangements with other companies, our revenue from TSMC, our revenue from other customers and our operating results could be negatively affected. Any of which could cause the market price of our common stock to decrease.
We believe that important competitive factors in our market include performance and functionality of products, the ability to create specific products to meet customer requirements, length of development cycle, price, compatibility with prevailing design methodologies, interoperability with other devices or subsystems, reputation for successful designs and installed base, overall product quality and reliability, and the level of technical service and support provided.
Employees
As of November, 2009, we had 637 employees, including 59 in sales and marketing, 507 in engineering, 23 in operations and 48 in general and administrative functions. A total of 443 of our employees are located outside of the United States. We believe that our future success will depend in part on our continued ability to attract, hire and retain qualified personnel. None of our employees are represented by a labor union, and we believe our employee relations are good.
Executive Officers
The names and ages of our executive officers as of November 30, 2009 are set forth below:
| Name |
Age | Position(s) | ||
| J. Daniel McCranie |
66 | Executive Chairman | ||
| Alexander Shubat |
48 | President and Chief Executive Officer and Director | ||
| Brian Sereda |
49 | Vice President of Finance and Chief Financial Officer | ||
| Branimir Buric |
60 | Executive Vice President, Marketing |
J. Daniel McCranie has served as our Executive Chairman since October 2008. Previously, Mr. McCranie was our President and Chief Executive Officer from January 2007 to October 2008, our Executive Chairman from March 2006 to January 2007, and the Chairman of our Board of Directors from August 2003 to March 2006. Prior to this, Mr. McCranie was Vice President of Sales and Marketing for Cypress Semiconductor from September 1993 to February 2001. Mr. McCranie was Chairman, President and Chief Executive Officer of SEEQ Technology from February 1986 to September 1993. Mr. McCranie currently serves as Chairman of the Board of Directors of ON Semiconductor Corp. and also as a member of the Board of Directors of Actel Company and a member of the Board of Directors of Cypress Semiconductor. Mr. McCranie holds a B.S. in Electrical Engineering from Virginia Polytechnic Institute.
18
Table of Contents
Alexander Shubat co-founded Virage Logic. Dr. Shubat has served as our President and Chief Executive Officer since October 2008. Previously, Dr. Shubat was our Chief Operating Officer. Prior to this, Dr. Shubat served as our Vice President of Research and Development, and Chief Technical Officer. Dr. Shubat has been a member of our Board of Directors since January 1996. Before co-founding Virage Logic in January 1996, Dr. Shubat was a Director of Engineering at Waferscale Integration from November 1985 to December 1995, where he managed various groups including design, application-specific integrated circuit and high-speed memory. He holds more than 20 patents and has contributed to more than 25 publications. Dr. Shubat holds a B.S. and a M.S. in Electrical Engineering from the University of Toronto, Canada, a Ph.D. in Electrical Engineering from Santa Clara University, and an executive MBA from Stanford University.
Brian Sereda joined Virage Logic as our Vice President of Finance and Chief Financial Officer in September 2008. Previously, Mr. Sereda was Chief Financial Officer and Treasurer at Proxim Wireless from June 2006 to September 2008. Prior to this, Mr. Sereda was Vice President of Finance and Corporate Controller for Portal Software from January 2005 to April 2006. Mr. Sereda also held senior financial management positions with Credence Systems Corp, Handspring Inc., Sygen International, and Lam Research. Mr. Sereda holds a MBA degree from St. Mary’s College of California, a BSBA from Simon Fraser University, Vancouver, British Columbia, Canada and a Diploma of Technology in Petroleum Engineering from the British Columbia Institute of Technology, Vancouver, British Columbia, Canada.
Branimir Buric has served as our Executive Vice President of Marketing since September 2008. Prior to his current role, he served as our Vice President of Product Marketing, Senior Director of Strategic Business Solutions, and Senior Director of Business Development and IP Platform Marketing during various periods since May 2002. Prior to joining Virage Logic in May 2002, Mr. Buric was Vice President of Marketing and Business Development at In-Chip Systems. Mr. Buric also held senior management positions in marketing, business development and applications engineering with Sycon Design, Avant!, Meta Software, Mentor Graphics and Silicon Compiler Systems. Mr. Buric holds a B.S. in Electrical Engineering from the University of Belgrade.
Risk Related to Our Business
Inability or delayed execution on our strategy to be a leading provider of semiconductor IP could adversely affect our revenues and profitability.
Our product portfolio includes processor solutions, embedded SRAMs, embedded NVMs, embedded test and repair, logic libraries, memory development software and DDR memory controller subsystems. If our strategy to be a broad line provider of semiconductor IP is not widely accepted by potential customers or if such acceptance is delayed for any reason, our revenues and profitability could be adversely affected. In addition, our profitability could also be adversely affected due to investment of resources directed to the development and/or acquisition of additional semiconductor IP components and due to lower than anticipated revenues from the sale of such products. Factors that could prevent us from gaining market acceptance of our semiconductor IP products include the following:
| • | difficulties in convincing customers of our memory products to purchase other products from us; |
| • | difficulties and delays in expanding our logic and I/O product offerings; |
| • | difficulties in productizing NXP’s intellectual property that we have acquired; and |
| • | hurdles we may encounter in building and expanding customer relationships. |
We may have difficulty achieving profitability and may experience additional substantial losses in the future.
We recorded net losses of $34.1 million and $4.6 million for fiscal 2009 and 2007 and net income of $554,000 for fiscal 2008. In order to continue to return to profitability, we will need to continue to generate new
19
Table of Contents
sales while controlling our expenses. Any failure to increase our revenues and control costs as we pursue our planned growth would harm our ability to regain profitability and would likely negatively affect the market price of our common stock. In addition, if we continue to incur losses for a sustained period we may be prevented from being able to fully utilize our deferred tax assets which would result in the need for a valuation allowance to be recorded. In addition, general economic trends at present including the worldwide economic slowdown and tightening of the credit markets may impact the businesses of our customers, which could have an adverse impact on our revenue growth expectations and our financial condition and results of operations.
We intend to continue to engage in acquisitions, joint ventures and other transactions that may complement or expand our business. We may not be able to complete such transactions and such transactions, if executed, pose significant risks and could have a negative effect on our operations.
We have acquired and expect to continue to acquire businesses and operations and concurrently hire employees who provide services relevant to the business or assets we acquire. Achievement of our business goals may be dependent on opportunities to buy other businesses or technologies that could complement, enhance or expand our current business or products or that might otherwise offer us growth opportunities. We may not be able to complete such transactions for a variety of reasons, including our inability to structure appropriate financing for larger transactions. Any transactions that we are able to identify and complete may involve a number of risks, including the following:
| • | the difficulty of integrating the operations, systems, technologies, products and personnel of acquired businesses, particularly in view of the complexity and sophistication of semiconductor IP; |
| • | the diversion of our management’s attention from our existing business to integrate acquired businesses or technologies; |
| • | the difficulty of completing in-process research and development; |
| • | possible adverse effects on our operating results and financial condition arising during the integration process, including unanticipated costs and liabilities and unforeseen accounting charges or fluctuations; |
| • | delays and difficulties in delivery of products and services as a result of the integration process; |
| • | the failure to effectively integrate or separate management information systems, personnel, research and development, marketing, sales and support operations; |
| • | the loss of key employees, customers or business partners of acquired businesses; |
| • | dilution of current stockholder’s percentage ownership and related economic interest as a result of our issuance of stock in acquisitions; |
| • | loss of our existing customers due to uncertainty about our ability to operate after a transaction; |
| • | possible loss of customers or partners; |
| • | possible declines in revenue and increases in losses; |
| • | the failure to realize the potential financial or strategic benefits of the acquisition or divestiture; |
| • | the failure to successfully further develop the combined or remaining technology, resulting in the impairment of amounts recorded as goodwill or other intangible assets; and |
| • | our possible inability to achieve the intended objectives of the transaction. |
In addition, we may not be able to successfully or profitably integrate, operate, maintain and manage our newly acquired operations, businesses, product lines, or employees. We may not be able to maintain uniform standards, controls, procedures and policies, and this may lead to operational inefficiencies. Moreover, successful acquisitions in the semiconductor industry may be more difficult to accomplish than in other industries because such acquisitions require, among other things, integration of product offerings, manufacturing relationships and coordination of sales and marketing and research and development efforts. The difficulties of such integration
20
Table of Contents
may be increased by the need to coordinate geographically separated organizations and the complexity of the technologies being integrated. For example, our recent acquisition of ARC and the NXP assets involved operations in various parts of Europe. Furthermore, products acquired in connection with acquisitions may not gain acceptance in our markets, and we may not achieve the anticipated or desired benefits of such transactions.
We intend to develop and productize IP assets that we acquired and licensed from NXP, which NXP had used for internal development purposes. We anticipate that the integration of the NXP assets with our existing assets to create standardized, commercial revenue-generating products will require significant development work over approximately a year. Doing so will involve, among other things, the creation of industry standard models, the readying of the intellectual property acquired and licensed from NXP for other foundries and the development of a more industry standard look-and-feel. In addition, we hired approximately 150 former employees of NXP, increasing our employee headcount by nearly 40 percent, and established a research and development center in the Netherlands and a branch office in Bangalore, India, which are locations where we have not previously conducted operations. For the reasons set forth above, no assurance can be given that the NXP acquisition will be successful and will not materially adversely affect our business, operating results, or financial condition.
The inability of management to successfully integrate any future acquisition could harm our business and cause the market price of our common stock to decline.
If we are unable to continue establishing relationships on favorable contractual terms with semiconductor companies to license our IP, our business will be harmed.
We rely on license fees from the sale of perpetual and term licenses to generate a large portion of our revenues. These licenses produce streams of revenue in the periods in which the license fees are recognized, but are not necessarily indicative of a commensurate level of revenue from the same customers in future periods. In addition, our agreements with our customers do not obligate them to license new or future generations of our IP. As a result, the growth of our business depends significantly on our ability to expand our business with existing customers and attract new customers.
We face numerous challenges in entering into license agreements with semiconductor companies on terms beneficial to our business, including the following:
| • | the lengthy and expensive process of building a relationship with potential customers; |
| • | competition with the customers’ internal design teams and other providers of semiconductor IP as our customers may evaluate these alternatives for each design; and |
| • | the need to persuade semiconductor companies to rely on us for critical aspects of their technology. |
These factors may make it difficult for us to maintain our current relationships or establish new relationships with additional customers. Furthermore, there are a finite number of fabless semiconductor companies and integrated device manufacturers to which we can license our IP. If we are unable to establish and maintain these relationships, we will be unable to generate license fees, and our revenues will decrease.
If we are unable to maintain existing relationships and/or develop new relationships with pure-play semiconductor manufacturers or foundries, we will be unable to verify our technologies on their processes and license our IP to them or their customers and our business will be harmed.
Our ability to verify our technologies for new manufacturing processes depends on entering into development agreements with pure-play foundries to provide us with access to these processes. In addition, we rely on pure-play foundries to manufacture our silicon test chips, to provide referrals to their customer base and to help define the focus of our research and development activities. We currently have foundry agreements with Chartered, Dongbu HiTek, SilTerra, SMIC, TSMC, and UMC. If we are unable to maintain our existing
21
Table of Contents
relationships with these foundries or enter into new agreements with other foundries, we will be unable to verify our technologies for their manufacturing processes and our ability to develop products for emerging technologies will be hampered. As a consequence, we would be unable to license our IP to fabless semiconductor companies that use these foundries to manufacture their silicon chips, which is a significant source of our revenues.
We must appropriately manage our relationships with foundries and other strategic partners in order to effectively execute on our business strategy.
In relying on pure-play manufacturing relationships and/our other strategic alliances, we face the following risks:
| • | reduced control over delivery schedules and product costs; |
| • | manufacturing costs that may be higher than anticipated; |
| • | inability of our manufacturing partners to develop manufacturing methods appropriate for our products and their unwillingness to devote adequate capacity to produce our products; |
| • | decline in product reliability; |
| • | inability to maintain continuing relationships with our pure-play manufacturers due to competition or market consolidation; and |
| • | restricted ability to meet customer demand when faced with product shortages. |
If any of these risks are realized, we could experience an interruption in our supply chain or an increase in costs, which could delay or decrease our revenue or adversely affect our business, financial condition and results of operations.
If we are unsuccessful in increasing our royalty revenues, our revenues and profitability may not grow as desired.
We have agreements with pure-play semiconductor foundries to pay us royalties on their sales of silicon chips they manufacture for our fabless customers. Beginning with our STAR™ Memory System and more recently with the introduction of our NOVeA® technology, in addition to collecting royalties from pure-play semiconductor foundries, we intend to increase our royalty base by collecting royalties directly from our integrated device manufacturer and fabless customers. However, we may not be successful in convincing all customers to agree to pay us royalties. We recognized royalty revenues of approximately $8.1 million and $12.1 million for the fiscal years ended September 30, 2009 and 2008, respectively. In order to grow our total revenues we must increase our royalty revenues. We may not be successful in increasing our royalty revenues and we face difficulties in forecasting our royalty revenues because of many factors beyond our control, such as fluctuating sales volumes of products that incorporate our IP, short or unpredictable product life cycles for some customer products containing our IP, potential slow down for manufacturing of certain newer process technology, foundry rate adjustments, the cyclical nature of the semiconductor industry that affects the number of designs, commercial acceptance of these products, accuracy of revenue reports received from our customers and difficulties in the royalty collection process. In addition, occasionally we have completed agreements whereby significant upfront license fees are reduced or limited in exchange for higher royalty rates, which should result in future royalty revenues, but these royalty arrangements may not provide us with the anticipated benefits as sales of products incorporating our IP may not offset lower license fees.
It is difficult for us to verify royalty amounts owed to us under our licensing arrangements.
The standard terms of our license agreements require our customers to document the manufacture and sale of products that incorporate our technology and report this data to us on a quarterly basis. While standard license terms give us the right to audit the books and records of our customers to verify this information, audits can be expensive, time consuming and potentially detrimental to our ongoing business relationship with our customers.
22
Table of Contents
Our inability to audit all of our customers’ books and records may result in us receiving more or less royalty revenue than we are entitled to under the terms of our license agreements. The results of such audits could also result in an increase, as a result of a customers’ underpayment, or decrease, as a result of a customers’ overpayment, to royalty revenues. Such adjustments, as a result of the audit, are recorded in the period they are determined. Any adverse material adjustments resulting from royalty audits may cause our revenues and operating results to be below our management’s expectations or expectations of analysts who follow our stock, which could cause our stock price to decline. The royalty audit may also trigger disagreements over contractual terms with our customers and such disagreements could adversely affect customer relationship, divert the efforts and attention of our management from normal operations and impact our business operations.
We may be unable to deliver our customized memory, logic and I/O products in the time-frame demanded by our customers, which could damage our reputation and future sales.
Some of our agreements require us to provide customized products to our customers within a specified delivery timetable. While we have experienced delays in delivering products to our customers, the durations of these delays have typically been short in length so as to not materially damage our relationship with our customers. However, these delays could adversely impact our operations and our financial performance. Future failures to meet significant customer milestones could damage our reputation in our industry and harm our ability to attract new customers.
We have a long and unpredictable sales cycle, which can result in uncertainty and delays in generating additional revenues.
It can take a significant amount of time and effort to negotiate a sale. Typically, it takes at least three to nine months after our first contact with a prospective customer before we start licensing our IP to that customer. In addition, the purchase of our products is usually made in connection with our customer’s new design starts, the timing of which is outside of our control. Accordingly, we may be unable to predict accurately the timing of any significant future sales of our products. We may also spend substantial time and management attention on potential license agreements that are not consummated, thereby foregoing other opportunities.
Winning business is subject to a competitive selection process that can be lengthy and requires us to incur significant expense, and we may not be selected.
Our primary focus is on winning competitive bid selection processes, known as “design wins,” to develop products for use in our customers’ products. These selection processes can be lengthy and can require us to incur significant design and development expenditures. We may not win the competitive selection process and may never generate any revenue despite incurring significant design and development expenditures. Because we typically focus on only a few customers in a product area, the loss of a design win can sometimes result in our failure to offer an entire generation of a product. This can result in lost sales and could hurt our position in future competitive selection processes because we may be perceived as not being a technology leader.
After winning a product design for one of our customers, we may still experience delays in generating revenue from our products as a result of the lengthy development and design cycle. In addition, a delay or cancellation of a customer’s plans could significantly adversely affect our financial results, as we may have incurred significant expense and generated no revenue. Our contracts with our customers typically do not include a cancellation penalty or other reimbursement of our expenditures in the event a customer decides to delay or cancel their own products which incorporate our products. Finally, if our customers fail to successfully market and sell their products it could materially adversely affect our business, financial condition and results of operations as the demand for our products will commensurately fall.
23
Table of Contents
Products that do not meet customer specifications or contain material defects could damage our reputation and cause us to lose customers and revenue.
The complexity and ongoing development of our products could lead to design or manufacturing problems. Our semiconductor IP products may fail to meet our customers’ design or technical requirements, or may contain defects, which may cause our customers to fail to complete the design and manufacturing of their products in a timely manner. Any of these problems may harm our customers’ businesses. If any of our products fail to meet specifications or have reliability or quality problems, our reputation could be damaged significantly and customers might be reluctant to buy our products, which could result in a decline in revenue, an increase in product returns and the loss of existing customers or the failure to attract new customers. These problems may adversely affect customer relationships, as well as our business, financial condition, results of operations and stock price.
As advanced process nodes become more complex we may have difficulty in delivering product specifications in similar timeframes and at comparable costs to older process nodes.
The increasing complexity of our products at advanced nodes requires different customer engagements and validation strategies. Such changes require the acceptance of different business terms and schedules by our customers. They also may require an increase of test silicon for purposes of validating performance parameters. Such changes may impact our ability to acquire new customers and could increase our operating expenses.
Our international operations may be adversely affected by instability in the countries in which we operate.
We currently have subsidiaries or branches in Armenia, India, the United Kingdom, Canada, Russia, Israel, Germany, the Netherlands and Japan. In addition, a significant portion of our IP is being developed in development centers located in Armenia and India. Israel continues to face a significant level of civic unrest. India is experiencing rising costs and in certain industries, intense competition for highly qualified personnel. Armenia has in recent years suffered significant political and economic instability. Accordingly, conditions in areas of the world in which we operate may adversely affect our business in a number of ways, including the following:
| • | changes in the political or economic conditions in Armenia or Russia and changes in the economic conditions in India and the surrounding region, such as fluctuations in exchange rates, changes in laws protecting IP, the imposition of currency transfer restrictions or limitations, or the adoption of burdensome trade or tax policies, procedures, rules, regulations or tariffs, or changes in the demand for technical personnel could adversely affect our ability to develop new products, to take advantage of the cost savings associated with operations in foreign countries, and to otherwise conduct business effectively in foreign countries; |
| • | our ability to continue conducting business in Israel, Armenia, Russia and other foreign countries in the normal course may be adversely affected by increased risk of social and political instability; and |
| • | our Israeli customers’ demand for our products may be adversely affected because of negative economic consequences associated with reduced levels of safety and security in Israel. |
Problems associated with international business operations could affect our ability to license our IP.
Sales to customers located outside North America accounted for 46% and 50% of our revenues for the fiscal years ended September 30, 2009 and 2008, respectively. We anticipate that sales to customers located outside North America will continue to represent a significant portion of our total revenues in future periods, particularly in light of contracted revenue from NXP, a company based in the Netherlands. In addition, most of our customers that do not own their own fabrication plants rely on pure-play foundries located outside of North America. Accordingly, our operations and revenues are subject to a number of risks associated with doing business in international markets, including the following:
| • | managing distributors and sales partners outside the U.S.; |
| • | staffing and managing non-U.S. branch offices and subsidiaries; |
24
Table of Contents
| • | political and economic instability; |
| • | greater difficulty in collecting accounts receivable resulting in longer collection periods; |
| • | foreign currency exchange fluctuations; |
| • | changes in tax laws and tariffs or the interpretation of such laws and tariffs; |
| • | trade protection measures that may be adopted by other countries; |
| • | compliance with, and unexpected changes in, a wide variety of foreign laws and regulatory environments with which we are not familiar; |
| • | timing and availability of export licenses; |
| • | inadequate protection of IP rights in some countries; |
| • | different labor standards; and |
| • | United States government licensing requirements for exports, which may lengthen the sales cycle or restrict or prohibit the sale or licensing of certain products. |
If these risks actually materialize, our international operations may be adversely affected and sales to international customers, as well as those domestic customers that use foreign fabrication plants, may decrease.
We rely on a small number of customers for a substantial portion of our revenues and our accounts receivable are concentrated among a small number of customers.
We have been dependent on a limited number of customers for a substantial portion of our annual revenues in each fiscal year, although the customers comprising this group have changed from time to time. We have two customers that generated more than 10% of our revenue for fiscal 2009 and one customer that generated more than 10% of our revenue for fiscal 2008. The license agreements we enter into with our customers do not obligate them to license future generations of our IP and, as a result, we cannot predict if and when they will purchase additional products from us. As a result of this customer concentration, we could experience a significant reduction in our revenues if we lose one or more of our significant customers and are unable to replace them. In addition, since our accounts receivable are concentrated in a relatively small number of customers, a significant change in the liquidity, financial position, or issues regarding timing of payments of any one of these customers could have a material adverse impact on the collectibility of our accounts receivable, revenues recorded and our future operating results.
Our quarterly operating results may fluctuate significantly and the failure to meet financial expectations for any fiscal quarter may cause our stock price to decline.
Our quarterly operating results are likely to fluctuate in the future from quarter to quarter and on an annual basis due to a variety of factors, many of which are outside of our control. Factors that could cause our revenues and operating results to vary materially from quarter to quarter include the following:
| • | large orders unevenly spaced over time, or the cancellation or delay of orders; |
| • | pace of adoption of new technologies by customers; |
| • | timing of introduction of new products and technologies and technology enhancements by us and our competitors; |
| • | our lengthy sales cycle and fluctuations in the demand for our products and products that incorporate our IP; |
| • | constrained or deferred spending decisions by customers; |
| • | delays in new process qualification or verification; |
25
Table of Contents
| • | capacity constraints at the facilities of our foundries; |
| • | inability to collect or delay in collection of receivables; |
| • | the timing and completion of milestones under customer agreements; |
| • | the impact of competition on license revenues or royalty rates; |
| • | the cyclical nature of the semiconductor industry and the general economic environment; |
| • | consolidation, merger and acquisition activity of our customer base, or customers developing competing products internally, may cause delays or loss of sales; |
| • | the amount and timing of royalty payments; |
| • | material announcements, including those related to acquisitions or other strategic transactions; |
| • | changes in development schedules; and |
| • | R&D expenditures. |
As a result, we believe that quarter-to-quarter comparisons of our results of operations are not necessarily meaningful and may not be reliable as indicators of future performance. These factors make it difficult for us to accurately predict our revenues and operating results and may cause them to be below market analysts’ expectations in some quarters, which could cause the market price of our stock to decline.
If we are unable to effectively manage our growth, our business may be harmed.
Our future success depends on our ability to successfully manage our growth. Our ability to manage our business successfully in a rapidly evolving market requires an effective planning and management process. Our customers rely heavily on our technological expertise in designing and testing our products. Relationships with new customers may require significant engineering resources. As a result, any increase in the demand for our products will increase the requirements on our personnel, particularly our engineers.
Our historical growth, international expansion, and our strategy of being the semiconductor industry’s trusted IP partner, have placed, and are expected to continue to place, a significant challenge on our managerial and financial resources as well as our financial and management controls, reporting systems and procedures. This is particularly true in light of our recent rapid growth through acquisitions. Although some new controls, systems and procedures have been implemented, our future growth, if any, will depend on our ability to continue to implement and improve operational, financial and management information and control systems on a timely basis, together with maintaining effective cost controls. Our inability to manage any future growth effectively would be harmful to our revenues and profitability.
We have received assessment orders from the Government of India, Income Tax Department, Office of the Director of Income Tax (Indian Tax Authorities) proposing a tax deficiency in certain of our tax returns, and the outcome of the assessment or any future assessment involving similar claims may have an adverse effect on our consolidated statements of operations.
The Indian Tax Authorities completed its assessment of our tax returns for the tax years 2001 through 2007 and issued assessment orders in which the Indian Tax Authorities proposes to assess an aggregate tax deficiency for the six year period of approximately $370,000, net of deposits of $260,000 as required by the Indian Tax Authorities. Interest will continue to accrue until the matter is resolved. The assessment orders are not final notices of deficiency, and we have immediately filed appeals to the appellate tax authorities. We believe that the assessments are inconsistent with the applicable tax laws and that we have meritorious defense to the assessments. We obtained a decision allowing the claims of the tax holiday for the tax years 2002 through 2006, however, there is still the possibility of further tax exposure due to the ongoing process. However, the ultimate outcome cannot be predicted with certainty, including the amount payable or the timing of any such payments
26
Table of Contents
upon resolution of the matter. Should the Indian Tax Authorities assess additional taxes as a result of a current or a future assessment, we may be required to record charges to operations in future periods that could have an adverse effect on our consolidated statements of operations.
We may be unable to attract and retain key personnel who are critical to the success of our business.
We believe our future success depends on our ability to attract and retain engineers and other highly skilled personnel and senior managers. In addition, in order to grow our business we must increase our sales force, both domestic and international, with qualified employees. Hiring qualified technical, sales and management personnel is difficult due to a limited number of qualified professionals and competition in our industry for these types of employees is intense. We have in the past experienced delays and difficulties in recruiting and retaining qualified technical and sales personnel and believe that at times our employees are recruited aggressively by our competitors and start-up companies. Our employees are “at will” and may leave our employment at any time, and under certain circumstances, start-up companies may be able to offer more attractive equity incentives or employee benefits than we offer. As a result, we may experience significant employee turnover. Failure to attract and retain personnel, particularly sales and technical personnel would make it difficult for us to develop and market our technologies.
We may need additional capital that may not be available to us and, if raised, may dilute our stockholders’ ownership interest in us.
We may need to raise additional funds to fund the growth of our business and any acquisitions we may pursue, to respond to competitive pressures or to acquire complementary products or technologies. Additional equity or debt financing may not be available on terms that are acceptable to us or at all. If we raise additional funds through the issuance of equity or convertible debt securities, the ownership of our stockholders would be diluted and these securities might have rights, preferences and privileges senior to those of our current stockholders. If we raise funds through the issuance of debt instruments, the agreements governing such debt instruments may contain covenant restrictions that limit our ability to, among other things: (i) incur additional debt, assume obligations in connection with letters of credit, or issue guarantees; (ii) create liens; (iii) make certain investments or acquisitions; (iv) enter into transactions with our affiliates; (v) sell certain assets; (vi) redeem capital stock or make other restricted payments; (vii) declare or pay dividends or make other distributions to stockholders; and (viii) merge or consolidate with any person. If adequate funds are not available on acceptable terms, our ability to fund our expansion, take advantage of unanticipated opportunities, develop or enhance our products or services, or otherwise respond to competitive pressures would be significantly limited.
Risk Related to Our Industry
We operate in the highly cyclical semiconductor industry, which is subject to significant downturns.
The semiconductor industry is highly cyclical and is characterized by constant and rapid technological change, rapid product obsolescence and price erosion, evolving standards, short product life-cycles and wide fluctuations in product supply and demand. The industry has experienced significant downturns, often in connection with, or in anticipation of, maturing product cycles of both semiconductor companies’ and their customers’ products and declines in general economic conditions. These downturns have been characterized by diminished product demand, production overcapacity, high inventory levels and accelerated erosion of average selling prices. We have experienced these conditions in our business in the past and may experience such downturns in the future. We may not be able to manage these downturns. Any future downturns of this nature could have a material adverse effect on our business, financial condition and results of operations.
If demand for products incorporating complex semiconductors and semiconductor IP does not increase, our business may be harmed.
Our business and the adoption and continued use of our IP by semiconductor companies depends on continued demand for products requiring complex semiconductors, embedded memories and logic elements, such
27
Table of Contents
as cellular and digital phones, pagers, PDAs, digital cameras, DVD players, switches and modems. The demand for such products is uncertain and difficult to predict, and it depends on factors beyond our control such as the competition faced by each customer, market acceptance of products that incorporate our IP and the financial and other resources of each customer. A reduction in the demand for products incorporating complex semiconductors and semiconductor IP or a decline in the general economic environment which results in the cutback of research and development budgets or capital expenditures would likely result in a reduction in demand for our products and could harm our business. In addition, with increasing complexity in each successive generation of semiconductors, we face the risk that the rate of adoption of smaller technology processes may slow down.
In addition, the semiconductor industry is highly cyclical. Significant economic downturns characterized by diminished demand, erosion of average selling prices, production overcapacity and production capacity constraints are other factors affecting the semiconductor industry. As a result, we may face a reduced number of design starts, tightening of customers’ operating budgets, extensions of the approval process for new orders and projects and consolidation among our customers, all of which may adversely affect the demand for our products and may cause us to experience substantial period-to-period fluctuations in our operating results.
The market for semiconductor IP can be highly competitive and dynamic. We may experience loss in market share to larger competitors with greater resources and/or our customer base may choose to develop semiconductor IP using their own internal design teams.
We face competition from both existing suppliers of third-party semiconductor IP, as well as new suppliers that may enter the market. We also compete with the internal design teams of large, integrated device manufacturers. Many of these internal design teams have substantial programming and design resources and are part of larger organizations with substantial financial and marketing resources. These internal teams may develop technologies that compete directly with our technologies or may actively seek to license their own technologies to third parties, which could negatively affect our revenue and operating results. In addition, our existing customers may choose to develop their own technology solutions internally.
Many of our existing competitors have longer operating histories, greater brand recognition and larger customer bases, as well as greater financial and marketing resources, than we do. This may allow them to respond more quickly than we can to new or emerging technologies and changes in customer requirements. It may also allow them to devote greater resources than we can to the development and promotion of their products. In addition, the intense competition in the market for semiconductor IP could result in pricing pressures, reduced license revenues, reduced margins or lost market share, any of which could harm our operating results and cause our stock price to decline.
The technology used in the semiconductor industry is rapidly changing and if we are unable to develop new technologies and adapt our existing IP to new processes, we will be unable to attract or retain customers.
The semiconductor industry has been characterized by an increasingly rapid rate of development of new technologies and manufacturing processes, rapid changes in customer requirements, frequent product introductions and ongoing demands for greater speed and functionality. Our future success depends on our ability to develop new technologies and introduce new products to the marketplace in a timely manner, and to adapt our existing IP to satisfy the requirements of new processes and our customers. If our development efforts are not successful or are significantly delayed, or if the enhancements or new generations of our products do not achieve market acceptance, we may be unable to attract or retain customers and our operating results could be harmed.
Our ability to continue developing technical innovations involves several risks, including the following:
| • | our ability to anticipate and respond in a timely manner to changes in the requirements of semiconductor companies; |
| • | the emergence of new semiconductor manufacturing processes and our ability to enter into strategic relationships with pure-play semiconductor foundries to develop and test technologies for these new processes and provide customer referrals; |
28
Table of Contents
| • | the significant research and development investment that we may be required to make before market acceptance, if any, of a particular technology; |
| • | the possibility that the industry may not accept a new technology or may delay use of a new technology after we have invested a significant amount of resources to develop it; and |
| • | new technologies introduced by our competitors. |
If we are unable to adequately address these risks, our IP will become obsolete and we will be unable to sell our products. Furthermore, as new technologies or manufacturing processes are announced, customers may defer licensing our IP until those new technologies become available or our IP has been adopted for that new technology or manufacturing process.
In addition, research and development requires a significant expense and resource commitment. We may not have the financial and other resources necessary to develop the technologies demanded in the future and may be unable to attract or retain customers.
General economic conditions and future terrorist attacks may reduce our revenues and harm our business.
As our business has grown, we have become increasingly subject to the risks arising from adverse changes in domestic and global economic conditions. Continued unrest in Israel and the Middle East may negatively impact the investments that our worldwide customers make in these geographic regions. If businesses or consumers defer or cancel purchases of new products that contain complex semiconductors, purchases by fabless semiconductor companies, integrated device manufacturers and production levels by semiconductor manufacturers could decline. This could adversely affect our revenues which in turn would have an adverse effect on our results of operations and financial condition.
Risk Related to Our Intellectual Property Rights
We rely on our proprietary technologies and we cannot assure you that the precautions taken to protect our rights will be adequate or that we will continue to be able to adequately secure such proprietary technologies from third parties.
We rely on a combination of patent, trademark, copyright, mask work and trade secret laws to protect our proprietary rights in our technologies. We cannot be sure that the United States Patent and Trademark Office will issue patents or trademarks for any of our pending applications. Furthermore, any patents or trademark rights that we hold or may hold in the future may be challenged, invalidated or circumvented or may not be of sufficient scope or strength to provide meaningful protection or any commercial advantage to us. Furthermore, the laws of some foreign countries may not adequately protect our IP to the same extent as applicable laws protect our IP in the United States. For instance, some portion of our IP developed outside of the United States may not receive the same patent, trademark, trade secret, copyright or similar protection that it would receive if it was developed in the United States. As we increase our international presence, we expect that it will become more difficult to monitor the development of competing technologies that may infringe on our IP rights as well as unauthorized uses of our technologies.
We use license agreements, confidentiality agreements and employee nondisclosure and invention assignment agreements to limit access to and distribution of our proprietary information and to obtain ownership of technology prepared on a work-for-hire basis. We cannot be sure that we have taken adequate steps to protect our IP rights and deter misappropriation of these rights or that we will be able to detect unauthorized uses and take effective steps to enforce our rights. In addition, while we are not aware of any particular deficiencies, we cannot be certain that businesses or companies that we have acquired had taken adequate steps to protect their IP rights prior to our acquisition of such business or company. Since we also rely on unpatented trade secrets to protect some of our proprietary technology, we cannot be certain that others will not independently develop and patent the same technologies or otherwise acquire the same or substantially equivalent technologies or otherwise
29
Table of Contents
gain access to our proprietary technology or disclose that technology. We also cannot be sure that we can ultimately protect our rights to and improperly disclose our proprietary technologies to others.
Third parties may claim we are infringing or assisting others to infringe their IP rights, and we could suffer significant litigation or licensing expenses or be prevented from licensing our technology.
There are numerous patents in the semiconductor industry and new patents are being issued at a rapid rate. It is not always practicable to determine in advance whether our technologies infringe the patent right of others. As a result, we may be compelled to respond to infringement claims by third parties to protect our IP rights or defend our customers’ IP rights. These infringement claims, regardless of merit, could be costly and time-consuming, and divert our management and key personnel from our business operations. In settling these claims, we may be required to pay significant damages and may be prevented from licensing some of our technologies unless we enter into a royalty or license agreement. In addition, if challenging a claim is not feasible, we might be required to enter into royalty or license agreements. If available, the royalty or license agreement may include terms which require us to obtain a license from the third-party to sell or use the relevant technology which may result in significant expenses to us or to redesign the technology which would be time consuming and costly to us. In the event that we are not be able to obtain such royalty or license agreements on terms acceptable to us, we may be prevented from licensing or developing our technology.
Risk Related to Our Stock
Our stock price may be volatile and could decline substantially.
The market price of our common stock has fluctuated significantly in the past, will likely continue to fluctuate in the future and may decline substantially. Fluctuations or a decline in our stock price may occur regardless of our performance. Among the factors that could affect our stock price, in addition to our performance, are the following:
| • | variations between our operating results and the published expectations of securities analysts; |
| • | changes in financial estimates or investment recommendations by securities analysts who follow our business; |
| • | announcements by us or our competitors of significant contracts, new products or services, acquisitions, or other significant transactions; |
| • | the inclusion or exclusion of our stock in various indices or investment categories, especially as compared to the investment profiles of our stockholders at a given time; |
| • | changes in economic and capital market conditions; |
| • | changes in business regulatory conditions; and |
| • | the trading volume of our common stock. |
A sale of a substantial number of shares of our common stock may cause the price of our common stock to decline.
Sales of a substantial number of shares of our common stock in the public market could adversely affect the market price of our common stock. Alexander Shubat, our President and Chief Executive Officer and a member of the Board of Directors, holds a large block of our common stock. Dr. Shubat has established a sales plan, or other sales accounts, to sell shares of our common stock from time to time in order to diversify his holdings. In addition, Artis Capital Management LLC holds more than 20% of our outstanding common stock and NXP acquired approximately 9.8% of our outstanding common stock in connection with the recent transactions we entered into with them. Significant sales by insiders or significant stockholders, or the perception that large sales could occur, could adversely impact the public market for our stock. Sales transactions are also subject to the restrictions and filing requirements mandated by Rule 144 under the Securities Exchange Act. Our officers,
30
Table of Contents
directors and principal stockholders controlled as of September 30, 2009 approximately 54% of our common stock. As a result, this significant concentration of share ownership may adversely affect the trading price of our common stock because investors often perceive disadvantages to owning stock in companies with significant block stockholders.
Our certificate of incorporation and bylaws as well as Delaware law contain provisions that could discourage transactions resulting in a change in control, which may negatively affect the market price of our common stock.
Our certificate of incorporation, our bylaws and Delaware law contain provisions that make it more difficult for another company to acquire control of our Company. In addition, these provisions could limit the price that investors would be willing to pay in the future for shares of our common stock. These provisions include:
| • | our Board of Directors is authorized, without prior stockholder approval, to create and issue preferred stock, commonly referred to as “blank check” preferred stock, with rights senior to those of common stock; |
| • | our Board of Directors is staggered into three classes, only one of which is elected at each annual meeting; |
| • | stockholder action by written consent is prohibited pursuant to our certificate of incorporation; |
| • | nominations for election to our Board of Directors and the submission of matters to be acted upon by stockholders at a meeting are subject to advance notice requirements pursuant to our bylaws; |
| • | certain provisions in our bylaws and certificate of incorporation may only be amended with the approval of stockholders holding 80% of our outstanding voting stock; |
| • | the ability of our stockholders to call special meetings of stockholders is prohibited; and |
| • | our Board of Directors is expressly authorized to make, alter or repeal our bylaws. |
We are also subject to Section 203 of the Delaware General Corporation Law, which provides, subject to enumerated exceptions, that if a person acquires 15% or more of our outstanding voting stock, the person is an “interested stockholder” and may not engage in any “business combination” with us for a period of three years from the time the person acquired 15% or more of our outstanding voting stock. In addition, in February 2007, we executed change in control agreements with our executive officers, which provide severance benefits following a termination of employment without cause, or for good reason, following a change in control. The existence of these agreements and potential pay-outs could act as a deterrent to a potential acquirer.
Item 1B. Unresolved Staff Comments
None.
Facilities
Our principal administrative, sales, marketing and research and development facility is in Fremont, California, and occupies approximately 61,500 square feet. In addition, we have development centers in Armenia and India. In September 2003, our development center in Armenia moved into a building owned by us. The office space is approximately 40,000 square feet and the total cost of the building was approximately $2.4 million. We have a development center in India located in Noida, near Delhi, which occupies approximately 26,000 square feet in a building leased with a lease term under which the Company has the right, but not the obligation, to occupy the facility through July 2017. We can terminate this lease at any time with a three month notification. Our other development center in India is located in Pune which occupies approximately 4,900 square feet with a lease term through June 2011. We lease an office in Seattle, Washington that is occupied
31
Table of Contents
mainly by personnel from the NVM product line. The Seattle office, which occupies approximately 8,000 square feet, is leased through October 2013. We also lease office space in Clinton, New Jersey that is currently unoccupied, formerly used by research and development and engineering personnel. The Clinton office, which occupies approximately 10,900 square feet, is leased through November 2010. With the acquisition of ARC International in September 2009, we assumed additional lease obligations for new facilities. The principal administrative, sales and marketing and research and development site for ARC was located in San Jose, California and occupied approximately 22,000 square feet of office space leased through October 2011. In October 2009, we moved the employees from ARC’s San Jose facility into our Fremont facility and terminated the San Jose lease as of November 30, 2009. The former headquarters of ARC, located in St. Albans, UK is approximately 15,000 square feet and leased through January 2017. A development center in St. Petersburg, Russia occupies approximately 15,000 square feet and is leased through July 2010. Research and development for the Sonic Focus product line is located in an audio mastering studio in Truckee, California. The lease of the 2,700 square foot Truckee facility expires in February 2011. The Truckee studio which is leased by Sonic Focus is owned by one of the former executive officers of Sonic Focus who is now an employee of Virage Logic. With the acquisition of NXP product line in November 2009, we inherited a short-term lease in Eindhoven, the Netherlands from NXP for six months. We will look for alternative arrangements.
We are a party to legal proceedings and claims of various types in the ordinary course of business. We believe based on information currently available to management that the resolution of such claims will not have a material adverse impact on our consolidated financial position or results of operations.
Item 4. Submission of Matters to a Vote of Security Holders
None.
32
Table of Contents
Item 5. Market for Registrant’s Common Equity, Related Stockholder Matters and Issuer Purchases of Equity Securities
Market Price and Dividends on Virage Logic Common Stock
Our common stock is traded on the NASDAQ Global Market under the symbol VIRL. The following table sets forth, for the periods indicated, the high and low closing sales prices for our common stock as reported on the NASDAQ Global Market.
| Fiscal Year 2009 | Fiscal Year 2008 | |||||||||||
| High | Low | High | Low | |||||||||
| First Quarter |
$ | 5.95 | $ | 2.84 | $ | 8.69 | $ | 7.80 | ||||
| Second Quarter |
3.36 | 2.40 | 8.43 | 5.76 | ||||||||
| Third Quarter |
4.52 | 2.83 | 7.20 | 5.42 | ||||||||
| Fourth Quarter |
5.36 | 4.35 | 7.11 | 4.67 | ||||||||
As of November 30, 2009, there were approximately 53 stockholders of record of our common stock.
The Company has never paid or declared any cash dividends on our common stock and does not anticipate paying cash dividends in the foreseeable future.
During the fiscal year ended September 30, 2009, we did not issue or sell any shares of common stock, or securities exercisable for or exchangeable into common stock, or any other securities that were not registered under the Securities Act of 1933. In November 2009, we issued 2.5 million shares of our common stock to NXP in a private placement which was exempt from the registration requirements under the Securities Act of 1933.
On May 14, 2009, the Company announced that its Board of Directors authorized the extension of the expiration date of the stock repurchase program to repurchase up to $20 million of shares of the Company’s common stock in the open market or negotiated transactions through December 2010. Since the inception of the program in May 2008, the Company has repurchased 890,000 shares for a total of $5.1 million. The Company has not repurchased additional shares since the extension of the program was authorized on May 14, 2009. As of September 30, 2009, the remaining balance available for future stock repurchase was $14.9 million under the Company’s stock repurchase program.
33
Table of Contents
Performance Measurement Comparison of Shareholder Return
The graph below compares the cumulative 5-year total return of our common stock with the cumulative total returns of the NASDAQ composite index and the Philadelphia Semiconductor index. The graph tracks the performance of a $100 investment in our common stock, a peer index, and the NASDAQ index from September 30, 2004 to September 30, 2009.
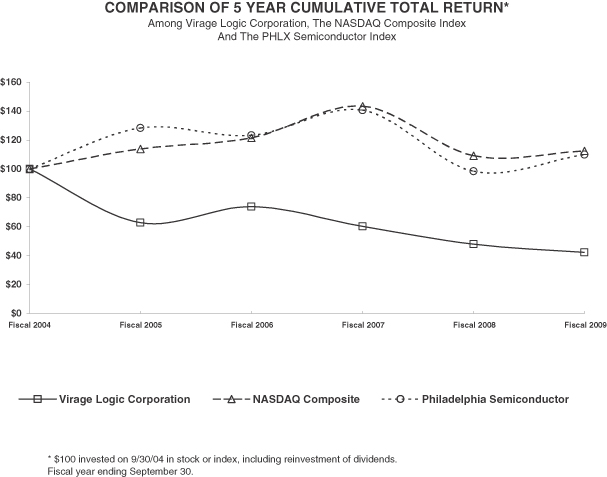
| Fiscal 2004 | Fiscal 2005 | Fiscal 2006 | Fiscal 2007 | Fiscal 2008 | Fiscal 2009 | |||||||
| Virage Logic Corporation |
100.00 | 62.85 | 73.88 | 60.18 | 47.85 | 42.25 | ||||||
| NASDAQ Composite |
100.00 | 113.78 | 121.50 | 143.37 | 109.15 | 112.55 | ||||||
| Philadelphia Semiconductor |
100.00 | 128.30 | 123.32 | 140.56 | 98.45 | 109.93 |
Item 6. Selected Consolidated Financial Data
The selected consolidated financial data set forth below should be read together with “Management’s Discussion and Analysis of Financial Condition and Results of Operations” and our consolidated financial statements and the notes thereto included elsewhere in this report. The consolidated statements of operations data for each of the fiscal years ended September 30, 2009, 2008 and 2007 and the consolidated balance sheet data as of September 30, 2009 and 2008 have been derived from our audited consolidated financial statements included elsewhere in this report. The consolidated statements of operations data for the fiscal years ended September 30, 2007, 2006 and 2005 and the consolidated balance sheet data as of September 30, 2007, 2006, and 2005 have been derived from our audited consolidated financial statements not included in this report. The historical financial information may not be an accurate indicator of our future performance.
34
Table of Contents
SELECTED CONSOLIDATED CONDENSED FINANCIAL DATA
| Year Ended September 30, | ||||||||||||||||||||
| 2009 | 2008 | 2007 | 2006 | 2005 | ||||||||||||||||
| (In thousands, except per share data) | ||||||||||||||||||||
| Consolidated Statements of Operations Data: |
||||||||||||||||||||
| Revenues |
$ | 47,443 | $ | 59,330 | $ | 46,527 | $ | 59,303 | $ | 53,389 | ||||||||||
| Cost and expenses: |
||||||||||||||||||||
| Cost of revenues |
9,833 | 11,106 | 12,938 | 14,803 | 13,035 | |||||||||||||||
| Research and development |
29,967 | 27,725 | 20,346 | 21,407 | 19,841 | |||||||||||||||
| Sales and marketing |
12,815 | 14,749 | 15,464 | 16,858 | 15,608 | |||||||||||||||
| General and administrative |
10,836 | 8,382 | 8,891 | 10,319 | 9,083 | |||||||||||||||
| Goodwill impairment |
11,839 | — | — | — | — | |||||||||||||||
| Restructuring |
1,499 | 316 | 580 | — | — | |||||||||||||||
| Total cost and expenses |
76,789 | 62,278 | 58,219 | 63,387 | 57,567 | |||||||||||||||
| Operating income (loss) |
(29,346 | ) | (2,948 | ) | (11,692 | ) | (4,084 | ) | (4,178 | ) | ||||||||||
| Interest income |
956 | 2,913 | 4,002 | 3,055 | 1,740 | |||||||||||||||
| Other income (expenses), net |
(282 | ) | 482 | (157 | ) | 270 | (37 | ) | ||||||||||||
| Income (loss) before taxes |
(28,672 | ) | 447 | (7,847 | ) | (759 | ) | (2,475 | ) | |||||||||||
| Minority interest in loss of consolidated subsidiaries |
47 | — | — | — | — | |||||||||||||||
| Income tax provision (benefit) |
5,499 | (107 | ) | (3,242 | ) | 120 | (2,160 | ) | ||||||||||||
| Net income (loss) |
$ | (34,124 | ) | $ | 554 | $ | (4,605 | ) | $ | (879 | ) | $ | (315 | ) | ||||||
| Basic and diluted net income (loss) per share |
$ | (1.48 | ) | $ | 0.02 | $ | (0.20 | ) | $ | (0.04 | ) | $ | (0.01 | ) | ||||||
| Shares used in computing basic net income (loss) per share |
22,979 | 23,423 | 23,111 | 22,812 | 22,187 | |||||||||||||||
| Shares used in computing diluted net income (loss) per share |
22,979 | 23,673 | 23,111 | 22,812 | 22,187 | |||||||||||||||
| September 30, | ||||||||||||||||||||
| 2009 | 2008 | 2007 | 2006 | 2005 | ||||||||||||||||
| (In thousands) | ||||||||||||||||||||
| Consolidated Balance Sheet Data: |
||||||||||||||||||||
| Cash and cash equivalents |
$ | 22,473 | $ | 13,214 | $ | 14,820 | $ | 20,815 | $ | 26,841 | ||||||||||
| Marketable securities |
7,383 | 52,591 | 60,368 | 56,786 | 40,997 | |||||||||||||||
| Working capital |
21,049 | 53,574 | 62,315 | 76,501 | 67,084 | |||||||||||||||
| Total assets |
118,105 | 129,204 | 127,893 | 126,275 | 114,494 | |||||||||||||||
| Accumulated deficit |
(60,309 | ) | (26,185 | ) | (26,739 | ) | (22,134 | ) | (21,255 | ) | ||||||||||
| Total stockholders’ equity |
78,210 | 110,702 | 110,219 | 108,818 | 99,368 | |||||||||||||||
35
Table of Contents
Item 7. Management’s Discussion and Analysis of Financial Condition and Results of Operations
The following discussion of our financial condition and results of operations should be read together with the consolidated financial statements and the notes thereto included elsewhere in this Annual Report on Form 10-K . This discussion contains forward-looking statements, which involve risk and uncertainties. Our actual results could differ materially from those anticipated in the forward looking statements as a result of certain factors, including but not limited to those discussed in “Risk Factors” above and in other documents we file from time to time with the Securities and Exchange Commission. See “Forward Looking Statements” in Part I of this Annual Report on Form 10-K.
Overview
Business Environment
Virage Logic provides semiconductor IP to the global semiconductor industry. Our semiconductor IP offering consists of (1) compilers that allow chip designers to configure our memories, or SRAMs, into different sizes and shapes on a single silicon chip, (2) IP and development solutions for embedded test and repair of on-chip memory instances, (3) software development tools used to design memory compilers, (4) NVM instances, (5) logic cell libraries, (6) DDR memory controller, PCIe, HDMI/DVI/DisplayPort and MIPI® interface IP components, and (7) configurable 32-bit processor cores and vertical application solutions. We also provide design services related to our IP to the semiconductor industry.
Our customers include fabless semiconductor companies, integrated device manufacturers and foundries. As semiconductor companies face increasing pressures to bring products to market faster and semiconductors have shorter product cycles, we focus on providing our customers a broad product offering as a means to satisfy a larger portion of our customers’ semiconductor IP needs, while positioning ourselves to offer advanced products as the semiconductor industry migrates to smaller geometries.
The timing of customer purchases of our products is typically related to new design starts by fabless companies and migration to new manufacturing processes by integrated device manufacturers and foundries. Because of the high costs involved in new design starts and migration to new manufacturing processes, our customers’ decisions regarding these matters are heavily dependent on their long-term business outlook. As a result, our business, and specifically our license revenues, are likely to grow during times of positive outlook for the semiconductor industry.
In fiscal year 2009, we derived 84% of our license revenue and 80% of our maintenance revenue from more advanced process nodes, namely 90-nanometer, 65-nanometer, 45-nanometer and 32-nanometer technologies and 16% of license revenue and 20% of maintenance revenue from the older process nodes, predominantly 0.13, 0.18, 0.25 and 0.35 micron technologies. We expect the 90-nanometer, 65-nanometer, 45-nanometer and 32-nanometer technologies to drive revenue growth in the foreseeable future while license revenues from the older process nodes decline. Our royalty revenue to date has been from production on the older process nodes, however we expect future growth in royalty revenues to be driven by the advanced 32-nanometer, 45-nanometer, 65-nanometer and 90-nanometer technologies, in addition to continued production on the 0.13 and 0.18 micron technologies.
Revenues from perpetual licenses for the semiconductor IP products are generally recognized when persuasive evidence of an arrangement exists, delivery of the product has occurred, the fee is fixed or determinable, and collectibility is reasonably assured. If any of these criteria are not met, revenue recognition is deferred until such time as all criteria are met. Revenues from term-based licenses are recognized ratably over the term of the license, which is generally between twelve to thirty-six months in duration, provided the criteria mentioned above are met.
We sell our products early in the design process, and there are time delays of twenty-four to thirty-six months between the sale of our products and the time we expect to receive royalty revenues. These time
36
Table of Contents
delays are due to the length of time required for our customers to implement our semiconductor IP into their designs, and then to manufacture, market and sell a product incorporating our products. As a result, we expect our royalty revenues to increase in periods in which manufacturing volumes of semiconductors are growing. Future growth of our royalty revenue is dependent on our ability to increase the number of designs incorporating our products and on such designs achieving substantial manufacturing volumes.
Sources of Revenues
Our revenues are derived principally from licenses of our semiconductor IP products, which include:
| • | semiconductor IP platforms; |
| • | embedded memory, logic and I/O elements; |
| • | standard and custom memory compilers; |
| • | memory test processor and fuse box components for embedded test and repair of defective memory cells; and |
| • | DDR memory controllers, physical interfaces, and delay locked loops. |
We also derive revenues from royalties, custom design services, maintenance services and library development and consulting services related to the license of logic components. Our revenues are reported in three separate categories: license revenues, maintenance revenues, and royalty revenues. License revenues are derived from license fees, fees for custom design services, library design services and consulting services. Maintenance revenues are derived from maintenance fees. Royalty revenues are derived from fees paid by a customer or a third-party foundry based on production volumes of wafers containing chips utilizing our semiconductor IP technologies.
Licenses of our semiconductor IP typically cover a range of platform, embedded memory, logic, I/O, DDR memory controller, PHY and DLL products. Licenses of our semiconductor IP products can be either perpetual or term-based. In addition, maintenance can be purchased for both types of licenses.
We derive our royalty revenues from pure-play foundries that manufacture chips incorporating our ASAP Memory, ASP Logic, SiWare Memory, SiWare Logic and STAR Memory products for our fabless customers, and from integrated device manufacturers and fabless customers that utilize our STAR Memory Systemtm and NOVeA® technologies. Royalty payments are in addition to the license fees we collect from our customers, and are calculated based on production volumes of wafers containing chips utilizing our semiconductor IP technologies based on a rate per-chip or rate per-wafer depending on the terms of the respective license agreement. Royalty revenues are generally determined and recognized one quarter in arrears, when a production volume report is received from the customer or foundry.
Royalty revenues for the fiscal years ended September 30, 2009, 2008, and 2007 were $8.1 million, $12.1 million and $12.1 million, respectively.
As part of our transaction with NXP, NXP agreed to pay us $60 million in revenue over a four-year period. We have been dependent on a limited number of customers for a substantial portion of our annual revenues, although that dependency continues to decrease. Customers comprising our top 10 customer group have changed from time to time. In fiscal year 2009, two customers generated 10% or more of our revenues. In each of fiscal years 2008 and 2007, one customer generated 10% or more of our revenues.
Sales to customers located outside North America accounted for 46%, 50%, and 54% of our revenues in fiscal years 2009, 2008 and 2007, respectively. Substantially all of our direct sales representatives and field application engineers are located in North America and Europe and serve those regions. In Japan and the rest of Asia, we engage in indirect sales through distributors and direct sales through sales representatives. All revenues to date have been denominated in U.S. dollars.
37
Table of Contents
Significant Events in 2009
On September 15, 2009, we purchased 130,792,339 ordinary shares of ARC International, a leading provider of microprocessor IP and solutions to OEM and semiconductor companies globally, representing a 84.68% ownership stake, for approximately £21.4 million, or approximately $35.4 million. From September 16 through September 30, 2009, we acquired an additional 15,333,789 shares for an aggregate ownership of 94.62% of the total shares as of September 30, 2009. In November 2009, we completed the acquisition of the remaining ARC shares. The cost to acquire all of the ARC shares was approximately £25.2 million (or approximately $41.0 million based on the exchange rate at the close of trading in New York on August 17, 2009). The ARC configurable 32-bit processor cores and vertical application solutions complement Virage Logic’s broad portfolio of semiconductor IP and offer System-on-Chip (SoC) designers a single trusted source for highly differentiated IP. The acquisition of ARC expands Virage Logic’s ability to serve the global semiconductor market by complementing its extensive portfolio of physical IP and standards-based advanced interface IP solutions with ARC’s widely used processor IP, a necessary component for complex SoC integrated circuits. In November 2009, we acquired the remaining minority interest in ARC consistent with the terms of cash offer of 16.25 pence per share for a total of $41.6 million. The acquisition resulted in ARC being a wholly-owned subsidiary of the Company.
On November 16, 2009 we acquired from NXP B.V., a leading semiconductor company founded by Royal Philips Electronics Inc., certain rights to IP assets associated with selected NXP advanced CMOS libraries, IP blocks and SoC infrastructure along with other classes of semiconductor IP, including approximately 25 associated patent families and certain related equipment. In connection with the acquisition, we hired approximately 150 former NXP employees. In exchange for the assets we issued 2,500,000 shares of our common stock and paid $188,000 in cash to NXP. We also assumed liabilities that arise after the closing relating to the former employees of NXP we hired and assumed certain liabilities of NXP under contracts related to the assets.
In connection with the NXP asset acquisition, we entered into three related agreements with NXP. Under an intellectual property transfer and license agreement, (1) we are licensing back to NXP the technology, software and associated intellectual property rights included in the assets so that NXP can continue using these rights in its operations, (2) NXP is granting us a perpetual, royalty-free license to certain patents and other intellectual property rights of NXP related to the assets and (3) we will pay, for a seven-year period following the closing, a royalty to NXP based on the revenue we receive from licensing to third parties the assets we acquired from NXP. Under a master license agreement, we are licensing to NXP for an initial term of three and one half years substantially all of the pre-existing intellectual property rights we control, in return for which NXP will pay us $20 million over a four-year period in quarterly payments that will decline over time. Under a technology services agreement, we will provide NXP with support and engineering services relating to integrated circuit design, for which NXP will pay us $40 million over a four-year period in quarterly payments that will decline over time. We expect that the master license agreement and technology services agreement will result in revenue of approximately $4.3 million, respectively, per quarter in fiscal year 2010. We expect that payments under the master license agreement and technology services agreement will materially increase our revenue in fiscal year 2010. This revenue increase will be substantially offset by additional costs of revenues and research and development and general and administrative costs and expenses related to our employment of approximately 150 former NXP employees and amortization of the NXP assets.
Critical Accounting Policies and Estimates
The preparation of financial statements in accordance with generally accepted accounting principles in the United States requires that we make estimates and judgments, which affect the reported amounts of assets, liabilities, revenues and expenses, and related disclosures of contingent assets and liabilities. We continually evaluate our estimates, including those related to percentage-of-completion, allowance for doubtful accounts, investments, intangible assets, income taxes, and contingencies such as litigation. We base our estimates on
38
Table of Contents
historical experience and other assumptions that we believe are reasonable under the circumstances. Actual results may differ from these estimates under different assumptions or conditions.
We have identified the following as critical accounting policies to our Company:
| • | revenue recognition; |
| • | valuation of accounts receivable; |
| • | valuation of purchased intangibles, including goodwill; |
| • | valuation of long-lived assets; |
| • | valuation of acquired businesses and assets; |
| • | share-based compensation; and |
| • | accounting for income taxes. |
Revenue Recognition
We recognize revenue on our intellectual property in accordance with the software revenue recognition guidelines because the software is not incidental to the IP as the IP is embedded in the software and the intellectual property is, in essence, a software product.
Revenues from perpetual licenses for the semiconductor IP products are generally recognized when persuasive evidence of an arrangement exists, delivery of the product has occurred, the fee is fixed or determinable, and collectibility is reasonably assured. The Company uses a completed performance model for perpetual licenses that do not include services to provide significant production, modification or customization of software as all of the elements have been delivered. The Company determines delivery has occurred when all the license materials that are specified in the evidence of a signed arrangement including any related documentation and the license keys are delivered electronically through the FTP server or via Electronic mail (e-mail). If any of these criteria is not met, revenue recognition is deferred until such time as all criteria are met. Revenues from term-based licenses that do not require specific customization for the semiconductor IP and software products are recognized ratably over the term of the license, which is generally between twelve to thirty-six months in duration, provided the criteria mentioned above are met. The Company uses a proportional performance model for term-based licenses as these licenses have a right to receive unspecified additional products that are granted over the access term of the license. Consulting services represent an immaterial amount of our revenue thus are recorded as part of license revenue. These consulting services are not related to the functionality of the products licensed. Revenue from consulting services is recognized on the time and materials method or as work is performed.
Licenses of custom memory compilers and logic libraries may involve customization to the functionality of the software; therefore revenues from such licenses are recognized over the period that services are performed. Revenue derived from library development services are recognized using a percentage-of-completion method, and revenues from technical consulting services are recognized as the services are performed. For all license and service agreements accounted for using the percentage-of-completion method, we determine progress-to-completion based on labor hours incurred in comparison to the estimated total service hours required to complete the development or service or on the value of contract milestones completed. We believe that we are able to reasonably and reliably estimate the costs to complete projects accounted for using the percentage-of-completion method based on our historical experience with similar project requirements. If we cannot reasonably and reliably estimate the costs to complete a project, the completed contract method of accounting is used, such that costs are deferred until the project is completed, at which time revenues and related costs are recognized. A provision for estimated losses on any project is made in the period in which the loss becomes probable and can be reasonably estimated. Costs incurred in advance of revenue recognition are recorded as costs in excess of related revenue on uncompleted contracts. If customer acceptance is required for
39
Table of Contents
completion of specified milestones, the related revenue is deferred until the acceptance criteria are met. If a portion of the value of a contract is contingent based on meeting specified criteria, then the contingent value of the contract is deferred until the contingency has been satisfied or removed.
For agreements that include multiple elements, we recognize revenues attributable to delivered or completed elements when such elements are delivered or completed. The amount of such revenues is determined by applying the residual method of accounting by deducting the aggregate fair value of the undelivered or uncompleted elements, which we determine by each such element’s vendor-specific objective evidence of fair value, from the total revenues recognizable under such agreement. Vendor-specific objective evidence of fair value of each element of an arrangement is based upon the higher of the normal pricing for such licensed product and service when sold separately or the actual price stated in the contract. For maintenance, fair value is determined based on 20% of the net selling price of the license. Revenues are recognized once we deliver the element identified as having vendor-specific objective evidence or once the provision of the services is completed. Maintenance revenues are recognized ratably over the remaining contractual term of the maintenance period from the date of delivery of the licensed materials receiving maintenance, which is generally twelve months.
We assess whether the fee associated with each transaction is fixed or determinable and collection is reasonably assured and evaluate the payment terms. If a portion of the fee is due beyond normal payment terms, we recognize the revenues on the payment due date, as long as collection is reasonably assured. We assess collectibility based on a number of factors, including past transaction history and the overall credit-worthiness of the customer. If collection is not reasonably assured, revenue is deferred and recognized at the time collection becomes reasonably assured, which is generally upon receipt of the payment.
Amounts invoiced to customers in excess of recognized revenues are recorded as deferred revenues. Amounts recognized as revenue in advance of invoicing the customer are recorded as unbilled accounts receivable. The timing and amounts invoiced to customers can vary significantly depending on specific contract terms and can therefore have a significant impact on deferred revenues and unbilled accounts receivable in any given period. If all of the criteria as applicable have been met prior to invoicing that would create an unbilled accounts receivable balance.
Royalty revenues are generally determined and recognized one quarter in arrears, when a production volume report is received from the customer or foundry, and are calculated based on actual production volumes of wafers containing chips utilizing our semiconductor IP technologies based on a rate per-chip or rate per-wafer depending on the terms of the respective license agreement. Depending on the contractual terms, prepaid royalties are recognized as revenue upon either the receipt of a corresponding royalty report or after all related license deliverables have been made.
Valuation of Accounts Receivable
We monitor collections and payments from our customers and maintain an allowance for estimated credit losses based upon specific customer collection risks that we have identified. While such credit losses have historically been within our expectations and the allowance we have established, we cannot guarantee that we will continue to experience the same credit loss rates that we have in the past. Since our accounts receivable are concentrated in a relatively small number of customers, a significant change in the liquidity or financial position of any one of these customers could have a material adverse impact on the quality of our accounts receivable and our future operating results. As of September 30, 2009, we have reserved for $767,000 of billed and unbilled receivables. As of September 30, 2008, there was $223,000 reserved for a single customer.
Valuation of Purchased Intangibles, Including Goodwill
We evaluate purchased intangibles, including goodwill, for impairment at least annually. An assessment of goodwill is subjective by nature, and significant management judgment is required to forecast future operating
40
Table of Contents
results, projected cash flows and current period market capitalization levels. If our estimates or related assumptions change in the future, these changes in conditions could require material write-downs of net intangible assets, including impairment charges for goodwill. The valuation of intangible assets was based on management’s estimates. As of September 30, 2009, the Company had intangible assets of $29.6 million from the acquisitions of In-Chip Systems, Ingot Systems, the NVM product line of Impinj, and ARC. Intangible assets with finite useful lives are amortized over the estimated life of each asset. In the second quarter of fiscal 2009, we recorded a goodwill impairment charge of $11.8 million which was comprised of all the goodwill on our balance sheet at that date. As of September 30, 2009, management believes no further impairment of intangible assets including goodwill has occurred. The carrying value of purchased intangibles, including goodwill, is $40.6 million and $18.0 million as of September 30, 2009 and 2008, respectively. If the asset is deemed impaired, the maximum amount of impairment would be the full carrying value of the asset.
Valuation of Long-Lived Assets
We review the carrying value of our long-lived assets whenever events or changes in business circumstances or our planned use of assets indicate that their carrying amounts may not be fully recoverable or that their useful lives are no longer appropriate. This review is based upon our projections of anticipated future cash flows from such assets. While we believe that our estimates of future cash flows are reasonable, different assumptions regarding such cash flows could materially affect our evaluations, which could result in an impairment charge. The building the Company had in Armenia and its leasehold improvements are valued at cost less accumulated depreciation and amortization and amounted to approximately $1.7 million as of September 30, 2009.
Valuation of Acquired Businesses and Assets
We allocate the cost of the acquired companies to the identifiable tangible and intangible assets acquired and liabilities assumed, with the remaining amount being classified as goodwill. We amortize certain intangible assets with definite lives to expense over time and have historically expensed in-process research and development costs, or IP R&D, in the period the acquisition was completed. We record the values of assets and liabilities based on third-party valuations and internal estimates. The values are based on our judgments and estimates and, accordingly, our financial position or results of operations may be affected by changes in these estimates and judgments.
We review and test goodwill and intangible assets with indefinite lives for impairment on at least an annual basis. We may be required to review and test for impairment more frequently if events or changes in circumstances indicate that the assets may be impaired.
Share-based Compensation
We use the fair value method to measure all share-based compensation to employees, including grants of employee stock options and other equity-based awards. This fair value is recorded as an expense in our consolidated statement of operations over the requisite service period, which is generally the vesting term of the award. Total compensation expense recognized for the fiscal years ended September 30, 2009, 2008 and 2007 was $2.9 million, $3.6 million and $4.3 million, respectively. As of September 30, 2009, total unrecognized estimated compensation expense net of forfeitures related to non-vested equity awards granted prior to that date was $4.0 million and will be amortized over a weighted average period of 2.69 years.
We value our share-based awards on the date of grant using the Black-Scholes model. The determination of the fair value of share-based payment awards on the date of grant using a pricing model is affected by our stock price as well as assumptions regarding a number of complex and subjective variables. These variables include, but are not limited to, our expected stock price volatility over the expected term of the awards, actual and projected employee equity award behaviors, risk-free interest rate and expected dividends. In the model, we use the historical volatility in our stock price for the expected volatility assumption.
41
Table of Contents
The risk-free interest rate is based on the implied yield currently available on United States Treasury zero-coupon issues with a remaining term equal to the expected term of the awards on the grant date.
Furthermore, we estimate forfeitures for equity awards granted which are not expected to vest. We calculate the pre-vesting forfeiture rate by using our historical equity grants forfeiture information.
If factors change and we employ different assumptions in future periods, the compensation expense that we record may differ significantly from what we have recorded in the current period. Therefore, we believe it is important for investors to be aware of the high degree of subjectivity involved when using pricing models to estimate share-based compensation. There is a risk that our estimates of the fair values of our share-based compensation awards on the grant dates may bear little resemblance to the actual values realized upon the exercise, expiration, early termination or forfeiture of those share-based payments in the future. Certain share-based payments may expire worthless or otherwise result in zero intrinsic value as compared to the fair values originally estimated on the grant date and reported in our consolidated financial statements. Alternatively, value may be realized from these instruments that are significantly in excess of the fair values originally estimated on the grant date and reported in our consolidated financial statements. Currently there is no market-based mechanism or other practical application to verify the reliability and accuracy of the estimates stemming from these valuation models, nor is there a means to compare and adjust the estimates to actual values. Although the fair value of employee share-based awards is determined using a pricing model, such value may not be indicative of the fair value observed in a willing buyer /willing seller market transaction.
Accounting for Income Taxes
We calculate our income taxes based on an annual effective tax rate and the income tax expense (benefit) is recognized for the amount of taxes payable or refundable for the current year, and for deferred tax assets and liabilities for the tax consequences of events that have been recognized in an entity’s financial statements or tax returns.
For financial statement purposes, we make certain estimates and judgments in determining income tax expense. These estimates and judgments occur in the calculation of tax credits, tax benefits, deductions and in the calculation of certain tax assets and liabilities, which arise from differences in the timing of recognition of revenue and expense for tax and financial statement purposes. If actual results differ from our estimates, future income tax expense could be materially affected.
We record the estimated future tax effects of temporary differences between the tax bases of assets and liabilities and amounts reported in the accompanying consolidated balance sheets. These differences resulted in net deferred tax assets of $6.1 million as of September 30, 2009. We assess the likelihood that we will be able to recover our deferred tax assets. If recovery is not more likely than not, we increase our provision for taxes by recording a valuation allowance against the deferred tax assets that we estimate will not ultimately be recoverable. We believe that substantially all of the deferred tax assets recorded on our balance sheet will ultimately be recovered. However, should there be a change in our ability to recover our deferred tax assets, our tax provision would increase in the period in which we determined that the recovery was not more likely than not.
In addition, the calculation of our tax liabilities involves dealing with uncertainties in the application of complex tax regulations. We recognize liabilities for anticipated tax audit issues in the United States and other tax jurisdictions based on our estimate of whether, and the extent to which, additional tax payments are probable. If we ultimately determine that payment of these amounts is unnecessary, we reverse the liability and recognize a tax benefit during the period in which we determine that the liability is less than we expect the ultimate assessment to be. Income tax payables and our liability for uncertain tax positions were $4.1 million and $2.8 million as of September 30, 2009 and 2008, respectively.
42
Table of Contents
Results of Operations
Comparison of the Fiscal Years Ended September 30, 2009 and 2008
Revenues
The table below sets forth the changes in revenues from fiscal year 2008 to fiscal year 2009 (in thousands, except percentage data):
| Year Ended September 30, 2009 |
Year Ended September 30, 2008 |
||||||||||||||||||
| Amount | % of Total Revenues |
Amount | % of Total Revenues |
Year-Over-Year Change |
|||||||||||||||
| Revenues: |
|||||||||||||||||||
| License |
$ | 32,217 | 67.9 | % | $ | 38,694 | 65.3 | % | $ | (6,477 | ) | (16.7 | )% | ||||||
| Maintenance |
7,078 | 14.9 | % | 8,567 | 14.4 | % | (1,489 | ) | (17.4 | )% | |||||||||
| Royalties |
8,148 | 17.2 | % | 12,069 | 20.3 | % | (3,921 | ) | (32.5 | )% | |||||||||
| Total revenues |
$ | 47,443 | 100.0 | % | $ | 59,330 | 100.0 | % | $ | (11,887 | ) | (20.0 | )% | ||||||
Revenues decreased $11.9 million, or 20%, from fiscal year 2008 to fiscal year 2009. The decrease resulted from a $6.5 million decrease in license revenue, $1.5 million decrease in maintenance revenue and a $3.9 million decrease in royalty revenue.
The following table lists the percentage of license revenues by process node for the fiscal years ended September 30, 2009 and 2008.
| Year Ended September 30, | ||||||
| 2009 | 2008 | |||||
| Total License Revenues by Process Node: |
||||||
| 45-nanometer technology |
41 | % | 24 | % | ||
| 65-nanometer technology |
29 | 38 | ||||
| 90-nanometer technology |
12 | 17 | ||||
| 0.13 micron technology |
7 | 7 | ||||
| 0.18 micron technology |
5 | 3 | ||||
| 32-nanometer technology |
2 | — | ||||
| Other |
4 | 11 | ||||
| 100 | % | 100 | % | |||
License revenues for the fiscal year ended September 30, 2009 were $32.2 million, representing a decrease of $6.5 million, or 16.7%, as compared to $38.7 million for fiscal year 2008. The decrease in license revenues in fiscal year 2009 is mainly attributable to decreases of $5.1 million on our 65-nanometer technology, $2.9 million on our 90-nanometer technology, $1.9 million on our 0.13 micron technologies and $1.9 million on our older technologies, partially offset by an increase of $5.3 million on our 45-nanometer technology. From a product perspective, 45-nanometer technology contributed sales of 41% of total license revenue in fiscal year 2009 up from 24% in fiscal year 2008. Our 65-nanometer technology declined from 38% in fiscal year 2008 to 29% in fiscal year 2009. Our 90-nanometer technology license revenue declined to 12% in fiscal year 2009 from 17% of total license revenue in fiscal year 2008. These sales were derived from all categories of our customers: integrated device manufacturers, fabless and foundry semiconductor customers.
43
Table of Contents
The following table lists the percentage of maintenance revenues by process node for the fiscal years ended September 30, 2009 and 2008.
| Year Ended September 30, | ||||||
| 2009 | 2008 | |||||
| Total Maintenance Revenues by Process Node: |
||||||
| 90-nanometer technology |
33 | % | 31 | % | ||
| 65-nanometer technology |
25 | 30 | ||||
| 45-nanometer technology |
20 | 11 | ||||
| 0.13 micron technology |
13 | 18 | ||||
| 0.18 micron technology |
6 | 6 | ||||
| 32-nanometer technology |
2 | — | ||||
| Other |
1 | 4 | ||||
| 100 | % | 100 | % | |||
Maintenance revenues for the fiscal year ended September 30, 2009 were $7.1 million, representing a decrease of $1.5 million, or 17.4%, as compared to $8.6 million for fiscal year 2008. The decrease in maintenance revenues in fiscal year 2009 is mainly attributable to decreases of $0.8 million on our 65-nanometer technology, $0.7 million on our 0.13 micron technology, $0.3 million on our 90-nanometer technology and $0.3 million on our old technologies, partially offset by an increase of $0.6 million on our 45-nanometer technology and 32-nanometer technology. From a product perspective, 90-nanometer technology contributed sales of 33% of total maintenance revenue in fiscal year 2009 up from 31% in fiscal year 2008. Our 45-nanometer technology accounted for 20% of total maintenance revenue in fiscal year 2009 up from 11% in fiscal year 2008. Our 65-nanometer technology maintenance revenue declined to 25% in fiscal year 2009 from 29% of total maintenance revenue in fiscal year 2008. These sales were derived from all categories of our customers: integrated device manufacturers, fabless and foundry semiconductor customers.
Our total license and maintenance revenues included $1.6 million from a customer that has canceled a contract with us in fiscal 2009.
Royalties for the fiscal year ended September 30, 2009 were $8.1 million, representing a decrease of $3.9 million, or 32.5%, as compared to $12.1 million for fiscal year 2008. The decrease in royalties in fiscal year 2009 is mainly attributable to decrease in foundry production as a result of the global economic downturn.
For the fiscal years ended September 30, 2009 and 2008, total revenues by geographic area were as follows (in thousands, except percentage data):
| Year Ended September 30, |
|||||||||||||
| 2009 | 2008 | Year-Over-Year Change |
|||||||||||
| Total Revenues by Geographic Area: |
|||||||||||||
| United States |
$ | 23,496 | $ | 27,611 | $ | (4,115 | ) | (15.0 | )% | ||||
| Taiwan |
7,855 | 8,854 | (999 | ) | (11.3 | )% | |||||||
| Europe, Middle East and Africa (EMEA) |
5,249 | 8,175 | (2,926 | ) | (35.8 | )% | |||||||
| Japan |
3,487 | 4,116 | (629 | ) | (15.3 | )% | |||||||
| Canada |
2,139 | 1,875 | 264 | 14.1 | % | ||||||||
| Other Asia |
5,217 | 8,699 | (3,482 | ) | (40.0 | )% | |||||||
| Total |
$ | 47,443 | $ | 59,330 | $ | (11,887 | ) | (20.0 | )% | ||||
44
Table of Contents
From a geographic perspective, the decrease in fiscal year 2009 revenues resulted in part from sales decreases in license agreements with customers using our memory systems in the United States of $4.1 million, in Other Asia of $3.5 million, and in EMEA of $2.9 million.
Cost and Expenses
The table below sets forth the changes in cost and expenses from fiscal year 2008 to fiscal year 2009 (in thousands, except percentage data):
| Year Ended September 30, 2009 |
Year Ended September 30, 2008 |
||||||||||||||||||
| Amount | % of Total Revenues |
Amount | % of Total Revenues |
Year-Over-Year Change |
|||||||||||||||
| Cost and expenses: |
|||||||||||||||||||
| Cost of revenues |
$ | 9,833 | 20.7 | % | $ | 11,106 | 18.7 | % | $ | (1,273 | ) | (11.5 | )% | ||||||
| Research and development |
29,967 | 63.2 | % | 27,725 | 46.7 | % | 2,242 | 8.1 | % | ||||||||||
| Sales and marketing |
12,815 | 27.0 | % | 14,749 | 24.9 | % | (1,934 | ) | (13.1 | )% | |||||||||
| General and administrative |
10,836 | 22.8 | % | 8,382 | 14.1 | % | 2,454 | (29.3 | )% | ||||||||||
| Goodwill impairment |
11,839 | 25.0 | % | — | — | 11,839 | NM | ||||||||||||
| Restructuring |
1,499 | 3.2 | % | 316 | 0.6 | % | 1,183 | (374.4 | )% | ||||||||||
| Total cost and expenses |
$ | 76,789 | 161.9 | % | $ | 62,278 | 105.0 | % | $ | 14,511 | 23.3 | % | |||||||
Cost of Revenues
Cost of revenues is determined by allocating costs which consist primarily of personnel expenses, allocation of facilities costs, and depreciation expense of acquired software and capital equipment associated with custom contracts and maintenance contracts. Cost of revenues in fiscal year 2009 totaled $9.8 million, representing a decrease of $1.3 million, or 11.5%, compared to $11.1 million in fiscal year 2008. The decrease in cost of revenue for fiscal 2009 compared to fiscal 2008 was mainly due to a decrease of $1.1 million in contract-related expenses due to lower license revenues and a decrease of $0.2 million in share-based compensation expense. We believe that cost of revenues will continue to fluctuate in the future, both in absolute dollars and as a percentage of revenues, based on the level and customization needs of our license revenues.
Research and Development
Research and development expense primarily includes personnel expense, software license and maintenance fees, as well as capital equipment depreciation expense. Research and development expense for the fiscal year ended September 30, 2009 was $30.0 million, representing an increase of $2.3 million, or 8.1%, from $27.7 million for the fiscal year ended September 30, 2008. Research and development expense as a percentage of total revenue for the fiscal year ended September 30, 2009 increased to 63.2% from 46.7% for fiscal year 2008. The increase in research and development expense from fiscal year 2008 to fiscal year 2009 was primarily due to an increase of $0.7 million in personnel-related expense, $0.6 million in amortization expense, $0.6 million in consulting fees, and $0.4 million other professional fees.
Sales and Marketing
Sales and marketing expense consists mainly of personnel expenses, commissions, advertising and promotion-related costs. Sales and marketing expense for the fiscal year ended September 30, 2009 was $12.8 million, representing a decrease of $1.9 million, or 13.1%, from $14.7 million for fiscal year 2008. For the fiscal year ended September 30, 2009, sales and marketing expense as a percentage of revenue was 27%, compared to 24.9% for fiscal year 2008. The decrease in sales and marketing expense in fiscal year 2009 was
45
Table of Contents
primarily due to decreases of $1.5 million in personnel expense, $0.2 million in travel and entertainment expenses, $0.1 million in recruiting expense and $0.1 million in share-based compensation expense.
General and Administrative
General and administrative expense consists primarily of personnel, corporate governance and other costs associated with the management of our business. General and administrative expense for the fiscal year ended September 30, 2009 was $10.8 million, representing an increase of $2.4 million, or 29.3%, from $8.4 million for the fiscal year ended September 30, 2008. General and administrative expense as a percentage of total revenue was 22.8% for the fiscal year ended September 30, 2009, compared to 14.1% for fiscal 2008. The increase in general and administrative expense from fiscal year 2008 to fiscal year 2009 was primarily due to an increase of $0.6 million expense in personnel-related expenses, $0.4 million in bad debt expense and $1.4 million in acquisition-related professional fees, relating to integration costs of ARC International as well as costs incurred for our acquisition of certain assets of NXP which closed in the first quarter of fiscal 2010.
Goodwill Impairment
Goodwill impairment for the fiscal year ended September 30, 2009 was $11.8 million, representing a write-off of all goodwill at that date as a result of a triggering event. The Company determined that the restructuring plan it undertook in the second quarter of fiscal year 2009 represented a triggering event to assess its goodwill for impairment. As a result of the significant negative industry and economic trends affecting current operations and expected future growth as well as the general decline of industry valuations impacting the Company’s valuation, the Company determined that goodwill that existed at that time was impaired in fiscal 2009.
Restructuring
Restructuring charges consist primarily of severance payments, severance-related benefits, lease costs associated with a vacated facility, and charges for assets written off as a result of the restructuring plan. During fiscal year 2009, we initiated a plan of restructuring in an effort to reduce operating expenses and improve operating margins and cash flows. The restructuring plan was intended to decrease costs through job eliminations. The Company reduced its workforce by 13% primarily in engineering. The restructuring plan resulted in the reduction of 60 employees and closing of its R&D centers in New Jersey and Minnesota. Costs resulting from the restructuring plan included severance payments, severance-related benefits, lease termination charges, and other professional services. Total restructuring expense was $1.5 million of which $1.2 million was paid as of September 30, 2009. No further charges are expected under this restructuring plan. We may institute other restructuring activities in the future, however, including as part of our post-closing integration activities related to the ARC and NXP transactions or in response to economic conditions.
Interest Income and Other Income (Expenses), net
The table below sets forth the changes in interest income and other income (expenses), net from fiscal year 2008 to fiscal year 2009 (in thousands, except percentage data):
| Year Ended September 30, 2009 |
Year Ended September 30, 2008 |
|||||||||||||||||||
| Amount | % of Total Revenues |
Amount | % of Total Revenues |
Year-Over-Year Change |
||||||||||||||||
| Interest income and other income (expenses), net: |
||||||||||||||||||||
| Interest income |
$ | 956 | 2.0 | % | $ | 2,913 | 4.9 | % | $ | (1,957 | ) | (67.2 | )% | |||||||
| Other income (expenses), net |
(282 | ) | (0.6 | )% | 482 | 0.8 | % | (764 | ) | (158.5 | )% | |||||||||
| Total interest income and other income (expenses), net |
$ | 674 | 1.4 | % | $ | 3,395 | 5.7 | % | $ | (2,721 | ) | (80.1 | )% | |||||||
46
Table of Contents
Interest Income
Interest income was $1.0 million and $2.9 million for the fiscal years ended September 30, 2009 and 2008, respectively. Interest income decreased from fiscal year 2008 to fiscal year 2009 largely due to lower interest rates earned in our marketable securities.
Other Income (Expenses), net
Other income (expenses), net resulted in a net other expense of $0.3 million in the fiscal year ended September 30, 2009 and net other income of $0.5 million for the fiscal year ended September 30, 2008. The net other expense in fiscal year 2009 and net other income in fiscal year 2008 were primarily due to foreign exchange gains (losses) on transactions denominated in foreign currencies.
Income Tax Provision (Benefit)
The table below sets forth the changes in income tax provision (benefit) from fiscal year 2008 to fiscal year 2009 (in thousands, except percentage data):
| Year Ended September 30, 2009 |
Year Ended September 30, 2008 |
|||||||||||||||||
| Amount | % of Total Revenues |
Amount | % of Total Revenues |
Year-Over-Year Change | ||||||||||||||
| Income tax provision (benefit) |
$ | 5,499 | 11.6 | % | $ | (107 | ) | (0.2 | )% | $ | 5,606 | NM | ||||||
For fiscal year 2009, we recorded a tax provision of $5.5 million on a pre-tax loss of $28.7 million, yielding an effective tax rate of (19.2%). For fiscal year 2008, we recorded a tax benefit of $0.1 million on a pre-tax income of $0.4 million, yielding an effective tax rate of (24%). The tax provision of $5.5 million in fiscal year 2009 was a result of establishing a valuation allowance on certain tax credits and foreign withholding taxes during the year. The change in the effective tax rate from fiscal year 2008 to fiscal year 2009 was primarily due to the establishment of the valuation allowance.
The Indian Tax Authorities completed its assessment of our tax returns for the tax years 2001 through 2007 and issued assessment orders in which the Indian Tax Authorities proposes to assess an aggregate tax deficiency for the six year period of approximately $370,000, net of deposits of $260,000 as required by the Indian Tax Authorities. Interest will continue to accrue until the matter is resolved. The Indian Tax Authorities may also make similar claims for years subsequent to 2007 in future assessments. The assessment orders are not final notices of deficiency, and we immediately filed appeals. We believe that the assessments are inconsistent with applicable tax laws and that we have meritorious defense to the assessments. We obtained a decision allowing the claims of the tax holiday for the tax years 2002 through 2006. However, there is still the possibility of further tax exposure due to the ongoing process. As of September 30, 2009, there are no accrued amounts due to these claims.
The ultimate outcome of the tax assessment cannot be predicted with certainty, including the amount payable or the timing of any such payments upon resolution of the matter. Should the Indian Tax Authorities assess additional taxes as a result of a current or a future assessment, we may be required to record charges to operations that could have an adverse effect on our consolidated statements of operations.
47
Table of Contents
Comparison of the fiscal years ended September 30, 2008 and 2007
Revenues
The table below sets forth the changes in revenues from fiscal year 2007 to fiscal year 2008 (in thousands, except percentage data):
| Year Ended September 30, 2008 |
Year Ended September 30, 2007 |
||||||||||||||||||
| Amount | % of Total Revenues |
Amount | % of Total Revenues |
Year-Over-Year Change |
|||||||||||||||
| Revenues: |
|||||||||||||||||||
| License |
$ | 38,694 | 65.3 | % | $ | 24,407 | 52.5 | % | $ | 14,287 | 58.5 | % | |||||||
| Maintenance |
8,567 | 14.4 | % | 9,972 | 21.4 | % | (1,405 | ) | (14.1 | )% | |||||||||
| Royalties |
12,069 | 20.3 | % | 12,148 | 26.1 | % | (79 | ) | (0.7 | )% | |||||||||
| Total revenues |
$ | 59,330 | 100.0 | % | $ | 46,527 | 100.0 | % | $ | 12,803 | 27.5 | % | |||||||
Revenues increased $12.8 million, or 27.5%, from fiscal year 2007 to fiscal year 2008. The increase resulted from a $14.3 million increase in license revenue, partially offset by a $1.4 million decrease in maintenance revenue and a $0.1 million decrease in royalty revenue.
The following table lists the percentage of license revenues by process node for the fiscal years ended September 30, 2008 and 2007.
| Year Ended September 30, | ||||||
| 2008 | 2007 | |||||
| Total License Revenues by Process Node: |
||||||
| 45-nanometer technology |
24 | % | 3 | % | ||
| 65-nanometer technology |
38 | 25 | ||||
| 90-nanometer technology |
17 | 34 | ||||
| 0.13 micron technology |
7 | 24 | ||||
| 0.18 micron technology |
3 | 10 | ||||
| Other |
11 | 4 | ||||
| 100 | % | 100 | % | |||
License revenues for the fiscal year ended September 30, 2008 were $38.7 million, representing an increase of $14.3 million, or 58.5%, as compared to $24.4 million for fiscal year 2007. License revenues increased in fiscal year 2008 mainly attributable to increases of $8.5 million on our 45-nanometer technology and $8.5 million on our 65-nanometer technology, partially offset by decreases of $1.8 million on our 90-nanometer technology and $0.9 million on our 0.13 micron technologies and older technologies. From a product perspective, 65-nanometer technology contributed sales of 38% of total license revenue in fiscal year 2008 up from 25% in fiscal year 2007. Our 45-nanometer technology also grew from 3% in fiscal year 2007 to 24% in fiscal year 2008. Our 90-nanometer technology license revenue declined to 17% in fiscal year 2008 from 34% of total license revenue in fiscal year 2007. These sales were derived from all categories of our customers: integrated device manufacturers, fabless and foundry semiconductor customers.
48
Table of Contents
The following table lists the percentage of maintenance revenues by process node for the fiscal years ended September 30, 2008 and 2007.
| Year Ended September 30, | ||||||
| 2008 | 2007 | |||||
| Total License Revenues by Process Node: |
||||||
| 45-nanometer technology |
11 | % | 0 | % | ||
| 65-nanometer technology |
30 | 11 | ||||
| 90-nanometer technology |
31 | 39 | ||||
| 0.13 micron technology |
18 | 38 | ||||
| 0.18 micron technology |
6 | 10 | ||||
| Other |
4 | 2 | ||||
| 100 | % | 100 | % | |||
Maintenance revenues for the fiscal year ended September 30, 2008 were $8.6 million, representing a decrease of $1.4 million, or 14.1%, as compared to $10.0 million for fiscal year 2007. Maintenance revenues decreased in fiscal year 2008 mainly due to decreases of $2.3 million on our 0.13 micron technology, $0.5 million on our 0.18 micron technology, and $1.2 million on our 90-nanometer technology, partially offset by increases of $2.6 million on our 45-nanometer technology, 65-nanometer technology and other technologies. From a product perspective, 65-nanometer technology contributed sales of 30% of total maintenance revenue in fiscal year 2008 up from 11% in fiscal year 2007. Our 45-nanometer technology accounted for 11% of total maintenance revenue in fiscal year 2008. Our 90-nanometer technology maintenance revenue declined to 31% in fiscal year 2008 from 39% of total maintenance revenue in fiscal year 2007. These sales were derived from all categories of our customers: integrated device manufacturers, fabless and foundry semiconductor customers.
Our total license and maintenance revenues included $3.5 million from a customer that has canceled a contract with us in the fourth quarter of fiscal 2008.
Royalties stayed flat from fiscal year 2007 to fiscal year 2008 due to the increase in royalties from 65-nanometer and 55-nanometer technologies offset by the decreases in royalties from older process nodes.
For the fiscal years ended September 30, 2008 and 2007, total revenues by geographic area are as follows:
| Year Ended September 30, |
Year-Over-Year Change |
||||||||||||
| 2008 | 2007 | ||||||||||||
| Total Revenues by Geographic Area: |
|||||||||||||
| United States |
$ | 27,611 | $ | 19,862 | $ | 7,749 | 39.0 | % | |||||
| Taiwan |
8,854 | 9,446 | (592 | ) | (6.3 | )% | |||||||
| Europe, Middle East and Africa (EMEA) |
8,175 | 9,200 | (1025 | ) | (11.1 | )% | |||||||
| Japan |
4,116 | 2,358 | 1,758 | 74.6 | % | ||||||||
| Canada |
1,875 | 1,492 | 383 | 25.7 | % | ||||||||
| Other Asia |
8,699 | 4,169 | 4,530 | 108.7 | % | ||||||||
| Total |
$ | 59,330 | $ | 46,527 | $ | 12,803 | 27.5 | % | |||||
From a geographic perspective, the increase in fiscal year 2008 revenues resulted from significant sales increases in license agreements with customers using our memory systems in North America of $8.1 million and in Singapore of $4.5 million.
49
Table of Contents
Cost and Expenses
The table below sets forth the changes in cost and expenses from fiscal year 2007 to fiscal year 2008 (in thousands, except percentage data):
| Year Ended September 30, 2008 |
Year Ended September 30, 2007 |
||||||||||||||||||
| Amount | % of Total Revenues |
Amount | % of Total Revenues |
Year-Over-Year Change |
|||||||||||||||
| Cost and expenses: |
|||||||||||||||||||
| Cost of revenues |
$ | 11,106 | 18.7 | % | $ | 12,938 | 27.8 | % | $ | (1,832 | ) | (14.2 | )% | ||||||
| Research and development |
27,725 | 46.7 | % | 20,346 | 43.7 | % | 7,379 | 36.3 | % | ||||||||||
| Sales and marketing |
14,749 | 24.9 | % | 15,464 | 33.2 | % | (715 | ) | (4.6 | )% | |||||||||
| General and administrative |
8,382 | 14.1 | % | 8,891 | 19.1 | % | (509 | ) | (5.7 | )% | |||||||||
| Restructuring charges |
316 | 0.6 | % | 580 | 1.2 | % | (264 | ) | (45.5 | )% | |||||||||
| Total cost and expenses |
$ | 62,278 | 105.0 | % | $ | 58,219 | 125.0 | % | $ | 4,059 | 7.0 | % | |||||||
Cost of Revenues
Cost of revenues is determined by allocating costs which consist primarily of personnel expenses, allocation of facilities costs, and depreciation expenses of acquired software and capital equipment associated with custom contracts and maintenance contracts. Cost of revenues in fiscal year 2008 totaled $11.1 million, representing a decrease of $1.8 million, or 14.2%, compared to $12.9 million in fiscal year 2007. The decreases in cost of revenue for fiscal 2008 compared to fiscal 2007 was mainly due to a decrease of $2.3 million in contract-related expenses due to improvement in engineering efficiency and a decrease of $0.1 million in share-based compensation expenses partially offset by a $0.5 million increase in deferred contract expenses associated with custom projects.
Research and Development
Research and development expense primarily includes personnel expense, software license and maintenance fees, as well as capital equipment depreciation expenses. Research and development expense for the fiscal year ended September 30, 2008 was $27.7 million, representing an increase of $7.4 million or 36.3%, from $20.3 million for the fiscal year ended September 30, 2007. Research and development expense as a percentage of total revenue for the fiscal year ended September 30, 2008 increased to 46.7% from 43.7% for fiscal year 2007. The increase in research and development expense from fiscal year 2007 to fiscal year 2008 was primarily due to an increase of $4.0 million in personnel-related expenses largely due to acquisitions, an increase of $1.3 million in consulting fees, partially offset by a decrease of $2.3 million in cost of revenues allocation and a decrease of $0.3 million in travel and entertainment expenses. In addition, research and development expense included $1.0 million of in-process research and development and amortization of intangibles in fiscal 2008 related to our acquisition of the NVM product line of Impinj in fiscal 2008 and acquisition of Ingot Systems in fiscal 2007.
Sales and Marketing
Sales and marketing expense consists mainly of personnel expenses, commissions, advertising and promotion-related costs. Sales and marketing expense for the fiscal year ended September 30, 2008 was $14.7 million, representing a decrease of $0.7 million, or 4.6%, from $15.5 million for the same period in fiscal year 2007. For the fiscal year ended September 30, 2008, sales and marketing expense as a percentage of revenue was 24.9%, compared to 33.2% for the same period in fiscal year 2007. The decrease in sales and marketing expense in fiscal year 2008 was primarily due to a decrease of $0.8 million expense in share-based compensation.
50
Table of Contents
General and Administrative
General and administrative expense consists primarily of personnel, corporate governance and other costs associated with the management of our business. General and administrative expense for the fiscal year ended September 30, 2008 was $8.4 million, representing a decrease of $0.5 million, or 5.7%, from $8.9 million for the fiscal year ended September 30, 2007. General and administrative expense as a percentage of total revenue was 14.1% for the fiscal year ended September 30, 2008, compared to 19.1% for fiscal 2007. The decrease in general and administrative expense from fiscal year 2007 to fiscal year 2008 was primarily due to a decrease of $0.9 million expense in personnel-related expenses, partially offset by an increase of $0.4 million of professional fees.
Restructuring Charges
Restructuring charges consist primarily of severance payments, severance-related benefits, lease costs associated with a vacated facility, and charges for assets written off as a result of the restructuring plan. During fiscal 2008, we initiated a plan of restructuring in an effort to reduce operating expenses and improve operating margins and cash flows. The restructuring plan was intended to decrease costs through job eliminations. During fiscal 2008, we reduced our workforce by approximately 13 employees primarily in engineering. Costs resulting from the restructuring plan included severance payments and severance-related benefits. Total restructuring expense was $316,000 of which $312,000 was paid as of September 30, 2008.
Interest Income and Other Income (Expenses), net
The table below sets forth the changes in interest income and other income (expenses), net from fiscal year 2007 to fiscal year 2008 (in thousands, except percentage data):
| Year Ended September 30, 2008 |
Year Ended September 30, 2007 |
|||||||||||||||||||
| Amount | % of Total Revenues |
Amount | % of Total Revenues |
Year-Over-Year Change |
||||||||||||||||
| Interest income and other income (expenses), net: |
||||||||||||||||||||
| Interest income |
$ | 2,913 | 4.9 | % | $ | 4,002 | 8.6 | % | $ | (1,089 | ) | 27.2 | % | |||||||
| Other income (expenses), net |
482 | 0.8 | % | (157 | ) | (0.3 | )% | 639 | NM | |||||||||||
| Total interest income and other income (expenses), net |
$ | 3,395 | 5.7 | % | $ | 3,845 | 8.3 | % | $ | (450 | ) | 11.7 | % | |||||||
Interest Income
Interest income was $2.9 million and $4.0 million for the fiscal years ended September 30, 2008 and 2007, respectively. Interest income decreased from fiscal year 2007 to fiscal year 2008 largely due to lower interest rates earned in our marketable securities.
Other Income (Expenses), net
Other income (expenses), net resulted in a net other income of $0.5 million in the fiscal year ended September 30, 2008 and net other expense of $0.2 million for the fiscal year ended September 30, 2007. The net other income in fiscal year 2008 and net other expense in fiscal year 2007 were primarily due to foreign exchange gains (losses) on transactions denominated in foreign currencies.
51
Table of Contents
Income Tax Provision (Benefit)
The table below sets forth the changes in income tax provision (benefit) from fiscal year 2007 to fiscal year 2008 (in thousands, except percentage data):
| Year Ended September 30, 2008 |
Year Ended September 30, 2007 |
|||||||||||||||||||
| Amount | % of Total Revenues |
Amount | % of Total Revenues |
Year-Over-Year Change |
||||||||||||||||
| Income tax provision (benefit) |
$ | (107 | ) | (0.2 | )% | $ | (3,242 | ) | (7.0 | )% | $ | 3,135 | 96.7 | % | ||||||
For fiscal year 2008, we recorded a tax benefit of $0.1 million on a pre-tax income of $0.4 million, yielding an effective tax rate of (24%). The tax benefit of $0.1 million in fiscal year 2008 was a result of recognizing assets for R&D credits. For fiscal year 2007, we recorded a tax benefit of $3.2 million on a pre-tax loss of $7.8 million, yielding an effective tax rate of 41%. The change in the effective tax rate from fiscal year 2007 to fiscal year 2008 was primarily due to the change in our pre-tax book income.
The Indian Tax Authorities completed its assessment of our tax returns for the tax years 2001 through 2007 and issued assessment orders in which the Indian Tax Authorities proposes to assess an aggregate tax deficiency for the six year period of approximately $370,000, net of deposits of $260,000 as required by the Indian Tax Authorities. Interest will continue to accrue until the matter is resolved. The Indian Tax Authorities may also make similar claims for years subsequent to 2007 in future assessment. The assessment orders are not final notices of deficiency, and we have immediately filed appeals. We believe that the assessments are inconsistent with applicable tax laws and that we have meritorious defense to the assessments.
The ultimate outcome of the tax assessment cannot be predicted with certainty, including the amount payable or the timing of any such payments upon resolution of the matter. Should the Indian Tax Authorities assess additional taxes as a result of a current or a future assessment, we may be required to record charges to operations that could have an adverse effect on our consolidated statements of operations.
Liquidity and Capital Resources
| September 30, 2009 |
Change from 2008 |
September 30, 2008 |
Change from 2007 |
September 30, 2007 |
||||||||||||||||
| (In thousands, except percentage data) | ||||||||||||||||||||
| Cash and cash equivalents |
$ | 22,473 | $ | 9,259 | $ | 13,214 | $ | (1,606 | ) | $ | 14,820 | |||||||||
| Short-term and long-term investments |
7,383 | (45,208 | ) | 52,591 | (7,777 | ) | 60,368 | |||||||||||||
| Total cash, cash equivalents and investments |
$ | 29,856 | $ | (35,949 | ) | $ | 65,805 | $ | (9,383 | ) | $ | 75,188 | ||||||||
| Percentage of total assets |
25.3 | % | 50.9 | % | 58.8 | % | ||||||||||||||
| Cash provided by (used in) operating activities |
$ | (7,369 | ) | $ | (8,144 | ) | $ | 775 | $ | 1,373 | $ | (598 | ) | |||||||
| Cash provided by (used in) investing activities |
16,729 | 16,265 | 464 | 7,005 | (6,541 | ) | ||||||||||||||
| Cash provided by (used in) financing activities |
259 | 2,523 | (2,264 | ) | (3,170 | ) | 906 | |||||||||||||
| Effect of exchange rates on cash |
(360 | ) | 221 | (581 | ) | (819 | ) | 238 | ||||||||||||
| Net decrease in cash and cash equivalents |
$ | 9,259 | $ | 10,865 | $ | (1,606 | ) | $ | 4,389 | $ | (5,995 | ) | ||||||||
As of September 30, 2009, cash, cash equivalents and investments were $29.9 million compared to $65.8 million as of September 30, 2008, and $75.2 million as of September 30, 2007. We had a decrease of
52
Table of Contents
$35.9 million in cash, cash equivalents and investments from fiscal year 2008 to fiscal year 2009 and a decrease of $9.4 million from fiscal year 2007 to fiscal year 2008. In fiscal years 2009, 2008 and 2007, operations were funded primarily from cash collections from customers for accounts receivable.
Net cash provided by (used in) operating activities was $(7.4) million, $0.8 million and $(0.6) million for the fiscal years 2009, 2008 and 2007, respectively. Net cash used by operating activities was $7.4 million for the fiscal year ended September 30, 2009 representing a decrease of $8.1 million over net cash provided by operating activities of $0.8 million for the fiscal year ended September 30, 2008. The decrease in cash from operating activities was primarily attributable to decreases in net income of $34.7 million. This decrease was offset by an increase in changes of operating assets and liabilities of $6.4 million, increases of $11.8 million of goodwill impairment, $7.9 million of change in deferred income taxes and $0.7 million of amortization of intangible assets.
Net cash provided by operating activities was $0.8 million for the fiscal year ended September 30, 2008 representing an increase of $1.4 million over net cash used in operating activities of $0.6 million for the fiscal year ended September 30, 2007. The increase in cash provided by operating activities was primarily attributable to changes in net income of $5.2 million and favorable changes in deferred tax of $3.1 million. This increase was offset by a decrease in changes of operating assets and liabilities of $6.0 million. In addition, we had decreases of $0.8 million of share-based compensation expense, $0.6 million of depreciation expense and $0.3 million in excess tax benefit, offset by increases of $0.5 million of amortization expense, $0.1 million of write-off of acquired in-process technology and $0.2 million of bad debt recovery.
Net cash provided by (used in) investing activities was $16.7 million, $0.5 million and $(6.5) million for the fiscal years 2009, 2008 and 2007, respectively. Net cash provided by investing activities was $16.7 million for the fiscal year ended September 30, 2009 representing an increase of $16.3 million over net cash provided by investing activities of $0.5 million for the fiscal year ended September 30, 2008. The increase of $16.3 million in cash resulted from a decrease of $60.1 million in purchase of investments, offset by a decrease of $22.1 million decrease in net proceeds from sales and maturities of investments, an increase of $19.9 million in net cash paid for business combinations and an increase of $1.8 million in purchase of property and equipment.
Net cash provided by investing activities was $0.5 million for the fiscal year ended September 30, 2008 representing an increase of $7.0 million over net cash used in investing activities of $6.5 million for the fiscal year ended September 30, 2007. The increase of $7.0 million in cash resulted from an increase of $10.7 million in net proceeds from maturities of investments and purchase of investments, offset by $2.7 million increase in net cash paid for business acquisitions and $1.0 million used in the purchase of other property and equipment.
Net cash provided by (used in) financing activities was $0.3 million, $(2.3) million and $0.9 million for the fiscal years 2009, 2008 and 2007, respectively. Net cash provided by financing activities in fiscal 2009 reflects $0.7 million provided by sale-leaseback transactions, $0.1 million of proceeds from issuance of common stock and a $0.1 million excess tax benefit from share-based compensation, offset by $0.6 million used for stock repurchase.
Net cash used in financing activities in fiscal 2008 reflects $4.6 million used in the repurchase of common stock, partially offset by $2.0 million of proceeds from issuance of common stock and a $0.3 million excess tax benefit from share-based compensation. Fiscal 2007 and fiscal 2006 net cash provided by financing activities reflect proceeds from the issuance of common stock of $0.9 million and $2.8 million, respectively. The issuance of common stock was associated with our employee stock option and employee stock purchase plans during the respective periods.
We have no off-balance-sheet financing arrangements other than operating leases and purchase obligations.
Our future capital requirements will depend on many factors, including the rate of sales growth, market acceptance of our existing and new technologies, the amount and timing of research and development
53
Table of Contents
expenditures, the timing of the introduction of new technologies, costs of integration and product development related to the ARC and NXP transactions, expansion of sales and marketing efforts, potential acquisitions, and level of working capital, primarily accounts receivable. There can be no assurance that additional equity or debt financing, if required, will be available on satisfactory terms. We believe that our current capital resources and cash generated from operations will be sufficient to meet our needs for at least the next twelve months, although we may seek to raise additional capital during that period and there can be no assurance that we will not require additional financing beyond this time frame.
The following table summarizes our contractual obligations as of September 30, 2009 (in thousands):
| Contractual Obligations |
Total | Less than 1 Year |
1-3 Years |
4-5 Years |
After 5 Years | ||||||||||
| Operating lease obligations(1) |
$ | 7,585 | $ | 2,560 | $ | 2,531 | $ | 1,305 | $ | 1,189 | |||||
| Capital lease obligations |
189 | 131 | 58 | — | — | ||||||||||
| Purchase obligations(2) |
12,661 | 8,049 | 3,244 | 1,250 | 118 | ||||||||||
| Total operating lease and purchase obligations |
$ | 20,435 | $ | 10,740 | $ | 5,833 | $ | 2,555 | $ | 1,307 | |||||
| (1) | Includes sale-leaseback transactions of computer equipment, which were executed during the quarter ended June 30, 2009. No material gain or loss resulted from these transactions. |
| (2) | Reflects amounts payable under contracts primarily for product development software licenses, maintenance and payments due under other technology licensing agreements. |
Recent Accounting Pronouncements
Revenue Arrangements with Multiple Deliverables: In October of 2009, new standards were issued to update the accounting and reporting requirements for revenue arrangements with multiple deliverables. These standards established a selling price hierarchy, which allows the use of an estimated selling price to determine the selling price of a deliverable in cases where neither vendor-specific objective evidence nor third-party evidence is available. These standards are to be applied prospectively for revenue arrangements entered into or materially modified in fiscal years beginning on or after June 15, 2010 and we are required to adopt these standards in our first quarter of 2011. Early adoption is permitted, and if this update is adopted early in other than the first quarter of an entity’s fiscal year, then it must be applied retrospectively to the beginning of that fiscal year. We are currently assessing the impact of the adoption on our consolidated financial statements.
Certain Revenue Arrangements that Include Software Elements: In October of 2009, new standards were issued that amend which revenue allocation and measurement standard should be used for arrangements that contain both tangible products and software. More specifically, if the software sold with or embedded within the tangible product is essential to the functionality of the tangible product, then this software as well as undelivered software elements that relate to this software are excluded from the scope of existing software revenue guidance. These standards are to be applied prospectively for revenue arrangements entered into or materially modified in fiscal years beginning on or after June 15, 2010 and we are required to adopt these standards in our first quarter of 2011. Early adoption is permitted, and if this update is adopted early in other than the first quarter of an entity’s fiscal year, then it must be applied retrospectively to the beginning of that fiscal year. We are currently assessing the impact of the adoption on our consolidated financial statements.
Earnings per Share: In June 2008, new standards were issued which concluded that unvested awards of share-based payments with non forfeitable rights to receive dividends or dividend equivalents, such as our restricted stock units (RSUs), are considered to be participating securities and the two-class method should be used for purposes of calculating earnings per share (EPS). Under the two-class method, a portion of net income is allocated to these participating securities and therefore is excluded from the calculation of EPS allocated to common stock. The standards are effective for financial statements issued for the fiscal years and interim periods beginning after December 15, 2008 and require retrospective adjustment to earnings per share data. We are
54
Table of Contents
required to adopt the standards in our first quarter of fiscal 2010 and are currently evaluating the impact of the adoption on our consolidated financial statements.
Intangibles: In April 2008, new standards were issued for the determination of useful life of intangibles and amend the factors that should be considered in developing renewal or extension assumptions used to determine the useful life of a recognized intangible asset and require enhanced related disclosures. The standards must be applied prospectively to all intangible assets acquired as of and subsequent to fiscal years beginning after December 15, 2008 and we are required to adopt the pronouncement in our first quarter of fiscal 2010. We are currently evaluating the impact, if any, that the standards will have on our consolidated financial statements.
Business Combinations: These revised standards for business combinations generally require an entity to recognize the assets acquired, liabilities assumed, contingencies, and contingent consideration at their fair value on the acquisition date. In circumstances where the acquisition-date fair value for a contingency cannot be determined during the measurement period and it is concluded that it is probable that an asset or liability exists as of the acquisition date and the amount can be reasonably estimated, a contingency is recognized as of the acquisition date based on the estimated amount. It further requires that acquisition-related costs be recognized separately from the acquisition and expensed as incurred, restructuring costs generally be expensed in periods subsequent to the acquisition date, and changes in accounting for deferred tax asset valuation allowances and acquired income tax uncertainties after the measurement period impact income tax expense. In addition, acquired in-process research and development is capitalized as an intangible asset and amortized over its estimated useful life. These new standards are applicable to business combinations on a prospective basis beginning in our first quarter of 2010. The effect of adoption of these revised standards on the Company’s financial condition or operating results will depend on the nature of acquisitions completed after the date of adoption.
Noncontrolling Interests: In December 2007, new standards were issued which required the recognition of a non-controlling interest (formerly minority interest) as equity in the consolidated financial statements separate from the parent’s equity. The amount of net income attributable to the non-controlling interest will be included in consolidated net income on the face of the income statement. These new standards clarified that changes in a parent’s ownership interest in a subsidiary that do not result in deconsolidation are equity transactions if the parent retains its controlling financial interest. In addition, these standards required that a parent recognize a gain or loss in net income when a subsidiary is deconsolidated. Such gain or loss will be measured using the fair value of the non-controlling equity investment on the deconsolidation date. It also included expanded disclosure requirements regarding the interests of the parent and its non-controlling interest. These standards are effective for the fiscal year beginning in our first quarter of 2010 and the presentation and disclosure requirements must be applied retrospectively for all periods presented at that date. We are currently evaluating the impact that these standards will have on our financial statements.
55
Table of Contents
Quarterly Results of Operations
The following tables contain unaudited consolidated statements of operations data for our eight most recent fiscal quarters. The first table contains revenue and expense data expressed in dollars, while the second table contains the same data expressed as a percentage of our revenues for the periods indicated. This data has been derived from unaudited consolidated financial statements that, in our opinion, include all adjustments necessary, consisting of only normal recurring adjustments, for a fair statement of the information. Our quarterly results have been in the past, and in the future may be, subject to fluctuations. As a result, we believe that results of operations for the interim periods may not be an accurate indicator of results for any future period.
| Quarter Ended | ||||||||||||||||||||||||||||||||
| Sept. 30, 2009 |
June 30, 2009 |
March 31, 2009 |
Dec. 31, 2008 |
Sept. 30, 2008 |
June 30, 2008 |
March 31, 2008 |
Dec. 31, 2007 |
|||||||||||||||||||||||||
| (Unaudited) | ||||||||||||||||||||||||||||||||
| (In thousands, except per share data) | ||||||||||||||||||||||||||||||||
| Consolidated Statements of Operations Data: |
||||||||||||||||||||||||||||||||
| Revenues |
$ | 13,148 | $ | 11,921 | $ | 11,025 | $ | 11,349 | $ | 15,513 | $ | 15,068 | $ | 14,689 | $ | 14,060 | ||||||||||||||||
| Cost and expenses: |
||||||||||||||||||||||||||||||||
| Cost of revenues |
2,334 | 2,529 | 2,401 | 2,569 | 2,924 | 2,614 | 3,121 | 2,447 | ||||||||||||||||||||||||
| Research and development |
7,721 | 6,527 | 6,700 | 9,019 | 7,677 | 8,015 | 6,175 | 5,858 | ||||||||||||||||||||||||
| Sales and marketing |
4,820 | 2,574 | 2,754 | 2,667 | 3,634 | 3,658 | 3,864 | 3,593 | ||||||||||||||||||||||||
| General and administrative |
3,980 | 2,090 | 2,645 | 2,121 | 2,336 | 2,160 | 2,111 | 1,775 | ||||||||||||||||||||||||
| Goodwill impairment |
— | — | 11,839 | — | — | — | — | — | ||||||||||||||||||||||||
| Restructuring |
4 | 22 | 1,473 | — | — | 319 | — | (3 | ) | |||||||||||||||||||||||
| Total cost and expenses |
18,859 | 13,742 | 27,812 | 16,376 | 16,571 | 16,766 | 15,271 | 13,670 | ||||||||||||||||||||||||
| Operating income (loss) |
(5,711 | ) | (1,821 | ) | (16,787 | ) | (5,027 | ) | (1,058 | ) | (1,698 | ) | (582 | ) | 390 | |||||||||||||||||
| Interest income |
142 | 167 | 259 | 388 | 512 | 595 | 840 | 966 | ||||||||||||||||||||||||
| Other income (expenses), net |
(158 | ) | (239 | ) | (145 | ) | 260 | 243 | 111 | (73 | ) | 201 | ||||||||||||||||||||
| Income (loss) before taxes |
(5,727 | ) | (1,893 | ) | (16,673 | ) | (4,379 | ) | (303 | ) | (992 | ) | 185 | 1,557 | ||||||||||||||||||
| Minority interest in loss of consolidated subsidiaries |
47 | — | — | — | — | — | — | — | ||||||||||||||||||||||||
| Income tax provision (benefit) |
(2,436 | ) | 29 | 9,674 | (1,768 | ) | (256 | ) | 131 | (447 | ) | 465 | ||||||||||||||||||||
| Net income (loss) |
$ | (3,244 | ) | $ | (1,922 | ) | $ | (26,347 | ) | $ | (2,611 | ) | $ | (47 | ) | $ | (1,123 | ) | $ | 632 | $ | 1,092 | ||||||||||
| Basic net income (loss) per share |
$ | (0.14 | ) | $ | (0.08 | ) | $ | (1.15 | ) | $ | (0.11 | ) | $ | (0.00 | ) | $ | (0.05 | ) | $ | 0.03 | $ | 0.05 | ||||||||||
| Diluted net income (loss) per share |
$ | (0.14 | ) | $ | (0.08 | ) | $ | (1.15 | ) | $ | (0.11 | ) | $ | (0.00 | ) | $ | (0.05 | ) | $ | 0.03 | $ | 0.05 | ||||||||||
| As a Percentage of Revenues: |
||||||||||||||||||||||||||||||||
| Revenues |
100.0 | % | 100.0 | % | 100.0 | % | 100.0 | % | 100.0 | % | 100.0 | % | 100.0 | % | 100.0 | % | ||||||||||||||||
| Cost and expenses: |
||||||||||||||||||||||||||||||||
| Cost of revenues |
17.8 | 21.2 | 21.8 | 22.6 | 18.8 | 17.4 | 21.2 | 17.4 | ||||||||||||||||||||||||
| Research and development |
58.7 | 54.8 | 60.8 | 79.5 | 49.5 | 53.2 | 42.0 | 41.7 | ||||||||||||||||||||||||
| Sales and marketing |
36.7 | 21.6 | 25.0 | 23.5 | 23.4 | 24.3 | 26.3 | 25.6 | ||||||||||||||||||||||||
| General and administrative |
30.3 | 17.5 | 24.0 | 18.7 | 15.1 | 14.3 | 14.4 | 12.6 | ||||||||||||||||||||||||
| Goodwill impairment |
— | — | 107.4 | — | — | — | — | — | ||||||||||||||||||||||||
| Restructuring |
— | 0.2 | 13.3 | — | — | 2.1 | — | — | ||||||||||||||||||||||||
| Total cost and expenses |
143.5 | 115.3 | 252.3 | 144.3 | 106.8 | 111.3 | 103.9 | 97.3 | ||||||||||||||||||||||||
| Operating income (loss) |
(43.5 | ) | (15.3 | ) | (152.3 | ) | (44.3 | ) | (6.8 | ) | (11.3 | ) | (3.9 | ) | 2.7 | |||||||||||||||||
| Interest income |
1.1 | 1.4 | 2.3 | 3.4 | 3.3 | 3.9 | 5.7 | 6.9 | ||||||||||||||||||||||||
| Other income (expenses), net |
(1.2 | ) | (2.0 | ) | (1.3 | ) | 2.3 | 1.6 | 0.7 | (0.5 | ) | 1.4 | ||||||||||||||||||||
| Income (loss) before taxes |
(43.6 | ) | (15.9 | ) | (151.3 | ) | (38.6 | ) | (1.9 | ) | (6.7 | ) | 1.3 | 11.0 | ||||||||||||||||||
| Minority interest in loss of consolidated subsidiaries |
0.4 | — | — | — | — | — | — | — | ||||||||||||||||||||||||
| Income tax provision (benefit) |
(18.5 | ) | 0.2 | 87.7 | (15.6 | ) | (1.7 | ) | 0.9 | (3.0 | ) | 3.3 | ||||||||||||||||||||
| Net income (loss) |
(24.7 | )% | (16.1 | )% | (239.0 | )% | (23.0 | )% | (0.2 | )% | (7.6 | )% | 4.3 | % | 7.7 | % | ||||||||||||||||
56
Table of Contents
Item 7A. Quantitative and Qualitative Disclosures about Market Risk
Our core business, the sale of semiconductor IP for the design and manufacture of system-on-a-chip integrated circuits, has exposure to financial market risks, including changes in foreign currency exchange rates and interest rates. A significant portion of our customers are located in Asia, Canada and Europe. However, to date, our exposure to foreign currency exchange fluctuations has been minimal because all of our license agreements provide for payment in U.S. dollars.
Our international business is subject to risks typical of an international business, including, but not limited to, differing economic conditions, changes in political climate, differing tax environments, other regulations and restrictions and foreign exchange rate volatility. Our foreign subsidiaries incur most of their expenses in the local currency. To date these expenses have not been significant, therefore, we do not anticipate our future results to be materially adversely impacted by changes in factors affecting international operations.
We are exposed to the impact of interest rate changes and changes in the market values of our investments. We maintain an investment portfolio of various issuers, types and maturities. These securities are classified as available-for-sale and, consequently, are recorded on the balance sheet at fair value with unrealized gains or losses reported as a separate component of stockholders’ equity. Our investments primarily consist of short-term money market mutual funds, government-sponsored enterprise bonds, corporate bonds, and commercial paper. We hold no auction-rate securities. Our short-term investments balance of $7.4 million at September 30, 2009 consisted of instruments with original maturities of less than one year. The estimated fair value of our investment portfolio as of September 30, 2009, assuming a 100 basis point increase in market interest rates, would decrease by approximately $20,000, which would not materially affect our operations. We have the ability to generally hold our fixed income investments until maturity and therefore we would not expect our operating results or cash flows to be affected to any significant degree by the effect of a sudden change in market interest rates on our securities portfolio. If necessary, we may sell short-term investments prior to maturity to meet our liquidity needs.
The table below presents the carrying values and related weighted average interest rates for our cash, cash equivalents and investments. The carrying values approximate fair values as of September 30, 2009 and 2008.
| Cash, Cash Equivalents and Investments: |
Carrying Value at September 30, 2009 |
Annualized Rate of Return at September 30, 2009 |
Carrying Value at September 30, 2008 |
Annualized Rate of Return at September 30, 2008 |
||||||||
| (In thousands) | (Annualized) | (In thousands) | (Annualized) | |||||||||
| Cash and cash equivalents—fixed rate |
$ | 22,473 | 0.0 | % | $ | 13,214 | 1.1 | % | ||||
| Investments—fixed rate |
7,383 | 1.0 | % | 52,591 | 3.1 | % | ||||||
| Total cash, cash equivalents and investments |
$ | 29,856 | $ | 65,805 | ||||||||
Item 8. Financial Statements and Supplementary Data
The Consolidated Financial Statements required by this Item are set forth on the pages indicated at Item 15(a). The unaudited quarterly results of our operations for our two most recent fiscal years are incorporated herein by reference under Item 7 “Selected Consolidated Financial Data.”
Item 9. Changes in and Disagreements with Accountants on Accounting and Financial Disclosure
None.
57
Table of Contents
Item 9A. Controls and Procedures
We conducted an evaluation required by Rule 13a-15 of the Securities Exchange Act of 1934, as amended (the Exchange Act), under the supervision and with the participation of our management, including the Chief Executive Officer and Chief Financial Officer, of the effectiveness of the design and operation of our disclosure controls and procedures (as defined in Rules 13a-15(e) and 15d-15(e) under the Exchange Act, as of September 30, 2009.
Based on our evaluation as of September 30, 2009, our Chief Executive Officer and Chief Financial Officer concluded that our disclosure controls and procedures were effective to ensure that the information required to be disclosed by us in our reports filed or submitted under the Exchange Act is recorded, processed, summarized and reported within the time periods specified in the Securities and Exchange Commission’s rules and forms and is accumulated and communicated to our management, including the Chief Executive Officer and Chief Financial Officer, as appropriate to allow timely decisions regarding required disclosure.
Management’s Report on Internal Control over Financial Reporting
Management is responsible for establishing and maintaining adequate internal control over financial reporting, as defined in Rule 13a-15(f) of the Exchange Act. Management has assessed the effectiveness of our internal control over financial reporting as of September 30, 2009 based on criteria established in Internal Control—Integrated Framework issued by the Committee of Sponsoring Organizations of the Treadway Commission. As a result of this assessment, management concluded that, as of September 30, 2009, our internal control over financial reporting was effective in providing reasonable assurance regarding the reliability of financial reporting and the preparation of financial statements for external purposes in accordance with generally accepted accounting principles.
Changes in Internal Control over Financial Reporting
There were no changes in our internal control over financial reporting during the fiscal quarter ended September 30, 2009 that materially affected, or are reasonably likely to materially affect, our internal control over financial reporting.
Limitations on Controls
Management does not expect that our disclosure controls and procedures or our internal control over financial reporting will prevent or detect all error and fraud. Any control system, no matter how well designed and operated, is based upon certain assumptions and can provide only reasonable, not absolute, assurance that its objectives will be met. Furthermore, no evaluation of controls can provide absolute assurance that misstatements due to error or fraud will not occur or that all control issues and instances of fraud, if any, within the Company have been detected.
The effectiveness of our internal control over financial reporting as of September 30, 2009, was audited by our independent registered public accounting firm, Burr, Pilger & Mayer LLP, as stated in its report, which is included below.
58
Table of Contents
REPORT OF INDEPENDENT REGISTERED PUBLIC ACCOUNTING FIRM ON INTERNAL
CONTROL OVER FINANCIAL REPORTING
To the Board of Directors and Stockholders
of Virage Logic Corporation
We have audited the internal control over financial reporting of Virage Logic Corporation and its subsidiaries (the “Company”) as of September 30, 2009, based on criteria established in Internal Control—Integrated Framework issued by the Committee of Sponsoring Organizations of the Treadway Commission (COSO). The Company’s management is responsible for maintaining effective internal control over financial reporting and for its assessment of the effectiveness of internal control over financial reporting, included in the accompanying Management’s Report on Internal Control over Financial Reporting. Our responsibility is to express an opinion on the effectiveness of the Company’s internal control over financial reporting based on our audit.
We conducted our audit of internal control over financial reporting in accordance with the standards of the Public Company Accounting Oversight Board (United States). Those standards require that we plan and perform the audit to obtain reasonable assurance about whether effective internal control over financial reporting was maintained in all material respects. Our audit included obtaining an understanding of internal control over financial reporting, assessing the risk that a material weakness exists, testing and evaluating the design and operating effectiveness of internal control based on the assessed risk, and performing such other procedures as we considered necessary in the circumstances. We believe that our audit provides a reasonable basis for our opinion.
A company’s internal control over financial reporting is a process designed to provide reasonable assurance regarding the reliability of financial reporting and the preparation of financial statements for external purposes in accordance with generally accepted accounting principles. A company’s internal control over financial reporting includes those policies and procedures that (1) pertain to the maintenance of records that, in reasonable detail, accurately and fairly reflect the transactions and dispositions of the assets of the company; (2) provide reasonable assurance that transactions are recorded as necessary to permit preparation of financial statements in accordance with generally accepted accounting principles, and that receipts and expenditures of the company are being made only in accordance with authorizations of management and directors of the company; and (3) provide reasonable assurance regarding prevention or timely detection of unauthorized acquisition, use, or disposition of the company’s assets that could have a material effect on the financial statements.
Because of its inherent limitations, internal control over financial reporting may not prevent or detect misstatements. Also, projections of any evaluation of effectiveness to future periods are subject to the risk that controls may become inadequate because of changes in conditions, or that the degree of compliance with the policies or procedures may deteriorate.
In our opinion, the Company maintained, in all material respects, effective internal control over financial reporting as of September 30, 2009, based on the COSO criteria.
We also have audited, in accordance with the standards of the Public Company Accounting Oversight Board (United States), the consolidated balance sheets of Virage Logic Corporation and its subsidiaries as of September 30, 2009 and 2008, and the related consolidated statements of operations, stockholders’ equity, and cash flows for each of the three years in the period ended September 30, 2009, and the related financial statement schedule and our report dated December 14, 2009 expressed an unqualified opinion on those consolidated financial statements and the related financial statement schedule.
/s/ Burr, Pilger & Mayer LLP
San Jose, California
December 14, 2009
59
Table of Contents
Item 10. Directors, Executive Officers and Corporate Governance
The information required by this item concerning our directors and nominees is incorporated by reference to our definitive Proxy Statement for our 2010 Annual Meeting of Stockholders (the “2010 Proxy Statement”) under the caption “Election of Directors.” Information on our nominating committee process, and on our audit committee members including our audit committee financial experts is incorporated by reference to the headings “Governance Committee” and “Audit Committee” in our 2010 Proxy statement. Information regarding Section 16(a) beneficial ownership reporting compliance is incorporated by reference to the material under the heading “Security Ownership of Certain Beneficial Owners and Management” in our 2010 Proxy Statement. Information relating to our executive officers is contained in Part I of this annual report under the caption “Executive Officers”.
Our Board of Directors has adopted a Code of Ethics applicable to our directors and all of our officers and employees. The Code of Ethics is available, free of charge, through the investor relations section of our website at http://investors.viragelogic.com/governance.cfm. We intend to disclose any amendment to, or waiver from, the Code of Ethics by posting such amendment or waiver, as applicable, on our website.
Item 11. Executive Compensation
The information required by this item is incorporated by reference to the 2010 Proxy Statement under the captions “Executive Compensation” and “Director Compensation.”
Item 12. Security Ownership of Certain Beneficial Owners and Management and Related Stockholder Matters
The information required by this item is incorporated by reference to the 2010 Proxy Statement under the captions “Security Ownership of Certain Beneficial Owners and Management” and “Equity Compensation Plan Information.”
Item 13. Certain Relationships and Related Transactions and Director Independence
The information required by this item is incorporated by reference to the 2010 Proxy Statement under the captions “Management and Certain Security Holders of Virage Logic—Certain Transactions” and “Director Independence.”
Item 14. Principal Accountant Fees and Services
The information required by this item is incorporated by reference to the 2010 Proxy Statement under the caption “Information Regarding Our Independent Registered Public Accounting Firm.”
60
Table of Contents
Item 15. Exhibits and Financial Statement Schedules
The following documents are being filed as part of this report on Form 10-K:
(a) Index to Consolidated Financial Statements:
| Page | ||
| (1) Report of Burr, Pilger & Mayer LLP, Independent Registered Public Accounting Firm |
64 | |
| (2) Consolidated Balance Sheets |
65 | |
| (3) Consolidated Statements of Operations |
66 | |
| (4) Consolidated Statements of Stockholders’ Equity |
67 | |
| (5) Consolidated Statements of Cash Flows |
68 | |
| (6) Notes to Consolidated Financial Statements |
69 | |
| (b) Index to Financial Statement Schedules: |
||
| (1) Schedule II Valuation and Qualifying Accounts |
100 | |
Schedules, other than those listed above, have been omitted since they are not required, or the information is included elsewhere herein.
(c) Exhibits:
| Exhibit Number |
Description of Document | |
| 3.1 | Amended and Restated Certificate of Incorporation(1) | |
| 3.2 | Amended and Restated Bylaws(2) | |
| 4.1 | Specimen Common Stock Certificate(3) | |
| 10.1 | 1997 Equity Incentive Plan, as amended(4)* | |
| 10.2 | Form of Option Agreement under 1997 Equity Incentive Plan(5)* | |
| 10.3 | 2000 Employee Stock Purchase Plan, as amended(6)* | |
| 10.4 | 2001 Foreign Subsidiary Employee Stock Purchase Plan(6)* | |
| 10.6 | Development and Licensing Agreement between Taiwan Semiconductor Manufacturing Co. Ltd. and Virage Logic dated as of March 3, 1999(3)# | |
| 10.7 | Memory Compiler Licensing Agreement between United Microelectronics Corporation and Virage Logic dated as of March 21, 2000(3)# | |
| 10.8 | Office Lease between Roshan Polymers Limited and Virage Logic International dated August 1, 2001(7) | |
| 10.9 | Virage Logic Corporation 2002 Equity Incentive Plan, as amended(8)* | |
| 10.10 | Form of Notice of Grant of Stock Options under the Virage Logic Corporation 2002 Equity Incentive Plan(9)* | |
| 10.11 | Form of Notice of Grant of Stock-Settled Appreciation Rights under the Virage Logic Corporation 2002 Equity Incentive Plan(8)* | |
| 10.12 | Form of Notice of Grant of Restricted Stock Units under the Virage Logic Corporation 2002 Equity Incentive Plan(8)* | |
61
Table of Contents
| Exhibit Number |
Description of Document | |
| 10.13 | Amended and Restated In-Chip Systems, Inc. 2001 Incentive And Non-Statutory Stock Option Plan(10)* | |
| 10.14 | Master License Agreement, dated June 8, 2001 and Exhibit No. 2 dated April 1, 2002 between Virage Logic Corporation and STMicroelectronics S.A.(10)# | |
| 10.15 | Real Estate Purchase-Sale Agreement between Nikolay Khachaturov and Virage Logic Corporation dated October 2, 2002 (English translation)(11) | |
| 10.21 | Virage Logic Corporation 2009 Executive MBO Plan(12)* | |
| 10.22 | Virage Logic Corporation 2010 Executive MBO Plan* | |
| 10.23 | Asset Purchase Agreement dated October 9, 2009 between NXP B. V. and Virage Logic Corporation(13) | |
| 10.24 | Intellectual Property Transfer and License Agreement between NXP B. V. and Virage Logic Corporation(13) | |
| 10.25 | Technology Services Agreement between Virage Logic Corporation and NXP B. V.(13) | |
| 10.26 | Master License Agreement between Virage Logic Corporation and NXP B. V.(13) | |
| 10.27 | Loan and Security Agreement, dated as of December 1, 2009 between Silicon Valley Bank and Virage Logic Corporation(14) | |
| 21.1 | Subsidiaries of Registrant | |
| 23.1 | Consent of Burr, Pilger & Mayer LLP, Independent Registered Public Accounting Firm | |
| 31.1 | Certification Pursuant to Rule 13(a)-14(a) of the Securities Exchange Act of 1934, as amended, as pursuant to Section 302 of the Sarbanes-Oxley Act of 2002 | |
| 31.2 | Certification Pursuant to Rule 13(a)-14(a) of the Securities Exchange Act of 1934, as amended, as pursuant to Section 302 of the Sarbanes-Oxley Act of 2002 | |
| 32.1 | Certification Pursuant to 18 U.S.C. Section 1350, as adopted pursuant to Section 906 of the Sarbanes-Oxley Act of 2002 | |
| 32.2 | Certification Pursuant to 18 U.S.C. Section 1350, as adopted pursuant to Section 906 of the Sarbanes-Oxley Act of 2002 | |
| (1) | Incorporated by reference to Virage Logic’s Annual Report on Form 10-K for the fiscal year ended September 30, 2007. |
| (2) | Incorporated by reference to Virage Logic’s Current Report on Form 10-K filed March 13, 2008. |
| (3) | Incorporated by reference to Virage Logic’s Registration Statement on Form S-1, as amended (File No. 333-36108). |
| (4) | Incorporated by reference to Virage Logic’s Quarterly Report on Form 10-Q for the quarter ended March 31, 2001. |
| (5) | Incorporated by reference Appendix B of Virage Logic’s Proxy Statement filed on January 13, 2005. |
| (6) | Incorporated by reference to Virage Logic’s Quarterly Report on Form 10-Q for the quarter ended June 30, 2001. |
| (7) | Incorporated by reference to Virage Logic’s Annual Report on Form 10-K for the fiscal year ended September 30, 2001. |
| (8) | Incorporated by reference to Virage Logic’s Registration Statement on Form S-8 filed May 29, 2008. |
| (9) | Incorporated by reference to Virage Logic’s Quarterly Report on Form 10-Q for the quarter ended December 31, 2001. |
62
Table of Contents
| (10) | Incorporated by reference to Virage Logic’s Quarterly Report on Form 10-Q for the quarter ended June 30, 2002. |
| (11) | Incorporated by reference to Virage Logic’s Annual Report on Form 10-K for the fiscal year ended September 30, 2002. |
| (12) | Incorporated by reference to Virage Logic’s Annual Report on Form 10-K for the year ended September 30, 2008. |
| (13) | Incorporated by reference to Virage Logic’s Current Report on Form 8-K filed on November 9, 2009. |
| (14) | Incorporated by reference to Virage Logic’s Current Report on Form 8-K filed on December 7, 2009. |
| # | Confidential treatment has been granted with respect to portions of the exhibit. A complete copy of the agreement, including the redacted terms, has been separately filed with the Securities and Exchange Commission. |
| * | Management contract or compensatory plan or arrangement. |
63
Table of Contents
REPORT OF INDEPENDENT REGISTERED PUBLIC ACCOUNTING FIRM
To the Board of Directors and Stockholders
of Virage Logic Corporation
We have audited the accompanying consolidated balance sheets of Virage Logic Corporation and its subsidiaries (the “Company”) as of September 30, 2009 and 2008 and the related consolidated statements of operations, stockholders’ equity, and cash flows for each of the three years in the period ended September 30, 2009. Our audits also included the financial statement schedule listed in the Index to this Annual Report on Form 10-K at Part IV Item 15(b)(1). These consolidated financial statements and the financial statement schedule are the responsibility of the Company’s management. Our responsibility is to express an opinion on these consolidated financial statements and financial statement schedule based on our audits.
We conducted our audits in accordance with the standards of the Public Company Accounting Oversight Board (United States). Those standards require that we plan and perform the audit to obtain reasonable assurance about whether the financial statements are free of material misstatement. An audit includes examining, on a test basis, evidence supporting the amounts and disclosures in the financial statements. An audit also includes assessing the accounting principles used and significant estimates made by management, as well as evaluating the overall financial statement presentation. We believe that our audits provide a reasonable basis for our opinion.
In our opinion, the consolidated financial statements referred to above present fairly, in all material respects, the financial position of Virage Logic Corporation and its subsidiaries as of September 30, 2009 and 2008 and the results of their operations and their cash flows for each of the three years in the period ended September 30, 2009 in conformity with accounting principles generally accepted in the United States of America. Also, in our opinion, the related financial statement schedule, when considered in relation to the consolidated financial statements taken as a whole, presents fairly, in all material respects, the information set forth therein.
We have also audited, in accordance with the standards of the Public Company Accounting Oversight Board (United States), the effectiveness of the Company’s internal control over financial reporting as of September 30, 2009, based on the criteria established in Internal Control—Integrated Framework issued by the Committee of Sponsoring Organizations of the Treadway Commission and our report dated December 14, 2009 expressed an unqualified opinion thereon.
/s/ Burr, Pilger & Mayer LLP
San Jose, California
December 14, 2009
64
Table of Contents
VIRAGE LOGIC CORPORATION
CONSOLIDATED BALANCE SHEETS
| September 30, | ||||||||
| 2009 | 2008 | |||||||
| (In thousands, except share |
||||||||
| ASSETS | ||||||||
| Current assets: |
||||||||
| Cash and cash equivalents |
$ | 22,473 | $ | 13,214 | ||||
| Short-term investments |
7,383 | 31,148 | ||||||
| Accounts receivable, net |
15,930 | 16,526 | ||||||
| Costs in excess of related revenue on uncompleted contracts |
1,262 | 972 | ||||||
| Deferred tax assets—current |
416 | 1,255 | ||||||
| Prepaid expenses and other |
6,887 | 4,995 | ||||||
| Taxes receivable |
108 | 2,733 | ||||||
| Total current assets |
54,459 | 70,843 | ||||||
| Property, plant and equipment, net |
6,533 | 3,966 | ||||||
| Goodwill |
10,984 | 11,751 | ||||||
| Other intangible assets, net |
29,645 | 6,270 | ||||||
| Deferred tax assets—long-term |
8,858 | 14,548 | ||||||
| Taxes receivable—long-term |
2,768 | — | ||||||
| Long-term investments |
— | 21,443 | ||||||
| Other long-term assets |
4,858 | 383 | ||||||
| Total assets |
$ | 118,105 | $ | 129,204 | ||||
| LIABILITIES AND STOCKHOLDERS’ EQUITY | ||||||||
| Current liabilities: |
||||||||
| Accounts payable |
$ | 4,767 | $ | 1,023 | ||||
| Accrued expenses |
18,713 | 5,678 | ||||||
| Deferred revenues |
9,930 | 8,866 | ||||||
| Income tax payable |
— | 1,702 | ||||||
| Total current liabilities |
33,410 | 17,269 | ||||||
| Income tax liability |
935 | 1,083 | ||||||
| Deferred tax liability |
3,156 | — | ||||||
| Other long-term accruals |
1,397 | 150 | ||||||
| Minority interest |
997 | — | ||||||
| Total liabilities |
39,895 | 18,502 | ||||||
| Commitments and contingencies (Note 6) |
||||||||
| Stockholders’ equity: |
||||||||
| Common stock, $0.001 par value: |
||||||||
| Authorized shares—150,000,000 as of September 30, 2009 and 2008; issued and outstanding shares—24,023,642 and 23,649,295 as of September 30, 2009 and 2008, respectively |
24 | 24 | ||||||
| Additional paid-in capital |
143,754 | 141,220 | ||||||
| Accumulated other comprehensive income (loss) |
(129 | ) | 207 | |||||
| Treasury stock, at cost (890,000 shares as of September 30, 2009 and 700,000 shares as of September 30, 2008) |
(5,130 | ) | (4,564 | ) | ||||
| Accumulated deficit |
(60,309 | ) | (26,185 | ) | ||||
| Total stockholders’ equity |
78,210 | 110,702 | ||||||
| Total liabilities and stockholders’ equity |
$ | 118,105 | $ | 129,204 | ||||
See Notes to Consolidated Financial Statements.
65
Table of Contents
VIRAGE LOGIC CORPORATION
CONSOLIDATED STATEMENTS OF OPERATIONS
| Year Ended September 30, | ||||||||||||
| 2009 | 2008 | 2007 | ||||||||||
| (In thousands, except per share data) | ||||||||||||
| Revenues: |
||||||||||||
| License |
$ | 32,217 | $ | 38,694 | $ | 24,407 | ||||||
| Maintenance |
7,078 | 8,567 | 9,972 | |||||||||
| Royalties |
8,148 | 12,069 | 12,148 | |||||||||
| Revenues |
47,443 | 59,330 | 46,527 | |||||||||
| Cost and expenses: |
||||||||||||
| Cost of revenues |
9,833 | 11,106 | 12,938 | |||||||||
| Research and development |
29,967 | 27,725 | 20,346 | |||||||||
| Sales and marketing |
12,815 | 14,749 | 15,464 | |||||||||
| General and administrative |
10,836 | 8,382 | 8,891 | |||||||||
| Goodwill impairment |
11,839 | — | — | |||||||||
| Restructuring |
1,499 | 316 | 580 | |||||||||
| Total cost and expenses |
76,789 | 62,278 | 58,219 | |||||||||
| Operating loss |
(29,346 | ) | (2,948 | ) | (11,692 | ) | ||||||
| Interest income |
956 | 2,913 | 4,002 | |||||||||
| Other income (expenses), net |
(282 | ) | 482 | (157 | ) | |||||||
| Income (loss) before income taxes |
(28,672 | ) | 447 | (7,847 | ) | |||||||
| Minority interest in loss of consolidated subsidiaries |
47 | — | — | |||||||||
| Income tax provision (benefit) |
5,499 | (107 | ) | (3,242 | ) | |||||||
| Net income (loss) |
$ | (34,124 | ) | $ | 554 | $ | (4,605 | ) | ||||
| Basic and diluted net income (loss) per share |
$ | (1.48 | ) | $ | 0.02 | $ | (0.20 | ) | ||||
| Shares used in computing basic net income (loss) per share |
22,979 | 23,423 | 23,111 | |||||||||
| Shares used in computing diluted net income (loss) per share |
22,979 | 23,673 | 23,111 | |||||||||
See Notes to Consolidated Financial Statements.
66
Table of Contents
VIRAGE LOGIC CORPORATION
CONSOLIDATED STATEMENTS OF STOCKHOLDERS’ EQUITY
| Common Stock | Additional Paid-in Capital |
Accumulated Other Comprehensive Income (loss), net |
Treasury Stock |
Accumulated Deficit |
Total Stockholders’ Equity |
||||||||||||||||||||
| Shares | Amount | ||||||||||||||||||||||||
| (In thousands, except share data) | |||||||||||||||||||||||||
| Balance as of September 30, 2006 |
23,027,662 | $ | 23 | $ | 130,620 | $ | 309 | $ | — | $ | (22,134 | ) | $ | 108,818 | |||||||||||
| Common stock issued under stock option plan and stock purchase plan |
163,195 | — | 906 | — | — | — | 906 | ||||||||||||||||||
| Share-based compensation |
— | — | 4,400 | — | — | — | 4,400 | ||||||||||||||||||
| Cumulative foreign exchange translation adjustment |
— | — | — | 702 | — | — | 702 | ||||||||||||||||||
| Change in unrealized loss on investments, net of tax |
— | — | — | (2 | ) | — | — | (2 | ) | ||||||||||||||||
| Net loss |
— | — | — | — | — | (4,605 | ) | (4,605 | ) | ||||||||||||||||
| Balance as of September 30, 2007 |
23,190,857 | 23 | 135,926 | 1,009 | — | (26,739 | ) | 110,219 | |||||||||||||||||
| Common stock issued under stock option plan |
458,438 | 1 | 1,969 | — | — | — | 1,970 | ||||||||||||||||||
| Share-based compensation |
— | — | 3,532 | — | — | — | 3,532 | ||||||||||||||||||
| Settlement of payroll taxes upon restricted stock unit exercises |
— | — | (207 | ) | — | — | — | (207 | ) | ||||||||||||||||
| Cumulative foreign exchange translation adjustment |
— | — | — | (682 | ) | — | — | (682 | ) | ||||||||||||||||
| Change in unrealized loss on investments, net of tax |
— | — | — | (120 | ) | — | — | (120 | ) | ||||||||||||||||
| Repurchase of common stock |
— | — | — | — | (4,564 | ) | — | (4,564 | ) | ||||||||||||||||
| Net income |
— | — | — | — | — | 554 | 554 | ||||||||||||||||||
| Balance as of September 30, 2008 |
23,649,295 | 24 | 141,220 | 207 | (4,564 | ) | (26,185 | ) | 110,702 | ||||||||||||||||
| Common stock issued under stock option plan |
374,347 | — | 48 | — | — | — | 48 | ||||||||||||||||||
| Share-based compensation |
— | — | 2,957 | — | — | — | 2,957 | ||||||||||||||||||
| Settlement of payroll taxes upon restricted stock unit exercises |
— | — | (471 | ) | — | — | — | (471 | ) | ||||||||||||||||
| Cumulative foreign exchange translation adjustment |
— | — | — | (486 | ) | — | — | (486 | ) | ||||||||||||||||
| Change in unrealized loss on investments, net of tax |
— | — | — | 150 | — | — | 150 | ||||||||||||||||||
| Repurchase of common stock |
— | — | — | — | (566 | ) | — | (566 | ) | ||||||||||||||||
| Net loss |
— | — | — | — | — | (34,124 | ) | (34,124 | ) | ||||||||||||||||
| Balance as of September 30, 2009 |
24,023,642 | $ | 24 | $ | 143,754 | $ | (129 | ) | $ | (5,130 | ) | $ | (60,309 | ) | $ | 78,210 | |||||||||
See Notes to Consolidated Financial Statements.
67
Table of Contents
VIRAGE LOGIC CORPORATION
CONSOLIDATED STATEMENTS OF CASH FLOWS
| Year Ended September 30, | ||||||||||||
| 2009 | 2008 | 2007 | ||||||||||
| (In thousands) | ||||||||||||
| Operating activities |
||||||||||||
| Net income (loss) |
$ | (34,124 | ) | $ | 554 | $ | (4,605 | ) | ||||
| Adjustments to reconcile net income (loss) to net cash provided by (used in) operating activities: |
||||||||||||
| Provision for (recovery of) doubtful accounts |
430 | 123 | (101 | ) | ||||||||
| Depreciation and amortization |
1,439 | 1,275 | 1,832 | |||||||||
| Amortization of intangible assets |
1,568 | 847 | 385 | |||||||||
| Write off of acquired in-process technology |
— | 200 | 100 | |||||||||
| Share-based compensation |
2,908 | 3,584 | 4,341 | |||||||||
| Excess tax benefit from share-based compensation |
(118 | ) | (330 | ) | — | |||||||
| Gain on sales of investments |
(98 | ) | — | — | ||||||||
| (Gain)/loss on disposal of fixed assets |
(1 | ) | — | 4 | ||||||||
| Non-cash restructuring charges |
— | — | 31 | |||||||||
| Goodwill impairment |
11,839 | — | — | |||||||||
| Minority interest in consolidated subsidiary’s net loss |
(47 | ) | — | — | ||||||||
| Deferred income tax |
6,191 | (1,674 | ) | (4,739 | ) | |||||||
| Changes in operating assets and liabilities: |
||||||||||||
| Accounts receivable |
2,286 | (4,037 | ) | 3,866 | ||||||||
| Costs in excess of revenue on uncompleted contracts |
(242 | ) | 110 | (418 | ) | |||||||
| Prepaid expenses and other |
(1,062 | ) | (305 | ) | (1,298 | ) | ||||||
| Taxes receivable |
2,087 | (412 | ) | (609 | ) | |||||||
| Other long-term assets |
(2,063 | ) | 90 | (171 | ) | |||||||
| Accounts payable |
1,837 | 2 | 575 | |||||||||
| Accrued expenses and other long-term liabilities |
2,008 | 1,068 | (239 | ) | ||||||||
| Deferred revenues |
(448 | ) | (130 | ) | 100 | |||||||
| Current and non-current income tax liability |
(1,759 | ) | (190 | ) | 348 | |||||||
| Net cash provided by (used in) operating activities |
(7,369 | ) | 775 | (598 | ) | |||||||
| Investing activities |
||||||||||||
| Purchase of property, plant and equipment |
(3,122 | ) | (1,320 | ) | (285 | ) | ||||||
| Purchase of investments |
(42,025 | ) | (102,140 | ) | (111,535 | ) | ||||||
| Proceeds from sales and maturities of investments |
87,288 | 109,408 | 108,050 | |||||||||
| Proceeds from sale of property, plant and equipment |
2 | — | 1 | |||||||||
| Net cash paid for business combination |
(25,414 | ) | (5,484 | ) | (2,772 | ) | ||||||
| Net cash provided by (used in) investing activities |
16,729 | 464 | (6,541 | ) | ||||||||
| Financing activities |
||||||||||||
| Proceeds from issuance of common stock |
48 | 1,970 | 906 | |||||||||
| Cash paid for stock repurchase |
(566 | ) | (4,564 | ) | — | |||||||
| Excess tax benefit from share-based compensation |
118 | 330 | — | |||||||||
| Proceeds from sale-leaseback transactions |
659 | — | — | |||||||||
| Net cash provided by (used in) financing activities |
259 | (2,264 | ) | 906 | ||||||||
| Effect of exchange rates on cash |
(360 | ) | (581 | ) | 238 | |||||||
| Net increase (decrease) in cash and cash equivalents |
9,259 | (1,606 | ) | (5,995 | ) | |||||||
| Cash and cash equivalents at beginning of year |
13,214 | 14,820 | 20,815 | |||||||||
| Cash and cash equivalents at end of year |
$ | 22,473 | $ | 13,214 | $ | 14,820 | ||||||
| Supplemental disclosures of cash flow information |
||||||||||||
| Cash paid for income taxes |
$ | (2 | ) | $ | (336 | ) | $ | (226 | ) | |||
See Notes to Consolidated Financial Statements.
68
Table of Contents
VIRAGE LOGIC CORPORATION
NOTES TO CONSOLIDATED FINANCIAL STATEMENTS
Note 1. Organization and Summary of Significant Accounting Policies
Description of Business
Virage Logic Corporation (Virage Logic or the Company) was incorporated in California in November 1995 and subsequently reincorporated in Delaware in July 2000. The Company provides semiconductor IP platforms incorporating memory, logic and I/Os (input/output interface components) as well as related services. These various forms of IP are utilized by the Company’s customers to design and manufacture system-on-a-chip (SoC) integrated circuits that power consumer, communications and networking, handheld and portable, computer and graphics, and automotive applications.
Principles of Consolidation
The accompanying consolidated financial statements include the accounts of Virage Logic and its wholly-owned subsidiaries conducting business in the Republic of Armenia (Armenia), Germany, India, Israel, Japan and the United Kingdom. All significant intercompany balances and transactions have been eliminated in consolidation.
Reclassification
Certain amounts in the prior year financial statements have been reclassified to conform to the current year presentation. The effects of these reclassifications are not material to the consolidated financial statements.
Foreign Currency
The financial position and results of operations of the Company’s foreign operations are measured using currencies other than the U.S. dollar as their functional currencies. Accordingly, for these operations all assets and liabilities are translated into U.S. dollars at the current exchange rates as of the respective balance sheet dates. Revenue and expense items are translated using the weighted average exchange rates prevailing during the period. Cumulative gains and losses from the translation of these operations’ financial statements are reported as a separate component of stockholders’ equity, while foreign currency transactions gains or losses, resulting from remeasuring local currency to the U.S. dollar are recorded in the consolidated statements of operations. The net transaction gains and losses are recorded in the consolidated statements of operations in other income (expense), net. The Company recorded a foreign currency transaction gain of $0.5 million for the fiscal year ended September 30, 2008 and foreign currency transaction losses of $0.3 million and $0.2 million for years ended September 30, 2009 and 2007, respectively.
Use of Estimates
The preparation of consolidated financial statements in conformity with United States generally accepted accounting principles requires management to make estimates and assumptions that affect the amounts reported in the financial statements and accompanying notes. Actual results could differ from those estimates.
Revenue Recognition
The Company recognizes revenue on its intellectual property in accordance with the software revenue recognition guidelines because the software is not incidental to the IP as the IP is embedded in the software and the intellectual property is, in essence, a software product.
Revenues from perpetual licenses for the semiconductor IP products are generally recognized when persuasive evidence of an arrangement exists, delivery of the product has occurred, the fee is fixed or
69
Table of Contents
VIRAGE LOGIC CORPORATION
NOTES TO CONSOLIDATED FINANCIAL STATEMENTS—(Continued)
determinable, and collectibility is reasonably assured. The Company uses a completed performance model for perpetual licenses that do not include services to provide significant production, modification or customization of software as all of the elements have been delivered. The Company determines delivery has occurred when all the license materials that are specified in the evidence of a signed arrangement including any related documentation and the license keys are delivered electronically through the FTP server or via Electronic mail (e-mail). If any of these criteria are not met, revenue recognition is deferred until such time as all criteria are met. Revenues from term-based licenses that do not require specific customization for the semiconductor IP and software products are recognized ratably over the term of the license, which is generally between twelve to thirty-six months in duration, provided the criteria mentioned above are met. The Company uses a proportional performance model for term-based licenses as these licenses have a right to receive unspecified additional products that are granted over the access term of the license. Consulting services represent an immaterial amount of the Company’s revenue thus are recorded as part of license revenue. These consulting services are not related to the functionality of the products licensed. Revenue from consulting services is recognized on the time and materials method or as work is performed.
License of custom memory compilers and logic libraries may involve customization to the functionality of the software; therefore revenues from such licenses are recognized over the period that services are performed. Revenue derived from library development services are recognized using a percentage-of-completion method, and revenues from technical consulting services are recognized as the services are performed. For all license and service agreements accounted for using the percentage-of-completion method, the Company determines progress-to-completion based on labor hours incurred in comparison to the estimated total service hours required to complete the development or service or on the value of contract milestones completed. The Company believes that it is able to reasonably and reliably estimate the costs to complete projects accounted for using the percentage-of-completion method based on historical experience of similar project requirements. If the Company cannot reasonably and reliably estimate the costs to complete a project, the completed contract method of accounting is used, such that costs are deferred until the project is completed, at which time revenues and related costs are recognized. A provision for estimated losses on any project is made in the period in which the loss becomes probable and can be reasonably estimated. Costs incurred in advance of revenue recognition are recorded as costs in excess of related revenue on uncompleted contracts. If customer acceptance is required for completion of specified milestones, the related revenue is deferred until the acceptance criteria are met. If a portion of the value of a contract is contingent based on meeting a specified criteria, then the contingent value of the contract is deferred until the contingency has been satisfied or removed.
For agreements that include multiple elements, the Company recognizes revenues attributable to delivered or completed elements when such elements are completed or delivered. The amount of such revenues is determined by applying the residual method of accounting by deducting the aggregate fair value of the undelivered or uncompleted elements, which the Company determines by each such element’s vendor-specific objective evidence of fair value, from the total revenues recognizable under such agreement. Vendor-specific objective evidence of fair value of each element of an arrangement is based upon the higher of the normal pricing for such licensed product and service when sold separately or the actual price stated in the contract, and for maintenance, it is determined based on 20% of the net selling price of the license. Revenues are recognized once the Company delivers the element identified as having vendor-specific objective evidence or once the provision of the services is completed. Maintenance revenues are recognized ratably over the remaining contractual term of the maintenance period from the date of delivery of the licensed materials receiving maintenance, which is generally twelve months.
The Company assesses whether the fee associated with each transaction is fixed or determinable and collection is reasonably assured and evaluates the payment terms. If a portion of the fee is due beyond normal payment terms, the Company recognizes the revenues on the payment due date, as long as collection is
70
Table of Contents
VIRAGE LOGIC CORPORATION
NOTES TO CONSOLIDATED FINANCIAL STATEMENTS—(Continued)
reasonably assured. The Company assesses collectibility based on a number of factors, including past transaction history and the overall credit-worthiness of the customer. If collection is not reasonably assured, revenue is deferred and recognized at the time collection becomes reasonably assured, which is generally upon receipt of the payment.
Amounts invoiced to customers in excess of recognized revenues are recorded as deferred revenues. Amounts recognized as revenue in advance of invoicing the customer are recorded as unbilled accounts receivable. The timing and amounts invoiced to customers can vary significantly depending on specific contract terms and can therefore have a significant impact on deferred revenues and unbilled accounts receivable in any given period. If all of the criteria as applicable have been met prior to the recognition of any revenue it would create an unbilled accounts receivable balance.
Royalty revenues are generally determined and recognized one quarter in arrears, when a production volume report is received from the customer or foundry. Royalty revenues are calculated based on actual production volumes of wafers containing chips utilizing the Company’s semiconductor IP technologies based on a rate per-chip or rate per-wafer depending on the terms of the respective license agreement. Depending on the contractual terms, prepaid royalties are recognized as revenue upon either the receipt of a corresponding royalty report or after all related license deliverables have been made.
Fair Value of Financial Instruments
The Company has determined that the amounts reported for cash and cash equivalents, accounts receivable, accounts payable, accrued liabilities and other financial instruments approximate fair value because of their short maturities and/or variable interest rates. Available-for-sale investments are reported at their fair market value based on quoted market prices.
Cash and Cash Equivalents, Short-term and Long-term Investments
For purposes of the accompanying consolidated statements of cash flows, the Company considers all highly liquid instruments with an original maturity on the date of purchase of three months or less to be cash equivalents. Cash and cash equivalents as of September 30, 2009 and 2008 consisted of money market funds and commercial paper. The Company determines the appropriate classification of investment securities at the time of purchase. As of September 30, 2009 and 2008, all investment securities are designated as “available-for-sale.” The Company considers all investments that are available-for-sale that have a maturity date longer than three months and less than twelve months to be short-term investments. The Company considers all investments that have a maturity of more than twelve months to be long-term investments. Long-term investments include government-sponsored enterprise securities of $0 and $21.4 million for the fiscal years ended September 30, 2009 and 2008, respectively.
The available-for-sale securities are carried at fair value based on quoted market prices, with the unrealized gains (losses) reported as a separate component of stockholders’ equity. The Company periodically reviews the realizable value of its investments in marketable securities. When assessing marketable securities for other-than-temporary declines in value, the Company considers such factors as the length of time and extent to which fair value has been less than the cost basis, the market outlook in general and the Company’s intent and ability not to sell the investment for a period of time sufficient to allow for any anticipated recovery in market value. If an other-than-temporary impairment of the investments is deemed to exist, the carrying value of the investment would be written down to its estimated fair value.
71
Table of Contents
VIRAGE LOGIC CORPORATION
NOTES TO CONSOLIDATED FINANCIAL STATEMENTS—(Continued)
Property, Plant and Equipment
Property, plant and equipment are recorded at cost, net of accumulated depreciation and amortization. Depreciation and amortization are provided on a straight-line basis over the estimated useful lives of the assets, generally three years, or, for leasehold improvements, the shorter of the lease term or the estimated useful lives of the assets, if applicable. The office building owned by the Company’s subsidiary in Armenia is being depreciated over a life of twenty years.
Accounting for Internal-Use Computer Software
The Company capitalized certain external and internal costs, including internal payroll costs, incurred in the connection with the development or acquisition of software for internal use. These costs are capitalized beginning when the Company has entered the application development stage and ceases when the software is substantially complete and is ready for its intended use. The Company purchased and capitalized costs of $0.1 million and $0 during the fiscal years ended September 30, 2009 and 2008, respectively. Software is amortized using the straight-line method over the estimated useful life of three years.
Software Development Costs
Software development costs, related to software that is or will be sold or licensed externally to third-parties, or for which a substantive plan exists to sell or license such software in the future, are capitalized beginning when the software’s technological feasibility has been established by completion of a working model of the product. Amortization of the costs begins when the product is available for general release to customers and will be amortized to cost of revenues over the greater of its estimated useful life of 5 years or the ratio of accumulated revenue over estimated total revenue. The Company capitalized $1.3 million and $0 of purchased software during the twelve months ended September 30, 2009 and 2008. The amortization expense for software development costs during fiscal 2009 is $136,000, as the product was available for general release during the fourth quarter.
Goodwill and Intangible Assets
The Company applies a fair value based impairment test to the net book value of goodwill and indefinite-lived intangible assets on an annual basis and, if certain events or circumstances indicate that an impairment loss may have been incurred, on an interim basis. The analysis of potential impairment of goodwill requires a two-step process:
Step 1: The Company compares the fair value of its reporting unit to the carrying value, including goodwill, of its reporting unit. The fair value will consider the Company’s market capitalization during the reporting period. If a unit’s fair value exceeds the carrying value, no impairment charge is necessary. For each reporting unit where the carrying value, including goodwill, exceeds the unit’s fair value, the Company will move on to step two as described below.
Step 2: The Company performs an allocation of the fair value of its identifiable tangible and non-goodwill intangible assets and liabilities. This derives an implied fair value for its goodwill. The Company then compares the implied fair value of goodwill with the carrying amount of its goodwill. If the carrying amount of the goodwill is greater than the implied fair value of its goodwill, an impairment loss is recognized for the excess of such amount.
During the second quarter of fiscal 2009, the Company initiated a plan of restructuring in an effort to reduce operating expenses. Based on a combination of factors, including the then current economic environment, the Company’s operating results, and the restructuring plan, the Company concluded that there were sufficient indicators to require an interim goodwill impairment analysis during the second quarter. As a result, the
72
Table of Contents
VIRAGE LOGIC CORPORATION
NOTES TO CONSOLIDATED FINANCIAL STATEMENTS—(Continued)
Company recorded an impairment charge of $11.8 million which represented its best estimate of the resulting goodwill impairment in the second quarter. For the purposes of this analysis, the Company’s estimates of fair value were based on a combination of the income approach, which estimated the fair value based on the future discounted cash flows, and the market approach, which estimates the fair value based on comparable market prices. In connection with completing the goodwill impairment analysis, the Company reviewed its long-lived tangible and intangible assets within the impaired reporting unit under the guidance for accounting for the impairment or disposal of long-lived assets. The Company determined that the forecasted undiscounted cashflows related to these assets or asset groups were in excess of their carrying values, and therefore these assets were not impaired.
As of September 30, 2009, the Company had an intangible asset of $0.8 million related to technology acquired through the acquisition of In-Chip Systems, an intangible asset of $0.5 million related to technology and other intangibles acquired through the acquisition of Ingot Systems, an intangible asset of $3.6 million related to technology and other intangibles acquired through the acquisition of the NVM product line of Impinj, and an intangible asset of $24.7 million related to the acquisition of ARC International.
There were no future goodwill impairment indicators as of September 30, 2009. No impairment charge for goodwill was recorded during the fiscal years ended September 30, 2008 and 2007.
Impairment of long-lived assets
The Company evaluates the recoverability of long-lived assets with finite lives whenever events or changes in circumstances indicate that the carrying amount of an asset may not be recoverable. An impairment charge is recognized in the event the net book value of such assets exceeds the future undiscounted cash flows attributable to such assets.
There were no impairment charges recorded in fiscal years 2009, 2008 and 2007.
Share-based Compensation
The Company values its share-based awards on the date of grant using the Black-Scholes model. The Company is required to measure compensation cost for all share-based awards at fair value on date of grant and recognizes this compensation expense on a straight-line basis over the service period that the awards are expected to vest. Stock options generally vest over a four-year service period. Total compensation expense recognized for the fiscal years ended September 30, 2009, 2008 and 2007 was $2.9 million, $3.6 million and $4.3 million, respectively. As of September 30, 2009, total unrecognized estimated compensation expense net of forfeitures related to non-vested equity awards granted prior to that date was $4.0 million and will be amortized over the average period of 2.69 years.
The Company records the expense of such services based upon the estimated fair value of the equity instrument using the Black-Scholes pricing model. Assumptions used to value the equity instruments are consistent with equity instruments issued to employees. The Company charges the value of the equity instrument to earnings over the term of the service agreement. There were no stock options grants to non-employees, excluding non-employee directors, and no expense recorded for stock options granted to non-employees in the fiscal years ended September 30, 2009, 2008 and 2007.
73
Table of Contents
VIRAGE LOGIC CORPORATION
NOTES TO CONSOLIDATED FINANCIAL STATEMENTS—(Continued)
The share-based compensation expense related to the Company’s share-based awards for the fiscal years ended September 30, 2009, 2008, and 2007 were as follows (in thousands, except per share data):
| Year Ended September 30, 2009 |
Year Ended September 30, 2008 |
Year Ended September 30, 2007 |
||||||||||
| Cost of revenues |
$ | 341 | $ | 597 | $ | 715 | ||||||
| Research and development |
1,137 | 1,255 | 1,155 | |||||||||
| Sales and marketing |
219 | 292 | 1,130 | |||||||||
| General and administrative |
1,211 | 1,440 | 1,341 | |||||||||
| Share-based compensation expense |
2,908 | 3,584 | 4,341 | |||||||||
| Related income tax benefits |
(1,119 | ) | (1,308 | ) | (1,152 | ) | ||||||
| Share-based compensation expense, net of tax benefits |
$ | 1,789 | $ | 2,276 | $ | 3,189 | ||||||
| Net share-based compensation expense, per common share: |
||||||||||||
| Basic |
$ | 0.08 | $ | 0.10 | $ | 0.14 | ||||||
| Diluted |
$ | 0.08 | $ | 0.10 | $ | 0.14 | ||||||
As of September 30, 2009 and 2008, the Company capitalized approximately $55,000 and $62,000, respectively, of share-based compensation expense related to its custom contracts which have not been completed.
The Company is using the Black-Scholes model to value the compensation expense associated with its share-based. In addition, the Company estimates forfeitures when recognizing compensation expense. The Company will adjust its estimate of forfeitures over the requisite service period based on the extent to which actual forfeitures differ, or are expected to differ, from such estimates. Changes in estimated forfeitures will be recognized through an adjustment in the period of change and will also impact the amount of compensation expense to be recognized in future periods.
The following weighted average assumptions were used in the estimated grant date fair value calculations for equity awards:
| Year Ended September 30, | |||||||||
| 2009 | 2008 | 2007 | |||||||
| Volatility |
53 | % | 44 | % | 51 | % | |||
| Risk-free interest rate |
2.22 | % | 3.11 | % | 4.54 | % | |||
| Dividend yield |
0 | % | 0 | % | 0 | % | |||
| Expected life (years) |
4.8 | 4.6 | 4.3 | ||||||
The expected stock price volatility rates are based on the historical volatility of the Company’s common stock. The risk free interest rates are based on the United States Treasury yield curve in effect at the time of grant for periods corresponding with the expected life of the option. The average expected life represents the weighted average period of time that options granted are expected to be outstanding giving consideration to vesting schedules and the Company’s historical exercise patterns. The Black-Scholes weighted average fair values of options and Stock Settled Appreciation Rights (“SSARs”) granted during the fiscal years ended September 30, 2009, 2008 and 2007 were $1.55, $2.95 and $3.53 per share, respectively.
74
Table of Contents
VIRAGE LOGIC CORPORATION
NOTES TO CONSOLIDATED FINANCIAL STATEMENTS—(Continued)
Business Risks and Concentration of Credit Risk
The Company operates in the highly competitive semiconductor industry, which has been characterized by rapid technological change, short product life cycles and cyclical market patterns. Significant technological changes in the industry or industry downturns relating to declines in general economic conditions could adversely affect operating results.
The Company markets and sells its technology to a broad base of customers, which are primarily located in the United States, Asia, Canada and Europe. The Company performs ongoing credit evaluations of its customers’ financial condition, and generally, no collateral is required.
Customer Concentrations
In fiscal year 2009, two customers accounted for 10% or more of total revenues. The percentages were 11% and 10% for the fiscal year ended September 30, 2009. In fiscal years 2008 and 2007, only one customer accounted for 10% or more of total revenues. The percentages were 11% and 11% for the fiscal years ended September 30, 2008 and 2007, respectively.
Advertising Expense
The Company expenses costs of producing advertisements at the time production occurs and expenses promotional advertising in the period during which the promotion is distributed or aired. Advertising costs totaled approximately $583,000, $650,000, and $640,000 for the fiscal years ended September 30, 2009, 2008 and 2007, respectively.
Research and Development
Costs incurred in the research and development of new software products and enhancements to existing software products are expensed as incurred until technological feasibility has been established. Generally, the Company believes its current process for developing software is essentially completed concurrently with the establishment of technological feasibility which is evidenced by a working model; accordingly, costs incurred after the establishment of technological feasibility have not been significant and, therefore, have been expensed. Research and development costs are charged to operations as incurred.
Net Income (Loss) Per Share
Basic and diluted net income (loss) per share have been computed using the weighted average number of shares of common stock outstanding during the period, less weighted average shares outstanding that are subject to repurchase by the Company plus weighted average share equivalents, unless anti-dilutive.
| Year Ended September 30, | |||||||||||
| 2009 | 2008 | 2007 | |||||||||
| Net income (loss) |
$ | (34,124 | ) | $ | 554 | $ | (4,605 | ) | |||
| Share used in computation: |
|||||||||||
| Shares used in computing basic net income (loss) per share |
22,979 | 23,423 | 23,111 | ||||||||
| Add: Effect of potentially diluted securities |
— | 250 | — | ||||||||
| Shares used in computing diluted net income (loss) per share |
22,979 | 23,673 | 23,111 | ||||||||
| Basic income (loss) per share |
$ | (1.48 | ) | $ | 0.02 | $ | (0.20 | ) | |||
| Diluted income (loss) per share |
$ | (1.48 | ) | $ | 0.02 | $ | (0.20 | ) | |||
75
Table of Contents
VIRAGE LOGIC CORPORATION
NOTES TO CONSOLIDATED FINANCIAL STATEMENTS—(Continued)
The Company excluded equity awards totaling approximately 4.3 million shares from the computation of diluted net income per share for the fiscal year ended September 30, 2009. For the fiscal years ended September 30, 2008 and 2007, the Company excluded equity awards totaling approximately 4.7 million shares and 4.8 million shares from the calculation of the net loss per share as they were anti-dilutive.
Comprehensive Income (Loss)
Comprehensive income (loss) includes unrealized gains and losses on investments and foreign currency translation adjustments.
Total comprehensive income (loss) is as follows (in thousands):
| Year Ended September 30, | ||||||||||||
| 2009 | 2008 | 2007 | ||||||||||
| Net income (loss) |
$ | (34,124 | ) | $ | 554 | $ | (4,605 | ) | ||||
| Foreign currency translation adjustment, net of tax |
(299 | ) | (419 | ) | 432 | |||||||
| Change in net unrealized gain (loss) on investments, net of tax |
92 | (74 | ) | (1 | ) | |||||||
| Total comprehensive income (loss), net of tax |
$ | (34,331 | ) | $ | 60 | $ | (4,175 | ) | ||||
Income Taxes
Income taxes are accounted for using an asset and liability approach, which requires the recognition of deferred tax assets and liabilities for expected future tax events that have been recognized differently in the Company’s consolidated financial statements and tax returns. The measurement of current and deferred tax assets and liabilities are based on provisions of the enacted tax law and the effects of future changes in tax laws or rates. A valuation allowance is established when necessary to reduce deferred tax assets to amounts expected to be realized.
Recent Accounting Pronouncements
Revenue Arrangements with Multiple Deliverables: In October of 2009, new standards were issued to update the accounting and reporting requirements for revenue arrangements with multiple deliverables. These standards established a selling price hierarchy, which allows the use of an estimated selling price to determine the selling price of a deliverable in cases where neither vendor-specific objective evidence nor third-party evidence is available. These standards are to be applied prospectively for revenue arrangements entered into or materially modified in fiscal years beginning on or after June 15, 2010 and the Company is required to adopt these standards in its first quarter of 2011. Early adoption is permitted, and if this update is adopted early in other than the first quarter of an entity’s fiscal year, then it must be applied retrospectively to the beginning of that fiscal year. The Company is currently assessing the impact of the adoption on its consolidated financial statements.
Certain Revenue Arrangements that Include Software Elements: In October of 2009, new standards were issued that amend which revenue allocation and measurement standard should be used for arrangements that contain both tangible products and software. More specifically, if the software sold with or embedded within the tangible product is essential to the functionality of the tangible product, this software as well as undelivered software elements that relate to this software is excluded from the scope of existing software revenue guidance. These standards are to be applied prospectively for revenue arrangements entered into or materially modified in fiscal years beginning on or after June 15, 2010 and the Company is required to adopt these standards in its first
76
Table of Contents
VIRAGE LOGIC CORPORATION
NOTES TO CONSOLIDATED FINANCIAL STATEMENTS—(Continued)
quarter of 2011. Early adoption is permitted, and if this update is adopted early in other than the first quarter of an entity’s fiscal year, then it must be applied retrospectively to the beginning of that fiscal year. The Company is currently assessing the impact of the adoption on its consolidated financial statements.
Earnings per Share: In June 2008, new standards were issued which concluded that unvested awards of share-based payments with non forfeitable rights to receive dividends or dividend equivalents, such as its restricted stock units (RSUs), are considered to be participating securities and the two-class method should be used for purposes of calculating earnings per share (EPS). Under the two-class method, a portion of net income is allocated to these participating securities and therefore is excluded from the calculation of EPS allocated to common stock. The standards are effective for financial statements issued for the fiscal years and interim periods beginning after December 15, 2008 and require retrospective adjustment to earnings per share data. The Company is required to adopt the standards in its first quarter of fiscal 2010 and are currently evaluating the impact of the adoption on its consolidated financial statements.
Intangibles: In April 2008, new standards were issued for the determination of useful life of intangibles and amend the factors that should be considered in developing renewal or extension assumptions used to determine the useful life of a recognized intangible asset and require enhanced related disclosures. The standards must be applied prospectively to all intangible assets acquired as of and subsequent to fiscal years beginning after December 15, 2008 and the Company is required to adopt the pronouncement in its first quarter of fiscal 2010. The Company is currently evaluating the impact, if any, that the standards will have on its consolidated financial statements.
Business Combinations: These revised standards for business combinations generally require an entity to recognize the assets acquired, liabilities assumed, contingencies, and contingent consideration at their fair value on the acquisition date. In circumstances where the acquisition-date fair value for a contingency cannot be determined during the measurement period and it is concluded that it is probable that an asset or liability exists as of the acquisition date and the amount can be reasonably estimated, a contingency is recognized as of the acquisition date based on the estimated amount. It further requires that acquisition-related costs be recognized separately from the acquisition and expensed as incurred, restructuring costs generally be expensed in periods subsequent to the acquisition date, and changes in accounting for deferred tax asset valuation allowances and acquired income tax uncertainties after the measurement period impact income tax expense. In addition, acquired in-process research and development is capitalized as an intangible asset and amortized over its estimated useful life. These new standards are applicable to business combinations on a prospective basis beginning in the Company’s first quarter of 2010. The effect of adoption of these revised standards on the Company’s financial condition or operating results will depend on the nature of acquisitions completed after the date of adoption.
Noncontrolling Interests: In December 2007, new standards were issued which required the recognition of a non-controlling interest (formerly minority interest) as equity in the consolidated financial statements separate from the parent’s equity. The amount of net income attributable to the non-controlling interest will be included in consolidated net income on the face of the income statement. These new standards clarified that changes in a parent’s ownership interest in a subsidiary that do not result in deconsolidation are equity transactions if the parent retains its controlling financial interest. In addition, these standards required that a parent recognize a gain or loss in net income when a subsidiary is deconsolidated. Such gain or loss will be measured using the fair value of the non-controlling equity investment on the deconsolidation date. It also included expanded disclosure requirements regarding the interests of the parent and its non-controlling interest. These standards are effective for the fiscal year beginning in the Company’s first quarter of 2010 and the presentation and disclosure requirements must be applied retrospectively for all periods presented at that date. The Company is currently evaluating the impact that these standards will have on our financial statements.
77
Table of Contents
VIRAGE LOGIC CORPORATION
NOTES TO CONSOLIDATED FINANCIAL STATEMENTS—(Continued)
Note 2. Business Segment Information
The Company operates in one industry segment, the sale of semiconductor IP platforms, logic, I/Os and related services, and the sale of the individual platform components and has one reportable segment.
The Company’s Chief Executive Officer has been identified as the Chief Operating Decision Maker (CODM) because he has final authority over resource allocation decisions and performance assessment.
Revenues by geographic area are based on the region the customers are located. They are as follows:
| Year Ended September 30, | |||||||||
| 2009 | 2008 | 2007 | |||||||
| (In thousands) | |||||||||
| Total Revenues by Geographic Area: |
|||||||||
| United States |
$ | 23,496 | $ | 27,611 | $ | 19,862 | |||
| Taiwan |
7,855 | 8,854 | 9,446 | ||||||
| Europe, Middle East, and Africa (EMEA) |
5,249 | 8,175 | 9,200 | ||||||
| Japan |
3,487 | 4,116 | 2,358 | ||||||
| Canada |
2,139 | 1,875 | 1,492 | ||||||
| Other Asia |
5,217 | 8,699 | 4,169 | ||||||
| Total |
$ | 47,443 | $ | 59,330 | $ | 46,527 | |||
Percentage of license revenues by process node are as follows:
| Year Ended September 30, | |||||||||
| 2009 | 2008 | 2007 | |||||||
| Total License Revenues by Process Node: |
|||||||||
| 45-nanometer technology |
41 | % | 24 | % | 3 | % | |||
| 65-nanometer technology |
29 | 38 | 25 | ||||||
| 90-nanometer technology |
12 | 17 | 34 | ||||||
| 0.13 micron technology |
7 | 7 | 24 | ||||||
| 0.18 micron technology |
5 | 3 | 10 | ||||||
| 32-nanometer technology |
2 | — | — | ||||||
| Other |
4 | 11 | 4 | ||||||
| 100 | % | 100 | % | 100 | % | ||||
Percentage of maintenance revenues by process node are as follows:
| Year Ended September 30, | |||||||||
| 2009 | 2008 | 2007 | |||||||
| Total License Revenues by Process Node: |
|||||||||
| 90-nanometer technology |
33 | % | 31 | % | 39 | % | |||
| 65-nanometer technology |
25 | 30 | 11 | ||||||
| 45-nanometer technology |
20 | 11 | — | ||||||
| 0.13 micron technology |
13 | 18 | 38 | ||||||
| 0.18 micron technology |
6 | 6 | 10 | ||||||
| 32-nanometer technology |
2 | — | — | ||||||
| Other |
1 | 4 | 2 | ||||||
| 100 | % | 100 | % | 100 | % | ||||
78
Table of Contents
VIRAGE LOGIC CORPORATION
NOTES TO CONSOLIDATED FINANCIAL STATEMENTS—(Continued)
Long-lived assets are located primarily in the United States, with the exception of a building in Armenia, which is owned by the Company’s Armenian subsidiary. The building in Armenia and its leasehold improvements are valued at cost less accumulated depreciation and amortization and amounted to approximately $1.7 million and $2.4 million as of September 30, 2009 and 2008, respectively.
The Company has only one product line, and as such disclosure by product groupings is not applicable.
Note 3. Balance Sheet Components
Investments, classified as available-for-sale securities, included the following (in thousands):
| September 30, 2009 | September 30, 2008 | |||||||||||||||||||
| Amortized Cost |
Unrealized Gain |
Fair Value |
Amortized Cost |
Unrealized Gain (Loss) |
Fair Value | |||||||||||||||
| Investments: |
||||||||||||||||||||
| Government-sponsored enterprise securities |
$ | 4,507 | $ | 44 | (1) | $ | 4,551 | $ | 13,001 | $ | (36 | ) | $ | 12,965 | ||||||
| Commercial paper |
2,500 | — | 2,500 | 13,893 | (45 | ) | 13,848 | |||||||||||||
| Corporate bonds |
— | — | — | 2,014 | (7 | ) | 2,007 | |||||||||||||
| Certificates of deposits |
332 | — | 322 | 2,328 | — | 2,328 | ||||||||||||||
| Short-term investments |
7,339 | 44 | 7,383 | 31,236 | (88 | ) | 31,148 | |||||||||||||
| Long-term government-sponsored enterprise securities and corporate bonds |
— | — | — | 21,585 | (142 | ) | 21,443 | |||||||||||||
| Long-term investments |
— | — | — | 21,585 | (142 | ) | 21,443 | |||||||||||||
| Total investments |
$ | 7,339 | $ | 44 | $ | 7,383 | $ | 52,821 | $ | (230 | ) | $ | 52,591 | |||||||
| (1) | As of September 30, 2009, there are no unrealized losses for available-for-sale securities. |
Investments, classified as available-for-sale securities, are reported as:
| September 30, | ||||||
| 2009 | 2008 | |||||
| (In thousands) | ||||||
| Short-term investments |
$ | 7,383 | $ | 31,148 | ||
| Long-term investments |
— | 21,443 | ||||
| Total |
$ | 7,383 | $ | 52,591 | ||
The contractual maturities of investments are as follows (in thousands):
| September 30, 2009 | September 30, 2008 | |||||||||||
| Amortized Cost |
Fair Value |
Amortized Cost |
Fair Value | |||||||||
| Due within one year |
$ | 7,339 | $ | 7,383 | $ | 31,236 | $ | 31,148 | ||||
| Due after one year through five years |
— | — | 21,585 | 21,443 | ||||||||
| Total |
$ | 7,339 | $ | 7,383 | $ | 52,821 | $ | 52,591 | ||||
79
Table of Contents
VIRAGE LOGIC CORPORATION
NOTES TO CONSOLIDATED FINANCIAL STATEMENTS—(Continued)
Accounts receivable are as follows (in thousands):
| September 30, | ||||||||
| 2009 | 2008 | |||||||
| (In thousands) | ||||||||
| Accounts receivable, net: |
||||||||
| Accounts receivable |
$ | 16,583 | $ | 16,749 | ||||
| Allowance for doubtful accounts |
(653 | ) | (223 | ) | ||||
| Total |
$ | 15,930 | $ | 16,526 | ||||
Write-offs totaling $94,000 were recorded for the fiscal year ended September 30, 2008. No write-offs were recorded against the allowance for doubtful accounts in the fiscal year ended September 30, 2009 and 2007.
Property, plant and equipment are as follows (in thousands):
| September 30, | ||||||||
| 2009 | 2008 | |||||||
| (In thousands) | ||||||||
| Property, plant and equipment, net: |
||||||||
| Building in Armenia |
$ | 2,698 | $ | 3,430 | ||||
| Furniture and fixtures |
931 | 982 | ||||||
| Computers and equipment |
11,570 | 10,965 | ||||||
| Software |
10,326 | 10,556 | ||||||
| Leasehold improvements |
1,648 | 1,103 | ||||||
| 27,173 | 27,036 | |||||||
| Less accumulated depreciation and amortization |
(20,640 | ) | (23,070 | ) | ||||
| Total |
$ | 6,533 | $ | 3,966 | ||||
Depreciation and amortization expense related to property, plant and equipment totaled $1.4 million for the fiscal year ended September 30, 2009 and $1.3 million for each year ended September 30, 2008 and 2007, respectively.
Goodwill is as follows (in thousands):
| Amount | ||||
| Balance as of September 30, 2008 |
$ | 11,751 | ||
| Goodwill adjustments for NVM product line of Impinj, Inc. |
88 | |||
| Impairment (see Note 1) |
(11,839 | ) | ||
| Goodwill acquired during the period (see Note 4) |
10,984 | |||
| Balance as of September 30, 2009 |
$ | 10,984 | ||
80
Table of Contents
VIRAGE LOGIC CORPORATION
NOTES TO CONSOLIDATED FINANCIAL STATEMENTS—(Continued)
Intangible assets are as follows (in thousands):
| September 30, 2009 | September 30, 2008 | |||||||||||||||||||
| Intangible Assets |
Gross Amount |
Accumulated Amortization |
Net | Gross Amount |
Accumulated Amortization |
Net | ||||||||||||||
| Amortized intangible assets: |
||||||||||||||||||||
| Patents |
$ | 4,801 | $ | (2,934 | ) | $ | 1,867 | $ | 4,800 | $ | (2,403 | ) | $ | 2,397 | ||||||
| Customer Lists |
9,149 | (329 | ) | 8,820 | 700 | (98 | ) | 602 | ||||||||||||
| Technology |
16,919 | (1,059 | ) | 15,860 | 3,300 | (321 | ) | 2,979 | ||||||||||||
| Trade Name |
1,092 | (47 | ) | 1,045 | 300 | (8 | ) | 292 | ||||||||||||
| Order Backlog |
2,082 | (29 | ) | 2,053 | — | — | — | |||||||||||||
| Total |
$ | 34,043 | $ | (4,398 | ) | $ | 29,645 | $ | 9,100 | $ | (2,830 | ) | $ | 6,270 | ||||||
The aggregate amortization expense related to acquired intangible assets totaled $1.6 million, $0.8 million, and $0.4 million for fiscal 2009, 2008, and 2007. In fiscal 2008, the Company wrote off unamortized intangible assets of $74,000 related to workforce and customer lists acquired in 1999 from Mentor Graphics Corporation’s Physical Libraries Business because these assets had been fully utilized.
Estimated amortization expense of intangible assets for the next five fiscal years and all years thereafter are as follows (in thousands):
| Estimated Amortization Expense | |||
| 2010 |
$ | 6,998 | |
| 2011 |
6,965 | ||
| 2012 |
6,543 | ||
| 2013 |
5,579 | ||
| 2014 |
3,255 | ||
| Thereafter |
305 | ||
| Total |
$ | 29,645 | |
Accrued expenses are as follows (in thousands):
| September 30, | ||||||
| 2009 | 2008 | |||||
| Accrued expenses: |
||||||
| Accrued payroll and related expenses |
$ | 7,637 | $ | 3,582 | ||
| Accrued restructuring |
4,177 | 4 | ||||
| Other accruals |
6,899 | 2,092 | ||||
| Total |
$ | 18,713 | $ | 5,678 | ||
The balance of accumulated other comprehensive income is as follows (in thousands):
| September 30, | ||||||||
| 2009 | 2008 | |||||||
| Accumulated other comprehensive income (loss): |
||||||||
| Unrealized loss on investments |
$ | (5 | ) | $ | (155 | ) | ||
| Cumulative translation adjustment |
(124 | ) | 362 | |||||
| Total |
$ | (129 | ) | $ | 207 | |||
81
Table of Contents
VIRAGE LOGIC CORPORATION
NOTES TO CONSOLIDATED FINANCIAL STATEMENTS—(Continued)
Note 4. Business Combinations
Fiscal Year 2009 Acquisition
ARC International plc
On September 15, 2009, the Company purchased 130,792,339 ordinary shares of ARC International, a leading provider of microprocessor IP and solutions to OEM and semiconductor companies globally, representing a 84.68% ownership stake, for approximately £21.3 million, or approximately $35.4 million. The ARC configurable 32-bit processor cores and vertical application solutions complement Virage Logic’s broad portfolio of semiconductor IP and offer System-on-Chip (SoC) designers a single trusted source for highly differentiated IP. The acquisition expands Virage Logic’s ability to serve the global semiconductor market by complementing its extensive portfolio of physical IP and standards-based advanced interface IP solutions with ARC’s widely used processor IP, a necessary component for complex SoC integrated circuits.
As of September 15, 2009, the Company acquired 84.68% of ARC, which resulted in a minority interest of 15.32% or $3.0 million. Minority interests are third-party equity ownership interests in a controlled entity that are not related to the entity’s controlling owner. Minority interests are established at historical carryover basis in purchase accounting. As the Company increased their ownership of ARC through September 30, 2009, the acquired or increased ownership obtained was accounted for by “stepping-up” ARC’s basis from historical cost to fair value for the portion of assets acquired and liabilities assumed based on the percentage interest acquired. Any outstanding minority interest was accounted for based on the historical cost basis of the minority interest.
As of September 15, 2009, the total purchase price was comprised of (in thousands):
| Cash paid for shares |
$ | 35,271 | |
| Fair value of options assumed |
75 | ||
| Transaction costs |
2,290 | ||
| Total purchase price |
$ | 37,636 | |
The purchase price was allocated to ARC’s net tangible and identifiable intangible assets based on their estimated fair values as of September 15, 2009. The excess of the purchase price over the fair values of net tangible and identifiable intangible assets resulted in goodwill of $9.5 million.
The allocation of purchase price was based on management’s estimates of the value of the tangible and intangible assets acquired and liabilities assumed.
The acquisition of 84.68% of ARC’s outstanding shares of common stock was accounted for under the purchase method of accounting. Under the purchase method of accounting, the total purchase price is allocated to the net tangible and intangible assets based on their estimated fair value as of the date of the completion of the acquisition. Management’s estimates of fair value are based upon assumptions believed to be reasonable, but which are inherently uncertain and unpredictable. Such valuations require management to make significant estimates and assumptions, especially with respect to intangible assets.
82
Table of Contents
VIRAGE LOGIC CORPORATION
NOTES TO CONSOLIDATED FINANCIAL STATEMENTS—(Continued)
The following table summarizes the components of the total purchase price and the estimated allocation (in thousands), based on a preliminary valuation of the fair value of the assets and liabilities acquired:
| Existing technology |
$ | 12,025 | ||
| Customer contracts and related relationships |
7,537 | |||
| Order backlog |
1,863 | |||
| Trademarks and trade names |
677 | |||
| Net working capital |
6,006 | |||
| Property, plant and equipment, net |
3,454 | |||
| Other long-term assets |
613 | |||
| Other long-term accruals |
(3,992 | ) | ||
| Goodwill |
9,453 | |||
| Total purchase price |
$ | 37,636 | ||
From September 16 through September 30, 2009, the Company acquired an additional 15,333,789 shares for an aggregate ownership of 94.62% of the total shares as of September 30, 2009, which decreased minority interest from $3.0 million to $1.0 million and increased goodwill to $11.0 million. The goodwill is not expected to be deductible for tax purposes.
The $22.8 million of acquired intangible assets the Company recorded as of September 30, 2009 in connection with the acquisition is expected to be amortized using an estimated life between three to eight years depending on the nature of assets. The weighted average amortization period for the intangible assets is 4.6 years. The Company accounted for this acquisition as a business combination. The results of operations and the estimated fair values of the assets acquired and liabilities assumed has been included in the Company’s consolidated financial statements from the date of acquisition. The financial results of ARC prior to the acquisition are material for purposes of pro forma financial disclosures.
The following unaudited pro forma information presents a summary of the Company’s consolidated results of operations as if ARC acquisition had taken place at the beginning of each period presented (in thousands, except per share amounts):
| September 30, | ||||||||
| (Unaudited) | ||||||||
| 2009 | 2008(*) | |||||||
| Total revenues |
$ | 69,370 | $ | 89,365 | ||||
| Net loss |
(56,909 | ) | (21,191 | ) | ||||
| Net loss per share: |
||||||||
| Basic |
$ | (2.48 | ) | $ | (0.90 | ) | ||
| Diluted |
$ | (2.48 | ) | $ | (0.90 | ) | ||
| Shares used in per share calculations: |
||||||||
| Basic |
22,979 | 23,432 | ||||||
| Diluted |
22,979 | 23,432 | ||||||
| (*) | The unaudited pro forma information for the year ended September 30, 2008 combines the historical consolidated statement of operations of the Parent for the year ended September 30, 2008 and the historical consolidated statement of operations of ARC for the year ended December 31, 2008, giving effect to the acquisition as if it had been completed on October 1, 2007. Although the respective fiscal year end periods of the Parent and ARC are different, such periods end within 93 days of each other and, therefore, are combined for presentation as permitted under Rule 11.02 of Regulation S-X. |
83
Table of Contents
VIRAGE LOGIC CORPORATION
NOTES TO CONSOLIDATED FINANCIAL STATEMENTS—(Continued)
Fiscal Year 2008 Acquisition
Non-Volatile Memory Product Line of Impinj
On June 26, 2008, the Company acquired the logic NVM IP product line of Impinj, a provider of radio frequency identification (RFID) solutions. The acquisition extends the Company’s embedded memory leadership position in the rapidly growing NVM embedded memory market for standard CMOS processes. The Company believes the acquisition of Impinj’s logic NVM IP business represents another element toward attainment of its core vision of establishing the Company as a broad line supplier of highly differentiated physical and application specific IP to the semiconductor industry.
The purchase was an all-cash transaction for a price of $5.2 million for Impinj’s net assets related to the NVM IP business. In addition to the cash consideration paid to Impinj, the Company also incurred an additional $258,000 of direct acquisition costs. The $0.2 million of goodwill the Company recorded in connection with the acquisition is expected to be deductible for income tax purposes. The $4.5 million of acquired intangible assets the Company recorded in connection with the acquisition is expected to be amortized using an estimated life between six to ten years depending on the type of assets. The weighted average amortization period for the intangible assets is 6.2 years. The Company accounted for this acquisition as a business combination. The results of operations and the estimated fair values of the assets acquired and liabilities assumed has been included in the Company’s consolidated financial statements from the date of acquisition. The financial results of the logic NVM IP product line of Impinj prior to the acquisition are immaterial for purposes of pro forma financial disclosures.
The allocation of the purchase price to Impinj’s tangible and identifiable intangible assets acquired and liabilities assumed was based on their estimated fair values as of the date of acquisition. The excess of the purchase price over the tangible and identifiable intangible assets acquired and liabilities assumed has been allocated to goodwill. The amount allocated to goodwill was $0.2 million as of September 30, 2008.
The following tables summarize the components of the total purchase price and the estimated allocation (in thousands):
| Allocation | |||
| Intangible assets |
$ | 4,500 | |
| Goodwill |
249 | ||
| In-process research and development |
200 | ||
| Accounts receivable |
476 | ||
| Property, plant and equipment |
33 | ||
| Total consideration |
$ | 5,458 | |
The Company determined the valuation of the identifiable intangible assets using future cash flow assumptions. The amounts allocated to the identifiable intangible assets were determined through established valuation techniques accepted in the technology industry.
In connection with this acquisition, the Company recorded an expense of $0.2 million in fiscal 2008 for the write-off of acquired in-process research and development. The purchase price allocated to acquired in-process research and development was determined through established valuation techniques. The acquired in-process research and development was immediately expensed because technological feasibility had not been established, and no future alternative use existed. The write-off of acquired in-process research and development is a component of research and development expense in the consolidated statements of operations.
84
Table of Contents
VIRAGE LOGIC CORPORATION
NOTES TO CONSOLIDATED FINANCIAL STATEMENTS—(Continued)
Fiscal Year 2007 Acquisition
Ingot Systems, Inc
On August 14, 2007, the Company acquired Ingot Systems, a Santa Clara based provider of critical functional IP and design services to the semiconductor industry with global design centers located in the United States and India. The acquisition expands the Company’s ability to serve chosen markets by adding new products and services required in the rapid development of System-on-Chip (SoC) integrated circuits to the Company’s current family of physical IP products including memory compilers, logic libraries and related development tools.
The aggregate up front purchase price was $2.8 million, which included the payment of cash for common stock and the cancellation of options, and acquisition related costs. In addition, the former Ingot shareholders and employees have a potential for a series of earn-out and performance bonus payments totaling up to $8 million through the end of the Company’s fiscal 2009, provided that certain technology and product order milestones are achieved. The Company paid $1.7 million of earn-out bonus payments based on targets achieved in fiscal 2008. Earn-out payments were treated as additional compensation when met as the milestones were linked to continued employment. The $1.6 million of goodwill the Company recorded in connection with the acquisition is not expected to be deductible for income tax purposes. The $1.1 million of acquired intangible assets the Company recorded in connection with the acquisition is expected to be amortized using an estimated life of four years. The Company accounted for this acquisition as a business combination. The results of operations and the estimated fair values of the assets acquired and liabilities assumed has been included in the Company’s consolidated financial statements from the date of acquisition. The financial results of Ingot Systems prior to the acquisition are immaterial for purposes of pro forma financial disclosures.
The following tables summarize the components of the total purchase price and the estimated allocation (in thousands):
| Allocation | |||
| Cash paid for common stock |
$ | 1,754 | |
| Cash paid for vested options |
178 | ||
| Other estimated acquisition related costs |
840 | ||
| Total Purchase Price |
$ | 2,772 | |
The purchase price allocation is as follows (in thousands):
| Allocation | ||||
| Intangible assets |
$ | 1,100 | ||
| Net liabilities assumed |
(1 | ) | ||
| Goodwill |
1,573 | |||
| In-process research and development |
100 | |||
| Total consideration |
$ | 2,772 | ||
The net tangible assets acquired and liabilities assumed in the acquisition were recorded at fair value, which approximates the carrying amount as of the acquisition date. The Company determined the valuation of the identifiable intangible assets using future revenue assumptions. The amounts allocated to the identifiable intangible assets were determined through established valuation techniques accepted in the technology industry.
85
Table of Contents
VIRAGE LOGIC CORPORATION
NOTES TO CONSOLIDATED FINANCIAL STATEMENTS—(Continued)
In connection with this acquisition, the Company recorded an expense of $0.1 million in fiscal year 2007 for the write-off of acquired in-process technology. The purchase price allocated to acquired in-process technology was determined through established valuation techniques. The acquired in-process technology was immediately expensed because technological feasibility had not been established, and no future alternative use existed. The write-off of acquired in-process technology is a component of research and development expense in the consolidated statements of operations.
Note 5. Restructuring Charges
During fiscal 2007, the Company initiated a plan of restructuring in an effort to reduce operating expenses and improve operating margins and cash flows. The restructuring plan was intended to decrease costs through workforce reductions and facility and resource consolidation in order to improve the Company’s cost structure. The Company reduced its workforce by approximately 23 employees throughout the Company. Costs resulting from the restructuring plan included severance payments, severance-related benefits, lease costs associated with a vacated facility, and charges for assets written off as a result of the restructuring plan. Facility closure costs included in the restructuring were comprised of payments required under the lease less any applicable estimated sublease income after the property was abandoned. All amounts were paid under this plan by September 30, 2008.
During fiscal 2008, the Company initiated a plan of restructuring in an effort to reduce operating expenses and improve operating margins and cash flows. The restructuring plan was intended to decrease costs through job eliminations. The Company reduced its workforce by approximately 13 employees primarily in engineering. Costs resulting from the restructuring plan included severance payments and severance-related benefits. Total restructuring expense was $316,000 of which $312,000 was paid as of September 30, 2008. The remaining balance of $4,000 as of September 30, 2008 was paid off in the first quarter of fiscal 2009.
During fiscal 2009, the Company initiated a plan of restructuring in an effort to reduce operating expenses and improve operating margins and cash flows. The restructuring plan was intended to decrease costs through job eliminations. The Company reduced its headcount by 13% primarily in engineering. The restructuring plan resulted in the reduction of 60 employees and closing of its R&D centers in New Jersey and Minnesota. Costs resulting from the restructuring plan included severance payments, severance-related benefits, lease termination charges, and other professional services. Total restructuring expense was $1.5 million of which $1.2 million was paid as of September 30, 2009. Total restructuring costs accrued as of September 30, 2009 and September 30, 2008 were $0.3 million and $4,000, respectively, which were recorded in accrued expenses on the consolidated balance sheets. Substantially all of the accrued restructuring balance of $0.3 million as of September 30, 2009 will be paid in fiscal 2010. Approximately $30,000 of the $0.3 million accrued restructuring balance will be paid in the first quarter of fiscal 2011.
The following table summarizes restructuring activity for fiscal 2009 and fiscal 2008 as follows (in thousands):
| Severance | Other | Facility | Total | |||||||||||||
| Balance at September 30, 2007 |
$ | 82 | $ | — | $ | (8 | ) | $ | 74 | |||||||
| Restructuring expense |
308 | — | 8 | 316 | ||||||||||||
| Cash payments |
(386 | ) | — | — | (386 | ) | ||||||||||
| Balance at September 30, 2008 |
4 | — | — | 4 | ||||||||||||
| Restructuring expense |
1,133 | 36 | 319 | 1,488 | ||||||||||||
| Other adjustment |
25 | 25 | ||||||||||||||
| Cash payments |
(1,107 | ) | (29 | ) | (115 | ) | (1,251 | ) | ||||||||
| Balance at September 30, 2009 |
$ | 30 | $ | 7 | $ | 229 | $ | 266 | ||||||||
86
Table of Contents
VIRAGE LOGIC CORPORATION
NOTES TO CONSOLIDATED FINANCIAL STATEMENTS—(Continued)
Estimated Acquisition-Related Restructuring Costs Accounted for as Purchase Price
We recorded approximately $2.8 million of restructuring costs in connection with acquisition of ARC organization, which included $2.2 million employee severance and $0.6 million facility consolidation costs. These costs were recognized as a liability assumed in the ARC purchase price allocation and, accordingly, have resulted in an increase to the purchase price. A portion of the restructuring liabilities related to facility lease commitments is classified as long-term liabilities in the accompanying balance sheets. No cash payment was made in fiscal 2009. Approximately $2.6 million of the accrued restructuring balance of $2.8 million as of September 30, 2009 will be paid in fiscal 2010. The remaining $0.2 million of facility-related expenses will be paid through fiscal 2012.
Estimated restructuring expenses may change as management executes the approved plan. Decreases to the estimates of executing the currently approved plans associated with acquisition activities of ARC are recorded as an adjustment to goodwill indefinitely, whereas increases to the estimates are recorded as an adjustment to goodwill during the purchase price allocation period (generally within one year of the acquisition date) and as operating expenses thereafter.
In addition, the Company acquired $2.2 million accrued restructuring liability as part of the liabilities assumed in the acquisition of ARC International. ARC initiated restructuring plan in both December 2008 and July 2009 prior to the acquisition. The restructuring charges included personnel and leased facilities. The remaining balance is primarily composed of the remaining lease payments. Approximately $1.3 million of the accrued restructuring balance of $2.2 million as of September 30, 2009 will be paid in fiscal 2010. The remaining $0.9 million of facility-related expenses will be paid through fiscal 2012.
The following table summarizes restructuring activity for fiscal 2009 as follows (in thousands):
| Severance | Facility | Total | ||||||||||
| Balance at September 15, 2009 |
$ | 274 | $ | 2,042 | $ | 2,316 | ||||||
| Restructuring expense |
(36 | ) | 47 | 11 | ||||||||
| Cash payments |
(71 | ) | (81 | ) | (152 | ) | ||||||
| Balance at September 30, 2009 |
$ | 168 | $ | 2,008 | $ | 2,175 | ||||||
Note 6. Commitments and Contingencies
Except for the building in Armenia, the Company leases its facilities under operating leases. Rent expense under operating leases was approximately $1.6 million, $1.5 million and $1.5 million for the fiscal years ended September 30, 2009, 2008 and 2007, respectively.
The following table summarizes the Company’s contractual obligations (dollars in thousands):
| Contractual Obligations |
Total | Less than 1 Year |
1-3 Years |
4-5 Years |
After 5 Years | ||||||||||
| Operating lease obligations(1) |
$ | 7,585 | $ | 2,560 | $ | 2,531 | $ | 1,305 | $ | 1,189 | |||||
| Capital lease obligations |
189 | 131 | 58 | — | — | ||||||||||
| Purchase obligations(2) |
12,661 | 8,049 | 3,244 | 1,250 | 118 | ||||||||||
| Total operating lease and purchase obligations |
$ | 20,435 | $ | 10,740 | $ | 5,833 | $ | 2,555 | $ | 1,307 | |||||
87
Table of Contents
VIRAGE LOGIC CORPORATION
NOTES TO CONSOLIDATED FINANCIAL STATEMENTS—(Continued)
| (1) | Includes sale-leaseback transactions of computer equipment, which were executed during the quarter ended June 30, 2009. No material gain or loss resulted from these transactions. |
| (2) | Reflects amounts payable under contracts primarily for product development software licenses, maintenance and payments due under other technology licensing agreements. |
Aggregate future minimum lease payments under leases as of September 30, 2009 are as follows (in thousands):
| Contractual Obligations |
Operating Leases |
Capital Lease |
Total Leases | ||||||
| 2010 |
$ | 2,560 | $ | 131 | $ | 2,691 | |||
| 2011 |
1,639 | 58 | 1,697 | ||||||
| 2012 |
892 | — | 892 | ||||||
| 2013 |
795 | — | 795 | ||||||
| 2014 |
510 | — | 510 | ||||||
| Thereafter |
1,189 | — | 1,189 | ||||||
| Total minimum lease payments |
$ | 7,585 | $ | 189 | $ | 7,774 | |||
Indemnifications. The Company enters into standard license agreements in its ordinary course of business. Pursuant to these agreements, the Company agrees to indemnify its customers for losses suffered or incurred by them as a result of any patent, copyright, or other IP infringement claim by any third party with respect to the Company’s products. These agreements generally have perpetual terms. The maximum amount of indemnification the Company could be required to make under these agreements is generally limited to the license fees received by the Company. The Company estimates the fair value of its indemnification obligation as insignificant, based upon its history of litigation concerning product and patent infringement claims. Accordingly, the Company has no liabilities recorded for indemnification under these agreements as of September 30, 2009, and 2008.
The Company has agreements whereby its officers and directors are indemnified for certain events or occurrences while the officer or director is, or was serving, at the Company’s request in such capacity. The maximum potential amount of future payments the Company could be required to make under these indemnification agreements is unlimited; however, the Company has a directors and officers insurance policy that reduces its exposure and enables the Company to recover a portion of any future amounts paid. As a result of its insurance policy coverage, the Company believes the estimated fair value of these indemnification agreements is minimal. Currently, the Company has no liabilities recorded for these agreements as of September 30, 2009 and 2008.
Warranties. The Company offers its customers a warranty that its software products will substantially conform to their functional specifications. To date, there have been no payments or material costs incurred related to fulfilling these warranty obligations. Accordingly, the Company has no liabilities recorded for these warranties as of September 30, 2009 and 2008. The Company assesses the need for a warranty reserve on a quarterly basis and there can be no guarantee that a warranty reserve will not become necessary in the future.
Litigation. The Company is a party to legal proceedings and claims of various types in the ordinary course of business. The Company believes based on information currently available to management that the resolution of such claims will not have a material adverse impact on its consolidated financial position or results of operations.
88
Table of Contents
VIRAGE LOGIC CORPORATION
NOTES TO CONSOLIDATED FINANCIAL STATEMENTS—(Continued)
Note 7. Stockholders’ Equity
Common Stock
As of September 30, 2009, common stock was reserved for issuance as follows:
| Equity Incentive Plans |
5,905,495 | |
| Total |
5,905,495 | |
Restricted Stock Units (“RSU”)
During the first quarter of fiscal year 2007, the Company began issuing restricted stock unit awards as an additional form of equity compensation to its employees and officers. Restricted stock units generally vest over a two or four year period and unvested restricted stock units are forfeited and cancelled as of the date that employment terminates. Restricted stock units are settled in shares of the Company’s common stock upon exercise after vesting. The cost of restricted stock unit awards is determined using the fair value of the Company’s common stock on the date of the grant, and compensation expense is recognized over the vesting period.
During the fiscal years ended September 30, 2009 and 2008, the Company issued 301,160 shares and 49,561 shares, respectively, as a result of RSU exercises.
The following table summarizes the activity of the Company’s unvested restricted stock units and changes through September 30, 2009:
| Restricted Stock Units | ||||||
| Number of shares |
Weighted- average grant- date fair value | |||||
| Nonvested as of September 30, 2007 |
155,120 | $ | 8.29 | |||
| RSU granted |
988,671 | $ | 6.77 | |||
| RSU vested |
(76,254 | ) | $ | 8.14 | ||
| RSU canceled |
(51,275 | ) | $ | 7.95 | ||
| Nonvested as of September 30, 2008 |
1,016,262 | $ | 6.84 | |||
| RSU granted |
217,962 | $ | 3.82 | |||
| RSU vested |
(406,834 | ) | $ | 6.26 | ||
| RSU canceled |
(141,076 | ) | $ | 7.36 | ||
| Nonvested as of September 30, 2009 |
686,314 | $ | 6.11 | |||
Share-based compensation cost for restricted stock units for the fiscal year ended September 30, 2009 was $2.4 million. As of September 30, 2009, the total unrecognized compensation cost net of forfeitures relate to unvested awards not yet recognized is $2.0 million and is expected to be amortized over a weighted average period of 1.95 years.
Equity Incentive Plans
In March 2001, the stockholders approved an amendment to the Company’s 1997 Equity Incentive Plan (1997 Plan) and in February 2002, the stockholders approved the adoption of the 2002 Equity Incentive Plan (2002 Plan). In May 2002, in connection with Virage Logic’s acquisition of In-Chip Systems, Virage Logic assumed In-Chip’s 2001 Incentive and Non-statutory Stock Option Plan (2001 Plan), and all options outstanding
89
Table of Contents
VIRAGE LOGIC CORPORATION
NOTES TO CONSOLIDATED FINANCIAL STATEMENTS—(Continued)
under the plan. Under the 2001 Plan, the maximum number of options that can be exercised for common stock shares is 585,520. The plans provide for the granting of incentive stock options, nonstatutory stock options and stock awards as determined by the administrators of such plans. The 1997 Plan has expired. However, it remains operative as to awards that remain outstanding under the plan. The 2001 Plan allows for the grant of options only to former In-Chip employees. Under the terms of the 2002 Plan, the exercise price of options will not be less than 100% of the fair market value of the shares on the date of grant. In addition, under the plans, the grant of incentive stock options granted to an employee, who, at the time of grant, owns stock representing more than 10% of the voting power of all classes of the stock of the Company, shall be no less than 110% of the fair market value of the common stock on the date of grant and may have a term of no longer than five years. All option grants may be exercisable within the times or upon the events determined by the Board of Directors. The term of each option grant (other than with respect to ten percent stockholders) will be no more than ten years.
Rights to immediately purchase stock may also be granted under these plans with terms, conditions, and restrictions determined by the administrators of the 2001 Plan and the 2002 Plan. During the fiscal year ended September 30, 2009, a total of 388,657 shares expired unissued under the 1997 Plan.
In November 2006, the Company began issuing SSARs under the 2002 Plan which provide the holder the right to receive an amount settled in shares of its common stock at the time of the exercise. Under the Company’s equity incentive plans, stock options and SSARs generally have a vesting period of four years, are exercisable for a period not to exceed ten years from the date of grant and are granted at prices not less than the fair value of the Company’s common stock at the time of grant.
Information with respect to the Equity Incentive Plans is summarized as follows:
| Shares Available For Grant |
Number of Options/SSARs Outstanding |
Weighted Average Exercise Price | |||||||
| Balance as of September 30, 2006 |
1,606,423 | 5,631,700 | $ | 10.14 | |||||
| Options and SSARs granted |
(1,571,150 | ) | 1,571,150 | $ | 7.71 | ||||
| RSUs granted |
(195,615 | ) | — | — | |||||
| Options and SSARs exercised |
— | (152,241 | ) | $ | 5.37 | ||||
| Options and SSARs canceled |
1,281,177 | (1,281,177 | ) | $ | 10.90 | ||||
| RSUs cancelled |
40,495 | — | — | ||||||
| Awards expired (unissued) |
(190,269 | ) | — | — | |||||
| Balance as of September 30, 2007 |
971,061 | 5,769,432 | $ | 9.46 | |||||
| Options and SSARs granted |
(1,007,094 | ) | 1,007,094 | $ | 7.25 | ||||
| RSUs granted |
(988,671 | ) | — | — | |||||
| Options and SSARs exercised |
— | (408,877 | ) | $ | 4.81 | ||||
| Options and SSARs canceled |
2,389,923 | (2,389,923 | ) | $ | 11.03 | ||||
| RSUs cancelled |
51,275 | — | — | ||||||
| Awards expired (unissued) |
(636,309 | ) | — | — | |||||
| Balance as of September 30, 2008 |
780,185 | 3,977,726 | $ | 8.43 | |||||
| Additional shares approved |
1,000,000 | — | — | ||||||
| Options and SSARs granted |
(455,113 | ) | 455,113 | $ | 3.53 | ||||
| RSUs granted |
(217,962 | ) | — | — | |||||
| Options and SSARs exercised |
— | (73,187 | ) | $ | 0.65 | ||||
| Options and SSARs canceled |
750,953 | (750,953 | ) | $ | 8.60 | ||||
| RSUs cancelled |
141,076 | — | — | ||||||
| Awards expired (unissued) |
(388,657 | ) | — | — | |||||
| Balance as of September 30, 2009 |
1,610,482 | 3,608,699 | $ | 7.94 | |||||
90
Table of Contents
VIRAGE LOGIC CORPORATION
NOTES TO CONSOLIDATED FINANCIAL STATEMENTS—(Continued)
The following table summarizes information about stock options and SSARs outstanding and exercisable as of September 30, 2009:
| Awards Outstanding | Awards Exercisable | ||||||||||||||||||||
| Range of Exercise Prices |
Number of Shares |
Weighted Average Remaining Contractual Life |
Weighted Average Exercise Price |
Aggregate Intrinsic Value |
Number of Shares |
Weighted Average Remaining Contractual Life |
Weighted Average Exercise Price |
Aggregate Intrinsic Value | |||||||||||||
| (In years) | (In thousands) | (In years) | (In thousands) | ||||||||||||||||||
| $ 0.70 – $ 3.75 |
414,803 | 8.32 | $ | 3.16 | $ | 849 | 46,465 | 1.36 | $ | 2.45 | $ | 128 | |||||||||
| $ 4.00 – $ 5.61 |
456,627 | 5.54 | $ | 4.99 | $ | 177 | 287,498 | 3.56 | $ | 5.10 | $ | 101 | |||||||||
| $ 5.65 – $ 6.94 |
420,453 | 7.53 | $ | 6.45 | $ | — | 186,906 | 8.33 | $ | 6.51 | $ | — | |||||||||
| $ 6.96 – $ 7.47 |
505,723 | 4.66 | $ | 7.31 | $ | — | 421,118 | 4.15 | $ | 7.37 | $ | — | |||||||||
| $ 7.48 – $ 8.63 |
449,508 | 6.32 | $ | 8.17 | $ | — | 386,176 | 5.81 | $ | 8.13 | $ | — | |||||||||
| $ 8.65 – $ 8.87 |
385,705 | 6.16 | $ | 8.82 | $ | — | 300,414 | 6.11 | $ | 8.81 | $ | — | |||||||||
| $ 8.91 – $10.30 |
528,050 | 5.69 | $ | 9.81 | $ | — | 492,562 | 5.79 | $ | 9.85 | $ | — | |||||||||
| $10.31 – $16.55 |
422,080 | 3.41 | $ | 14.08 | $ | — | 421,943 | 3.66 | $ | 14.08 | $ | — | |||||||||
| $16.70 – $22.37 |
25,500 | 5.21 | $ | 16.99 | $ | — | 25,500 | 5.46 | $ | 16.99 | $ | — | |||||||||
| $22.81 – $22.81 |
250 | 2.28 | $ | 22.81 | $ | — | 250 | 2.53 | $ | 22.81 | $ | — | |||||||||
| Total |
3,608,699 | * | 5.90 | $ | 7.94 | $ | 1,026 | 2,568,832 | 5.06 | $ | 8.92 | $ | 229 | ||||||||
|
* Table of awards outstanding does not include 686,314 unvested restricted stock units. | |||||||||||||||||||||
| Vested and expected to vest as of September 30, 2009 |
3,161,678 | 5.54 | $ | 8.25 | $ | 726 | |||||||||||||||
The aggregate intrinsic value in the table above represents the total pretax intrinsic value, based on the Company’s closing stock price of $5.21 as of September 30, 2009, which would have been received by the option and SSAR holders had all option holders exercised their options and SSARs as of that date. The total number of in-the-money options and SSARs exercisable as of September 30, 2009 was 0.2 million.
The total intrinsic value of employee stock options and SSARs exercised during the fiscal years ended September 30, 2009, 2008 and 2007 were $0.2 million, $1.1 million and $0.4 million, respectively. The total cash received from employees as a result of employee stock option and SSAR exercises during the fiscal years ended September 30, 2009, 2008 and 2007 were $48,000, $2.0 million and $0.9 million, respectively.
Employee Stock Purchase Plans
In April 2000, the Board of Directors approved the adoption of the 2000 Employee Stock Purchase Plan (2000 Purchase Plan). In July 2001, the Board of Directors approved the adoption of the 2001 Foreign Subsidiary Employee Stock Purchase Plan (2001 Foreign Plan) as a sub-plan of the 2000. During fiscal years 2009, 2008 and 2007, there were no transfers from the 2000 Purchase Plan share reserve to the 2001 Foreign Plan reserve.
Under the Company’s 2000 Purchase Plan and 2001 Foreign Plan, the employees purchased 10,954 and 24,559 shares during the fiscal years ended September 30, 2008 and 2007, respectively. The employee stock purchase plan was terminated on February 16, 2007.
91
Table of Contents
VIRAGE LOGIC CORPORATION
NOTES TO CONSOLIDATED FINANCIAL STATEMENTS—(Continued)
Note 8. Related Party Transactions
Robert Smith, who is the Company’s board member, was a member of the Board of Directors at Ubicom, Inc. and PLX Technology, Inc. Revenue from Ubicom was approximately $133,000, $102,000 and $137,000 for the fiscal years ended September 30, 2009, 2008 and 2007, respectively. The account receivable balance for Ubicom was $188,000, $0 and $0 for the fiscal years ended September 30, 2009, 2008 and 2007, respectively. Revenue from PLX Technology was approximately $73,000, $205,000 and $288,000 for the fiscal years ended September 30, 2009, 2008 and 2007. The account receivable balance for PLX was $127,000, $0 and $0 for the fiscal years ended September 30, 2009, 2008 and 2007, respectively. Cathal Phelan, who is the Company’s board member, was the Chief Technical Officer at Cypress Semiconductor. Daniel McCranie who is the Company’s Executive Chairman, serves as a member of the Board of Directors at Cypress Semiconductor. Revenue from Cypress Semiconductor was approximately $0, $460,000 and $141,000 for the fiscal years ended September 30, 2009, 2008 and 2007, respectively. The account receivable balance for Cypress Semiconductor was $0, $19,000 and $85,000 for the fiscal years ended September 30, 2009, 2008 and 2007, respectively. Mr. McCranie also serves as Chairman of the Board for ON Semiconductor. Revenue from ON Semiconductor was approximately $145,000, $264,000 and $100,000 for the fiscal years ended September 30, 2009, 2008 and 2007, respectively. The account receivable balance for ON Semiconductor was $40,000, $0 and $0 for the fiscal years ended September 30, 2009, 2008 and 2007, respectively.
Note 9. Agreements with Foundries
The Company has entered into agreements with third-party semiconductor foundries in Asia, under which the Company has agreed to develop memory, logic and I/O elements for certain of the foundries’ manufacturing processes and in return the foundries are obligated to pay the Company royalties on sales of silicon chips manufactured by the foundries for the Company’s fabless customers. For the fiscal years ended September 30, 2009, 2008, and 2007, total royalty revenues were $8.1 million, $12.1 million, and $12.1 million, respectively.
Note 10. Income Taxes
The domestic and foreign components of income (loss) before taxes are as follows:
| Year Ended September 30, | ||||||||||||
| 2009 | 2008 | 2007 | ||||||||||
| (In thousands) | ||||||||||||
| Domestic |
$ | (28,788 | ) | $ | (499 | ) | $ | (8,587 | ) | |||
| Foreign |
116 | 946 | 740 | |||||||||
| Total |
$ | (28,672 | ) | $ | 447 | $ | (7,847 | ) | ||||
92
Table of Contents
VIRAGE LOGIC CORPORATION
NOTES TO CONSOLIDATED FINANCIAL STATEMENTS—(Continued)
The income tax provision (benefit) for the fiscal years ended September 30, 2009, 2008, and 2007 consists of the following:
| Year Ended September 30, | ||||||||||||
| 2009 | 2008 | 2007 | ||||||||||
| (In thousands) | ||||||||||||
| Current: |
||||||||||||
| Federal |
$ | (864 | ) | $ | 1,122 | $ | — | |||||
| State |
(557 | ) | 186 | 80 | ||||||||
| Foreign |
529 | 171 | 1,314 | |||||||||
| Deferred: |
||||||||||||
| Federal |
3,634 | (1,222 | ) | (4,060 | ) | |||||||
| State |
2,757 | (364 | ) | (576 | ) | |||||||
| Foreign |
— | — | — | |||||||||
| $ | 5,499 | $ | (107 | ) | $ | (3,242 | ) | |||||
The income tax provision (benefit) differed from the amounts computed at the US statutory federal income tax rate of 34% in 2009, 2008, and 2007 as a result of the following:
| Year Ended September 30, | ||||||||||||
| 2009 | 2008 | 2007 | ||||||||||
| (In thousands) | ||||||||||||
| Federal tax at statutory rate |
$ | (9,748 | ) | $ | 143 | $ | (2,668 | ) | ||||
| State taxes |
(1,033 | ) | (400 | ) | (523 | ) | ||||||
| Share-based compensation |
670 | 48 | 649 | |||||||||
| Research and development credit |
(598 | ) | (187 | ) | (738 | ) | ||||||
| Foreign taxes, net of credit |
(611 | ) | (3 | ) | 25 | |||||||
| Change in valuation allowance |
12,430 | — | — | |||||||||
| Goodwill impairment |
3,897 | — | — | |||||||||
| Other |
492 | 292 | 13 | |||||||||
| Total |
$ | 5,499 | $ | (107 | ) | $ | (3,242 | ) | ||||
93
Table of Contents
VIRAGE LOGIC CORPORATION
NOTES TO CONSOLIDATED FINANCIAL STATEMENTS—(Continued)
Significant components of the Company’s deferred tax assets (liabilities) are as follows:
| Year Ended September 30, | ||||||||
| 2009 | 2008 | |||||||
| (In thousands) | ||||||||
| Deferred tax assets current: |
||||||||
| Compensation accrual |
$ | 366 | $ | 261 | ||||
| Other accruals/reserves not currently deductible |
889 | 867 | ||||||
| Valuation allowance |
(839 | ) | — | |||||
| Total Deferred Tax assets—current |
416 | 1,128 | ||||||
| Deferred tax assets non-current: |
||||||||
| Deferred revenue |
126 | 127 | ||||||
| Net operating loss carryforwards |
19,517 | 687 | ||||||
| Share-based compensation |
2,448 | 2,623 | ||||||
| Research and development credits |
7,353 | 6,390 | ||||||
| Foreign Tax Credit |
6,215 | 4,906 | ||||||
| Depreciation and amortization |
(2,877 | ) | (58 | ) | ||||
| Other |
194 | — | ||||||
| Valuation allowance |
(24,118 | ) | — | |||||
| Total deferred tax assets—long-term |
$ | 8,858 | $ | 14,675 | ||||
| Total deferred tax assets |
$ | 9,274 | $ | 15,803 | ||||
| Deferred tax liabilities: |
||||||||
| Acquired intangible assets |
$ | (3,156 | ) | $ | — | |||
| Total deferred tax liabilities |
$ | (3,156 | ) | $ | — | |||
The Company provides for the recognition of deferred tax assets if realization of such assets is more likely than not. The Company recorded a deferred tax asset as of September 30, 2009 and 2008 based on the expectation of future taxable income. The Company has determined that the realization of the R&D credits and foreign tax credits to be included in the deferred tax assets is not more likely than not. Based on these facts, the Company has recorded a valuation allowance of $12.4 million against its R&D credits and foreign tax credits. The Company also acquired $11.4 million of fully reserved deferred tax assets through the acquisition of ARC International. Management believes that it is more likely than not that the remaining deferred tax assets will be realized and has determined that no valuation allowance is considered necessary.
For the fiscal year ended September 30, 2009, the Company also has research and development tax credit carryforwards of approximately $6.6 million and $5.5 million for federal and state income tax purposes, respectively. If not utilized, the federal carryforwards will expire in various amounts beginning in 2022. The state tax credits can be carried forward indefinitely.
For the fiscal year ended September 30, 2009, the Company has federal net operating loss carryforwards of approximately $13.7 million which will expire beginning in 2026.
For the fiscal year ended September 30, 2009, the Company also has UK net operating loss carryforwards of approximately $51.4 million which have no expiration date.
For the fiscal year ended September 30, 2009, the Company has foreign tax credit carryforwards of approximately $6.2 million which will expire beginning in 2014.
94
Table of Contents
VIRAGE LOGIC CORPORATION
NOTES TO CONSOLIDATED FINANCIAL STATEMENTS—(Continued)
The Company utilizes a two-step approach for evaluating uncertain tax positions. Step one, Recognition, requires a company to determine if the weight of available evidence indicates that a tax position is more likely than not to be sustained upon audit, including resolution of related appeals or litigation processes, if any. Step two, Measurement, is based on the largest amount of benefit, which is more likely than not to be realized on ultimate settlement. The cumulative effect of adoption on October 1, 2007 is recognized as a change in accounting principle and recorded as an adjustment to the opening balance of retained earnings on the adoption date.
The Company recognized no change in the liability for unrecognized tax benefits related to tax positions taken in prior periods. The Company reclassed $1.1 million to income tax liability in fiscal 2008 due to uncertain tax positions that may not be upheld in the case of a tax audit. The Company’s total gross unrecognized tax benefits as of September 30, 2009 and September 30, 2008 amounted to $4.7 million and $4.2 million. Total amount of unrecognized tax benefits that would affect our effective tax rate if recognized is $0.9 million as of September 30, 2009 and $3.7 million as of September 30, 2008. The Company remains subject to tax examination in the United States from fiscal year ended September 30, 2006 and in its foreign jurisdictions ranging from fiscal year ended September 30, 2001. The Company does not currently anticipate that any significant increase or decrease to unrecognized tax benefits will be recorded during the next 12 months.
A reconciliation of the beginning and ending amount of unrecognized tax benefit is as follows:
| Unrecognized Tax Benefit |
||||
| (In thousands) | ||||
| Balance as of October 1, 2007 |
$ | (3,788 | ) | |
| Gross increases—tax positions in prior period |
(63 | ) | ||
| Gross increases—current-period tax positions |
(321 | ) | ||
| Balance as of October 1, 2008 |
(4,172 | ) | ||
| Settlements/lapse of statute of limitations |
337 | |||
| Gross increases—current-period tax positions |
(828 | ) | ||
| Balance as of September 30, 2009 |
$ | (4,663 | ) | |
The Company’s policy is to include interest and penalties related to unrecognized tax benefits within the Company’s provision for (benefit from) income taxes. As of September 30, 2009, the Company had not accrued any reserve for payment of interest and penalties related to unrecognized tax benefits as any adjustments would be offset by additional credits and net operating losses.
Note 11. Fair Value Disclosure
The Company determines the appropriate classification of securities at the time of purchase. All securities are classified as available-for-sale. The Company’s short-term and long-term investments are carried at fair value, with the unrealized holding gains and losses reported in accumulated other comprehensive income. The Company evaluates declines in market value for potential impairment if the decline results in a value below cost and is determined to be other than temporary. Realized gains and losses and declines in the value judged to be other than temporary are included in other income and expense. The cost of securities sold is based on the specific identification method.
The Company has invested its excess cash in money market accounts, corporate debt, commercial paper, government agency securities and government-sponsored enterprise securities and considers all highly liquid debt instruments purchased with an original maturity of three months or less to be cash equivalents. Investments
95
Table of Contents
VIRAGE LOGIC CORPORATION
NOTES TO CONSOLIDATED FINANCIAL STATEMENTS—(Continued)
with original maturities greater than three months and remaining maturities less than one year are classified as short-term investments. Investments with remaining maturities greater than one year are classified as long-term investments.
The Company defines fair value as the price that would be received from selling an asset or paid to transfer a liability in an orderly transaction between market participants at the measurement date. When determining the fair value measurements for assets and liabilities, which are required to be recorded at fair value, the Company considers the principal or most advantageous market in which the Company would transact and the market-based risk measurements or assumptions that market participants would use in pricing the asset or liability, such as inherent risk, transfer restrictions and credit risk.
The Company applies the following fair value hierarchy, which prioritizes the inputs used to measure fair value into three levels and bases the categorization within the hierarchy upon the lowest level of input that is available and significant to the fair value measurement:
Level 1—Quoted prices in active markets for identical assets or liabilities.
Level 2—Observable inputs other than quoted prices in active markets for identical assets and liabilities, quoted prices for identical or similar assets or liabilities in inactive markets, or other inputs that are observable or can be corroborated by observable market data for substantially the full term of the assets or liabilities.
Level 3—Inputs that are generally unobservable and typically reflect management’s estimates of assumptions that market participants would use in pricing the asset or liability.
The Company’s valuation techniques used to measure the fair value of money market funds and certain marketable equity securities were derived from quoted prices in active markets for identical assets or liabilities. The valuation techniques used to measure the fair value of all other financial instruments, all of which have counterparties with high credit ratings, were valued based on quoted market prices or model driven valuations using significant inputs derived from or corroborated by observable market data.
The following table represents the Company’s fair value hierarchy for its financial assets (cash equivalents and short-term available-for-sale investments) as of September 30, 2009 (in thousands):
| September 30, 2009 | |||||||||
| Fair Value | Level 1 | Level 2 | |||||||
| Assets: |
|||||||||
| U.S. government-sponsored enterprise securities |
$ | 4,551 | $ | — | $ | 4,551 | |||
| Money market funds |
2,851 | 2,851 | — | ||||||
| Commercial paper and certificates of deposit |
2,832 | — | 2,832 | ||||||
| Total financial assets |
$ | 10,234 | $ | 2,851 | $ | 7,383 | |||
Note 12. Stock Repurchase Program
On May 14, 2009, the Company announced that its Board of Directors authorized the extension of the expiration date of the stock repurchase program to repurchase up to $20 million in shares of the Company’s common stock in the open market or negotiated transactions through December 2010. Since the inception of the program in May 2008, the Company has repurchased 890,000 shares for a total of $5.1 million. The Company has not repurchased additional shares since the extension of the program was authorized on May 14, 2009. As of September 30, 2009, the remaining balance available for future stock repurchase was $14.9 million under the Company’s stock repurchase program.
96
Table of Contents
VIRAGE LOGIC CORPORATION
NOTES TO CONSOLIDATED FINANCIAL STATEMENTS—(Continued)
Note 13. Subsequent Events
On November 16, 2009 the Company acquired from NXP B.V., a leading semiconductor company founded by Royal Philips Electronics Inc., certain rights to IP assets associated with selected NXP advanced CMOS libraries, IP blocks and SoC infrastructure along with other classes of semiconductor IP, including approximately 25 associated patent families and certain related equipment. In connection with the acquisition, the Company hired approximately 150 former NXP employees. In exchange for the assets the Company issued 2,500,000 shares of our common stock and paid $188,000 in cash to NXP. The Company also assumed liabilities that arise after the closing relating to the former employees of NXP we hired and assumed certain liabilities of NXP under contracts related to the assets.
In connection with the NXP asset acquisition, the Company entered into three related agreements with NXP. Under an intellectual property transfer and license agreement, (1) the Company is licensing back to NXP the technology, software and associated intellectual property rights included in the assets so that NXP can continue using these rights in its operations, (2) NXP is granting the Company a perpetual, royalty-free license to certain patents and other intellectual property rights of NXP related to the assets and (3) the Company will pay, for a seven-year period following the closing, a royalty to NXP based on the revenue we receive from licensing to third parties the assets the Company acquired from NXP. Under a master license agreement, the Company is licensing to NXP for an initial term of three and one half years substantially all of the pre-existing intellectual property rights the Company controls, in return for which NXP will pay us $20 million over a four-year period in quarterly payments that will decline over time. Under a technology services agreement, the Company will provide NXP with support and engineering services relating to integrated circuit design, for which NXP will pay us $40 million over a four-year period in quarterly payments that will decline over time.
In November 2009, the Company acquired the remaining minority interest in ARC consistent with the terms of cash offer of 16.25 pence per share for a total of $41.6 million. The acquisition resulted in ARC being a wholly-owned subsidiary of the Company.
On December 1, 2009 the Company entered into a loan and security agreement (the “Loan Agreement”) with Silicon Valley Bank. The proceeds under the Loan Agreement may be used for general corporate purposes. The Loan Agreement provides for a two year revolving credit facility of $15 million, including the issuances of letters of credit. Availability of the loan amount is subject to a borrowing base restriction. The Company may elect to convert $5 million of the revolving credit facility to a three-year term loan at any time prior to March 31, 2010, and any such term loan will be amortized in equal monthly installments. The Company’s active domestic subsidiaries guaranty the obligations described in the Loan Agreement. The Company and the subsidiary guarantors grant the Bank a security interest in substantially all of their assets, including accounts receivable, inventory, intellectual property and equipment. Interest under the Loan Agreement for the revolving credit facility will accrue, at the election of the Company, at LIBOR plus 4.00%, or the Prime Rate plus 1.50%. The interest rate under the Loan Agreement for the term loan will accrue, at the election of the Company, at LIBOR plus 4.50%, or the Prime Rate plus 2.00%. LIBOR is subject to a floor of 1.25% and the Prime Rate is subject to a floor of three month LIBOR plus 1.50%.
The Company has evaluated subsequent events through December 14, 2009, the date of issuance of Consolidated Financial Statements. During the period from October 1, 2009 to December 14, 2009, the Company did not have any material recognizable subsequent events other than those disclosed in above.
97
Table of Contents
VIRAGE LOGIC CORPORATION
NOTES TO CONSOLIDATED FINANCIAL STATEMENTS—(Continued)
Note 14. Quarterly Results—Unaudited
| Quarter Ended | ||||||||||||||||||||||||||||||||
| Sept. 30, 2009 |
June 30, 2009 |
March 31, 2009 |
Dec. 31, 2008 |
Sept. 30, 2008 |
June 30, 2008 |
March 31, 2008 |
Dec. 31, 2007 |
|||||||||||||||||||||||||
| (Unaudited) | ||||||||||||||||||||||||||||||||
| (In thousands, except per share data) | ||||||||||||||||||||||||||||||||
| Consolidated Statements of Operations Data: |
||||||||||||||||||||||||||||||||
| Revenues |
$ | 13,148 | $ | 11,921 | $ | 11,025 | $ | 11,349 | $ | 15,513 | $ | 15,068 | $ | 14,689 | $ | 14,060 | ||||||||||||||||
| Cost and expenses: |
||||||||||||||||||||||||||||||||
| Cost of revenues |
2,334 | 2,529 | 2,401 | 2,569 | 2,924 | 2,614 | 3,121 | 2,447 | ||||||||||||||||||||||||
| Research and development |
7,721 | 6,527 | 6,700 | 9,019 | 7,677 | 8,015 | 6,175 | 5,858 | ||||||||||||||||||||||||
| Sales and marketing |
4,820 | 2,574 | 2,754 | 2,667 | 3,634 | 3,658 | 3,864 | 3,593 | ||||||||||||||||||||||||
| General and administrative |
3,980 | 2,090 | 2,645 | 2,121 | 2,336 | 2,160 | 2,111 | 1,775 | ||||||||||||||||||||||||
| Goodwill impairment |
— | — | 11,839 | — | — | — | — | — | ||||||||||||||||||||||||
| Restructuring charges |
4 | 22 | 1,473 | — | — | 319 | — | (3 | ) | |||||||||||||||||||||||
| Total cost and expenses |
18,859 | 13,742 | 27,812 | 16,376 | 16,571 | 16,766 | 15,271 | 13,670 | ||||||||||||||||||||||||
| Operating income (loss) |
(5,711 | ) | (1,821 | ) | (16,787 | ) | (5,027 | ) | (1,058 | ) | (1,698 | ) | (582 | ) | 390 | |||||||||||||||||
| Interest income |
142 | 167 | 259 | 388 | 512 | 595 | 840 | 966 | ||||||||||||||||||||||||
| Other income (expenses), net |
(158 | ) | (239 | ) | (145 | ) | 260 | 243 | 111 | (73 | ) | 201 | ||||||||||||||||||||
| Income (loss) before taxes |
(5,727 | ) | (1,893 | ) | (16,673 | ) | (4,379 | ) | (303 | ) | (992 | ) | 185 | 1,557 | ||||||||||||||||||
| Minority interest in loss of consolidated subsidiaries |
47 | — | — | — | — | — | — | — | ||||||||||||||||||||||||
| Income tax provision (benefit) |
(2,436 | ) | 29 | 9,674 | (1,768 | ) | (256 | ) | 131 | (447 | ) | 465 | ||||||||||||||||||||
| Net income (loss) |
$ | (3,244 | ) | $ | (1,922 | ) | $ | (26,347 | ) | $ | (2,611 | ) | $ | (47 | ) | $ | (1,123 | ) | $ | 632 | $ | 1,092 | ||||||||||
| Basic net income (loss) per share |
$ | (0.14 | ) | $ | (0.08 | ) | $ | (1.15 | ) | $ | (0.11 | ) | $ | (0.00 | ) | $ | (0.05 | ) | $ | 0.03 | $ | 0.05 | ||||||||||
| Diluted net income (loss) per share |
$ | (0.14 | ) | $ | (0.08 | ) | $ | (1.15 | ) | $ | (0.11 | ) | $ | (0.00 | ) | $ | (0.05 | ) | $ | 0.03 | $ | 0.05 | ||||||||||
98
Table of Contents
Pursuant to the requirements of Section 13 or 15(d) of the Securities Exchange Act of 1934, as amended, the registrant has duly caused this report to be signed on its behalf by the undersigned, thereunto duly authorized, in the City of Fremont, State of California, on this 14th day of December 2009.
| VIRAGE LOGIC CORPORATION | ||
| By: |
/S/ ALEXANDER SHUBAT | |
| Dr. Alexander Shubat | ||
| President and Chief Executive Officer | ||
POWER OF ATTORNEY
KNOW ALL PERSONS BY THESE PRESENTS, that each person whose signature appears below constitutes and appoints Alexander Shubat and Brian Sereda, jointly and severally, his attorney-in-fact, each with the power of substitution, for him in any and all capacities, to sign any amendments to this Report on Form 10-K, and to file the same, with exhibits thereto and other documents in connection therewith, with the Securities and Exchange Commission, hereby ratifying and confirming all that each of said attorney-in-fact, or his substitute or substitutes, may do or cause to be done by virtue thereof.
Pursuant to the requirements of the Securities Exchange Act of 1934, as amended, this report has been signed below by the following persons on behalf of the registrant and in the capacities and on the dates indicated.
| Signature |
Title |
Date | ||
| /S/ ALEXANDER SHUBAT Dr. Alexander Shubat |
President and Chief Executive Officer |
December 14, 2009 | ||
| /S/ BRIAN SEREDA Brian Sereda |
Vice President of Finance and Chief Financial Officer (Principal Accounting Officer and Principal Financial Officer) |
December 14, 2009 | ||
| /S/ J. DANIEL MCCRANIE J. Daniel McCranie |
Executive Chairman |
December 14, 2009 | ||
| /S/ MICHAEL HACKWORTH Michael Hackworth |
Director |
December 14, 2009 | ||
| /S/ ROBERT SMITH Robert Smith |
Director |
December 14, 2009 | ||
| /S/ CATHAL PHELAN Cathal Phelan |
Director |
December 14, 2009 | ||
99
Table of Contents
VIRAGE LOGIC CORPORATION
SCHEDULE II VALUATION AND QUALIFYING ACCOUNTS
| Balance at Beginning of Period |
Additions Charged to Costs and Expenses |
Deductions Write-Offs |
Deductions Recoveries |
Balance at End of Period | |||||||||||||
| (In thousands) | |||||||||||||||||
| Allowance for Doubtful Accounts |
|||||||||||||||||
| Year ended September 30, 2007 |
$ | 295 | $ | — | $ | — | $ | (101 | ) | $ | 194 | ||||||
| Year ended September 30, 2008 |
$ | 194 | $ | 223 | $ | (94 | ) | $ | (100 | ) | $ | 223 | |||||
| Year ended September 30, 2009 |
$ | 223 | $ | 430 | $ | — | $ | — | $ | 653 | |||||||
| Balance at Beginning of Period |
Additions Charged to Costs and Expenses |
Deductions Write-Offs |
Deductions Recoveries |
Others(1) | Balance at End of Period | |||||||||||||
| (In thousands) | ||||||||||||||||||
| Deferred Tax Asset Valuation Allowance |
||||||||||||||||||
| Year ended September 30, 2007 |
$ | — | $ | — | $ | — | $ | — | $ | — | $ | — | ||||||
| Year ended September 30, 2008 |
$ | — | $ | — | $ | — | $ | — | $ | — | $ | — | ||||||
| Year ended September 30, 2009 |
$ | — | $ | 12,430 | $ | — | $ | — | $ | 12,527 | $ | 24,957 | ||||||
| (1) | During fiscal year 2009, the Company acquired $11.4 million of fully reserved deferred tax assets in connection with the Company’s acquisition of ARC International. In addition, the Company recorded $1.1 million valuation allowance against other assets related to foreign withholding taxes. |
100
Table of Contents
EXHIBIT INDEX
| Exhibit Number |
Description of Document | |
| 3.1 | Amended and Restated Certificate of Incorporation(1) | |
| 3.2 | Amended and Restated Bylaws(2) | |
| 4.1 | Specimen Common Stock Certificate(3) | |
| 10.1 | 1997 Equity Incentive Plan, as amended(4)* | |
| 10.2 | Form of Option Agreement under 1997 Equity Incentive Plan(5)* | |
| 10.3 | 2000 Employee Stock Purchase Plan, as amended(6)* | |
| 10.4 | 2001 Foreign Subsidiary Employee Stock Purchase Plan(6)* | |
| 10.6 | Development and Licensing Agreement between Taiwan Semiconductor Manufacturing Co. Ltd. and Virage Logic dated as of March 3, 1999(3)# | |
| 10.7 | Memory Compiler Licensing Agreement between United Microelectronics Corporation and Virage Logic dated as of March 21, 2000(3)# | |
| 10.8 | Office Lease between Roshan Polymers Limited and Virage Logic International dated August 1, 2001(7) | |
| 10.9 | Virage Logic Corporation 2002 Equity Incentive Plan, as amended(8)* | |
| 10.10 | Form of Notice of Grant of Stock Options under the Virage Logic Corporation 2002 Equity Incentive Plan(9)* | |
| 10.11 | Form of Notice of Grant of Stock-Settled Appreciation Rights under the Virage Logic Corporation 2002 Equity Incentive Plan(8)* | |
| 10.12 | Form of Notice of Grant of Restricted Stock Units under the Virage Logic Corporation 2002 Equity Incentive Plan(8)* | |
| 10.13 | Amended and Restated In-Chip Systems, Inc. 2001 Incentive And Non-Statutory Stock Option Plan(10)* | |
| 10.14 | Master License Agreement, dated June 8, 2001 and Exhibit No. 2 dated April 1, 2002 between Virage Logic Corporation and STMicroelectronics S.A.(10)# | |
| 10.15 | Real Estate Purchase-Sale Agreement between Nikolay Khachaturov and Virage Logic Corporation dated October 2, 2002 (English translation)(11) | |
| 10.21 | Virage Logic Corporation 2009 Executive MBO Plan(12)* | |
| 10.22 | Virage Logic Corporation 2010 Executive MBO Plan* | |
| 10.23 | Asset Purchase Agreement dated October 9, 2009 between NXP B. V. and Virage Logic Corporation(13) | |
| 10.24 | Intellectual Property Transfer and License Agreement between NXP B. V. and Virage Logic Corporation(13) | |
| 10.25 | Technology Services Agreement between Virage Logic Corporation and NXP B. V.(13) | |
| 10.26 | Master License Agreement between Virage Logic Corporation and NXP B. V.(13) | |
| 10.27 | Loan and Security Agreement, dated as of December 1, 2009 between Silicon Valley Bank and Virage Logic Corporation(14) | |
| 21.1 | Subsidiaries of Registrant | |
101
Table of Contents
| Exhibit Number |
Description of Document | |
| 23.1 | Consent of Burr, Pilger & Mayer LLP, Independent Registered Public Accounting Firm | |
| 31.1 | Certification Pursuant to Rule 13(a)-14(a) of the Securities Exchange Act of 1934, as amended, as pursuant to Section 302 of the Sarbanes-Oxley Act of 2002 | |
| 31.2 | Certification Pursuant to Rule 13(a)-14(a) of the Securities Exchange Act of 1934, as amended, as pursuant to Section 302 of the Sarbanes-Oxley Act of 2002 | |
| 32.1 | Certification Pursuant to 18 U.S.C. Section 1350, as adopted pursuant to Section 906 of the Sarbanes-Oxley Act of 2002 | |
| 32.2 | Certification Pursuant to 18 U.S.C. Section 1350, as adopted pursuant to Section 906 of the Sarbanes-Oxley Act of 2002 | |
| (1) | Incorporated by reference to Virage Logic’s Annual Report on Form 10-K for the fiscal year ended September 30, 2007. |
| (2) | Incorporated by reference to Virage Logic’s Current Report on Form 10-K filed March 13, 2008. |
| (3) | Incorporated by reference to Virage Logic’s Registration Statement on Form S-1, as amended (File No. 333-36108). |
| (4) | Incorporated by reference to Virage Logic’s Quarterly Report on Form 10-Q for the quarter ended March 31, 2001. |
| (5) | Incorporated by reference Appendix B of Virage Logic’s Proxy Statement filed on January 13, 2005. |
| (6) | Incorporated by reference to Virage Logic’s Quarterly Report on Form 10-Q for the quarter ended June 30, 2001. |
| (7) | Incorporated by reference to Virage Logic’s Annual Report on Form 10-K for the fiscal year ended September 30, 2001. |
| (8) | Incorporated by reference to Virage Logic’s Registration Statement on Form S-8 filed May 29, 2008. |
| (9) | Incorporated by reference to Virage Logic’s Quarterly Report on Form 10-Q for the quarter ended December 31, 2001. |
| (10) | Incorporated by reference to Virage Logic’s Quarterly Report on Form 10-Q for the quarter ended June 30, 2002. |
| (11) | Incorporated by reference to Virage Logic’s Annual Report on Form 10-K for the fiscal year ended September 30, 2002. |
| (12) | Incorporated by reference to Virage Logic’s Annual Report on Form 10-K for the year ended September 30, 2008. |
| (13) | Incorporated by reference to Virage Logic’s Current Report on Form 8-K filed on November 9, 2009. |
| (14) | Incorporated by reference to Virage Logic’s Current Report on Form 8-K filed on December 7, 2009. |
| # | Confidential treatment has been granted with respect to portions of the exhibit. A complete copy of the agreement, including the redacted terms, has been separately filed with the Securities and Exchange Commission. |
| * | Management contract or compensatory plan or arrangement. |
102