Attached files
| file | filename |
|---|---|
| EX-31.1 - EXHIBIT 31.1 - SEMITOOL INC | exhibit31-1.htm |
| EX-32.1 - EXHIBIT 32.1 - SEMITOOL INC | exhibit32-1.htm |
| EX-31.2 - EXHIBIT 31.2 - SEMITOOL INC | exhibit31-2.htm |
| EX-21.1 - EXHIBIT 21.1 - SEMITOOL INC | exhibit21-1.htm |
| EX-32.2 - EXHIBIT 32.2 - SEMITOOL INC | exhibit32-2.htm |
| EX-23.1 - EXHIBIT 23.1 - SEMITOOL INC | exhibit23-1.htm |
UNITED
STATES
SECURITIES
AND EXCHANGE COMMISSION
Washington,
D.C. 20549
FORM
10-K
x ANNUAL REPORT PURSUANT TO SECTION 13
OR 15(d)
OF
THE SECURITIES EXCHANGE ACT OF 1934
For
the Fiscal Year Ended September 30, 2009
OR
o TRANSITION REPORT PURSUANT TO
SECTION 13 OR 15(d)
OF
THE SECURITIES EXCHANGE ACT OF 1934
For
the Transition Period From ___ to ___
Commission
File Number 0-25424
SEMITOOL,
INC.
(Exact Name of
Registrant as Specified in Its Charter)
|
Montana
|
81-0384392
|
|
(State or
Other Jurisdiction of
|
(I.R.S.
Employer
|
|
Incorporation
or Organization)
|
Identification
No.)
|
Semitool,
Inc.
655
West Reserve Drive, Kalispell, Montana 59901
(406)
752-2107
(Address, including
zip code, and telephone number, including
area code, of
registrant’s principal executive offices)
Securities registered pursuant to
Section 12(b) of the Act:
|
Title of Each
Class
|
Name of Each Exchange on Which
Registered
|
|
Common Stock,
no par value
|
NASDAQ Global
Select Market
|
Securities
registered pursuant to Section 12(g) of the Act:
None
Indicate by check
mark if the registrant is a well-known seasoned issuer, as defined in Rule 405
of the Securities Act. Yes o No x
Indicate by check
mark if the registrant is not required to file reports pursuant to Section 13 or
15(d) of the Act. Yes o No x
Indicate by check
mark whether the registrant (1) has filed all reports required to be filed by
Section 13 or 15(d) of the Securities Exchange Act of 1934 during the preceding
12 months (or for such shorter period that the registrant was required to file
such reports), and (2) has been subject to such filing requirements for the past
90 days. Yes x No o
Indicate by check
mark whether the registrant has submitted electronically and posted on its
corporate Web site, if any, every Interactive Data File required to be submitted
and posted pursuant to Rule 405 of Regulation S-T during the preceding 12 months
(or for such shorter period that the registrant was required to submit and post
such files. Yes o No o
Indicate by check
mark if disclosure of delinquent filers pursuant to Item 405 of Regulation S-K
is not contained herein, and will not be contained, to the best of registrant’s
knowledge, in definitive proxy or information statements incorporated by
reference in Part III of this Form 10-K or any amendment to this Form
10-K. o
Indicate by check
mark whether the registrant is a large accelerated filer, an accelerated filer,
a non-accelerated filer or a smaller reporting company. See
definition of “large accelerated filer,” “accelerated filer” and “smaller
reporting company” in Rule 12b-2 of the Exchange Act. (Check one):
|
Large
accelerated filer o
|
Accelerated
filer x
|
Non-accelerated
filer o
|
Smaller
reporting company o
|
Indicate by check
mark whether the registrant is a shell company (as defined in Rule 12b-2 of the
Exchange Act). Yes o No x
The approximate
aggregate market value of the voting stock held by non-affiliates of the
registrant on March 31, 2009 (based on the last reported sale price on the
NASDAQ Global Select Market as of such date) was $63,113,197.
The number of
shares of the registrant’s Common Stock, no par value, outstanding as of
December 1, 2009 was 32,873,266.
DOCUMENTS
INCORPORATED BY REFERENCE
None
Index
to Annual Report on Form 10-K
Year
Ended September 30, 2009
|
PART I
|
||
|
PAGE
|
||
|
3
|
||
|
ITEM
1.
|
4
|
|
|
11
|
||
|
ITEM
1A.
|
11
|
|
|
ITEM
1B.
|
19
|
|
|
ITEM
2.
|
20
|
|
|
ITEM
3.
|
20
|
|
|
ITEM
4.
|
20
|
|
|
PART II
|
||
|
ITEM
5.
|
21
|
|
|
ITEM
6.
|
22
|
|
|
ITEM
7.
|
23
|
|
|
ITEM
7A.
|
35
|
|
|
ITEM
8.
|
36
|
|
|
ITEM
9.
|
63
|
|
|
ITEM
9A.
|
63
|
|
|
ITEM
9B.
|
63
|
|
|
PART III
|
||
|
ITEM
10.
|
64
|
|
|
ITEM
11.
|
65
|
|
|
ITEM
12.
|
74
|
|
|
ITEM
13.
|
75
|
|
|
ITEM
14.
|
76
|
|
|
PART IV
|
||
|
ITEM
15.
|
77
|
|
|
80
|
||
PART
I
Statements
contained in this Annual Report on Form 10-K which are not purely historical
facts are forward-looking statements within the meaning of Section 27A of the
Securities Act of 1933, as amended, and Section 21E of the Securities Exchange
Act of 1934. Forward-looking statements are all statements other than
those of historical fact, and sometimes can be identified by the use of
prospective or presumptive language such as “intend,” “plan,” “expect,” “will,”
“may,” “should,” “could,” and words of similar meaning or context. These
forward-looking statements are based on management’s estimates, projections and
assumptions based on information known to management at the time the statements
are made. Forward-looking statements in the discussion of our
business, properties and legal matters include, without limitation, statements
regarding:
|
•
|
trends in the
semiconductor industry that are driving demand for our products, including
the adoption of single-wafer 300mm processing, adoption of copper as an
interconnect material, spray processing supplanting immersion technologies
and the continued expansion of the wafer level packaging
market;
|
|
|
•
|
Semitool’s
solutions and strategies for electrochemical deposition, surface
preparation and wafer level packaging, including our intent to continue
investing in research and development to maintain and expand our position
as a technology leader in those markets;
|
|
|
•
|
our plan to
develop new technologies, including porous silicon, 3-D packaging, wafer
thinning and solar market applications for our processes and equipment, to
enable us to enter emerging markets and provide innovative
solutions;
|
|
|
•
|
our plan to
leverage our Raider platform with both our current and potential new
customers and in new markets and our expectation that revenue from our
Raider platform will continue to account for a significant portion of our
revenue;
|
|
|
•
|
our plan to
enhance our relationships with our major customers and identify
opportunities to develop similar relationships with other semiconductor
device manufacturers;
|
|
|
•
|
our intent to
match our sales and support organization to market opportunities in Asia,
and the potential for growth in those markets;
|
|
|
•
|
the
performance and acceptance of our products, including the continued
technological improvement of our tools and the success of our Raider
platform;
|
|
|
•
|
manufacturing
strategy, including our vertical manufacturing structure and manufacturing
strategies for increasing performance reliability and yields while
reducing the cost of ownership of our tools;
|
|
|
•
|
competition,
including our ability to compete favorably with companies significantly
larger than we are;
|
|
|
•
|
our efforts
to protect our intellectual property portfolio and intent to continue to
file patent applications to protect that intellectual
property;
|
|
|
•
|
the adequacy
of our existing manufacturing facilities;
|
|
|
•
|
the ability
to maintain our worldwide sales, service and customer support
organizations;
|
|
|
•
|
the impact of
litigation on our business, including patent disputes;
and
|
|
|
•
|
the impact of
the recent turmoil in the world’s economies on our
business.
|
Other
forward-looking statements made below under the heading “Management’s Discussion
and Analysis of Financial Condition and Results of Operations” and elsewhere
include statements relating to:
|
•
|
accounting
policies and estimates and the effects of new accounting
standards;
|
|
|
•
|
research and
development expenses, including expected fluctuations in such expenses in
absolute dollar amounts and as a percentage of net sales, and our
expectation of continued funding of research and development to attain
technology leadership in our industry;
|
|
|
•
|
estimates of
capital expenditures and the sufficiency of funds and sources of financing
to make expected capital expenditures through fiscal
2010;
|
|
|
•
|
the
sufficiency of funds and the ability to finance activities, including
sources of liquidity and the availability of the funds for borrowing under
the debt covenants contained in our revolving credit
line;
|
|
|
•
|
our
expectation that existing debt financing arrangements and cash flows
generated from operating activities will be sufficient to fund operations
and planned capital expenditures through fiscal 2010;
and
|
|
|
•
|
our estimated
effective tax rate.
|
Management cautions
that forward-looking statements are subject to risks and uncertainties that
could cause our actual results to differ materially from those projected in such
forward-looking statements. Some of these risks and uncertainties are
described under the heading “Risk Factors” (refer to Part I, Item 1A) and
elsewhere in this Annual Report on Form 10-K. We undertake no
obligation to update forward-looking statements to reflect subsequent events,
changed circumstances, or the occurrence of unanticipated events.
Important
Note
On
November 16, 2009, Semitool, Inc., entered into a definitive agreement to be
acquired by Applied Materials, Inc. If the transactions contemplated
by the agreement are completed, the Company’s status as a reporting company will
cease and the Company will have merged into a wholly-owned subsidiary of
Applied Materials. Except as otherwise expressly noted, all statements and
information in this filing presume our continuation as an independent company
which will not be the case if we are acquired by Applied Materials.
Overview
We
design, manufacture, install and service highly-engineered equipment for use in
the fabrication of semiconductor devices. Our products are focused on
the wet chemical process steps in integrated circuit, or IC, manufacturing and
include systems for wafer surface preparation and electrochemical deposition, or
ECD, applications. Our surface preparation systems are designed for
Front End of Line (FEOL), Back End of Line (BEOL) and wafer level packaging of
ICs processes. Our single-wafer FEOL surface preparation systems are
used for photoresist stripping, post etch and pre-diffusion cleans. Our BEOL
surface preparation systems are used for polymer removal and packaging
applications. Our ECD systems are used to plate copper and other metals, which
are used for the IC’s internal wiring, or interconnects; to plate solder and
lead free solder bumps for wafer level packaging applications; and to plate
other metals for various semiconductor and related
applications. Also, our surface preparation systems are used for
cleaning and etching processes for wafer level packaging. Our primary
product for all of these processes is the Raider platform, which is a
multi-chamber single-wafer tool. Our products address critical
applications within the semiconductor manufacturing process, and help enable our
customers to manufacture more advanced semiconductor devices that feature higher
levels of performance. The fabrication of semiconductor devices
typically requires several hundred manufacturing steps, with the number of steps
continuing to increase for advanced devices. Due to the breadth of
our product portfolio and advanced technology capabilities, our solutions
address over 150 of these manufacturing steps.
Semitool, Inc., a
Montana corporation, was founded in 1979 and is headquartered in Kalispell,
Montana. Our mailing address is 655 West Reserve Drive, Kalispell, MT 59901 and
our telephone number is 406-752-2107. Additional information about the Company
is available on our website at http://www.semitool.com. On our Investor
Relations page on our website, we post our filings as soon as practicable after
they are electronically filed with or furnished to the Securities and Exchange
Commission (SEC). All such filings on our own Investor Relations web page are
available to be viewed free of charge. Information contained on our website is
not part of, and is not incorporated into, this annual report on Form 10-K or
our other filings with the Securities and Exchange Commission. Our filings also
are available at the Securities and Exchange Commission’s website at
http://www.sec.gov. Any materials the Company files with the SEC may be read and
copied at the SEC’s Public Reference Room at 100 F Street, NE, Washington, DC
20549. Information on the operation of the Public Reference Room is available by
calling the SEC at 1-800-SEC-0330.
Industry
Background
Growth in the
semiconductor industry is driven by the global demand for semiconductor devices
that are incorporated in an ever increasing array of electronic devices such as
netbooks, smart phones, network servers, digital televisions, MP3 players, video
game players, GPS devices and digital cameras to name a few. The
market for semiconductor equipment used to fabricate semiconductor devices has
also experienced significant growth, driven by greater demand for, and
increasingly higher performance of, semiconductor devices. Though
subject to a high degree of cyclicality due to periods of excess supply or
demand for semiconductor equipment, semiconductor devices and semiconductor fab
capacity utilization, the market for semiconductor equipment is characterized by
rapid technological development and product innovation. As a result,
to meet new technological advancements, semiconductor device manufacturers may
purchase new semiconductor equipment despite the timing of the market
cycle. Likewise, capital expenditures can be delayed or cancelled
quickly due to market or macro-economic conditions.
Semiconductor
Manufacturing Process Overview
Semiconductor
devices can consist of over a billion nanometric transistors and other
components that electronically store information and allow the execution of
instructions used to operate electronic devices. Fabrication of ICs
involves hundreds of complex and repetitive process steps, involving an array of
sophisticated manufacturing equipment, chemical media, and
materials. The fabrication process includes, among others, the
deposition of multiple layers of dielectric or insulating films and electrically
conducting metal films. After the deposition of each film layer, the
fabrication process continues with repeated cleaning, stripping and etching
processes to prepare the surface for the next process. When
completed, the wafer may contain several hundred ICs, which, traditionally, are
then separated by a dicing process. The ICs are then packaged by
connecting them to pins using metal wire contacts and encapsulated in a polymer
plastic case. In an effort to reduce the size of packaged ICs, some
manufacturers are using newer wafer level packaging techniques, which allow for
attaching each IC to its package prior to dicing the wafer. With the
use of Through Silicon Vias (TSVs), chips can be stacked upon each other to
provide more computing process in a compact space. Once diced, the
packaged semiconductor device can then be used in electronic products, such as
cellular phones or other electronic devices.
Cleaning,
stripping, etching or otherwise preparing the wafer surface, are steps repeated
throughout the semiconductor fabrication process as well as in the wafer level
packaging process. These processes are important, since the integrity
of the next process depends on the effectiveness of prior cleaning, stripping,
or etching steps. Immersion and spray are two fundamental means by
which surface preparation wet process steps are performed. Immersion processes,
or wet benches, are a series of chemical baths in which wafers are
immersed. The wafers are transported from a wet chemical tank to
another tank by robots or human operators. In contrast, spray
delivery systems subject wafers to sequential spray applications of chemicals
inside an enclosed process chamber, where the chemical is brought to the wafers
which are spinning on axis. Spray systems can be configured to
process wafers in a batch or single wafer mode. Single-wafer
processor systems can provide a combination of spray and immersion
processes.
An
IC’s interconnect wiring provides the means for electric current to flow from
the IC’s transistors to external devices. Interconnects are formed by
the deposition of metal film layers, such as copper, into trenches and vias on
the surface of a wafer. The deposition step occurs numerous times
throughout the manufacturing process, with advanced ICs possessing ten or more
metal film layers. As device dimensions continue to shrink, the
connections between transistors add noticeably more delay to IC processing
speeds, due to the intrinsic resistance and capacitance of the interconnect
material. Copper is the material of choice in such situations and
practically all 300mm fabs use copper plating equipment. However,
copper, unlike aluminum, is difficult to handle and must be kept from direct
contact with the silicon wafer as it will diffuse into the
silicon. This will ruin the devices on the wafer and could
potentially contaminate an entire fab. As a result, copper-based
manufacturing requires more critical surface preparation steps and special
processing techniques to provide complete isolation of the copper
material.
Trends
in Semiconductor Manufacturing
There are several
key trends in the semiconductor manufacturing industry driving growth in demand
for wafer surface preparation, ECD and other advanced semiconductor
equipment:
Smaller Device Features for Lower
Cost and Higher Performance. Semiconductor devices have historically
followed Moore’s Law which states that approximately every two years the amount
of transistors on a device doubles, allowing semiconductor manufacturers to
build twice the computing power into the same space. The inexorable goal of
creating more advanced electronics applications drives the industry’s transition
to smaller device features, enabling lower cost, as more ICs can be fabricated
on each wafer. As the industry moves to 32 nanometer feature sizes and below,
the IC fabrication process becomes significantly more complex, requiring more
stringent manufacturing specifications and reducing acceptable margins of
error. In particular, the fabrication process becomes more
susceptible to ever smaller particles, requiring the use of more advanced
surface preparation equipment to reach acceptable yields. Also,
manufacturing smaller IC interconnects requires the use of equipment
specifically designed for copper deposition.
New Materials to Fabricate More
Advanced Semiconductor Devices. The need to fabricate increasingly
advanced semiconductor devices has led to more complex manufacturing processes
that use new materials, such as low-k dielectrics and copper to form an IC’s
interconnect wiring. The use of copper, in particular, presents
significant processing challenges to prevent copper contamination which reduces
yield even when measured in parts per billion. To address these
challenges, specialized processes have been developed to provide better
isolation of copper materials on the wafer, including dual-damascene, barrier
layer formation, and new cleaning processes to remove unwanted
copper. These complex processes require the use of computerized
automated equipment for the precise deposition of copper
material. Additionally, the introduction of new materials requires a
higher number of surface preparation steps to provide high yields.
Move to Single-Wafer Processing
Technologies for Enhanced Surface Preparation. The industry shift toward
smaller device dimensions, new materials and 300mm wafer processing has driven
the need for more advanced surface preparation technologies and process
equipment. In particular, 300mm is causing a move to single-wafer
processing as the process can be controlled more precisely compared to wet bench
technology. For example, single-wafer spray processing is
increasingly being used instead of wet benches due to its greater process
control, reduced footprint, reduced manufacturing cycle time, reduced chemical
consumption and now greater throughput. Fab BEOL processes, where the
interconnect wiring is placed on the wafer, have already made the transition
from being primarily batch processes to single-wafer processes for the more
advanced devices. FEOL processes, which fabricate the devices’
transistors, are starting to transition from batch to single wafer.
Wafer Level and Other Advanced
Packaging Enable Smaller Portable Products. Wafer level packaging, is
being deployed by the industry for the manufacture of smaller portable products
such as GPS devices, MP3 players and mobile phones to name a
few. This advanced packaging is an enabling technology for the
semiconductor industry, as it allows the integration of more computing and
information processing power in a smaller space than conventional packaging
technology. Advanced packaging uses fabrication processes similar to
IC fabrication and includes, among others, ECD for connective solder or gold
bumps, photoresist stripping and under-bump metal etching. The
packaging method allows for more efficient 3-D device mounting, or chipstacking,
to further reduce the device’s footprint.
Emerging Need for 3D Chipstacking
Driven by the Demand for Smaller Portable Devices. The desire for
smaller, lighter and more power efficient devices has led to stacking in the
same package. The devices are electrically connected to provide an
integrated, multi-functional device in a small footprint.
Semitool’s
Solution
We
are a leading provider of wet chemical processing equipment, targeting wafer
surface preparation and ECD plating applications for all areas of wafer
fabrication, including device packaging. As the semiconductor
manufacturing process increases in complexity and production parameters become
even more stringent, semiconductor manufacturers increasingly rely upon
manufacturers of semiconductor equipment to achieve improved process control,
provide a smaller equipment footprint and lower the cost of ownership of their
manufacturing processes. Our solutions address critical applications
within the semiconductor manufacturing process, and enable our customers to
manufacture more advanced semiconductor devices that feature higher levels of
performance. Key elements of our solution include:
Technology Leadership. We are
able to leverage our extensive expertise in wet chemical processing and over 30
years of experience building and supporting production-proven semiconductor
manufacturing equipment. We utilize advanced modeling techniques in
the design of our process chambers to address an increasingly complex
manufacturing process. We have a strong intellectual property
portfolio with 374 U.S. patents issued and approximately 101 U.S. patents
pending.
Comprehensive Product Portfolio.
We provide a broad suite of advanced and innovative processing chambers
for surface preparation and ECD application. These chambers are
incorporated into our single-wafer platform and into our batch processing
tools. We design a variety of chambers to optimize performance of
each of the different processes we address.
Raider Platform. Our Raider
platform is a high-precision, multi-chamber, single-wafer platform that supports
surface preparation and ECD applications. Our proprietary platform is
configured in a linear design, coupled with our own robotic technology, allowing
for up to 14 interchangeable process chambers. The Raider platform
also features no-teach robotic technology which results in reduced installation
and maintenance costs.
Vertically-Integrated Manufacturing
and Design Capabilities. Our manufacturing operations are selectively
vertically integrated to include metals and plastics fabrication and finishing
capabilities, component manufacturing and final product test and assembly and
extensive product development capabilities. Our facilities feature
high-volume manufacturing lines that provide short lead time delivery of our
products. In addition, we perform product development and prototyping
internally. This strategy reduces our products’ time to market and helps lower
our design and manufacturing costs.
Strategy
Our objective is to
be the leading worldwide provider of wet chemical processing equipment,
targeting wafer surface preparation and ECD applications. To achieve
this goal, we are pursuing the following strategies:
Target Innovative, High-Margin,
High-Growth Opportunities with Differentiated Products. Our strategy is
to be the first to enter new, high-growth markets with differentiated
products. This strategy has provided us with early market and
technology leadership and enabled us to achieve strong gross
margins. For example, we were among the first to target the
rapidly-growing wafer level packaging and ECD markets and will continue to do so
as we develop processes and equipment for 3D chipstacking.
Maintain and Expand Technology
Leadership. We intend to continue investing in research and development
to maintain and expand our position as a technology leader in surface
preparation and ECD applications. Our goal is to deliver leading-edge
technical innovation to our customers by focusing on performance, improved
system reliability, high throughput, yield enhancement and a low cost of
ownership. We plan to develop new technologies, such as porous
silicon and solar applications, to enable us to enter emerging markets and
provide innovative solutions to meet customer needs.
Leverage our Raider Platform to
Further Penetrate New Customer and Market Opportunities. Our Raider
platform features proprietary surface preparation, ECD, and wafer handling
technologies. We continue to enhance the capabilities of our Raider
platform and thus broaden its customer appeal by expanding its portfolio of wet
chemical processing capabilities. We plan to leverage the platform
with both our current and potential new customers, in our existing markets, as
well as in new markets. New Raider developments will strive to
provide a throughput advantage with a reduced footprint compared to batch
processing technology.
Integrate Design and Manufacturing
Expertise. Our strategy is one of close integration of design and
manufacturing, coupled with selective vertically-integrated manufacturing to
achieve innovative solutions, cost and quality advantages and to reduce the time
to market for new products and product enhancements. We believe that
the close coordination of our engineering and manufacturing teams provides us
with an advantage in quickly developing new products as well as improving the
design of our current products to increase performance, reliability and
manufacturing yields while reducing costs. Additionally, our control
over selective critical components reduces our dependence on component
suppliers.
Leverage Strategic
Relationships. For over 30 years, we have focused on satisfying the needs
of worldwide semiconductor device manufacturers and establishing long-term
relationships with our customers. We work with select customers and
other suppliers to the semiconductor equipment industry at the concept and
design stages to identify and respond to customer requests for current and
future generations of products. These close working relationships
allow us to understand and address the performance and cost expectations of our
customers. We plan to enhance our relationships with our major
customers and identify opportunities to develop similar relationships with
additional semiconductor device manufacturers.
Asian Market Presence. During
the past several years we have expanded our presence in Asia. We
currently have sales organizations in Singapore, Japan, Taiwan, Korea and China,
and long-term, we intend to match our sales and applications support
organization to market opportunities in that region. We believe that
Asia has the potential for additional significant long-term
growth. Our sales, marketing and service strategy is to expand our
installed base of equipment with existing and potential new customers in this
region.
Technology
We
are a leader in the design and development of advanced wet chemical processing
equipment. We leverage our years of experience in designing and
manufacturing production-proven semiconductor fabrication equipment to deliver
solutions that enable the production of increasingly higher performance
semiconductor devices. We have several key technological core
competencies, including advanced computational modeling, and have assembled a
development team with extensive engineering and modeling expertise to capitalize
on these competencies.
Our surface
preparation systems incorporate our innovative cleaning technology, such as our
HiDRIS cleaning chamber used to remove high dose ion implant photoresist from
the surface of the wafer. We have also developed porous silicon
chambers for use in nano-technology mems devices and solar
applications.
For electroplating
applications, we leverage our advanced modeling techniques in the design of our
proprietary copper pellet anode assemblies and membrane technology to provide
low cost copper to the flash and memory device markets. Our multiple
anode assemblies enable radially controlled current density during the
electroplating process, leading to a more controllable process for depositing
copper film on the surface of a wafer allowing the optimal match of the copper
film to the planarization characteristics of the downstream CMP process
step. For the smallest structure size devices, our seed layer
enhancement process enables excellent via fill to fix nonconformities
encountered during the PVD copper seed Iayer process.
Products
Our broad product
suite of innovative processing systems leverages our core wet chemical
processing expertise and our years of experience in manufacturing and supporting
production-proven semiconductor manufacturing equipment. Our primary
wet chemical processing solutions are multi-chamber single-wafer and batch
cleaning, stripping and etching equipment and single-wafer plating equipment,
primarily for the deposition of copper, lead or lead-free solder. We
operate in one segment with net sales of $139.0 million, $238.6 million and
$215.2 million for fiscal 2009, 2008 and 2007, respectively. Additional
information regarding our income and assets can be found in the financial
statements included under Item 8 below.
Surface Preparation
Products
Our multi-chamber,
single-wafer processing systems for wet cleaning, stripping and etching are
designed with a linear arrangement of the processing chambers for high volume
production and, like our ECD chambers, utilize the Raider
platform. The platform modularity reduces downtime and increases
wafer throughput providing the customer with an overall lower cost of
ownership. These systems are available to accommodate 200mm and 300mm
wafer sizes. Selling prices for these single-wafer surface
preparation products range from approximately $900,000 to $2.4
million.
Our batch systems
for wet cleaning, stripping and etching applications include semi- and
fully-automated systems and use our proprietary spray technology to deliver
chemicals, de-ionized water and gases to the wafer surface in an enclosed
chamber. The wafers are rotated, on axis, and are showered by a
sequenced spray of chemicals and de-ionized water followed by heated nitrogen
gas to dry the wafers. This technology enables precise and uniform
application of process chemicals and enhances process reliability and cost
effectiveness through reduced particle contamination and process cycle
time. Our cost-effective ozone and de-ionized water-based cleaning
process, called HydrOzone, is available on selected systems. This
environmentally friendly process can replace traditional processes using
sulfuric acid and other hazardous chemicals resulting in lower costs, reduced
process cycle time, reduced water consumption, and can minimize chemical
disposal costs. These systems are available to accommodate 150mm,
200mm and 300mm wafer sizes in up to 50 wafer batches. Selling prices
for these systems range from approximately $20,000 to over $1.6
million.
RAIDER
SP
Our Raider platform
is a multi-chamber, single-wafer platform that provides a high degree of control
over surface preparation applications. Our proprietary platform is
designed in a linear configuration, coupled with our robotic technology,
allowing for up to 14 interchangeable process chambers. The
flexibility of its linear design makes it one of the most versatile wet
cleaning, stripping and etching platforms in the industry. The tool
can be equipped with our proprietary Capsule chambers, which allows
side-selectable processing. In addition, the system can also be
equipped with spray, immersion, megasonic, or vapor process
chambers. Applications include wafer backside, bevel-edge clean for
removal of unwanted copper and other contaminates, post-etch polymer removal,
critical pre-deposition cleans, metal etching and FEOL cleans. The Raider SP is
available to accommodate 200mm and 300mm wafer sizes.
SPECTRUM
The Spectrum is an
advanced automated batch processing system for cleaning, stripping and etching
applications. Its compact modular design features high throughput,
flexible process formats and precise control combining to provide low cost of
ownership. In addition to our proprietary spray processing modules,
the Spectrum can be equipped with immersion and surface tension gradient dry
capabilities. It can be configured to use either acids, solvents or
our proprietary HydrOzone-based processes for polymer removal, photoresist strip
and critical cleaning applications. The Spectrum is available to
accommodate both 200mm and 300mm wafer sizes.
Spray
Acid Tool (SAT), Spray Solvent Tool (SST), Spin Rinser/Dryer (SRD),
SCEPTER
The SAT and SST are
manually loaded semi-automated systems for performing sequential processing of
25 wafers per spray process chamber. They are designed for wafer
processing using high purity acidic, alkaline and solvent based chemistries to
achieve a wide array of cleaning, stripping and etching
applications. These systems can be equipped with up to three 200mm
process 25 wafer chambers and are ideal for medium to low production volumes and
research and development activity. The SRD is a high efficiency
cleaning system utilizing de-ionized water to remove water-soluble contaminants,
chemical residue and particulate matter. It is available to
accommodate substrates sizes up to 300mm or larger in diameter. The
Scepter series is an advancement of these semi-automated products that offers
double the productivity of the 25 wafer capacity tools by processing 50 wafers
at a time in nearly the same system footprint. The Scepter can
process wafer sizes up to 200mm in diameter.
Electrochemical
Deposition Systems
Our single-wafer
ECD systems incorporate proprietary electroplating technology on a multi-chamber
Raider platform typically populated with 10 to 14 chambers. ECD
applications include copper interconnect for logic and memory ICs, gold bumps
for high speed communication ICs, lead and lead-free solder bumps for advanced
wafer level packaging and Through Silicon Via plating for 3-D chipstacking
applications. Our leading single-wafer design is modular, with
process chambers arranged in a linear orientation, providing flexibility in
system configuration. These systems generally include a combination
of ECD and surface preparation process chambers to address a customer’s specific
application. These systems are available to accommodate wafer
diameters from 100mm to 300mm and can be scaled for customers’ capacity
requirements. Selling prices of these typically range from
approximately $500,000 to $5.0 million.
RAIDER
ECD
The Raider ECD is
an automated, multi-chambered platform that processes a single wafer per chamber
to provide for high volume ECD. The specific configuration of its
multiple processing chambers is determined by whether the tool is to be used for
interconnects or advanced packaging. For copper interconnect, several
process steps can be integrated onto a single system such as ECD seed layer
enhancement, ECD plating fill, wafer backside clean, bevel-edge clean, film
thickness metrology and rapid thermal anneal. Our proprietary concentric anode
chamber design, coupled with our model-based plating controller, allows the user
to optimize plating profiles for downstream operations such as better matching
of film characteristics to planarization (CMP) equipment, resulting in yield
improvements and reducing expensive CMP costs. Our cleaning chambers
are integrated into the tool for bevel-edge and backside copper cleaning to
eliminate copper contamination. The modularity of the platform
provides our customers with the flexibility to configure the chamber mix to meet
their specific needs. Additionally, our Advanced Chemical Management
System, or ACMS, an automated electroplating bath control unit, can be fully
integrated with the Raider ECD systems. The ACMS maintains the
desired chemical balance in the plating baths by automatically analyzing and
replenishing the chemical constituents using our proprietary technology and
typically services two ECD systems. The primary applications for the
Raider ECD are copper, gold, nickel, platinum and solder depositions. It is
available to accommodate 200mm and 300mm wafer sizes.
Customers,
Sales and Marketing
Our customers
include leading global semiconductor manufacturers. The following is
a representative list of our largest customers in fiscal 2009:
|
Advanced
Semiconductor Engineering
|
FormFactor
|
NEC
|
|
Amkor
|
Global
Foundries/AMD
|
Samsung
|
|
Anadigics
|
IMEC
|
Seagate
|
|
Bosch
|
Inotera
|
Silex
|
|
CEA
Leti
|
Micron
|
STATS
ChipPAC
|
|
Elpida
Memory
|
Nanya
Technology
|
Taiwan
Semiconductor Mfg. Co.
|
|
Fairchild
Semiconductor
|
National
Semiconductor
|
Texas
Instruments
|
Our top ten
customers accounted for 48.2%, 56.0% and 67.8% of net sales in fiscal 2009, 2008
and 2007, respectively. Seagate and Amkor accounted for 11.6% and
10.4%, respectively, of net sales in fiscal 2008. Advanced Micro
Devices and Micron/IM Flash accounted for 23.8% and 10.2%, respectively of net
sales in fiscal 2007. No single customer accounted for 10% or more of
net sales in fiscal 2009.
International
sales, primarily in Europe and Asia, including Japan, accounted for
approximately 74.5%, 71.4 % and 62.5% of net sales for fiscal 2009, 2008 and
2007, respectively. We have direct sales and customer support
organizations located in the United States, Europe, Japan, Singapore, Korea,
Taiwan, China and Philippines and for some products, we utilize on a selective
basis both independent representatives and distributors.
Field service
personnel and process engineers located in the United States, Europe, Japan,
Korea and throughout Southeast Asia provide warranty service, post-warranty
service and equipment installation. We also provide service and
maintenance training, as well as process application training for our customers’
personnel, on a fee basis. Spare parts inventories are maintained in
outsourced locations throughout the world, which allows us to offer same day or
overnight delivery in many instances.
Backlog
and Deferred Revenue
Consolidated orders
backlog was $69.8 million as of September 30, 2009 and $54.5 million as of
September 30, 2008. We include in backlog those customer orders for which we
have written customer authorization and for which shipment is scheduled within
the next 12 months. Orders are subject to cancellation or
rescheduling by customers with limited or no cancellation
fees. During periods of downturns in the semiconductor industry, we
have experienced significant customer cancellations and requested delays in
delivery.
Our deferred
revenue primarily relates to equipment shipped to customers that has not been
accepted by the customer. Revenue on those shipments is recognized as
sales when acceptance is received. As of September 30, 2009, deferred
revenue was $4.8 million.
As
a result of systems ordered and shipped in the same quarter, possible changes in
customer delivery dates, cancellations and shipment delays, and acceptances of
shipped equipment carried in deferred revenue, the backlog at any particular
date and the orders bookings for any particular period are not necessarily
indicative of actual revenue for any succeeding period.
Manufacturing
Most of our
manufacturing is conducted at our facilities located near Kalispell,
Montana. Our manufacturing operations are selectively vertically
integrated to include metals and plastics fabrication and finishing
capabilities, component parts and final product assembly, and extensive product
development capabilities. Manufacturing personnel work closely with
product development engineers to enhance manufacturability and facilitate the
transition from prototype to full-scale production. Our high-volume
manufacturing lines provide responsive lead time delivery of our
products. Component and product prototyping typically is performed
internally, reducing the time to market for new products and product
enhancements.
In
fiscal 2006, we increased our manufacturing capacity with the purchase of a
72,000 square foot facility near Kalispell. This building contains
our fabrication departments and provides more space for the assembly area in our
main facility. In fiscal 2006, we also completed our facility in
Salzburg, Austria which has space for manufacturing and upgrading used
products. In fiscal 2007, we completed a 10,000 square foot expansion
of a refurbishing facility at our Rhetech subsidiary.
Research
and Development (R&D)
We
believe that timely development of products is necessary to remain competitive
in an equipment market characterized by rapid technological change and product
innovation. We devote significant resources to programs directed at
developing new and enhanced products, as well as new applications for existing
products. We maintain extensive demonstration and process development
laboratories at our facilities in Montana, including three lab areas for
demonstrating, testing and developing products. Research and
development personnel work directly with customers, vendors, and research
institutes to develop new processes and to design and evaluate new
equipment.
Research and
development, which is expensed as incurred, was approximately $25.6 million,
$30.4 million and $27.1 million in fiscal 2009, 2008 and 2007,
respectively. As a percentage of our net sales, these expenses
represented approximately 18.4%, 12.8% and 12.6% in each of these fiscal years,
respectively. We continue to work on a number of leading edge
projects including on-going development of porous silicon for the solar
industry, flow batteries, FEOL cleaning applications, wafer edge cleaning
processes, deep via and Through Silicon Via applications, high
volume Through Silicon Via and wafer level packaging production and
others.
Competition
The semiconductor
equipment industry is an intensively competitive market place marked by constant
technological change. Significant competitive factors in the
semiconductor equipment and related markets in which we compete include: system
performance, quality and reliability, cost of using our equipment, ability to
ship products to meet customer schedules, timeliness and quality of technical
support service, our success in developing new and enhanced products, pricing
and payment terms. We face substantial competition from established
companies, some of which have greater financial, marketing, technical and other
resources, broader and integrated product lines, more extensive customer support
capabilities, larger sales organizations and greater installed customer
bases. Our primary competitor in ECD is Novellus Systems,
Inc. In wet surface preparation applications, our competition
includes Dainippon Screen Manufacturing Co., LAM Research, Inc. and Tokyo
Electron, Ltd.
We
believe that we compete favorably with these manufacturers. We may also face
competition from new market entrants.
Patents
and Other Intellectual Property
The semiconductor
industry in general is very active in pursuing patent applications for both
equipment and processes used in the manufacture of semiconductor
devices. Patents are considered important to the protection of
intellectual property resulting from a company’s research and development
programs and are viewed as a means of gaining market advantages over competitors
because the industry often differentiates competitors on the basis of
technological criteria.
We
place a strong emphasis on the innovative features of our products and, where
available, we generally seek patent protection for those features. We
currently hold 374 U.S. patents, some with pending foreign counterparts, have
approximately 101 U.S. patent applications pending and intend to file additional
patent applications, as we deem appropriate. We have had an active patent
program since the Company’s inception; consequently, the duration of our patent
portfolio is staggered due to various initial filing dates for individual
patents. Our patent portfolio is not dominated by any particular
patents. We consider the strength of the overall portfolio to be more
important than the strength of any particular patent. In fact, many patents are
part of our “patent families” and it is difficult, if not impossible, to make
any assessment regarding the “materiality” of one patent in that family over
another. Even if a patent is not used offensively to prevent a
competitor from practicing the same art, it may still provide a deterrent
against a competitor’s potential patent infringement claim against
us.
Employees
As
of September 30, 2009, we had 826 full-time and temporary employees
worldwide. Our employees are not represented by a labor union, and we
have never experienced a work stoppage or strike. We consider our
employee relations to be good.
Environmental
Matters
We
are subject to a variety of governmental regulations related to the discharge or
disposal of toxic, volatile or otherwise hazardous waste. Our
compliance with federal, state and local provisions regulating the discharge of
materials into the environment, and the remedial actions we have taken with
respect to environmental regulations, have not had, and are not expected to
have, a material effect on our business, financial condition, results of
operations and cash flows.
The following table
identifies the current executive officers of Semitool, the positions in which
they serve, and the year in which they began serving in their respective
capacities.
|
Name
|
Age
|
Position
|
||
|
Since
|
||||
|
Raymon F.
Thompson (1)
|
68
|
Chairman and
Chief Executive Officer
|
1979
|
|
|
Larry E.
Murphy (2)
|
50
|
President and
Chief Operating Officer
|
2004
|
|
|
Larry A.
Viano (3)
|
55
|
Vice
President and Chief Financial Officer
|
2003
|
|
|
Timothy C.
Dodkin (4)
|
60
|
Executive
Vice President
|
2003
|
|
|
Richard C.
Hegger (5)
|
53
|
Vice
President, General Counsel and Secretary
|
2005
|
|
|
Herbert
Oetzlinger (6)
|
42
|
Vice
President, Sales (Europe)
|
2008
|
|
|
Klaus H.
Pfeifer (7)
|
51
|
Vice
President, Copper Interconnect and BEOL Cleans
|
2009
|
|
|
Richard P.
Schuster (8)
|
53
|
Vice
President, Global Service
|
2002
|
|
|
Paul M.
Siblerud (9)
|
50
|
Vice
President, Advanced Packaging
|
2005
|
|
|
James L.
Wright (10)
|
46
|
Vice
President, Manufacturing
|
2006
|
___________
(1) Raymon F. Thompson founded
Semitool in 1979 and serves as our Chairman and Chief Executive Officer. In
1979, Mr. Thompson designed, patented and introduced the first on-axis spin
rinser/dryer for the semiconductor industry.
(2) Larry E. Murphy joined us in
May 2004 as our Chief Operating Officer and has served as our President since
April 2005.
(3) Larry A. Viano joined us in
1985 and has held various positions with the Company since then. Mr. Viano
has served as our Vice President, Chief Financial Officer since May 2003. He
also serves as our Principal Accounting Officer.
(4) Timothy C. Dodkin has been
employed by us since 1985 and has served on our Board of Directors since 1998.
Mr. Dodkin has held a number of sales-related positions including Senior
Vice President, Global Sales and Marketing and, since June 2003, has served as
Executive Vice President.
(5) Richard C. Hegger joined us
in 2000 as our General Counsel and has served as our Secretary since February
2005. Prior to joining the Company, Mr. Hegger worked for a major
international law firm and specialized in corporate transactions. He is a
graduate of Columbia University School of Law and a member of the bars of
Montana, New York and Missouri.
(6) Herbert Oetzlinger joined us
in 1988 and has held various positions with the Company since then. Mr.
Oetzlinger has served as our Vice President of Sales (Europe) since March
2008.
(7) Klaus H. Pfeifer joined us in
2006 as our general manager of Copper Interconnect. In June 2009, Mr. Pfeifer
was promoted to the position of Vice President of the Copper Interconnect and
Back End of Line Cleans division. Prior to joining the Company, Mr. Pfeifer was
a program manager for copper low-k integration with the interconnect division of
SEMATECH and spent 18 years with Philips Semiconductors where he worked with the
SEMATECH consortium as program manager of interconnect in advanced dielectrics
and metallization.
(8) Richard P. Schuster joined us
in 1997 as Director of Global Customer Support. Since 2002, Mr. Schuster has
served in the role of Vice President, Global Service.
(9) Paul M. Siblerud joined us in
1998 and has held various positions with the Company since then. Mr. Siblerud
has served as our Vice President, Marketing since 2005 and our Vice President,
Advanced Packaging since 2008.
(10) James L. Wright joined us in
2003 as our Director of Operations and has served as our Vice President of
Manufacturing since March 2006.
The executive
officers are elected each year by the Board of Directors to serve for a one-year
term of office. Each of the executive officers identified above is a
party to a change of control agreement, and Mr. Murphy is a party to a letter
agreement relating to his employment with the Company. Otherwise, none of the
executive officers has a contract providing for a term of employment. See Part
III for further details on these agreements and arrangements.
Set forth below are
risks and uncertainties that could negatively impact our business, financial
condition, results of operations and cash flows, and could cause actual results
to differ materially from the results contemplated by the forward-looking
statements contained in this Annual Report on Form 10-K. These risks
and uncertainties could also cause our stock price to decline.
We
have announced our intention to be acquired by Applied Materials and if that
transaction is not concluded successfully we may face challenges in growing our
business and remaining competitive.
On
November 17, 2009 we announced that we had entered into an agreement with
Applied Materials, pursuant to which Applied Materials would acquire Semitool,
Inc. in a combination tender offer and merger. We expect the
transactions to close in the first or second fiscal quarters of fiscal 2010.
However, the transactions are subject to a number of closing conditions,
including our shareholders having tendered more than two-thirds of our
outstanding common stock in the tender offer, the receipt of certain U.S. and
foreign governmental approvals, and that there be no legal impediment to
completing the transactions. Were any of these conditions to fail, and a party
were to terminate the merger agreement and abandon the transactions, we would
expect to face an immediate and significant reduction in the market price of our
common stock. Moreover, we may face difficulties in establishing and maintaining
long-term relationships with our key customers and suppliers, who may question
our long-term willingness and ability to remain independent. Additionally, we
may face difficulties in attracting financing on terms we deem reasonable, or at
all. Any one or more of these events could have a material adverse effect upon
our results of operations, financial condition, and cash flows.
We
are facing legal challenges over our decision to enter into the acquisition
transactions with Applied Materials.
On
or about November 19, 2009, November 30, 2009 and December 4, 2009, three
purported class action lawsuits related to the tender offer and the merger,
captioned Stationary Engineers Local 39 Pension Trust Fund vs. Semitool, Inc.,
et al. (Cause No. DV-09-1461(B)), Stern vs. Thompson, et al. (Cause No.
DV-09-1513(C)), and Marvel v. Thompson, et al., respectively, were filed in the
Montana Eleventh Judicial District Court, County of Flathead, against Semitool,
each of Semitool’s directors, Applied Materials and Jupiter Acquisition Sub,
Inc. (the plaintiff in the Stationary Engineers Local action then filed an
amended complaint on or about November 25, 2009). Motions for
expedited proceedings were filed by the plaintiffs in the first and second
actions, respectively, on November 23, 2009 and December 1, 2009, in each case
requesting, among other things, that the Court expedite discovery and schedule a
hearing on such plaintiff’s proposed motion for a preliminary injunction no
later than December 17, 2009, the currently scheduled Expiration Date of the
tender offer. A hearing on the motion for expedited proceedings in
the Stationary Engineers Local action took place on December 9, 2009 and, on
December 10, 2009, the court issued an order denying the plaintiff’s motion for
expedited discovery and issued another order scheduling a hearing on December
15, 2009 in respect of plaintiff’s motion for a preliminary
injunction.
The actions, each brought by a purported shareholder of Semitool, seek certification of a class of all holders of Semitool common stock (except the defendants and their affiliates) and allege, among other things, that Semitool’s directors breached their fiduciary duties by (i) failing to maximize shareholder value; (ii) securing benefits for certain defendants at the expense or to the detriment of Semitool’s public shareholders; (iii) discouraging and/or inhibiting alternative offers to purchase control of Semitool or its assets; and (iv) failing to disclose material non-public information, and that Applied Materials aided and abetted such alleged breaches. The actions seek, among other things, injunctive relief enjoining the defendants from consummating the tender offer and the merger and damages, as well as recovery of the costs of the action, including reasonable attorneys’ and experts’ fees. Semitool believes the claims alleged against it in the actions to be without merit and intends to defend against them vigorously. In addition, Applied Materials has informed the Company that it also believes the allegations against it in the actions to be without merit, and that it intends to defend against the claims vigorously. However, were a court to disagree with our contention, it may delay the Applied Materials transaction or may award damages to plaintiff shareholders. We also can offer no assurances that other such lawsuits will not be brought, or that if brought, such suits can be timely and effectively defended. Further, the merger agreement contains among other customary conditions a provision that would allow either Semitool or Applied Materials to abandon the tender offer or terminate the merger agreement if any temporary or permanent injunction has been entered that would have the effect of making the transactions unlawful. Because we believe the combination with Applied Materials will enhance Semitool’s ability to compete and expand into new product lines, and that the best value for our shareholders can be obtained by completing these transactions, the delay of or setting aside of these transactions or the abandonment of these transactions by the parties would likely have a material adverse impact upon the market price of our common stock, and may otherwise materially and adversely affect our business strategy and our franchise value. Additionally, shareholder litigation is time-consuming, expensive, and potentially distracting to management, which may cause adverse impacts upon our results of operations or business during the pendency of this lawsuit.
If we require additional capital in
the future, it may not be available, or if available, may not be on terms
acceptable to us.
We
believe that our existing balances of cash, cash equivalents and cash flows from
operations will be sufficient to meet our cash needs for working capital and
capital expenditures for at least the next 12 months. We may, however,
require additional financing to fund our operations in the future. Although we
expect cash flows generated from operating activities to be sufficient to fund
operations at the current and projected levels in the future, there is no
assurance that our operating plan will be achieved. We may need to take actions
to reduce costs, seek alternative financing arrangements or pursue additional
placement of our common stock.
A
significant contraction in the capital markets, particularly in the technology
sector, may make it difficult for us to raise additional capital in the future,
if and when it is required, especially if we are unable to maintain
profitability. If adequate capital is not available to us as required, or is not
available on favorable terms, our shareholders may be subject to significant
dilution in their ownership if we raise additional funds through the issuance of
equity securities, or we could be required to significantly reduce or
restructure our business operations.
The Company has a
$30 million Credit Agreement, renewable annually, with Wells Fargo Trade Bank
(Trade Bank) with an expiration date of March 1, 2010 with $15 million in
advances outstanding as of September 30, 2009. There is no assurance that this
facility will be sufficient to meet our cash needs. In addition, the credit
facility contains financial covenants which must be met for the availability of
funds. We have been in discussions with the Trade Bank regarding our compliance
with the Funded Debt to EBITDA covenant. There exists an ambiguity in
interpretation which is unresolved, but which if interpreted as noncompliance
with the covenant, would allow the Trade Bank to notify us that the
non-compliance constitutes an event of default under the facility that (i)
prevents further borrowings and (ii) gives them the right to accelerate the
payment of all amounts outstanding under the loan. The bank has not provided us
with any notice of default (which is also subject to a right of cure within
twenty calendar days of the notice). In view of this ambiguity in
interpretation, we do not anticipate being able to request further advances
under the Credit Agreement until this matter is resolved. If interpreted in
favor of the Trade Bank, there would be a Funded Debt to EBIDTA ratio
requirement of not more than 2:1 as of September 30, 2009 (EBITDA for the
trailing twelve-month period ending September 30, 2009 was a negative number).
We continue to discuss credit facility requirements with the Trade Bank with a
view toward arranging a facility that resolves any issues regarding borrowing
limits and outstanding advances.
Further,
we do not currently have a plan to replace the Trade Bank credit facility when
it matures in March 2010. If the Applied Materials transaction has not been
consummated prior to that time, we may require additional borrowing capacity in
order to meet our working capital needs and to fund certain capital
expenditures. If we cannot secure adequate borrowing capacity on acceptable
terms, we may face limitations on our ability to grow our business or expand
into other product lines, and we may face shortfalls in working capital, which
could require us to reduce our sales, slow down our product development, or take
other measures that would be harmful to our results of operation or financial
condition.
We have incurred significant net
losses in the past, our future revenues are inherently unpredictable, and we may
be unable to maintain profitability.
We
have incurred significant net losses in the past. Our operating results for
future periods are subject to numerous uncertainties, and we cannot assure that
we will be able to maintain profitability. It is possible that in future
quarters our operating results will decrease from the previous quarter or fall
below the expectations of securities analysts and investors. In this event, the
trading price of our common stock could significantly decline. Further,
exacerbated or continuing declines in net income or increases in net losses
could affect our liquidity, results of operations, or financial
conditions.
Our quarterly operating results have
varied in the past and will continue to vary significantly in the future,
potentially causing volatility in our stock price.
Our quarterly
operating results have varied significantly in the past and will continue to do
so in the future, which we anticipate will continue to cause our common stock
price to fluctuate in the future. Some of the factors that may
influence our operating results and subject our common stock to price and volume
fluctuations include:
|
•
|
changes in
customer demand for our systems, which is influenced by economic
conditions, technological developments in the semiconductor industry, and
the announcement or release of enhancements to existing products or new
product offerings by our competitors;
|
|
|
•
|
demand for
products that use semiconductors;
|
|
|
•
|
market
acceptance of our systems and changes in our product
offerings;
|
|
|
•
|
size and
timing of orders from customers;
|
|
|
•
|
customer
cancellations or delays in orders, shipments, and
installations;
|
|
|
•
|
customer
delays or rejections of final acceptance of our
shipments;
|
|
|
•
|
changes in
average selling price and product mix;
|
|
|
•
|
failure to
ship an anticipated number of systems in the quarter;
|
|
|
•
|
product
development costs, including research, development, engineering and
marketing expenses associated with our introduction of new products and
product enhancements;
|
|
|
•
|
sudden
changes in component prices or availability;
|
|
|
•
|
manufacturing
inefficiencies caused by uneven or unpredictable order patterns, reducing
our gross margins;
|
|
|
•
|
costs
associated with protecting our intellectual property;
|
|
|
•
|
level of our
fixed expenses relative to our net sales; and
|
|
|
•
|
fluctuating
costs associated with our international organization and international
sales, including currency exchange rate
fluctuations.
|
During any quarter,
a significant portion of our net sales may be derived from the sale of a
relatively small number of high priced systems. The selling prices of
our systems range from approximately $20,000 to in excess of $5.0
million. Accordingly, a small change in the number and/or mix of
tools we sell may cause significant changes in our operating
results.
Our results also
may fluctuate because of the terms on which we deliver certain of our systems,
which in some instances allow customers an extended period of acceptance before
becoming obligated to pay for products we have delivered. We follow
authoritative accounting guidance regarding revenue recognition for sales that
involve contractual customer acceptance provisions and product installation
commitments. Timing of revenue recognition from the sale of new
systems, sales to new customers and installation services is subject to the
length of time required to achieve customer acceptance after shipment, which
could cause our operating results to vary from period to period.
In
light of these factors and the cyclical nature of the semiconductor industry, we
expect to continue to experience significant fluctuations in quarterly and
annual operating results. Moreover, many of our expenses are fixed in
the short-term which, together with the need for continued investment in
research and development, marketing and customer support, limits our ability to
reduce expenses quickly in response to declines in sales. As a
result, net sales could decline and harm our business, financial condition,
results of operations and cash flows, which could cause our operating results to
be below the public market analysts’ or investors’ expectations and the market
price of our stock could decline.
Cyclicality in the semiconductor
industry and the semiconductor equipment industry has historically led to
substantial variations in demand for our products and consequently our operating
results, and will continue to do so.
Our
operating results are subject to significant variation due to the cyclical
nature of the semiconductor industry’s business cycles, the timing, length and
volatility of which are difficult to predict. Our business depends
upon the capital spending of semiconductor manufacturers, which, in turn,
depends upon the current and anticipated market demand for semiconductors and
products using semiconductors. The semiconductor industry has
historically been cyclical because of sudden changes in demand for
semiconductors and manufacturing capacity, including capacity utilizing the
latest technology. The rate of changes in demand, including end-user
demand, is accelerating, and the effect of these changes on us is occurring
sooner, exacerbating the volatility of these cycles. These changes
have affected the timing and amounts of customers’ capital equipment purchases
and investments in new technology, and continue to affect our net sales, gross
margin and results of operations.
During downturns,
the semiconductor equipment industry typically experiences a more pronounced
percentage decrease in revenues than the semiconductor industry. A
prolonged downturn can seriously affect our net sales, gross margin and results
of operations. In addition, during downturns, it is critical to
appropriately align our cost structure with prevailing market conditions, to
minimize the effect of such downturns on our operations, and in particular, to
continue to maintain our core research and development programs. If
we are unable to align our cost structure in response to such downturns on a
timely basis, or if such implementation has an adverse impact on our business,
then our financial condition, results of operations and cash flows may be
negatively affected to an even larger extent during industry
downturns.
Conversely, during
an upturn or periods of increasing demand for semiconductor manufacturing
equipment, we may not have sufficient manufacturing capacity and inventory to
meet customer demand. During an upturn we would be unable to predict
the sustainability of a recovery, if any, and/or the industry’s rate of growth
in such a recovery, both of which will be affected by many
factors. If we are unable to effectively manage our resources and
production capacity during an industry upturn, we may fail to plan for
increasing demand, or we may overestimate the potential demand, in either of
which cases there could be a material adverse effect on our business, financial
condition, results of operations and cash flows.
We have experienced periods of rapid
growth and decline in operating levels, and if we are not able to successfully
manage these significant fluctuations, our business, financial condition and
results of operations could be significantly harmed.
We
have experienced periods of significant growth and decline in net
sales. Our net sales decreased approximately 41.7% from $238.6
million in fiscal 2008 to $139.0 million in fiscal 2009 and increased
approximately 11.0% from $215.2 million in fiscal 2007 to $238.6 million in
fiscal 2008. However, there have been periods of even more
significant declines in net sales; for example, our net sales decreased 51.8%
from approximately $256.5 million for fiscal 2001 to approximately
$123.7 million for fiscal 2002. In addition, our consolidated
orders backlog decreased 30.9% from approximately $85.3 million at
September 30, 2006 to $58.9 million at September 30,
2007. If we are unable to effectively manage periods of rapid decline
or sales growth, our business, financial condition, results of operations and
cash flows could be significantly harmed.
Our deferred revenue and orders
backlog may not result in future net sales.
Revenue recognition
guidance requires that revenue and the associated profit from the sale of newly
introduced systems, systems sales into new customer environments and substantive
installation obligations that are subject to contractual customer acceptance
provisions are deferred until the customer has acknowledged their acceptance of
the system. If the system does not meet the agreed specifications and
the customer refuses to accept the system, the deferred revenue and associated
deferred profit will not be realized and we may be required to refund any cash
payments previously received from the customer, which may harm our business,
financial condition, results of operations and cash flows.
Order backlog does
not necessarily include all sales needed to achieve net revenue expectations for
a subsequent period. We schedule the production of our systems based in part
upon order backlog. Due to possible customer changes in delivery
schedules and cancellations of orders, our backlog at any particular date is not
necessarily indicative of actual sales for any succeeding period. In
addition, while we evaluate each customer order to determine qualification for
inclusion in backlog, there can be no assurance that amounts included in backlog
will ultimately result in future sales. A reduction in backlog during
any particular period, or the failure of our backlog to result in future sales,
could harm our business, financial condition, results of operations and cash
flows. For example, in the fourth quarter of fiscal 2008, we
experienced an abnormally high amount of customer cancellations.
Our continued high spending levels on
research and development and the need to maintain a high level of customer
service and support may, under certain circumstances, harm our results of
operations.
In
order to remain competitive, we must maintain a high level of investment in
research and development, marketing and customer service while controlling
operating expenses.
Our industry is
characterized by the need for continued investment in research and development
as well as a high level of worldwide customer service and support. As
a result of our need to maintain spending levels in these areas, our operating
results could be materially harmed if our net sales fall below
expectations. In addition, because of our emphasis on research and
development and technological innovation, our operating costs may increase
further in the future, which could have a negative impact on our results of
operations and cash flow in any given period.
There
can be no assurance that we will have sufficient resources to continue to make a
high level of investment in research and development, marketing and customer
service while controlling operating expenses or that our products will continue
to be viewed as competitive as a result of technological advances by competitors
or changes in semiconductor processing technology. Such competitive
pressures may necessitate significant price reductions by us or result in lost
orders, which could harm our business, financial condition, results of
operations and cash flows.
We depend on our key customers with
which we do not have long-term contracts. Any loss, cancellation, reduction or
delay in purchases by, or failure to collect receivables from, these customers
could harm our business.
Typically, we do
not have long-term contracts with our customers. As a result, our
agreements with our customers do not provide any assurance of future
sales. Sales are made pursuant to purchase orders, which can be
cancelled or delayed by our customers at any time. Our customers are
not required to make minimum purchases from us, or make purchases at any
particular time; our customers are free to purchase products from our
competitors; and our customers can stop purchasing our products at any time
without penalty.
In
addition, customer cancellations and requests for delayed deliveries can create
a material adverse effect on our business, financial condition, results of
operations and cash flows. During the recent economic turmoil
affecting the world’s economies, we experienced a significantly higher amount of
customer cancellations and requests for delays in delivery. While in
some cases we have contractual protections against such cancellations or
requests for delayed shipments, there is no assurance in the future that we will
be able to collect amounts due under those provisions.
Our ten largest
customers accounted for approximately 48.2%, 56.0% and 67.8% of net sales in
fiscal 2009, 2008 and 2007, respectively. There are a limited number
of large companies operating in the highly concentrated, capital intensive
semiconductor industry. Accordingly, we expect that we will continue
to depend on a relatively small number of large companies for a significant
portion of our net sales. Although the composition of the group of
largest customers may change from year to year, the loss of, or a significant
curtailment of purchases by, one or more of our key customers or the delay or
cancellation of a large order could cause our net sales to decline
significantly, which would harm our business, financial condition, results of
operations and cash flows. Similarly, delays in payments by large
customers could have a significant impact on our cash flows.
Intense competition in the markets in
which we operate may adversely affect our market share and reduce demand for our
products.
We
face substantial competition from established competitors, some of which
have:
|
•
|
greater
financial, marketing, technical and other resources;
|
|
|
•
|
broader and
integrated product lines;
|
|
|
•
|
more
extensive customer support capabilities; and
|
|
|
•
|
larger sales
organizations and customer bases.
|
|
We
may also face competition from new market entrants. Our ability to
compete successfully in the future depends on a number of factors,
including:
|
•
|
system
performance, quality and reliability;
|
|
|
•
|
upfront price
and maintenance costs of using our products;
|
|
|
•
|
ability to
ship products on time to meet customers’ demands;
|
|
|
•
|
timeliness
and quality of technical support service; and
|
|
|
•
|
our success
in developing new and enhanced products.
|
|
Due to intense
competitive conditions in the semiconductor equipment industry, we have from
time to time selectively reduced prices on our systems in order to protect our
market share, and competitive pressures may necessitate further price
reductions. Periodically, our competitors announce the introduction
of new products or lower prices which can affect our customers’ decisions to
purchase our systems, the prices we can charge for our systems and the level of
discounts we grant our customers.
Moreover, there has
been significant merger and acquisition activity among our competitors and
potential competitors. These combinations may provide our competitors
and potential competitors with a competitive advantage over us by enabling them
to more rapidly expand their product offerings and service capabilities to meet
a broader range of customer needs. Many of our customers and
potential customers are relatively large companies that require global support
and service for their semiconductor manufacturing equipment. Our
larger competitors have more extensive infrastructures, which could place us at
a disadvantage when competing for the business of global semiconductor device
manufacturers.
We
expect our competitors to continue to improve the design and performance of
their products. We cannot assure you that our competitors will not
develop enhancements to, or future generations of, competitive products that
will offer superior price, performance and/or cost of ownership features, or
that new processes or technologies will not emerge that render our products less
competitive or obsolete.
As a
result of the substantial investment required to evaluate and select capital
equipment and integrate it into a production line, we believe that once a
manufacturer has selected certain capital equipment from a particular vendor,
there is a tendency for the manufacturer to rely upon that vendor to provide
equipment for the specific production line application and may seek to rely upon
that vendor to meet other capital equipment
requirements. Accordingly, we may be at a competitive disadvantage
for a protracted period of time with respect to a particular customer if that
customer utilizes a competitor’s manufacturing equipment.
Our Raider platform accounts for a
substantial portion of current and anticipated sales.
We
have leveraged our Raider platform to address both surface preparation and ECD
applications. In fiscal year 2009, the Raider platform accounted for
approximately 80% of our tool revenues. We expect that revenue from
our Raider platform will continue to account for a significant portion of our
revenue. Accordingly, if the Raider platform were adversely affected
by its own performance, price or total cost of ownership, or the availability,
functionality and price of competing products and technologies, that could have
a material adverse impact on our business, financial condition, results of
operations and cash flows.
Rapid technological change could make
our products and inventories obsolete or unmarketable.
We
operate in an industry that is subject to evolving industry standards, rapid
technological changes, rapid changes in customer demands and the rapid
introduction of new, higher performance systems with shorter product life
cycles. For example, recent trends in semiconductor manufacturing
include the move toward smaller device features to lower cost and improve
performance, the use of new materials to achieve higher speed and performance of
an integrated circuit, and the migration to 300mm diameter wafers from 200mm
diameter wafers to increase productivity and reduce costs. As a result of these
and other trends in our industry, we expect to continue to make significant
investments in research and development. Although, historically, we
have had adequate funds from operations to devote to research and development,
there can be no assurance that we will have funds available, and in sufficient
quantities, in the future for such research and development
activities.
Introductions of
new products by us or our competitors could adversely affect sales of our
existing products and may cause these existing products and related inventories
to become obsolete or unmarketable, or otherwise cause our customers to defer or
cancel orders for existing products. We may be unable to develop and
introduce new products or enhancements to our existing products on a timely
basis or in a manner which satisfies customer needs or achieves widespread
market acceptance. Any significant delay in releasing new systems
could adversely affect our reputation, give a competitor a first-to-market
advantage or allow a competitor to achieve greater market
share. These effects of rapid technological change could harm our
business, financial condition, results of operations and cash
flows.
Our results of operations may suffer
if we do not effectively manage our inventories or are required to write down
our inventories due to changing market demands for our
products.
To
achieve commercial success with our products, we need to manage our inventory of
component parts and finished goods effectively to meet changing customer product
and volume requirements. Some of our products and supplies, have in
the past and may in the future, become obsolete, while in inventory, due to
rapidly changing customer specifications or slowdowns in demand for existing
products ahead of new product introductions by us or our
competitors. If we are not successfully able to manage our inventory,
including our spare parts inventory, we may need to write off unsaleable or
obsolete inventory, which would adversely affect our results of
operations. For example, in the fourth quarter of fiscal 2007, we
wrote down inventory by approximately $3.0 million primarily due to product
enhancements that changed the usage of certain component parts, making them
obsolete. We have pursued a vertically-integrated manufacturing model
and therefore a significant portion of our supply chain is manufactured by
Semitool. Consequently, we may be more exposed to having
significantly greater inventory on hand than competing companies which rely more
heavily on outsourced supply chains.
Our dependence on key suppliers could
delay shipments and increase our costs.
Some components and
subassemblies included in our products are obtained from a single source or a
limited group of suppliers. The loss of, or disruption in, shipments
from these sole or limited source suppliers could, in the short-term, adversely
affect our business and results of operations. Further, a significant
increase in the price of one or more of these components could harm our
business, financial condition, results of operations and cash
flows.
Our future success depends on
international sales.
Our net sales
attributable to customers outside the United States as a percentage of our total
net sales were approximately 74.5%, 71.4% and 62.5% for fiscal 2009, 2008 and
2007. We expect net sales outside the United States to continue to
represent a significant portion of our future net sales. Sales to
customers outside the United States are subject to various risks,
including:
|
•
|
exposure to
currency fluctuations and related derivatives used to hedge such
fluctuations;
|
|
|
•
|
exposure of
foreign accounts to currency exchange translations;
|
|
|
•
|
political and
economic instability, including terrorism;
|
|
|
•
|
unexpected
changes in regulatory requirements;
|
|
|
•
|
tariffs and
other market barriers;
|
|
|
•
|
potentially
adverse tax consequences;
|
|
|
•
|
outbreaks of
hostilities, particularly in Israel, Korea, Taiwan or
China;
|
|
|
•
|
difficulties
in managing foreign sales representatives and
distributors; and
|
|
|
•
|
difficulties
in staffing and managing foreign branch operations.
|
|
A
substantial portion of our international sales are denominated in U.S.
dollars. Therefore, if the U.S. dollar rises in value in relation to
foreign currencies, our systems will become more expensive to customers outside
the United States and less competitive with systems produced by competitors
outside the United States. Such conditions could negatively impact
our international sales.
Although we
endeavor to meet technical standards established by foreign standards setting
organizations, there can be no assurance that we will be able to comply with
changes in foreign standards in the future.
Variations in the amount of time it
takes for us to sell our systems may cause fluctuations in our operating
results, which could cause our stock price to decline.
Variations in the
length of our sales cycles could cause our net sales, and thus our business,
financial condition, results of operations and cash flows, to fluctuate widely
from period to period. This variation could cause our stock price to
decline. Our customers generally take a long time to evaluate many of
our products before committing to a purchase. We expend significant
resources educating and providing information to our prospective customers
regarding the uses and benefits of our systems. The length of time it
takes us to make a sale depends upon many factors, including:
|
•
|
the efforts
of our sales force and our independent sales representatives and
distributors;
|
|
|
•
|
the
complexity of our customers’ fabrication processes;
|
|
|
•
|
the internal
technical capabilities and sophistication of the
customer; and
|
|
|
•
|
capital
spending by our customers.
|
|
Because of the
number of factors influencing the sales cycle, the period between our initial
contact with a potential customer and the time when we recognize revenue from
our customer, if ever, varies widely in length. Our sales cycle
typically ranges from one month to two years. Occasionally our sales
cycle can be even longer, particularly with our international customers and new
technologies. The subsequent build cycle, or the time it takes us to
build a product to customer specifications after receiving an order, typically
ranges from one to six months. During these cycles, we commit
substantial resources to our sales efforts in advance of receiving any revenue,
and we may never receive any revenue from a customer despite our sales
efforts.
When a customer
purchases one of our systems, that customer often evaluates the performance of
the system for a lengthy period before considering the purchase of more
systems. The number of additional products a customer may purchase
from us, if any, depends on many factors, including the customer’s capacity
requirements. The period between a customer’s initial purchase and
subsequent purchases, if any, often varies from two to twelve months or longer,
and variations in length of this period could cause further fluctuations in our
business, financial condition, results of operations, cash flows, and possibly
our stock price.
If we deliver systems with defects,
our credibility may be harmed, sales and market acceptance of our systems may
decrease and we may incur liabilities associated with those
defects.
Our systems are
complex and sometimes have contained errors, defects and software bugs when
introduced. If we deliver systems with errors, defects or software
bugs, our credibility and the market acceptance and sales of our systems could
be harmed. Further, if our systems contain errors, defects or
software bugs, we may be required to expend significant capital and resources to
alleviate such problems. Defects could also lead to commercial and/or
product liability as a result of lawsuits against us or against our
customers. We have agreed to product liability
indemnities. Our product and commercial liability insurance policies
currently provide only limited coverage per claim. In the event of a
successful product liability and/or commercial claim, we could be obligated to
pay damages that may not be covered by insurance or that are significantly in
excess of our insurance limits.
Failure of our products to gain
market acceptance would adversely affect our financial condition and our ability
to provide customer service and support.
We
believe that our growth prospects depend upon our ability to gain customer
acceptance of our products and technology. Market acceptance of products depends
upon numerous factors, including compatibility with existing manufacturing
processes and products, perceived advantages over competing products and the
level of customer service available to support such
products. Moreover, manufacturers often rely on a limited number of
equipment vendors to meet their manufacturing equipment needs. As a
result, market acceptance of our products may be adversely affected to the
extent potential customers utilize a competitor’s manufacturing
equipment. There can be no assurance that growth in sales of new
products will continue or that we will be successful in obtaining broad market
acceptance of our systems and technology.
We
expect to spend a significant amount of time and resources to develop new
products and refine existing products. In light of the long product
development cycles inherent in our industry, these expenditures will be made
well in advance of the prospect of deriving revenue from the sale of any new
systems. Our ability to commercially introduce and successfully
market any new products is subject to a wide variety of challenges during this
development cycle, including start up delays, design defects and other matters
that could delay the introduction of these systems to the
marketplace. As a result, if we do not achieve market acceptance of
new products, we may not be able to realize sufficient sales of our systems in
order to recoup research and development expenditures. The failure of
any of our new products to achieve market acceptance would harm our business,
financial condition, results of operations and cash flows.
We manufacture substantially all of
our equipment at two facilities and any prolonged disruption in the operations
of either facility could have a material adverse effect on our net
sales.
We
manufacture substantially all of our equipment in our manufacturing facilities
located near Kalispell, Montana. Our manufacturing processes are
highly complex and require sophisticated and costly equipment and a specially
designed facility. As a result, any prolonged disruption in the operations of
either of our manufacturing facilities, whether due to technical or labor
difficulties, destruction or damage as a result of a fire or any other reason,
could seriously harm our ability to satisfy our customer order
deadlines. If we cannot provide timely delivery of our systems, our
business, financial condition, results of operations and cash flows would be
adversely affected to a significant extent.
Compliance with environmental
regulations may be very costly, and the failure to comply could result in
liabilities, fines and cessation of our business.
We
are subject to a variety of governmental regulations related to the discharge or
disposal of toxic, volatile or otherwise hazardous chemicals. Current
or future regulations could require us to purchase expensive equipment or to
incur other substantial expenses to comply with environmental
regulations. Any failure by us to control the use of, or adequately
restrict the discharge or disposal of, hazardous substances could subject us to
future liabilities, result in fines being imposed on us, or result in the
suspension of production or cessation of our manufacturing
operations.
If the protection of our proprietary
rights is inadequate, our business could be harmed.
We
place a strong emphasis on the technically innovative features of our products
and, where available, we generally seek patent protection for those
features. We currently hold 374 U.S. patents, some with pending
foreign counterparts, have approximately 101 U.S. patent applications
pending and intend to file additional patent applications, as we deem
appropriate. There can be no assurance that patents will issue from any of our
pending applications or that existing or future patents will be sufficiently
broad to protect our technology. While we attempt to protect our
intellectual property rights through patents, copyrights and non-disclosure
agreements, there can be no assurance that we will be able to protect our
technology, or that competitors will not be able to develop similar technology
independently. In addition, the laws of certain foreign countries do
not protect our intellectual property to the same extent as the laws of the
United States. Furthermore, certain types of intellectual property
are country-specific; for example, U.S. patents provide protection in the U.S.
but generally do not provide protection outside the U.S. Moreover,
there can be no assurance that our existing or future patents will not be
challenged, invalidated or circumvented, or that the rights granted thereunder
will provide meaningful competitive advantages to us. In any of such
events, our business, financial condition, results of operations and cash flows
could be harmed.
There has been
substantial litigation regarding patent and other intellectual property rights
in semiconductor-related industries. Although we are not aware of any
potential infringement by our products of any patents or proprietary rights of
others, further commercialization of our technology could provoke claims of
infringement from third parties.
In
addition, we rely on trade secret protection for our technology, in part through
confidentiality agreements with our employees, consultants and third
parties. These agreements could be breached and we may not have
adequate remedies for any such breach. In any case, others may come to know
about or determine our trade secrets through a variety of methods.
Now and in the
future, litigation may be necessary to enforce patents issued to us, to protect
trade secrets or know-how owned by us or to defend us against claimed
infringement of the rights of others and to determine the scope and validity of
the proprietary rights of others. Any such litigation could cause us
to accrue substantial cost or divert our management or resources, which by
itself could have a material adverse effect on our financial condition, results
of operations and cash flows. Further, adverse determinations in such litigation
could result in our loss of proprietary rights, subject us to significant
liabilities and damages to third parties, require us to seek licenses from third
parties or prevent us from manufacturing or selling our products, any of which
could harm our business, financial condition, results of operations and cash
flows.
Our efforts to protect our
intellectual property may be less effective in some foreign countries where
intellectual property rights are not as well protected as in the United
States.
In
fiscal 2009, approximately 74.5% of our net sales were derived from sales in
foreign countries, including certain countries in Asia such as Singapore,
Taiwan, Japan, China and Korea. The laws of some foreign countries do
not protect our proprietary rights to as great an extent as do the laws of the
United States, and many U.S. companies have encountered substantial problems in
protecting their proprietary rights against infringement in such countries, some
of which are countries in which we have sold and continue to sell
systems. For example, in many countries other than the U.S., the
public disclosure of an invention prior to the filing of a patent application
for the invention would invalidate the ability of a company to obtain a
patent. Similarly, in contrast to the United States where the
contents of patent applications may remain confidential during the patent
prosecution process in certain cases, the contents of a patent application may
be published before a patent is granted, which provides competitors an advanced
view of the contents of applications prior to the establishment of patent
rights. For these and other reasons, we also have not filed patent
applications in these countries to the same extent that we file in the
U.S. There is a risk that our means of protecting our proprietary
rights may not be adequate in these countries. Our competitors in
these countries may independently develop similar technology or duplicate our
systems. If we fail to adequately protect our intellectual property
in these countries, it would be easier for our competitors to sell competing
products in those countries.
Anti-takeover provisions in our
charter documents could adversely affect the rights of the holders of our common
stock.
Our Articles of
Incorporation authorize our Board of Directors to issue preferred stock in one
or more series and to fix the rights, preferences, privileges and restrictions
granted to or imposed upon any unissued shares of preferred stock and to fix the
number of shares constituting any series and the designations of such series,
without further vote or action by the shareholders. We have no
present plans to issue any preferred stock in order to deter a takeover and/or
adopt additional anti-takeover measures. If such actions are taken in
the future, they may make a change of control difficult, even if a change of
control would be beneficial to our shareholders. Further, our
Agreement and Plan of Merger with Applied Materials, Inc., dated November 16,
2009, prohibits our soliciting or, with certain exceptions, entertaining,
discussions which could lead to a merger with or acquisition by a person other
than Applied Materials. Further, the merger agreement provides for certain fees
and liquidated damages payments in the event we abandon the merger or take other
actions inconsistent with its completion, in the event our board of directors
determines in the exercise of their fiduciary duties that the transactions no
longer can be considered to be in the best interests of the Company and our
shareholders. These provisions may have the effect of discouraging competing
offers to acquire the Company.
Any anti-takeover
provisions, including any issuance of preferred stock, could have the effect of
discouraging a third party from making a tender offer or otherwise attempting to
gain control of us. In addition, these provisions could limit the
price that investors might be willing to pay in the future for shares of our
common stock.
We must attract and retain key
personnel to help direct and support our future growth. Competition for such
personnel in our industry can be high.
Our success depends
to a significant degree upon the continued contributions of our key management,
engineering, sales and marketing, customer support, finance and manufacturing
personnel. The loss of any of these key personnel, particularly our
Chairman and Chief Executive Officer, Raymon F. Thompson, or our President and
Chief Operating Officer, Larry E. Murphy, could harm our business and operating
results. We do not have key person life insurance on any of our
executives. Further, to support future growth, we will need to attract and
retain additional qualified employees. The pool of qualified
applicants is limited and it can be difficult to hire and relocate personnel
from other areas. Competition for such personnel can be intense, and
we may not be successful in attracting and retaining qualified senior executives
and other employees.
None.
We
own two manufacturing facilities located on sites near Kalispell, Montana with
approximately 251,000 square feet in the aggregate. Additionally, we
own two manufacturing facilities located in Libby, Montana housing approximately
20,000 square feet in the aggregate. We also own a facility located
in Coopersburg, Pennsylvania, which serves as a manufacturing facility for our
Rhetech, Inc. subsidiary, which we expanded by 10,000 square feet in fiscal 2007
for a total of 32,000 square feet. We constructed and own a 29,000
square-foot production and office building in Salzburg, Austria. We
believe that our existing manufacturing facilities will be adequate to meet our
requirements for the foreseeable future and that suitable additional or
substitute space will be available as needed. We own an office
building in Cambridge, UK, which serves as our European headquarters for sales
and customer support. We also lease 13 other smaller facilities
worldwide, which are used as sales and customer service centers.
We
are subject to a variety of governmental regulations related to the discharge or
disposal of toxic, volatile, or otherwise hazardous chemicals used on Semitool’s
premises. We believe that we are in material compliance with these
regulations and that we have obtained all necessary environmental permits to
conduct our business. Nevertheless, current or future regulations
could require us to purchase expensive equipment or to incur other substantial
expenses to comply with environmental regulations. Any failure by us
to control the use of, or adequately restrict the discharge or disposal of,
hazardous substances could subject us to future liabilities, result in fines
being imposed on us, or result in the suspension of production or cessation of
our manufacturing operations.
On
or about November 19, 2009, November 30, 2009 and December 4, 2009, three
purported class action lawsuits related to the tender offer and the merger,
captioned Stationary Engineers Local 39 Pension Trust Fund vs. Semitool, Inc.,
et al. (Cause No. DV-09-1461(B)), Stern vs. Thompson, et al. (Cause No.
DV-09-1513(C)), and Marvel v. Thompson, et al., respectively, were filed in the
Montana Eleventh Judicial District Court, County of Flathead, against Semitool,
each of Semitool’s directors, Applied Materials and Jupiter Acquisition Sub,
Inc. (the plaintiff in the Stationary Engineers Local action then filed an
amended complaint on or about November 25, 2009). Motions for
expedited proceedings were filed by the plaintiffs in the first and second
actions, respectively, on November 23, 2009 and December 1, 2009, in each case
requesting, among other things, that the Court expedite discovery and schedule a
hearing on such plaintiff’s proposed motion for a preliminary injunction no
later than December 17, 2009, the currently scheduled Expiration Date of the
tender offer. A hearing on the motion for expedited proceedings in
the Stationary Engineers Local action took place on December 9, 2009 and, on
December 10, 2009, the court issued an order denying the plaintiff’s motion for
expedited discovery and issued another order scheduling a hearing on December
15, 2009 in respect of plaintiff’s motion for a preliminary
injunction.
The actions, each
brought by a purported shareholder of Semitool, seek certification of a class of
all holders of Semitool common stock (except the defendants and their
affiliates) and allege, among other things, that Semitool’s directors breached
their fiduciary duties by (i) failing to maximize shareholder value; (ii)
securing benefits for certain defendants at the expense or to the detriment of
Semitool’s public shareholders; (iii) discouraging and/or inhibiting alternative
offers to purchase control of Semitool or its assets; and (iv) failing to
disclose material non-public information, and that Applied Materials aided and
abetted such alleged breaches. The actions seek, among other things, injunctive
relief enjoining the defendants from consummating the tender offer and the
merger and damages, as well as recovery of the costs of the action, including
reasonable attorneys’ and experts’ fees. Semitool believes the claims alleged
against it in the actions to be without merit and intends to defend against them
vigorously. In addition, Applied Materials has informed the Company that it also
believes the allegations against it in the actions to be without merit, and that
it intends to defend against the claims vigorously.
We are involved in other legal proceedings that arise in the ordinary course of our business, including employment related litigation. Although there can be no assurance as to the ultimate disposition of these matters, it is the opinion of management, based upon the information available at this time, that the currently expected outcome of these matters, individually or in the aggregate, will not have a material adverse effect on our business, financial condition, results of operations or cash flows.
No
matters were submitted to the shareholders for a vote during the fourth quarter
of the fiscal year.
PART
II
Item
5. Market for Registrant’s Common Equity, Related
Shareholder Matters and Issuer Purchases of Equity
Securities
Our Common Stock is
traded under the symbol “SMTL” on the NASDAQ Global Select
Market. The approximate number of shareholders of record at December
1, 2009 was 112 and the reported last sale price on that date of our common
stock on the NASDAQ Global Select Market was $10.99. The high and low
sales prices for our common stock reported by the NASDAQ Global Select Market
are shown below.
|
Common
Stock Price Range
|
||||||||||||||||
|
Fiscal
Year
|
||||||||||||||||
|
Ended
September 30,
|
||||||||||||||||
|
2009
|
2008
|
|||||||||||||||
|
High
|
Low
|
High
|
Low
|
|||||||||||||
|
First
Quarter
|
$ | 7.86 | $ | 2.35 | $ | 9.95 | $ | 7.95 | ||||||||
|
Second
Quarter
|
$ | 3.75 | $ | 1.91 | $ | 8.86 | $ | 7.40 | ||||||||
|
Third
Quarter
|
$ | 5.35 | $ | 2.85 | $ | 9.05 | $ | 7.51 | ||||||||
|
Fourth
Quarter
|
$ | 8.72 | $ | 4.21 | $ | 9.64 | $ | 6.76 | ||||||||
Since our initial
public offering of common stock in February of 1995, we have never declared or
paid any cash dividend and we have no intent to do so in the near
future. Moreover, our merger agreement with Applied Materials, Inc.
restricts our ability to pay dividends without the consent of Applied Materials,
which consent may be withheld in Applied Materials’ sole
discretion.
Information
regarding securities issued by us under our equity compensation plans may be
found below in Part III under Item 11 and Item 12.
STOCK
PERFORMANCE GRAPH
The following graph
compares the percentage change in the cumulative total shareholder return on the
Company’s Common Stock from September 30, 2004 through the end of the Company’s
fiscal year ended September 30, 2009, with the percentage change in the
cumulative total return for the NASDAQ Composite Index and the RDG Semiconductor
Composite Index. The comparison assumes an investment of $100 on
September 30, 2004 in the Company’s Common Stock and in each of the foregoing
indices and assumes reinvestment of dividends. The stock performance shown on the
graph below is not necessarily indicative of future price
performance.
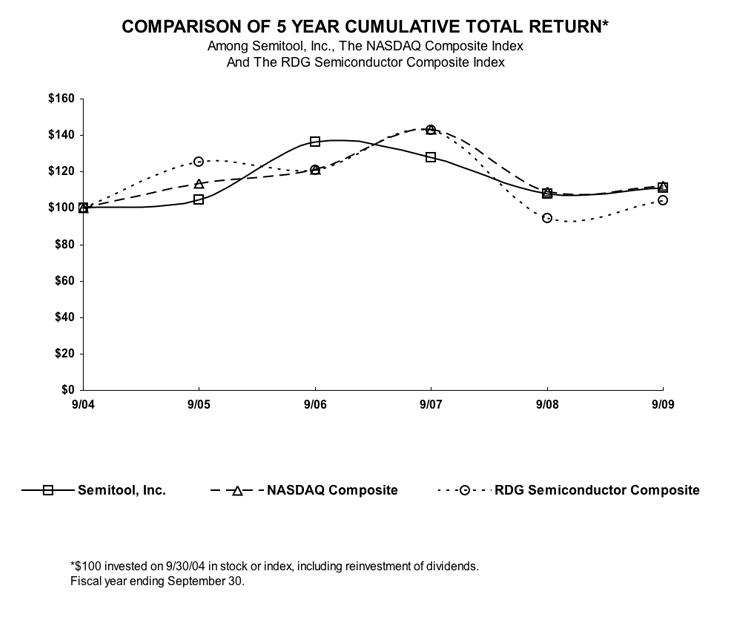
Item 6. Selected Financial Data
This summary should
be read in conjunction with the consolidated financial statements and related
notes included elsewhere in this Annual Report on Form 10-K.
Summary
Consolidated Financial Information
(in
thousands, except per share data)
|
Year
Ended September 30,
|
||||||||||||||||||||
|
2009
|
2008
|
2007
|
2006
|
2005
|
||||||||||||||||
|
Statement
of Operations Data:
|
||||||||||||||||||||
|
Net
sales
|
$ | 139,040 | $ | 238,604 | $ | 215,220 | $ | 243,218 | $ | 190,373 | ||||||||||
|
Gross profit
(1)
|
59,088 | 117,395 | 101,491 | 112,919 | 96,969 | |||||||||||||||
|
Income (loss)
from operations (2)
|
(18,907 | ) | 10,026 | 2,633 | 14,770 | 10,714 | ||||||||||||||
|
Net income
(loss)
|
(11,428 | ) | 6,037 | 5,231 | 9,836 | 10,050 | ||||||||||||||
|
Diluted
earnings (loss) per share
|
(0.35 | ) | 0.19 | 0.16 | 0.31 | 0.35 | ||||||||||||||
|
Balance
Sheet Data:
|
||||||||||||||||||||
|
Cash, cash
equivalents and marketable securities
|
44,642 | 12,821 | 16,090 | 17,347 | 7,032 | |||||||||||||||
|
Working
capital (1)
|
125,359 | 135,515 | 123,370 | 114,863 | 83,620 | |||||||||||||||
|
Total
assets
|
231,014 | 252,812 | 226,329 | 232,396 | 178,680 | |||||||||||||||
|
Short-term
debt
|
1,214 | 4,437 | 1,158 | 3,680 | 292 | |||||||||||||||
|
Long-term
debt and capital leases
|
9,260 | 10,417 | 10,027 | 4,699 | 3,111 | |||||||||||||||
|
Shareholders’
equity (3)
|
169,370 | 178,357 | 168,853 | 161,024 | 120,421 | |||||||||||||||
| (1 | ) |
In the fourth
quarter of fiscal 2007, we wrote down inventory by approximately $3.0
million primarily due to product enhancements that changed the usage of
certain component parts, making them
obsolete.
|
| (2 | ) |
Includes
downsizing costs of $2.6 million in fiscal 2009 and $677,000 in
fiscal 2007.
|
| (3 | ) |
In
conjunction with an equity offering of common stock in December 2005, the
Company issued three million shares of common stock resulting in
approximately $28.0 million in net cash
proceeds.
|
Item 7. Management’s Discussion and Analysis of
Financial Condition and Results of Operations
Overview
We
design, manufacture, install and service highly-engineered equipment for use in
the fabrication of semiconductor devices. Our products are focused on the wet
chemical process steps in integrated circuit, or IC, manufacturing and include
systems for wafer surface preparation and electrochemical deposition, or ECD,
applications. Our surface preparation systems are designed for Front End of Line
(FEOL), Back End of Line (BEOL) and wafer level packaging of ICs
processes. Our single-wafer FEOL surface preparation systems are used
for photoresist stripping, post etch and pre-diffusion cleans. Our
BEOL surface preparation systems are used for polymer removal and packaging
applications. Our ECD systems are used to plate copper and other
metals, which are used for the IC’s internal wiring, or interconnects; to plate
solder and lead free solder bumps for wafer level packaging applications; and to
plate other metals for various semiconductor and related applications. Also, our
surface preparation systems are used for cleaning and etching processes for
wafer level packaging. Our primary product for all of these processes
is the Raider platform, which is a multi-chamber single-wafer
tool. Our products address critical applications within the
semiconductor manufacturing process, and help enable our customers to
manufacture more advanced semiconductor devices that feature higher levels of
performance. The fabrication of semiconductor devices typically
requires several hundred manufacturing steps, with the number of steps
continuing to increase for advanced devices. Due to the breadth of
our product portfolio and advanced technology capabilities, our solutions
address over 150 of these manufacturing steps.
There are several
key trends in the semiconductor manufacturing industry driving growth in demand
for wafer surface preparation, ECD and other advanced semiconductor
equipment:
|
•
|
smaller
device features for lower cost and higher performance;
|
|
|
•
|
new materials
to fabricate more advanced semiconductor devices;
|
|
|
•
|
move to
single-wafer processing technologies for enhanced surface
preparation;
|
|
|
•
|
wafer level
and other advanced packaging to enable smaller portable products;
and
|
|
|
•
|
emerging need
for 3D chipstacking driven by the demand for smaller portable
devices.
|
|
As
the semiconductor manufacturing process increases in complexity and production
parameters become even more stringent, semiconductor manufacturers increasingly
rely upon manufacturers of semiconductor equipment to achieve improved process
control, provide a smaller equipment footprint and lower the cost of ownership
of their manufacturing processes. Key elements of our solution
include technological leadership, a comprehensive product portfolio, including
our Raider platform and vertically-integrated manufacturing and design
capabilities.
Key
Performance Indicators
Our management
focuses on revenues, gross margin, operating expenses and profitability in
managing our business. In addition to these financial measures found
in our consolidated financial statements, we also use bookings, backlog,
shipments, deferred revenue and shipment-based results of
operations. Bookings are firm orders for which we have received
written customer authorization in the fiscal period. Backlog is the
balance of undelivered orders at the end of a fiscal period. In order to be
included in bookings or backlog, an order must be scheduled to ship within the
next 12 months. Backlog and forecasted orders drive our production
schedule. Shipments measure how well we have met our production plan
and are viewed as a primary measure of factory output. Deferred
revenue primarily represents tool shipments for which we are awaiting final
customer acceptance.
Our results of
operations in fiscal 2009 were impacted by the weak global economy. Many of our
customers slowed their capital spending with the onset of the credit crisis and
the resulting uncertainty in the worldwide economy. Customers delayed capital
expenditure decisions and also pushed out delivery dates for tools already
ordered. Our results of operations were also impacted by the announcement that a
customer owing approximately $3.5 million filed for insolvency in a German court
in late January 2009. We responded to the current economic crisis by reducing
our workforce by approximately 35% and implementing other cost cutting
measures. In the fourth quarter of fiscal 2009, the economy showed
signs of improvement as our customers placed orders to meet capacity
requirements with bookings reaching $71.7 million as compared with $32.6 million
in the third quarter of fiscal 2009 and $24.6 million in the second quarter of
fiscal 2009.
On
November 16, 2009, we entered in a definitive agreement to be acquired by
Applied Materials, Inc., a Delaware corporation. Pursuant to the merger
agreement, Applied Materials commenced a tender offer to purchase all of the
outstanding shares of the Company’s common stock at a price of $11 per share,
net to seller in cash, without interest thereon and less any required
withholding tax. The tender offer was commenced on November 19, 2009 and the
initial expiration date is 12:00 midnight, Eastern Standard Time, on December
17, 2009, subject to extension as described in the offer materials and the
related merger agreement. Subsequent to the completion of the tender offer and
the satisfaction of certain other conditions set forth in the merger agreement,
the Company will merge with a wholly-owned subsidiary of Applied
Materials.
A summary of key
factors that impacted our financial performance during fiscal year 2009
includes:
| • |
Our fiscal
2009 bookings were $151.0 million and include $104.6 million in bookings
for our Raider platform. Fourth quarter fiscal 2009 net
bookings were $71.7 million. Our consolidated orders backlog of
$69.8 million and deferred revenue of $4.8 million resulted in a revenue
backlog of $74.6 million at September 30, 2009.
|
|
| • |
Shipments in
fiscal 2009 were $135.8 million including $84.0 million from Raider
shipments.
|
|
| • |
Net loss was
$11.4 million on net sales of $139.0 million in fiscal 2009 compared with
net income of $6.0 million on net sales of $238.6 million in fiscal
2008.
|
|
| • |
Our gross
margin decreased to 42.5% of net sales, down from 49.2% in fiscal
2008.
|
|
| • |
Cash and cash
equivalents, including restricted cash, were $44.6 million at September
30, 2009, an increase of $31.8 million from $12.8 million at September 30,
2008.
|
Results
of Operations
The following table
sets forth our consolidated results of operations for the periods indicated as a
percentage of net sales:
|
Year
Ended September 30,
|
|||||||||
|
2009
|
2008
|
2007
|
|||||||
|
Net
sales
|
100.0
|
%
|
100.0
|
%
|
100.0
|
%
|
|||
|
Cost of
sales
|
57.5
|
%
|
50.8
|
%
|
52.8
|
%
|
|||
|
Gross
profit
|
42.5
|
%
|
49.2
|
%
|
47.2
|
%
|
|||
|
Operating
expenses:
|
|||||||||
|
Selling,
general and administrative
|
36.1
|
%
|
32.2
|
%
|
33.3
|
%
|
|||
|
Research
and development
|
18.4
|
%
|
12.8
|
%
|
12.6
|
%
|
|||
|
Downsizing
costs
|
1.8
|
%
|
--
|
%
|
0.3
|
%
|
|||
|
Gain
on sale of assets
|
(0.3
|
)%
|
--
|
%
|
(0.3
|
)%
|
|||
|
Total
operating expenses
|
56.0
|
%
|
45.0
|
%
|
45.9
|
%
|
|||
|
Income (loss)
from operations
|
(13.5
|
)%
|
4.2
|
%
|
1.2
|
%
|
|||
|
Other income
(expense)
|
(0.8
|
)%
|
(0.5
|
)%
|
0.3
|
%
|
|||
|
Income (loss)
before income taxes
|
(14.3
|
)%
|
3.7
|
%
|
1.5
|
%
|
|||
|
Income tax
provision (benefit)
|
(6.1
|
)%
|
1.2
|
%
|
(0.9
|
)%
|
|||
|
Net income
(loss)
|
(8.2
|
)%
|
2.5
|
%
|
2.4
|
%
|
|||
Fiscal
2009 Compared with Fiscal 2008 and Fiscal 2007
Net
Sales
|
Year
Ended September 30,
|
||||||||||||
|
2009
|
2008
|
2007
|
||||||||||
|
(Dollars
in millions)
|
||||||||||||
|
Net
Sales
|
$ | 139.0 | $ | 238.6 | $ | 215.2 | ||||||
|
By
Product Line:
|
||||||||||||
|
Semiconductor
equipment
|
$ | 138.4 | $ | 237.4 | $ | 214.0 | ||||||
|
License
fees
|
$ | 0.6 | $ | 1.2 | $ | 1.2 | ||||||
|
By
Geographical Distribution, percentage of net tool
sales:
|
||||||||||||
|
North
America
|
18.4 | % | 22.6 | % | 30.4 | % | ||||||
|
Europe
|
31.0 | % | 22.9 | % | 43.5 | % | ||||||
|
Asia,
including Japan
|
50.6 | % | 54.5 | % | 26.1 | % | ||||||
Net sales consist of revenues from
sales of semiconductor equipment, spare parts and service and royalties. Our
revenue recognition policy provides that a portion of revenue from sales of
semiconductor equipment may be recognizable upon shipment if the tool
incorporates proven technology (“existing tool”) and is shipped to a customer
environment in which we have already successfully installed and gained
acceptance of our products and other revenue recognition criteria in
authoritative accounting guidance have been met. Alternatively, revenue will be
100% deferred and only recognized upon final customer acceptance for tools that
are new technology products (“new tools”) or where an existing tool is sold into
a new customer environment. Revenue for elements other than equipment, such as
installation revenue, is included in tool acceptance
revenue. License fee revenue represents
royalties generated from our anode technology.
Our products are
highly customized. Each customer has specific technical requirements
for the performance of the equipment in the fabrication of semiconductor
devices. Consequently, the specific terms of the acceptance
provisions are negotiated with each customer on a tool-specific basis in order
to reflect the technical specifications that will be used to determine whether
the tool passes the applicable acceptance tests. These acceptance
specifications are lengthy, technically complex and vary greatly from customer
to customer and product to product.
We have a proven track record of
obtaining customer acceptances within a reasonable timeframe. In the
rare event when acceptance does not occur because the customer does not believe
that the tool has met the applicable technical specifications, the parties treat
the matter as a contractual issue that needs to be resolved before the customer
accepts the equipment. That resolution can take many different forms,
including re-testing the equipment, making technical modifications to resolve
the disagreement or extending the warranty to accommodate a delayed
acceptance. Whether or not a customer may have any further remedy
where a resolution cannot be agreed between the parties, including any right of
return of the equipment, would be a question of contract interpretation that
ultimately would have to be adjudicated in accordance with applicable
law.
Net sales decreased
$99.6 million or approximately 42%, in fiscal 2009 as compared with fiscal
2008. Fiscal 2009 revenues were significantly impacted by the
current worldwide economic crisis, which resulted in customer delays in placing
orders and customers pushing out delivery dates for tools already ordered and
scheduled for delivery. Raiders contributed almost 60% to net sales
in fiscal 2009. Wafer level packaging, BEOL and FEOL Raider revenues
declined from fiscal 2008 levels while revenues from copper damascene Raiders
improved slightly in the year-over-year comparison. Approximately 60%
of Raider revenues in fiscal 2009 were related to wafer level packaging
applications while copper damascene Raiders accounted for almost 20% of Raider
revenues. Spare parts, service and revenue from our Rhetech
subsidiary contributed approximately 25% to net sales.
Net sales increased
$23.4 million, or approximately 11% in fiscal 2008 as compared with fiscal 2007
levels. Despite the downturn in the semiconductor industry, our
business activity levels increased in the second quarter of fiscal 2008 and
those higher levels continued through the duration of the fiscal year with
average quarterly revenues of approximately $63 million per quarter in the last
three quarters of the fiscal year. Revenues from Raiders for wafer
level packaging applications improved more than 90% from fiscal 2007 levels as
customers made capacity purchases and we penetrated key customers in Asia and
North America. Spending for ECD Raiders for copper interconnect
declined 64% in fiscal 2008 from fiscal 2007 levels and revenue from our BEOL
surface preparation Raiders declined 38% as customers for those applications cut
back their capital spending. Sales of our single-wafer surface
preparation Raiders for FEOL applications more than doubled as the industry
continued to benefit from the move away from batch processing to single-wafer
processing to enable cleaning applications for sub-nanometer
structures. The revenue contribution from spare parts, service and
from our Rhetech subsidiary was approximately 20% of our net sales.
Geographically, our
sales mix was weighted toward Asia in both fiscal 2009 and fiscal
2008. In late fiscal 2009, buying activities increased as the Asian
market began making capacity purchases in the wafer level packaging
market. European tool sales increased 8.1 percentage points,
contributing 31.0% to total tool sales as one of our key customers in Europe
resumed limited capital spending after a significant cutback in fiscal
2008. North American tool sales declined 4.2 percentage points in
fiscal 2009 as compared with fiscal 2008 and contributed 18.4% to total tool
sales.
Gross
Profit
|
Year
Ended September 30,
|
||||||||||||
|
2009
|
2008
|
2007
|
||||||||||
|
(Dollars
in thousands)
|
||||||||||||
|
Gross
profit
|
$ | 59,088 | $ | 117,395 | $ | 101,491 | ||||||
|
Percentage of
net sales
|
42.5 | % | 49.2 | % | 47.2 | % | ||||||
Gross profit
decreased $58.3 million in absolute dollars or 49.7% in fiscal 2009 as compared
to fiscal 2008. Gross profit increased $15.9 million or 15.7% in fiscal 2008
compared to fiscal 2007 gross profit.
Gross profit
decreased in absolute dollars in fiscal 2009 because of lower sales volumes
brought on by the worldwide economic downturn. On a percentage basis,
gross margin declined 6.7 percentage points. Higher than normal
levels of under-absorbed overhead costs because of under-utilized plant capacity
and increased inventory reserves taken in response to the current economic
slowdown were the primary drivers of the decrease in gross margin
percentage. Installation revenue which typically carries high margins
decreased in fiscal 2009 and the contribution to the gross margin from lower
margin tools increased. Partially offsetting these decreases, spare
parts and services margins, which historically carry higher gross margins than
tools, contributed more to the overall gross margin than in fiscal 2008. Gross
margin also benefited from reduced warranty costs as warranty expirations
exceeded warranty additions.
Gross profit
increased in absolute dollars in fiscal 2008 because of higher sales
volumes. On a percentage basis, gross margin improved two percentage
points. Tool margins declined slightly year-over-year but contributed
approximately one percentage point to the margin increase because of higher
sales volumes. Warranty and installation expense decreased in fiscal
2008, contributing approximately one percentage point to the margin
increase. Margins improved on wafer level packaging tools primarily
due to a higher percentage of installation revenue than in fiscal 2007 but
declined on BEOL Raiders due to product mix and on copper interconnect
tools. Geographically, margins improved in North America but declined
slightly in Asia, primarily due to product mix.
Selling,
General and Administrative
|
Year
Ended September 30,
|
||||||||||||
|
2009
|
2008
|
2007
|
||||||||||
|
(Dollars
in thousands)
|
||||||||||||
|
Selling,
general and administrative
|
$ | 50,271 | $ | 76,929 | $ | 71,749 | ||||||
|
Percentage of
net sales
|
36.2 | % | 32.2 | % | 33.3 | % | ||||||
Selling, general
and administrative (SG&A) expenses include employment costs for sales,
marketing, customer support and administrative personnel as well as travel,
communications, professional fees and expenses related to sales and service
offices at our global locations. SG&A expenses decreased $26.7 million in
fiscal 2009 as compared with fiscal 2008 and increased $5.2 million in fiscal
2008 as compared to fiscal 2007.
Throughout fiscal
2009, we took measures to realign our cost structure to expected business levels
by reducing our staffing worldwide and implementing management pay cuts and
mandatory leave. In the first quarter of fiscal 2009, we also shut down our
facilities for three weeks. Because of these cost management measures, net
employment costs decreased approximately $16.5 million in fiscal 2009 as
compared with fiscal 2008 and travel expenses declined $5.4 million in fiscal
2009 from fiscal 2008 levels. Primarily as a result of decreased sales volume,
commission expense decreased $3.4 million in the annual comparison. All other
major expense categories have also declined year-over-year as a result of our
cost saving measures. These savings were somewhat offset by the write-off of two
customer accounts receivable, totaling approximately $3.5 million and which
included the write-off of a major tool sale to a customer that filed for
insolvency protection in a German court.
Employment costs
and travel expense increased approximately $4.4 million in fiscal 2008 as
compared with fiscal 2007. In fiscal 2008, we increased our service support
staff in Asia to better support our increasing Asian customer base. Employment
costs in certain of these regions are typically higher than in the United
States. Travel expense related to supporting our Asian customers also increased
year-over-year. Commission expense increased approximately $1.5 million in the
annual comparison related to increased revenues in fiscal 2008.
Research
and Development
|
Year
Ended September 30,
|
||||||||||||
|
2009
|
2008
|
2007
|
||||||||||
|
(Dollars
in thousands)
|
||||||||||||
|
Research and
development
|
$ | 25,563 | $ | 30,440 | $ | 27,080 | ||||||
|
Percentage of
net sales
|
18.4 | % | 12.8 | % | 12.6 | % | ||||||
Research and
Development (R&D) expense consists of salaries, project materials,
laboratory costs, consulting fees and other costs associated with our product
development efforts. R&D expense decreased $4.9 million in fiscal 2009 as
compared with fiscal 2008 and increased $3.4 million in fiscal 2008 as compared
with fiscal 2007.
Employment costs
decreased approximately $4.3 million in fiscal 2009 as compared with fiscal 2008
as we implemented cost savings measures in response to the worldwide economic
crisis and our corresponding declines in production and
sales. Depreciation expense increased by approximately $1.3 million
in the year-over-year comparison as we replaced older technology tools in our
demonstration laboratories with new technology tools in order to support our
customers’ development efforts. Prototype expense increased by
approximately $369,000 in fiscal 2009 as we wrote-down two experimental tools
from our work-in-process inventory. We continue to work on a number
of leading edge projects including on-going development of porous silicon for
the solar industry, flow batteries, FEOL cleaning applications, wafer edge
cleaning processes, deep via and Through Silicon Via applications, high
volume Through Silicon Via and wafer level packaging production and
others.
Employment costs
increased approximately 16% in fiscal 2008 as compared with fiscal 2007 as we
increased our staff to improve our wafer process engineering capabilities for
our customers and due to merit increases, stock-based compensation and
recruiting costs. Depreciation expense increased by approximately $700,000 as we
updated our demonstration laboratories with new technology tools to support our
customers’ development efforts. Other expenses increased because of
developmental work being completed at our Austrian facility to develop
Cintillio, a batch tool designed for electroless plating applications. We
continued to work on a number of leading edge projects including on-going
development of porous silicon for the solar industry, FEOL cleaning
applications, wafer edge cleaning processes, deep via and Through Silicon Via
applications and others.
Our research and
development expense has fluctuated from period to period in the
past. We expect such fluctuations to continue in the future, both in
absolute dollars and as a percentage of net sales, primarily due to the timing
of expenditures and fluctuations in the level of net sales in a given
period. We expect to continue to fund R&D expenditures with a
multi-year perspective and are committed to technology leadership in our sector
of the semiconductor equipment industry.
Downsizing
Costs
|
Year
Ended September 30,
|
||||||||||||
|
2009
|
2008
|
2007
|
||||||||||
|
(Dollars
in thousands)
|
||||||||||||
|
Downsizing
costs
|
$ | 2,566 | $ | -- | $ | 677 | ||||||
|
Percentage of
net sales
|
1.8 | % | -- | % | 0.3 | % | ||||||
In
November 2008 and January 2009, we announced and implemented plans to align our
cost structure closer to then-current business activity levels. On a combined
basis, the cost reduction plans consisted primarily of a 35% reduction in our
worldwide work force, salaried staff pay cuts, reduced working hours and
overtime, mandatory leave, temporary suspension of company-paid 401(k) plan
matching and a three-week facilities shutdown in December 2008. One-time
involuntary termination costs of $2.6 million were reported as a separate
component of operating expenses in our fiscal 2009 operating
results. All costs related to the downsizing plan have been incurred
and paid.
Compared to the
fourth quarter of fiscal 2008, we are saving approximately $13 million to $14
million per quarter. Net of downsizing costs, we have realized savings of
approximately $44 million in fiscal 2009. These cost savings are reported in
gross margin and operating expenses in the Condensed Consolidated Statements of
Operations. We will continue to monitor the need for additional cost savings and
implement cost reduction measures as needed.
In
April 2007, we announced and implemented a plan to align our cost structure with
then-current business activity levels. The cost reduction plan
consisted primarily of a seven percent reduction in our worldwide work force,
management pay cuts, mandatory leave and reduced overtime. Severance
costs of $677,000 were reported as a separate component of operating expenses in
our fiscal third quarter. All costs related to the downsizing plan
were fully incurred in the third quarter. Net of the downsizing
costs, we saved approximately $5 million in employment, travel and general
business expenses in the second half of fiscal 2007 as compared with spending in
the first half of fiscal 2007.
Gain
on Sale of Assets
|
Year
Ended September 30,
|
||||||||||||
|
2009
|
2008
|
2007
|
||||||||||
|
(Dollars
in thousands)
|
||||||||||||
|
Gain on sale
of assets
|
$ | (405 | ) | $ | -- | $ | (648 | ) | ||||
|
Percentage of
net sales
|
(0.3 | )% | -- | % | (0.3 | )% | ||||||
We
sold an aircraft during the third quarter of fiscal 2009 for approximately $1.5
million and recognized a gain on the sale of approximately
$253,000. We also sold a storage facility located near Kalispell,
Montana during the third quarter of fiscal 2009 for approximately $200,000 and
recognized a gain on the sale of approximately $152,000.
We
sold a manufacturing facility located near Kalispell, Montana during the first
quarter of fiscal 2007 for approximately $1.9 million and recognized a gain on
the sale of approximately $648,000.
Other
Income (Expense)
|
Year
Ended September 30,
|
||||||||||||
|
2009
|
2008
|
2007
|
||||||||||
|
(In
thousands)
|
||||||||||||
|
Interest
income
|
$ | 101 | $ | 240 | $ | 352 | ||||||
|
Interest
expense
|
(790 | ) | (488 | ) | (649 | ) | ||||||
|
Foreign
exchange gain (loss)
|
(347 | ) | (414 | ) | 233 | |||||||
|
Other
|
(46 | ) | (381 | ) | 770 | |||||||
|
Total other
income (expense)
|
$ | (1,082 | ) | $ | (1,043 | ) | $ | 706 | ||||
In
the fourth quarter of fiscal 2008, based on an analysis that considered general
economic conditions and company-specific conditions, we determined that the one
million shares acquired as an investment security in exchange for certain
thermal assets in the first quarter of fiscal 2008, had experienced an
other-than-temporary impairment under authoritative accounting guidance and
accordingly, we revised our cost basis in the investment by writing off $900,000
to Other expense. In fiscal 2009, based on similar analyses, we wrote
off the remaining $380,000 related to the investment. In both years,
these losses were partially offset by recycling income from our Kalispell
facilities and rental income from a portion of our Cambridge
facility.
Interest income
declined to $101,000 from $240,000 in fiscal 2008 and $352,000 in fiscal 2007
because of lower investment levels. Interest expense increased to $790,000 in
fiscal 2009 because of increased use of our line of credit. Interest
expense had declined in fiscal 2008 because of lower bank interest rates and
decreased use of our line of credit.
We
reported a foreign exchange loss of $347,000 in fiscal 2009 as compared with a
foreign exchange loss of $414,000 in fiscal 2008 and an exchange gain of
$233,000 in fiscal 2007 related to foreign exchange gains and losses on unhedged
intercompany sales with our Japanese, Korean, Austrian and other
subsidiaries.
Beginning in April
2007, due to a change in how we conduct business and following an evaluation of
the scope of our operations and business practices, we concluded that the Euro
is the currency of the primary economic environment in which Semitool Austria
operates and, consequently, changed the functional currency for Semitool Austria
to the Euro. Semitool Austria invoices its customers in Euros and its
financing and operating activities are denominated in the
Euro. Accordingly, from April 1, 2007, all assets and liabilities of
Semitool Austria are translated at period-end exchange rates and all revenues
and expenses are re-measured at average rates prevailing during the
period. Translation adjustments are reported as a separate component
of accumulated other comprehensive income (loss).
Income
Taxes
|
Year
Ended September 30,
|
||||||||||||
|
2009
|
2008
|
2007
|
||||||||||
|
(Dollars
in thousands)
|
||||||||||||
|
Income tax
provision (benefit)
|
$ | (8,561 | ) | $ | 2,946 | $ | (1,892 | ) | ||||
|
Effective tax
rate
|
(43 | )% | 33 | % | (57 | )% | ||||||
Our estimated
effective tax rate for fiscal 2009 is a benefit of 43% as compared to a
provision of 33% for fiscal 2008. The fiscal year 2009 tax rate is
lower than in fiscal 2008 based on a combination of the extension of the Federal
Research and Experimentation Credit (R&E Credit) in fiscal 2009 for fiscal
2008 and the decline in our net income before taxes from a net income of
approximately $9 million in fiscal 2008 to a net loss before taxes of
approximately $20 million in fiscal 2009. The R&E Credit (which had
previously expired) was extended on October 3, 2008 and accordingly no benefit
was realized in fiscal year 2008 for the portion attributable to expenses
incurred after December 31, 2007. This portion of the R&E Credit was
realized in the first quarter of fiscal 2009 and resulted in a discrete benefit
of approximately $1 million that quarter.
Our estimated
effective tax rate for fiscal 2008 was 33% as compared to a benefit of 57% as of
September 30, 2007. Our fiscal year 2008 tax rate was higher than in
fiscal 2007 due to the expiration of the R&E Credit on December 31, 2007
which reduced the R&E Credit realized in fiscal year 2008.
Our future
effective tax rate is based on our continued investments in research and
development programs qualifying for the R&E Credit and our expectation of
earnings from operations in jurisdictions with lower tax rates throughout the
world.
Effective October
1, 2007, we recognize and measure our uncertain income tax positions following
the two-step approach defined in authoritative accounting
literature. The first step is to evaluate the tax position for
recognition by determining if the weight of available evidence indicates that it
is more likely than not that the position will be sustained on audit, including
resolution of related appeals or litigation processes, if any. The
second step is to measure the tax benefit as the largest amount that is more
than 50% likely of being realized upon ultimate settlement.
As
a result of the implementation of its accounting for uncertain income tax
positions, we increased our estimate of net unrecognized tax benefits and
accounted for the increase as a cumulative effect of a change in accounting
principle that resulted in a $671,000 decrease to beginning retained
earnings. Total unrecognized tax benefits at October 1, 2007, if
recognized, would impact our tax rate. We anticipate that the amount
of unrecognized tax benefits could change in the next twelve months but do not
expect those changes to have a significant impact on our results of operations
or financial position.
During fiscal 2009
and fiscal 2008 the total amount of unrecognized tax benefits was as
follows:
|
Year
Ended September 30,
|
||||||||
|
2009
|
2008
|
|||||||
|
(In
thousands)
|
||||||||
|
Unrecognized
tax benefits and interest, beginning of year
|
$ | 2,223 | $ | 2,421 | ||||
|
Year-to-date
net changes for unrecognized benefits and interest
|
(161 | ) | (198 | ) | ||||
|
Unrecognized
tax benefits and interest, end of year
|
$ | 2,062 | $ | 2,223 | ||||
As
of September 30, 2009, we are potentially subject to U.S. federal income tax
examinations for the fiscal tax years 2005 through 2008 and to non-U.S. income
tax examinations for fiscal tax years 2003 through 2008. In addition,
we are potentially subject to state income tax examinations for fiscal tax years
2005 through 2008. Although they have not been assessed, we
included potential interest and penalties related to unrecognized tax benefits
within our provision for taxes. The accrued potential interest and penalties
related to unrecognized tax benefits were approximately $24,000 as of September
30, 2009.
As
of September 30, 2008, we were potentially subject to U.S. federal income tax
examinations for the fiscal tax years 2005 through 2007 and to non-U.S. income
tax examinations for fiscal tax years 2002 through 2007. In addition,
we were potentially subject to state income tax examinations for fiscal tax
years 2004 through 2007. We included potential interest and penalties
related to unrecognized tax benefits within our provision for taxes, although
they have not been assessed. As of the date of implementation, we had
$283,000 of accrued potential interest and penalties related to unrecognized tax
benefits. The accrued potential interest and penalties related to
unrecognized tax benefits decreased approximately $170,000 in the year ended
September 30, 2008
Backlog
and Deferred Revenue
|
Year
Ended September 30,
|
||||||||||||
|
2009
|
2008
|
2007
|
||||||||||
|
(Dollars
in millions)
|
||||||||||||
|
Backlog
|
$ | 69.8 | $ | 54.5 | $ | 58.9 | ||||||
|
Percentage
change in backlog
|
||||||||||||
|
year over
year
|
28.1 | % | (7.5 | )% | (30.9 | )% | ||||||
|
Deferred
revenue
|
$ | 4.8 | $ | 13.6 | $ | 15.4 | ||||||
|
Percentage
change in deferred revenue
|
||||||||||||
|
year over
year
|
(64.7 | )% | (11.7 | )% | 6.9 | % | ||||||
Approximately 87%
of our backlog at September 30, 2009 was for Raider tools. Deferred revenue
decreased $8.8 million at September 30, 2009 as compared with September 30, 2008
primarily due to lower business volumes and because there were no deferrals of
Raider shipments into new customer environments as of September 30,
2009. Shipments into new customer environments require full deferral
of tool revenue until final customer acceptance in accordance with our revenue
recognition policy. One SAT tool was fully deferred at the end of
fiscal 2009 due to extended payment terms. Current deferrals include
all or a part of 28 Raiders as compared with 30 Raiders at September 30, 2008
and 17 Raiders at September 30, 2007.
We
include in backlog those customer orders for which we have written customer
authorization and for which shipment is scheduled within the next 12
months. Orders are subject to cancellation or rescheduling by
customers with limited or no cancellation fees. As the result of
systems ordered and shipped in the same quarter, possible changes in customer
delivery dates, cancellations and shipment delays and acceptances of shipped
equipment carried in deferred revenue, the backlog at any particular date and
the bookings for any particular period are not necessarily indicative of actual
revenue for any succeeding period. In particular, during periods of downturns in
the semiconductor industry we have experienced customer cancellations and
requested delays in delivery.
Deferred profit
included in current liabilities is derived from deferred revenue, which
primarily relates to equipment shipped to customers that has not been accepted
by the customer, less the deferred cost of sales, including warranty and
installation, and commission expenses. Deferred revenue is not
included in orders backlog. The components of deferred profit are as
follows:
|
Year
Ended September 30,
|
||||||||
|
2009
|
2008
|
|||||||
|
(Dollars
in thousands)
|
||||||||
|
Deferred
revenue
|
$ | 4,833 | $ | 13,570 | ||||
|
Deferred cost
of sales – manufacturing costs
|
(379 | ) | (4,605 | ) | ||||
|
Deferred cost
of sales – warranty and installation costs
|
(905 | ) | (1,125 | ) | ||||
|
Deferred
SG&A expense – commissions
|
-- | (114 | ) | |||||
|
Deferred
profit
|
$ | 3,549 | $ | 7,726 | ||||
Stock-Based
Compensation
Stock-based
compensation cost is measured at the grant date, based on the fair value of the
award and is recognized as expense over the employees’ requisite service
period. The fair value of each stock option grant is estimated using
the Black-Scholes option pricing model. This model was developed for
use in estimating the value of publicly traded options that have no vesting
restrictions and are fully transferable. Our employee stock options
have characteristics that differ from those of publicly traded
options.
Total compensation
cost recorded in fiscal 2009, 2008 and 2007 was $1.1 million, $1.8 million and
$1.1 million pre-tax, respectively, or $678,000, $1.2 million and $1.1 million
after tax, respectively, in each period, an impact of approximately $0.02, $0.04
and $0.03 per basic and diluted share.
Liquidity
and Capital Resources
As
of September 30, 2009, our principal sources of liquidity consisted of
approximately $44.6 million of cash and cash equivalents, including $15.0
million drawn on our $30.0 million revolving line of credit. The credit facility
is with Wells Fargo Trade Bank (Trade Bank) and bears interest at the bank’s
prime lending rate, 3.25% as of September 30, 2009, or at our option, LIBOR plus
2.25%, or 2.54% as of that date. The credit agreement has various
restrictive covenants including a prohibition against pledging real, fixed or
intangible assets during the term of the agreement and the maintenance of
various financial covenants. If we were to default on the credit agreement, the
bank could accelerate payment of any advances outstanding under the credit
agreement. In addition, the availability of funds requires compliance with
certain financial covenants, including a maximum borrowing limit based on a
Funded Debt to Earnings before Interest, Taxes, Depreciation and Amortization
(EBITDA) ratio, and a maximum borrowing limit based on trade
receivables.
However, although
we have received no notice of default, an ambiguity in the credit agreement may
be construed to suggest that we are in compliance with the loan’s
funded-debt-to-EBITDA covenant, and until this ambiguity is resolved, we do not
anticipate being able to make additional draws on the Trade Bank loan. We have
been in discussions with the Trade Bank regarding our compliance with this
covenant. If interpreted as noncompliance with the covenant, Trade Bank may
notify us that the non-compliance constitutes an event of default under the
facility that (i) prevents further borrowings and (ii) gives them the right to
accelerate the payment of all amounts outstanding under the loan. If interpreted
in favor of the Trade Bank, there would be a Funded Debt to EBIDTA ratio
requirement of not more than 2:1 as of September 30, 2009 (EBITDA for the
trailing twelve-month period ending September 30, 2009 was a negative number).
We continue to discuss credit facility requirements with the Trade Bank with a
view toward arranging a facility that resolves any issues regarding borrowing
limits and outstanding advances. Were the Trade Bank to assert that we were in
violation of the covenant and begin to exercise its remedies, we could be
required to retire the entire balance of the loan, and while our working capital
is more than adequate to repay the entire debt, repayment would limit our
ability to deploy our resources as we might otherwise consider desirable or
appropriate. Further, the revolving credit line now expires on March
1, 2010, and we do not anticipate that the loan will be extended or
renewed.
We
believe that we have sufficient cash and cash equivalents, along with funds
expected to be generated from operations with or without amounts drawn on the
line of credit to meet operating expenses and planned capital expenditures
through the next twelve months. Historically we have generated sufficient funds
from operations during industry downturns to meet our liquidity
needs. If the bank could accelerate the current balance due on the
loan, our liquidity could be adversely impacted. To the extent that timing of
the collection of trade receivables does not meet our cash outflow requirements,
we could require access to credit arrangements, which may or may not be
available at the desired times or on terms that management would deem
appropriate or acceptable. In the past, we have typically required access to a
credit facility when our business is growing. As discussed above, we are working
with the Trade Bank to resolve any issues regarding our borrowing limits and
outstanding advances prior to the time we have a need to access the credit
facility. We estimate capital expenditures will be between $6.0 million and $8.0
million during the next twelve months. If additional financial resources are
required in the future, we may need to issue additional common stock or other
financial instruments whichever management deems advisable. There can be no
assurance that in the future we will be able to issue additional common stock or
other financial instruments on acceptable terms or that, if so issued, the sale
of our common stock would not be dilutive to existing shareholders.
Fiscal
2009
Cash provided by
operating activities was $22.0 million in fiscal 2009. The key
components of the change in cash provided by operating activities were as
follows:
Sources
of Cash:
|
|
•••
|
Trade
receivables provided $31.7 million in cash as collections outpaced
shipments; and
|
|
|
•••
|
Inventories
declined $19.4 million as we focused our efforts on using on-hand
inventory and slowed down spending for raw materials in response to
current business volumes.
|
Uses
of Cash:
|
|
•••
|
Accounts
payable decreased $9.3 million as we continued our regular pay down of
payables while also slowing down our inventory
purchases. Inventory purchases increased in the fourth quarter
as result of increased business
activity;
|
|
|
•••
|
Net loss and
non-cash operating activities, including depreciation and deferred income
taxes totaled $7.5 million;
|
|
|
•••
|
Deferred
profit decreased $4.2 million as a result of lower business volumes and
because there were no deferrals of Raider shipments into new customer
environments at September 30, 2009;
|
|
|
•••
|
Accrued
payroll and related benefits decreased $3.3 million as a result of our
cost reduction measures; and
|
|
|
•••
|
Accrued
warranty decreased $2.9 million as a result of lower business
volumes.
|
Investing
activities in fiscal 2009 included $735,000 in purchases of factory equipment
and other property. We also invested an additional $4.0 million in
our development and demonstration laboratories by transferring finished goods
inventory to property, plant and equipment. We sold an aircraft for
approximately $1.5 million and a building for approximately $200,000 in fiscal
2009. We also invested a net amount of $425,000 in our patent
portfolio, primarily related to pending patent applications.
Financing
activities provided $10.4 million in fiscal 2009 and included a net $11.8
million draw on our revolving line of credit which was partially offset by
repayments on long-term debt of $1.4 million.
Fiscal
2008
Cash used by
operating activities was $4.8 million in fiscal 2008. The key
components of the change in cash used by operating activities were as
follows:
Sources
of Cash:
|
|
•••
|
Net income
and non-cash operating activities, including depreciation and stock-based
compensation expenses were $6.0 million and $11.2 million, respectively;
and
|
|
|
•••
|
Accounts
payable increased $5.4 million although our inventory spending levels
decreased in response to lower fourth quarter
bookings.
|
Uses
of Cash:
|
|
•••
|
Inventory
grew $16.2 million primarily related to an increase in the number of tools
placed with customers for evaluation and with technology
partners. Work-in-process grew to support higher order volumes;
and
|
|
|
•••
|
Trade
receivables increased $15.3 million primarily related to a $17.1 million
increase in shipments, the timing of those shipments and the timing of
customer payments in fiscal 2008. In October and early November
2008, we collected approximately $36 million in trade
receivables.
|
Investing
activities included $5.1 million in purchases of factory and laboratory
equipment and the acquisition of land adjacent to our Salzburg, Austria
facility. Additionally, we invested $6.2 million in our development
and demonstration laboratories by transferring finished goods inventory to
property, plant and equipment. We also invested approximately
$790,000 in our patent portfolio, primarily related to pending patent
applications.
Financing
activities provided $6.0 million in cash in fiscal 2008 and consisted primarily
of $1.6 million in borrowings under long-term debt to purchase land adjacent to
our Salzburg, Austria facility and a net $3.2 million draw on our revolving line
of credit. Stock option exercises provided $2.1 million in fiscal
2008. Offsetting these sources of cash, we repaid $1.2 million on our
long-term debt.
Off-Balance Sheet Arrangements.
We do not have any relationships with unconsolidated entities or
financial partnerships, such as entities often referred to as structured finance
or special purpose entities, which would have been established for the purpose
of facilitating off-balance sheet arrangements or other contractually narrow or
limited purposes. As such, we are not exposed to the types of
financing, liquidity, market or credit risks that could arise if we had engaged
in such relationships.
The following
commitments as of September 30, 2009, incurred in the normal course of business,
have been included in the consolidated financial statements with the exception
of purchase order commitments and operating lease obligations, which are
properly excluded under accounting principles generally accepted in the United
States of America.
|
Payments
Due by Period
|
||||||||||||||||||||
|
Less
Than
|
1 – 3 | 4 – 5 |
After
|
|||||||||||||||||
|
Total
|
1
Year
|
Years
|
Years
|
5
Years
|
||||||||||||||||
|
(In
thousands)
|
||||||||||||||||||||
|
Long-term
debt
|
$ | 10,474 | $ | 1,215 | $ | 2,550 | $ | 2,648 | $ | 4,061 | ||||||||||
|
Operating
leases
|
1,854 | 1,150 | 639 | 65 | -- | |||||||||||||||
|
Purchase
order commitments
|
8,988 | 8,988 | -- | -- | -- | |||||||||||||||
|
Total
commitments
|
$ | 21,316 | $ | 11,353 | $ | 3,189 | $ | 2,713 | $ | 4,061 | ||||||||||
Semitool has
agreements with limited liability companies wholly-owned by Mr. Raymon F.
Thompson, the Company’s chairman and chief executive officer, to lease aircraft
and an aircraft hangar. Under these agreements, rent expense was
approximately $1.9 million for the year ended September 30, 2009, $2.4 million
for the year ended September 30, 2008 and $2.8 million for the year ended
September 30, 2007. The rental rate for fiscal 2010 is currently
$34,100 per month for both the aircraft and the hangar; the lease terms are
month-to-month. The lease amounts
were reduced in response to market conditions affecting our need for the
aircraft. The amended rates are below-market for the aircraft leased and,
consequently, are on terms more favorable to us than could have been obtained
from an unaffiliated party. Because the term of the leases are
month-to-month, it is not expected that we will be able to continue leasing
the aircraft at those below-market rates as economic conditions
improve.
Critical
Accounting Policies and Estimates
The preparation of
consolidated financial statements in conformity with accounting principles
generally accepted in the United States of America requires us to make estimates
and judgments that affect the reported amounts of assets, liabilities, revenues
and expenses, and related disclosure of contingent liabilities. On an
on-going basis, we evaluate our estimates, including those related to revenue
recognition, inventories, warranty obligations, bad debts, investments,
intangible assets, income taxes, financing operations, employee benefits,
contingencies and litigation. We base our estimates on historical
experience and on various other assumptions that are believed to be reasonable
under the circumstances, the results of which form the basis for making
judgments about the carrying values of assets and liabilities that are not
readily apparent from other sources. Actual results may differ from
these estimates under different assumptions or conditions.
We
believe the following critical accounting policies and estimates affect our more
significant judgments and estimates used in the preparation of our consolidated
financial statements.
Revenue Recognition. Revenue
recognition is significant because revenue is a key component of our results of
operations. Revenue is recognized only when persuasive evidence of an
arrangement exists, delivery has occurred or services have been rendered, the
seller’s price is fixed or determinable and collectability is reasonably
assured. Our product sales generally contain substantive customer
acceptance provisions. Sales of new products to new or existing
customers are not recognized until customer acceptance. Likewise,
sales of existing products to new customer environments are not recognized until
customer acceptance. For sales of existing products into existing
customer environments, if multiple elements exist, the amount of revenue
recognized is the lesser of the fair value of the equipment or the contracted
amount that was due or payable upon title transfer. The revenue for
elements other than equipment is recorded in deferred profit and is recognized
when the remaining goods and/or services are delivered or
performed. Revenue related to service is recognized upon completion
of performance of the service or ratably over the life of the related service
contract. Spare parts sales are recognized upon shipment when title and risk of
loss pass to the customer. Unearned revenue from service contract
agreements is included in Customer Advances in the current liabilities section
of the Consolidated Balance Sheets.
In
addition, the timing of certain expenses, such as cost of sales, including
installation and warranty, and commission expenses coincides with the
recognition of the related revenues. We follow specific guidelines in
measuring revenue; however, certain judgments such as the definition of a new
customer environment and new acceptance criteria or if installation is
perfunctory may be required in the application of our revenue recognition
policy.
Inventories. Inventories are
valued at the lower of cost or market on a first-in, first-out
basis. Accordingly, we write down the carrying value of inventories
for estimated obsolescence and future marketability. On a quarterly
basis, we compare historical and projected sales and usage of raw materials and
parts and our assumptions about future use of raw materials, parts and finished
goods with our forecast, market demand and industry conditions to determine
potential obsolescence or whether the inventory on hand represents excess
quantities. As a result of our analysis, we record reserves impacting
Cost of Sales, if appropriate. These reserves are subject to
management judgment and if actual future use, demand or market conditions are
less favorable than those projected by us, additional inventory valuation
write-downs may be required.
Warranty Obligations. We
provide for the estimated cost of equipment warranties when the related revenue
is recognized. We track individual warranties on a tool-by-tool basis and
develop estimated rates by equipment class based on this history. The rates are
used to estimate the warranty accrual for a given specific piece of
equipment. These rates are revised periodically to reflect current
cost trends due to the current life cycle of that product class. The
warranty accrual is reduced by actual costs of providing the warranty or if a
balance is remaining at the end of the warranty period, then that amount is also
written off. Warranty accrual expense impacts primarily Cost of
Sales. While we engage in extensive product quality programs and
processes, including actively monitoring and evaluating the quality of our
component suppliers, our warranty obligation is affected by product failure
rates, material usage and service delivery costs incurred in correcting a
product failure. Should actual product failure rates, material usage
or service delivery costs differ from our estimates, revisions to the estimated
warranty liability would be required and would be recorded as an increase in
cost of sales and operating expenses in the period in which the revision is
deemed necessary.
Allowance for Doubtful Accounts.
We maintain allowances for doubtful accounts for estimated losses
resulting from the inability of our customers to make required
payments. We record expense as a component of Selling, General and
Administrative within the Consolidated Statements of Operations. If
the financial condition of our customers were to deteriorate, due to the
cyclicality of the industries we serve or for other reasons, resulting in an
impairment of their ability to make payments, additional allowances and expense
may be required as occurred in fiscal 2009 when we wrote off approximately $3.5
million to Selling, General and Administrative expense for two customer accounts
receivable, including a write off of a major tool sale to a customer who filed
for insolvency protection in a German court. Likewise, if we are
successfully able to collect on an amount presumed to be uncollectible, the
allowance for doubtful accounts and the related expense may be
reduced. In general, it takes longer to collect payment in the
capital equipment industry than in certain other industries.
Deferred Tax Assets. We make
estimates to determine the amount of our deferred tax assets that we believe is
more likely than not to be realized. We consider future taxable
income and ongoing prudent tax planning strategies in assessing the need for a
valuation allowance; however, should we determine that we will not be able to
realize all or part of our net deferred tax asset in the future, a decrease in
the deferred tax asset would negatively impact our results of operations,
particularly the income tax provision, in the period such determination was
made.
Stock-Based Compensation.
Stock-based compensation cost is estimated at the grant date based on the
fair-value of the award and is recognized as expense ratably over the requisite
service period of the award. Determining the appropriate fair-value
model and calculating the fair value of stock-based awards requires considerable
judgment, including estimating stock price volatility, expected option life and
forfeiture rates. We develop our estimates based on historical data
and market information which can change significantly over time. A
small change in the estimates used can have a relatively large change in the
estimated valuation.
Consistent with
authoritative accounting guidance, we use the Black-Scholes option valuation
model to value employee stock options. We estimate stock price
volatility based on a blended rate of historical volatility and the implied
volatility derived from traded options on our stock. Estimated option
life and forfeiture rate assumptions are derived from historical
data. For stock-based compensation awards with graded vesting that
were granted after fiscal 2005, we recognize compensation expense using the
straight-line amortization method. Beginning in fiscal 2008, most
stock-based compensation awards have been in the form of restricted stock
awards. As of September 30, 2009, $437,000 of total unrecognized
compensation cost related to non-vested stock option awards is expected to be
recognized over a weighted average period of 0.9 years. Additionally
as of September 30, 2009, $857,000 of total unrecognized compensation cost
related to restricted stock awards is expected to be recognized over a weighted
average period of 1.3 years. All stock options, whether vested or
unvested, and restricted stock units, to the extent not previously vested and
settled in full, that are outstanding immediately prior to the first time of
acceptance of shares for payment in Applied Materials’ tender offer, or the
acceptance time, will be cancelled, with the holder thereof being entitled to
receive a lump sum cash payment per share based on the $11 per share tender
offer consideration in accordance with the merger agreement with Applied
Materials. All restricted stock awards that are outstanding prior to
such acceptance time will vest in full as of such acceptance time, with the
holder thereof being entitled to receive a lump sum cash payment per share equal
to the $11 per share tender offer consideration.
Litigation
On
or about November 19, 2009, November 30, 2009 and December 4, 2009, three
purported class action lawsuits related to the tender offer and the merger,
captioned Stationary Engineers Local 39 Pension Trust Fund vs. Semitool, Inc.,
et al. (Cause No. DV-09-1461(B)), Stern vs. Thompson, et al. (Cause No.
DV-09-1513(C)), and Marvel v. Thompson, et al., respectively, were filed in the
Montana Eleventh Judicial District Court, County of Flathead, against Semitool,
each of Semitool’s directors, Applied Materials and Jupiter Acquisition Sub,
Inc. (the plaintiff in the Stationary Engineers Local action then filed an
amended complaint on or about November 25, 2009). Motions for
expedited proceedings were filed by the plaintiffs in the first and second
actions, respectively, on November 23, 2009 and December 1, 2009, in each case
requesting, among other things, that the Court expedite discovery and schedule a
hearing on such plaintiff’s proposed motion for a preliminary injunction no
later than December 17, 2009, the currently scheduled Expiration Date of the
tender offer. A hearing on the motion for expedited proceedings in
the Stationary Engineers Local action took place on December 9, 2009 and, on
December 10, 2009, the court issued an order denying the plaintiff’s motion for
expedited discovery and issued another order scheduling a hearing on December
15, 2009 in respect of plaintiff’s motion for a preliminary
injunction.
The actions, each
brought by a purported shareholder of Semitool, seek certification of a class of
all holders of Semitool common stock (except the defendants and their
affiliates) and allege, among other things, that Semitool’s directors breached
their fiduciary duties by (i) failing to maximize shareholder value; (ii)
securing benefits for certain defendants at the expense or to the detriment of
Semitool’s public shareholders; (iii) discouraging and/or inhibiting alternative
offers to purchase control of Semitool or its assets; and (iv) failing to
disclose material non-public information, and that Applied Materials aided and
abetted such alleged breaches. The actions seek, among other things, injunctive
relief enjoining the defendants from consummating the tender offer and the
merger and damages, as well as recovery of the costs of the action, including
reasonable attorneys’ and experts’ fees. We believe the claims alleged against
us in the actions are without merit and intend to defend against them
vigorously. In addition, Applied Materials has informed us that it also believes
the allegations against it in the actions to be without merit, and that it
intends to defend against the claims vigorously.
We
are involved in legal proceedings that arise in the ordinary course of our
business, including employment related litigation. Although there can be no
assurance as to the ultimate disposition of these matters, it is the opinion of
management, based upon the information available at this time, that the
currently expected outcome of these matters, individually or in the aggregate,
will not have a material adverse effect on our business, financial condition,
results of operations or cash flows.
New
Accounting Pronouncements
In
June 2009, the Financial Accounting Standards Board (FASB) issued authoritative
guidance to establish the FASB Accounting Standards Codification (ASC) as the
source of authoritative accounting principles and the framework for selecting
the principles used in the preparation of financial statements of
nongovernmental entities that are presented in conformity with generally
accepted accounting principles in the United States. This guidance is
effective for us in the fiscal year reporting period ended on September 30, 2009
and only impacts references for accounting guidance.
In
October 2009, the FASB’s Emerging Issues Task Force (EITF) issued authoritative
guidance addressing revenue arrangements with multiple
deliverables. The authoritative guidance eliminates the criterion for
objective and reliable evidence of fair value for the undelivered products or
services. Instead, revenue arrangements with multiple deliverables
should be divided into separate units of accounting provided the deliverables
meet certain criteria. This guidance also eliminates the use of the
residual method of allocation and requires that the arrangement consideration be
allocated at the inception of the arrangement to all deliverables based on their
relative selling price. The guidance provides a hierarchy for
estimating the selling price of each of the deliverables. The
guidance is effective prospectively for revenue arrangements entered into or
materially modified in fiscal years beginning on or after June 15,
2010. Early adoption is permitted. Accordingly, we will
adopt this guidance in fiscal 2011. We are currently evaluating the
impact of adopting this guidance on our results of operations and financial
condition.
In
April 2009, the FASB issued authoritative guidance to address application issues
on initial recognition and measurement, subsequent measurement and accounting
and disclosure of assets and liabilities arising from contingencies in a
business combination. We are required to adopt this guidance in the first annual
reporting period beginning on or after December 15, 2008. Accordingly, we have
adopted this guidance effective at the beginning of fiscal 2010, although it
will only impact us if we are involved in a business combination as an
acquirer.
In
April 2008, the FASB issued authoritative guidance amending the factors that
should be considered in developing renewal or extension assumptions used to
determine the useful life of a recognized intangible asset. The
intent of this guidance is to improve the consistency between the useful life of
a recognized intangible asset and the period of expected cash flows used to
measure the fair value of the asset as provided for under separate accounting
guidance topics. This guidance is effective for fiscal years
beginning after December 15, 2008 and for interim periods within those years
with early adoption prohibited. Accordingly, we will adopt this
guidance in fiscal 2010 and it will only impact us if we acquire assets for
which we need to develop renewal or extension assumptions to determine the
useful life of a recognized intangible asset
In
December 2007, the FASB issued authoritative guidance retaining the purchase
method of accounting for acquisitions, but requiring a number of changes,
including changes in the way assets and liabilities are recognized in purchase
accounting. It also changes the recognition of assets acquired and
liabilities assumed arising from contingencies, requires the capitalization of
in-process research and development at fair value, and requires the expensing of
acquisition-related costs as incurred. This guidance applies
prospectively to business combinations for which the acquisition date is on or
after the beginning of the first annual reporting period beginning on or after
December 15, 2008 and early adoption is prohibited. Accordingly, we
will adopt this guidance in the first quarter of fiscal 2010 and the guidance
will only impact us if we are involved in a business combination as an
acquirer.
In
September 2006, the FASB issued authoritative guidance clarifying the definition
of fair value and establishing a framework for measuring fair value in generally
accepted accounting principles and expanding disclosures about fair value
measurements. We adopted this guidance for financial assets and
liabilities in the first quarter of fiscal 2009 and as permitted by the
authoritative guidance, we expect to adopt its provisions for non-financial
assets and liabilities in the first quarter of fiscal 2010. In August
2009, the FASB issued additional guidance providing clarification for measuring
fair value when a quoted price in an active market for the identical liability
is not available. This supplemental guidance also clarifies that when
estimating the fair value of a liability, a reporting entity is not required to
include a separate input or adjustment to other inputs relating to the existence
of a restriction that prevents the transfer of the liability. The
supplemental guidance is effective for fiscal periods beginning with the first
reporting period after issuance. Accordingly, we will adopt this
guidance in the first quarter of fiscal 2010. We do not expect the
adoption of this guidance to materially impact our results of operations or
financial condition.
Item 7A. Quantitative and Qualitative Disclosures About
Market Risk
Market
Risks
Market risks
relating to our operations result primarily from changes in interest rates and
changes in foreign currency exchange rates.
As
of September 30, 2009, we had approximately $10.5 million in long-term debt and
$15.0 million in short-term debt. As of September 30, 2008, we had
approximately $11.6 million in long-term debt and $3.2 million in short term
debt. Our long-term debt bears interest at a fixed rate. As a result,
changes in the fixed rate interest market would change the estimated fair value
of the fixed rate long-term debt. Our short-term debt bears interest at the
bank’s prime lending rate, 3.25% as of September 30, 2009, or at our option,
LIBOR plus 2.25%, or 2.54% as of that date. We believe that a 10%
change in the long-term or the short-term interest rates would not have a
material effect on our business, financial condition, results of operations or
cash flows. See Note 9 – Long-Term Debt and Capital
Leases.
All of our
international operations are subject to inherent risks in conducting business
abroad, including fluctuation in the relative value of currencies. We
manage this risk and attempt to reduce such exposure through an economic hedge
using short-term forward exchange contracts. At September 30, 2008,
we held forward contracts to sell Japanese Yen with a total face value of $5.5
million and a total market value of $5.6 million and a total unrealized future
loss of approximately $100,000. At September 30, 2009, we held no forward
contracts. The impact of movements in currency exchange rates on
forward contracts is offset to the extent of receivables denominated in Japanese
Yen. The effect of a 10% change in foreign exchange rates on hedged
transactions involving Japanese Yen forward exchange contracts and the
underlying transactions would not be material to our financial condition,
results of operations or cash flows. We do not hold or issue
derivative financial instruments for trading or speculative
purposes.
Item 8. Financial Statements and Supplementary
Data
SEMITOOL,
INC.
CONSOLIDATED
BALANCE SHEETS
September 30, 2009
and 2008
(Amounts in
Thousands, Except Share Amounts)
|
2009
|
2008
|
|||||||
|
ASSETS
|
||||||||
|
Current
assets:
|
||||||||
|
Cash and cash
equivalents
|
$ | 44,617 | $ | 11,624 | ||||
|
Restricted
cash
|
25 | 817 | ||||||
|
Marketable
securities
|
-- | 380 | ||||||
|
Trade
receivables, less allowance for doubtful accounts of $259 in both
periods
|
44,266 | 73,695 | ||||||
|
Inventories
|
65,810 | 88,773 | ||||||
|
Income tax
refund receivable
|
1 | 472 | ||||||
|
Prepaid
expenses and other current assets
|
3,602 | 4,371 | ||||||
|
Deferred
income taxes
|
14,888 | 14,175 | ||||||
|
Total current
assets
|
173,209 | 194,307 | ||||||
|
Property,
plant and equipment, net
|
43,255 | 49,909 | ||||||
|
Intangibles,
less accumulated amortization of $5,398 and $4,341 in 2009 and
2008
|
6,625 | 7,861 | ||||||
|
Other
assets
|
7,925 | 735 | ||||||
|
Total
assets
|
$ | 231,014 | $ | 252,812 | ||||
|
LIABILITIES
AND SHAREHOLDERS’ EQUITY
|
||||||||
|
Current
liabilities:
|
||||||||
|
Accounts
payable
|
$ | 10,876 | $ | 19,007 | ||||
|
Note payable
to bank
|
15,000 | 3,215 | ||||||
|
Accrued
commissions
|
1,828 | 1,972 | ||||||
|
Accrued
warranty
|
6,961 | 9,786 | ||||||
|
Accrued
payroll and related benefits
|
4,937 | 8,033 | ||||||
|
Income taxes
payable
|
246 | 2,601 | ||||||
|
Other accrued
liabilities
|
1,174 | 3,294 | ||||||
|
Customer
advances
|
2,065 | 1,936 | ||||||
|
Deferred
profit
|
3,549 | 7,726 | ||||||
|
Long-term
debt due within one year
|
1,214 | 1,222 | ||||||
|
Total current
liabilities
|
47,850 | 58,792 | ||||||
|
Long-term
debt due after one year
|
9,260 | 10,417 | ||||||
|
Deferred and
long-term income taxes
|
4,534 | 5,246 | ||||||
|
Total
liabilities
|
61,644 | 74,455 | ||||||
|
Commitments
and contingencies
|
||||||||
|
Shareholders’
equity:
|
||||||||
|
Preferred
stock, no par value, 5,000,000 shares authorized,
|
||||||||
|
no shares
issued and outstanding
|
-- | -- | ||||||
|
Common stock,
no par value, 75,000,000 shares authorized,
|
||||||||
|
32,740,176
and 32,719,276 shares issued and outstanding in 2009 and
2008
|
88,397 | 87,293 | ||||||
|
Retained
earnings
|
80,068 | 91,496 | ||||||
|
Accumulated
other comprehensive income (loss)
|
905 | (432 | ) | |||||
|
Total
shareholders’ equity
|
169,370 | 178,357 | ||||||
|
Total
liabilities and shareholders’ equity
|
$ | 231,014 | $ | 252,812 | ||||
The
accompanying notes are an integral part of the consolidated financial
statements.
SEMITOOL,
INC.
CONSOLIDATED
STATEMENTS OF OPERATIONS
For the years ended
September 30, 2009, 2008 and 2007
(Amounts in
Thousands, Except Per Share Amounts)
|
2009
|
2008
|
2007
|
||||||||||
|
Net
sales
|
$ | 139,040 | $ | 238,604 | $ | 215,220 | ||||||
|
Cost of
sales
|
79,952 | 121,209 | 113,729 | |||||||||
|
Gross
profit
|
59,088 | 117,395 | 101,491 | |||||||||
|
Operating
expenses:
|
||||||||||||
|
Selling,
general and administrative
|
50,271 | 76,929 | 71,749 | |||||||||
|
Research
and development
|
25,563 | 30,440 | 27,080 | |||||||||
|
Downsizing
costs
|
2,566 | -- | 677 | |||||||||
|
Gain
on sale of assets
|
(405 | ) | -- | (648 | ) | |||||||
|
Total
operating expenses
|
77,995 | 107,369 | 98,858 | |||||||||
|
Income (loss)
from operations
|
(18,907 | ) | 10,026 | 2,633 | ||||||||
|
Other income
(expense):
|
||||||||||||
|
Interest
income
|
101 | 240 | 352 | |||||||||
|
Interest
expense
|
(790 | ) | (488 | ) | (649 | ) | ||||||
|
Other,
net
|
(393 | ) | (795 | ) | 1,003 | |||||||
|
Total other
income (expense)
|
(1,082 | ) | (1,043 | ) | 706 | |||||||
|
Income (loss)
before income taxes
|
(19,989 | ) | 8,983 | 3,339 | ||||||||
|
Income
tax provision (benefit)
|
(8,561 | ) | 2,946 | (1,892 | ) | |||||||
|
Net income
(loss)
|
$ | (11,428 | ) | $ | 6,037 | $ | 5,231 | |||||
|
Earnings
(loss) per share:
|
||||||||||||
|
Basic
|
$ | (0.35 | ) | $ | 0.19 | $ | 0.16 | |||||
|
Diluted
|
$ | (0.35 | ) | $ | 0.19 | $ | 0.16 | |||||
|
Weighted
average common shares outstanding:
|
||||||||||||
|
Basic
|
32,555 | 32,347 | 32,034 | |||||||||
|
Diluted
|
32,555 | 32,534 | 32,450 | |||||||||
The
accompanying notes are an integral part of the consolidated financial
statements.
SEMITOOL,
INC.
CONSOLIDATED
STATEMENTS OF CHANGES IN SHAREHOLDERS’ EQUITY
For the years ended
September 30, 2009, 2008 and 2007
(Amounts in
Thousands)
|
Common
Stock
|
||||||||||||||||||||
|
Accumulated
|
||||||||||||||||||||
|
Number
|
Other
|
|||||||||||||||||||
|
Of
|
Retained
|
Comprehensive
|
||||||||||||||||||
|
Shares
|
Amount
|
Earnings
|
Income
(Loss)
|
Total
|
||||||||||||||||
|
Balance
September 30, 2006
|
31,925 | $ | 80,738 | $ | 80,899 | $ | (613 | ) | $ | 161,024 | ||||||||||
|
Net
income
|
-- | -- | 5,231 | -- | 5,231 | |||||||||||||||
|
Issuance
of common stock under
|
||||||||||||||||||||
|
employee
compensation plans
|
182 | 1,177 | -- | -- | 1,177 | |||||||||||||||
|
Income
tax effect of stock option
|
||||||||||||||||||||
|
transactions
|
-- | 247 | -- | -- | 247 | |||||||||||||||
|
Compensation
expense recognized under
|
||||||||||||||||||||
|
employee
stock incentive plans
|
-- | 1,053 | -- | -- | 1,053 | |||||||||||||||
|
Other
comprehensive income (loss)
|
-- | -- | -- | 121 | 121 | |||||||||||||||
|
Balance
September 30, 2007
|
32,107 | 83,215 | 86,130 | (492 | ) | 168,853 | ||||||||||||||
|
Net
income
|
-- | -- | 6,037 | -- | 6,037 | |||||||||||||||
|
Cumulative
effect of adoption of new accounting
|
||||||||||||||||||||
| literature related to uncertain income tax positions | -- | -- | (671 | ) | -- | (671 | ) | |||||||||||||
|
Issuance
of common stock under
|
||||||||||||||||||||
|
employee
compensation plans
|
612 | 2,061 | -- | -- | 2,061 | |||||||||||||||
|
Income
tax effect of stock option
|
||||||||||||||||||||
|
transactions
|
-- | 235 | -- | -- | 235 | |||||||||||||||
|
Compensation
expense recognized under
|
||||||||||||||||||||
|
employee
stock incentive plans
|
-- | 1,782 | -- | -- | 1,782 | |||||||||||||||
|
Other
comprehensive income (loss)
|
-- | -- | -- | 60 | 60 | |||||||||||||||
|
Balance
September 30, 2008
|
32,719 | 87,293 | 91,496 | (432 | ) | 178,357 | ||||||||||||||
|
Net
loss
|
-- | -- | (11,428 | ) | -- | (11,428 | ) | |||||||||||||
|
Issuance
of common stock under
|
||||||||||||||||||||
|
employee
compensation plans
|
21 | 19 | -- | -- | 19 | |||||||||||||||
|
Compensation
expense recognized under
|
||||||||||||||||||||
|
employee
stock incentive plans
|
-- | 1,085 | -- | -- | 1,085 | |||||||||||||||
|
Other
comprehensive income (loss)
|
-- | -- | -- | 1,337 | 1,337 | |||||||||||||||
|
Balance
September 30, 2009
|
32,740 | $ | 88,397 | $ | 80,068 | $ | 905 | $ | 169,370 | |||||||||||
The
accompanying notes are an integral part of the consolidated financial
statements.
SEMITOOL,
INC.
CONSOLIDATED
STATEMENTS OF CASH FLOWS
For the years ended
September 30, 2009, 2008 and 2007
(Amounts in
Thousands)
|
2009
|
2008
|
2007
|
||||||||||
|
Operating
activities:
|
||||||||||||
|
Net
income (loss)
|
$ | (11,428 | ) | $ | 6,037 | $ | 5,231 | |||||
|
Adjustments
to reconcile net income (loss) to net
|
||||||||||||
|
cash
provided by (used in) operating activities:
|
||||||||||||
|
(Gain)
loss on disposition of assets
|
216 | 329 | (398 | ) | ||||||||
|
Depreciation
and amortization
|
11,604 | 11,341 | 10,703 | |||||||||
|
Deferred
income taxes
|
(7,621 | ) | (650 | ) | (2,308 | ) | ||||||
|
Income
tax benefit received on the exercise of stock-based awards
|
-- | -- | 29 | |||||||||
|
Stock-based
compensation
|
1,085 | 1,782 | 1,053 | |||||||||
|
Non-cash
assets acquired in sales transaction
|
(1,382 | ) | (370 | ) | -- | |||||||
|
Marketable
securities acquired in sales transaction
|
-- | (1,280 | ) | -- | ||||||||
|
Change
in:
|
||||||||||||
|
Restricted
cash
|
792 | (817 | ) | -- | ||||||||
|
Trade
receivables
|
31,679 | (15,345 | ) | (492 | ) | |||||||
|
Inventories
|
19,417 | (16,206 | ) | 6,604 | ||||||||
|
Income
tax refund receivable
|
471 | (472 | ) | 135 | ||||||||
|
Prepaid
expenses and other current assets
|
1,540 | (785 | ) | (646 | ) | |||||||
|
Other
assets
|
(67 | ) | 141 | 42 | ||||||||
|
Accounts
payable
|
(9,261 | ) | 5,395 | (10,355 | ) | |||||||
|
Accrued
commissions
|
(169 | ) | 397 | (764 | ) | |||||||
|
Accrued
warranty
|
(2,859 | ) | 1,994 | 407 | ||||||||
|
Accrued
payroll and related benefits
|
(3,308 | ) | 1,088 | (1,964 | ) | |||||||
|
Income
taxes payable
|
(2,441 | ) | 3,902 | (3,036 | ) | |||||||
|
Other
accrued liabilities
|
(2,205 | ) | (393 | ) | 1,591 | |||||||
|
Customer
advances
|
122 | 318 | (2,945 | ) | ||||||||
|
Deferred
profit
|
(4,186 | ) | (1,165 | ) | 41 | |||||||
|
Net
cash provided by (used in) operating activities
|
21,999 | (4,759 | ) | 2,928 | ||||||||
|
Investing
activities:
|
||||||||||||
|
Purchases
of property, plant and equipment
|
(735 | ) | (5,060 | ) | (8,726 | ) | ||||||
|
Increases
in intangible assets
|
(425 | ) | (787 | ) | (1,055 | ) | ||||||
|
Proceeds
from sale of property, plant and equipment
|
1,639 | 9 | 1,885 | |||||||||
|
Net
cash providing by (used in) investing activities
|
479 | (5,838 | ) | (7,896 | ) | |||||||
|
Financing
activities:
|
||||||||||||
|
Proceeds
from exercise of stock options
|
19 | 2,061 | 1,177 | |||||||||
|
Excess
tax benefits received on the exercise of stock-based
awards
|
-- | 235 | 218 | |||||||||
|
Borrowings
under line of credit and short-term debt
|
15,246 | 25,286 | 20,538 | |||||||||
|
Repayments
of line of credit and short-term debt
|
(3,461 | ) | (22,071 | ) | (23,647 | ) | ||||||
|
Borrowings
under long-term debt
|
-- | 1,648 | 6,466 | |||||||||
|
Repayments
of long-term debt and capital leases
|
(1,417 | ) | (1,155 | ) | (1,105 | ) | ||||||
|
Net
cash provided by financing activities
|
10,387 | 6,004 | 3,647 | |||||||||
|
Effect of
exchange rate changes on cash and cash equivalents
|
128 | 127 | 64 | |||||||||
|
Net increase
(decrease) in cash and cash equivalents
|
32,993 | (4,466 | ) | (1,257 | ) | |||||||
|
Cash and cash
equivalents at beginning of year
|
11,624 | 16,090 | 17,347 | |||||||||
|
Cash and cash
equivalents at end of year
|
$ | 44,617 | $ | 11,624 | $ | 16,090 | ||||||
SEMITOOL,
INC.
CONSOLIDATED
STATEMENTS OF CASH FLOWS, CONTINUED
For the years ended
September 30, 2009, 2008 and 2007
(Amounts in
Thousands)
|
2009
|
2008
|
2007
|
||||||||||
|
Supplemental
disclosures of cash flow information:
|
||||||||||||
|
Cash
paid (received) during the year for:
|
||||||||||||
|
Interest
|
$ | 751 | $ | 490 | $ | 664 | ||||||
|
Income
taxes
|
1,142 | (366 | ) | 3,330 | ||||||||
|
Supplemental
disclosures of non-cash financing and investing activity:
|
||||||||||||
|
Inventory
transferred to property, plant and equipment
|
$ | 4,010 | $ | 6,175 | $ | 5,732 | ||||||
|
Other-than-temporary
impairment of marketable securities
|
380 | 900 | -- | |||||||||
The
accompanying notes are an integral part of the consolidated financial
statements.
SEMITOOL,
INC.
CONSOLIDATED
STATEMENTS OF COMPREHENSIVE INCOME (LOSS)
For the years ended
September 30, 2009, 2008 and 2007
(Amounts in
Thousands)
|
2009
|
2008
|
2007
|
||||||||||
|
Net income
(loss)
|
$ | (11,428 | ) | $ | 6,037 | $ | 5,231 | |||||
|
Net gain
(loss) on cash flow hedges
|
160 | 22 | (363 | ) | ||||||||
|
Foreign
currency translation adjustments
|
1,177 | 38 | 484 | |||||||||
|
Total
comprehensive income (loss)
|
$ | (10,091 | ) | $ | 6,097 | $ | 5,352 | |||||
The
accompanying notes are an integral part of the consolidated financial
statements.
SEMITOOL,
INC.
NOTES
TO CONSOLIDATED FINANCIAL STATEMENTS
1. Company Organization and Summary of
Significant Accounting Policies:
Semitool, Inc.
(Semitool or the Company) designs, manufactures, installs and services
highly-engineered equipment for use in the fabrication of semiconductor
devices. Semitool’s products are focused on the wet chemical process
steps in integrated circuit, or IC, manufacturing and include systems for wafer
surface preparation and electrochemical deposition, or ECD,
applications. The Company’s surface preparation systems are designed
for Front End of Line (FEOL), Back End of Line (BEOL) and wafer level packaging
of ICs processes. Semitool’s single-wafer FEOL surface preparation
systems are used for photoresist stripping, post etch and pre-diffusion
cleans. The Company’s BEOL surface preparation systems are used for
polymer removal and packaging applications. Semitool’s ECD systems
are used to plate copper and other metals, which are used for the IC’s internal
wiring, or interconnects; to plate solder and lead free solder bumps for wafer
level packaging applications; and to plate other metals for various
semiconductor and related applications. Also, the Company’s surface
preparation systems are used for cleaning and etching processes for wafer level
packaging. Semitool’s primary product for all of these processes is
the Raider platform, which is a multi-chamber single-wafer tool. The
Company’s products address critical applications within the semiconductor
manufacturing process, and help enable Semitool’s customers to manufacture more
advanced semiconductor devices that feature higher levels of
performance. The fabrication of semiconductor devices typically
requires several hundred manufacturing steps, with the number of steps
continuing to increase for advanced devices.
Significant
accounting policies followed by the Company are:
Principles
of Consolidation
The consolidated
financial statements include the accounts of Semitool and its wholly-owned
subsidiaries: Semitool Austria GmbH, Semitool Europe Ltd., (United Kingdom);
Semitool Halbleitertechnik Vertriebs GmbH, (Germany); Semitool France SARL;
Semitool Israel Ltd.; Semitool Italia SRL; Semitool Japan Inc.; Semitool Korea,
Inc.; Semitool (Philippines) Inc.; Semitool (Asia) Pte Ltd., (Singapore);
Semitool Semiconductor Equipment Technology (Shanghai) Co., LTD.; Semitool
(Taiwan) Inc.; and Rhetech, Inc.
All significant
intercompany accounts and transactions are eliminated in
consolidation.
Estimates
The preparation of
consolidated financial statements in conformity with accounting principles
generally accepted in the United States of America requires the Company to make
estimates and judgments that affect the reported amounts of assets, liabilities,
revenues and expenses, and related disclosure of contingent
liabilities. On an on-going basis, the Company evaluates its
estimates, including those related to revenue recognition, bad debts,
inventories, investments, intangible assets, income taxes, financing operations,
warranty obligations, employee benefits, contingencies and
litigation. The Company bases its estimates on historical experience
and on various other assumptions that are believed to be reasonable under the
circumstances, the results of which form the basis for making judgments about
the carrying values of assets and liabilities that are not readily apparent from
other sources. Actual results may differ from these estimates under
different assumptions or conditions.
Cash
Equivalents
The Company
considers all highly liquid investments with original or purchased maturities of
three months or less to be cash equivalents. The Company invests its
cash and cash equivalents in deposits with major financial institutions, which,
at times, exceed federally insured limits. The Company has not
experienced any losses on its cash and cash equivalents.
Trade
Receivables and Allowance for Doubtful Accounts
Trade receivables
are recorded at the invoice amount and do not bear interest. Past due
accounts are determined based on contractual terms. The Company
maintains allowances for doubtful accounts for estimated losses resulting from
the inability of its customers to make required payments based on its experience
and knowledge of the current financial condition of its customers.
Derivatives
From time to time
the Company uses derivative instruments to manage some of its exposures to
certain foreign currency risks. The objective for holding derivatives
is to minimize these risks using the most effective methods to eliminate or
reduce the impact of these exposures. The Company uses cash flow
hedge accounting in accordance with authoritative accounting guidance to account
for hedges. At the inception of the hedge, the hedging relationship
to a forecasted transaction, the risk management objective and the strategy for
undertaking the hedge is documented. Quarterly, forward rates are
used to evaluate hedging effectiveness. For effective hedges,
unrealized gains and losses are included in accumulated other comprehensive
income (loss) (Accumulated OCI). If the derivative no longer meets
hedge accounting criteria, or the terms of the hedged item change so the
derivative no longer qualifies for hedge accounting, the derivative is
marked-to-market. Any amounts in Accumulated OCI relating to a
derivative that no longer qualifies for hedge accounting are transferred out of
Accumulated OCI and reported in earnings during the period in which hedge
accounting no longer applies. At maturity or termination the gain or
loss on the derivative is calculated and reported in earnings.
Certain forecasted
transactions and assets are exposed to foreign currency risk. The
Company monitors foreign currency exposures regularly to maximize the overall
effectiveness of the foreign currency hedge positions. The only
currency hedged is the Japanese Yen. Forward contracts used to hedge
forecasted international sales on credit for up to 18 months in the future are
designated as cash flow hedging instruments. Derivative gains and
losses included in Accumulated OCI are reclassified when forecasted transactions
become receivables. During the fiscal years ended September 30, 2009
and 2008, the amount transferred from Accumulated OCI to Other income (expense)
was not material. The Company held no forward contracts as of
September 30, 2009.
All derivatives,
whether designated in hedging relationships or not, are recorded on the
Consolidated Balance Sheets at fair value. If the derivative is designated a
fair value hedge, the changes in the fair value of the derivative and of the
hedged item attributable to the hedged risk are recognized in
earnings. If the derivative is designated as a cash flow hedge, the
effective portions of changes in the fair value of the derivative are recorded
in Accumulated OCI and are recognized in earnings when the cash flow hedge
ceases.
Ineffective
portions of changes in the fair value of cash flow hedges are recognized in
earnings. Hedge ineffectiveness, determined in accordance with
authoritative accounting guidance, had no impact on earnings for the fiscal
years ended September 30, 2009, 2008 and 2007.
Inventories
Inventories are
carried at the lower of first-in, first-out (FIFO) cost or
market. The Company periodically reviews its inventories to identify
excess and obsolete inventories and to record such inventories at net realizable
values. It is reasonably possible that the Company’s estimates of net
realizable values could be revised in the near term due to technological and
other changes.
Property,
Plant and Equipment
Property, plant and
equipment are stated at cost less accumulated
depreciation. Depreciation and amortization are provided using the
straight-line method with estimated useful lives as follows:
|
Buildings and
improvements
|
10-40
years
|
|
Machinery and
equipment
|
2-5
years
|
|
Furniture and
fixtures
|
3-7
years
|
|
Vehicles and
aircraft
|
5-10
years
|
|
Leasehold
improvements
|
The useful
life of the improvement
|
Major additions and
betterments are capitalized. Costs of maintenance and repairs which
do not improve or extend the lives of the respective assets are expensed when
incurred. When items are disposed, the related costs and accumulated
depreciation are removed from the accounts and any gain or loss is
recognized.
Long-Lived
Assets
The Company
evaluates the carrying value of its long-lived assets whenever events or changes
in circumstances indicate that the carrying value of the asset may be
impaired. An impairment loss is recognized when estimated future cash
flows expected to result from the use of the asset including disposition, are
less than the carrying value of the asset.
Intangible
Assets
Intangible assets
primarily include legal costs associated with obtaining patents. The
cost of granted patents is amortized on a straight-line basis over the lesser of
the estimated economic life or seven years.
Revenue
Recognition
Revenue is recognized only when persuasive evidence of an arrangement exists, delivery has occurred or services have been rendered, the seller’s price is fixed or determinable and collectability is reasonably assured. The Company’s product sales generally contain substantive customer acceptance provisions. Sales of new products to new or existing customers are not recognized until customer acceptance. Likewise, sales of existing products to new customer environments are not recognized until customer acceptance. If multiple elements exist, sales of existing products into existing customer environments are treated as such in accordance with current authoritative accounting guidance. The amount of revenue recognized in multiple element arrangements is the lesser of the fair value of the equipment or the contracted amount that was due or payable upon title transfer. The revenue for elements other than equipment is recorded in deferred profit and is recognized when the remaining goods and/or services are delivered or performed. Revenue related to service is recognized upon completion of performance of the service or ratably over the life of the related service contract. Spare parts sales are recognized upon shipment when title and risk of loss pass to the customer.
Deferred profit
included in current liabilities is derived from deferred revenue, which
primarily relates to equipment shipped to customers that has not been accepted
by the customer, less the deferred cost of sales, including warranty and
installation, and commission expenses.
Semitool’s shipping
terms are customarily FOB Semitool shipping point or equivalent
terms. All sales, use, value added, excise or other taxes imposed by
a governmental authority on customer sales are presented on a net basis, and
therefore excluded from revenues.
Warranty
Obligations
The Company’s
obligations for warranty are accrued concurrently with the revenue recognized on
the related equipment. The Company makes provisions for its warranty
obligations based upon historical costs incurred for such obligations adjusted,
as necessary, for current conditions and factors. Due to the
significant uncertainties and judgments involved in estimating the Company’s
warranty obligations, including changing product designs and specifications, the
ultimate amount incurred for warranty costs could change in the near term from
the Company’s current estimate.
Foreign
Currency
The functional
currency for most of the Company’s foreign subsidiaries is the U.S.
dollar. For these foreign operations, realized gains and losses from
foreign currency transactions and unrealized gains and losses from
re-measurement of the financial statements of the foreign operations into the
functional currency are included in the Consolidated Statements of
Operations.
Semitool Japan uses
the Yen as its functional currency and invoices its customers in
Yen. All assets and liabilities of Semitool Japan are translated at
period-end exchange rates and all revenues and expenses are re-measured at
average rates prevailing during the period. Translation adjustments
are reported as a separate component of Accumulated OCI. Transaction gains and
losses are included in the Consolidated Statements of Operations.
Beginning in April
2007, due to a change in how the Company conducts business and following an
evaluation of the scope of its operations and business practices, the Company
concluded that the Euro is the currency of the primary economic environment in
which Semitool Austria operates and consequently, changed the functional
currency for Semitool Austria to the Euro. Semitool Austria invoices
its customers in Euros and its financing and operating activities are
denominated in the Euro. Accordingly, from April 1, 2007, all assets
and liabilities of Semitool Austria are translated at period-end exchange rates
and all revenues and expenses are re-measured at average rates prevailing during
the period. Translation adjustments are reported as a separate
component of Accumulated OCI. Transaction gains and losses are
included in the Consolidated Statements of Operations.
Advertising
Costs
The Company
expenses advertising costs as incurred. Advertising costs were not
material in all of the periods presented in the Consolidated Statements of
Operations.
Research
and Development Costs
Research and
Development (R&D) expense consists of salaries, project materials,
laboratory costs, consulting fees and other costs associated with product
development efforts. Costs of research and development are expensed
as incurred.
Stock-Based
Compensation
Stock-based
compensation cost is measured at grant date, based on the fair value of the
award and is recognized as expense, amortized on a straight-line basis, over the
requisite service period of the individual grants, which generally equals the
vesting period.
The Company elected
to adopt the modified prospective application method as provided under
authoritative accounting guidance. As a result, the Company’s
Consolidated Statements of Operations as of September 30, 2009, 2008 and 2007
reflect compensation cost for new stock awards granted under the stock incentive
plans during fiscal 2009, 2008 and 2007 and the nonvested portion of stock
options granted prior to October 1, 2005 which vested during fiscal 2009, 2008
and 2007. Total compensation cost recorded in fiscal 2009, 2008 and
2007, respectively, was $1.1 million, $1.8 million and $1.1 million pre-tax, or
$678,000, $1.2 million and $1.1 million after tax, an impact of approximately
$0.02, $0.04 and $0.03 per basic and diluted share.
The Company elected
to adopt the alternative transition method for calculating the tax effects of
stock-based compensation. The alternative transition method includes
computational guidance to establish the beginning balance of the additional
paid-in capital pool (APIC Pool) related to the tax effects of employee
stock-based compensation awards that were vested and outstanding upon initial
adoption of the authoritative accounting guidance.
Computation
of Earnings (Loss) Per Share
The computation of
basic and diluted earnings (loss) per share is based on the following (in
thousands):
|
2009
|
2008
|
2007
|
||||||||||
|
Numerator:
|
||||||||||||
|
Net
income (loss) used for basic and diluted
|
||||||||||||
|
earnings
(loss) per share
|
$ | (11,428 | ) | $ | 6,037 | $ | 5,231 | |||||
|
Denominator:
|
||||||||||||
|
Weighted
average common shares used for
|
||||||||||||
|
basic
earnings (loss) per share
|
32,555 | 32,347 | 32,034 | |||||||||
|
Effects
of dilutive stock options
|
-- | 187 | 416 | |||||||||
|
Denominator
for diluted earnings (loss) per share
|
32,555 | 32,534 | 32,450 | |||||||||
Diluted earnings
(loss) per share excludes the effects of antidilutive stock options to purchase
1,346,024, 903,113 and 577,719 shares of common stock in fiscal 2009, 2008 and
2007, respectively.
Reclassifications
Certain
reclassifications have been made to the prior year financial statements to
conform to the current year presentation.
New
Accounting Pronouncements
In
June 2009, the Financial Accounting Standards Board (FASB) issued authoritative
guidance to establish the FASB Accounting Standards Codification (ASC) as the
source of authoritative accounting principles and the framework for selecting
the principles used in the preparation of financial statements of
nongovernmental entities that are presented in conformity with generally
accepted accounting principles in the United States. This guidance is
effective for the Company in the fiscal year reporting period ended on September
30, 2009 and only impacts references for accounting guidance.
In
October 2009, the FASB’s Emerging Issues Task Force (EITF) issued authoritative
guidance addressing revenue arrangements with multiple
deliverables. The authoritative guidance eliminates the criterion for
objective and reliable evidence of fair value for the undelivered products or
services. Instead, revenue arrangements with multiple deliverables
should be divided into separate units of accounting provided the deliverables
meet certain criteria. This guidance also eliminates the use of the
residual method of allocation and requires that the arrangement consideration be
allocated at the inception of the arrangement to all deliverables based on their
relative selling price. The guidance provides a hierarchy for
estimating the selling price of each of the deliverables. The
guidance is effective prospectively for revenue arrangements entered into or
materially modified in fiscal years beginning on or after June 15,
2010. Early adoption is permitted. Accordingly, the
Company will adopt this guidance in fiscal 2011. The Company is
currently evaluating the impact of adoption of this guidance its results of
operations and financial condition.
In
April 2009, the FASB issued authoritative guidance to address application issues
on initial recognition and measurement, subsequent measurement and accounting
and disclosure of assets and liabilities arising from contingencies in a
business combination. The Company is required to adopt this guidance in the
first annual reporting period beginning on or after December 15,
2008. Accordingly, the Company has adopted this guidance effective at
the beginning of fiscal 2010, although it will only impact the Company if it is
involved in a business combination as an acquirer.
In
April 2008, the FASB issued authoritative guidance amending the factors that
should be considered in developing renewal or extension assumptions used to
determine the useful life of a recognized intangible asset. The
intent of this guidance is to improve the consistency between the useful life of
a recognized intangible asset and the period of expected cash flows used to
measure the fair value of the asset as provided for under separate accounting
guidance topics. This guidance is effective for fiscal years
beginning after December 15, 2008 and for interim periods within those years
with early adoption prohibited. Accordingly, the Company will adopt
this guidance in fiscal 2010 and it will only impact the Company if the Company
acquires assets for which it needs to develop renewal or extension assumptions
to determine the useful life of a recognized intangible asset
In
December 2007, the FASB issued authoritative guidance retaining the purchase
method of accounting for acquisitions, but requiring a number of changes,
including changes in the way assets and liabilities are recognized in purchase
accounting. It also changes the recognition of assets acquired and
liabilities assumed arising from contingencies, requires the capitalization of
in-process research and development at fair value, and requires the expensing of
acquisition-related costs as incurred. This guidance applies
prospectively to business combinations for which the acquisition date is on or
after the beginning of the first annual reporting period beginning on or after
December 15, 2008 and early adoption is prohibited. Accordingly, the
Company will adopt this guidance in the first quarter of its fiscal 2010 and the
guidance will only impact the Company if it is involved in a business
combination as an acquirer.
In
September 2006, the FASB issued authoritative guidance clarifying the definition
of fair value and establishing a framework for measuring fair value in generally
accepted accounting principles and expanding disclosures about fair value
measurements. The Company adopted this guidance for financial
assets and liabilities in the first quarter of fiscal 2009 and as permitted by
the authoritative guidance, the Company expects to adopt its provisions for
non-financial assets and liabilities in the first quarter of fiscal
2010. In August 2009, the FASB issued additional guidance providing
clarification for measuring fair value when a quoted price in an active market
for the identical liability is not available. This supplemental
guidance also clarifies that when estimating the fair value of a liability, a
reporting entity is not required to include a separate input or adjustment to
other inputs relating to the existence of a restriction that prevents the
transfer of the liability. The supplemental guidance is effective for
fiscal periods beginning with the first reporting period after
issuance. Accordingly, the Company will adopt this guidance in the
first quarter of fiscal 2010. The Company does not expect the
adoption of this guidance to materially impact its results of operations or
financial condition.
2. Restricted Cash:
Restricted cash
consists primarily of security deposits held under bank guarantees for three
rental properties.
3. Financial
Instruments:
Fair value is
defined as the exchange price that would be received for an asset or paid to
transfer a liability (an exit price) in the principal or most advantageous
market for the asset or liability in an orderly transaction between market
participants on the measurement date. Valuation techniques used to
measure fair value must maximize the use of observable inputs and minimize the
use of unobservable inputs. The fair value hierarchy is based on the
three levels of inputs and gives the highest priority to unadjusted quoted
prices in active markets for identical assets or liabilities (level 1
measurements) and lowest priority to unobservable inputs (level 3 measurements).
The three levels of the fair value hierarchy are described below:
Level 1 -
Observable inputs that reflect quoted prices (unadjusted) for identical assets
or liabilities in active markets.
Level 2 - Inputs
reflect quoted prices for identical assets or liabilities in markets that are
not active; quoted prices for similar assets or liabilities in active markets;
inputs other than quoted prices that are observable for the asset or the
liability; or inputs that are derived principally from or corroborated by
observable market data by correlation or other means.
Level 3 -
Unobservable inputs reflecting the Company’s own assumptions incorporated in
valuation techniques used to determine fair value. These assumptions
are required to be consistent with market participant assumptions that are
reasonably available.
The determination
of where an asset or liability falls in the hierarchy requires significant
judgment. The Company evaluates its hierarchy disclosures quarterly
and based on various factors, it is possible that an asset or liability may be
classified differently from quarter to quarter. However, the Company
expects changes in classifications between different levels to be
rare.
The Company
measures its cash equivalents and foreign currency forward contracts at fair
value. Cash equivalents and forward contracts are primarily classified within
Level 1 or Level 2 because they are valued primarily using quoted market prices,
alternative pricing sources or models utilizing market observable inputs as
provided to the Company by its brokers for foreign currency forward contracts.
The quotes used for valuing the forward contracts are non-binding on the broker
providing the quote. Assets and liabilities measured at fair value on a
recurring basis are as follows as of September 30, 2009:
|
Fair
Value Measurement at Reporting Date Using:
|
||||||||||||
|
Quoted
Prices
|
Significant
|
|||||||||||
|
in
Active
|
Other
|
|||||||||||
|
Markets
for
|
Observable
|
|||||||||||
|
Identical
Assets
|
Inputs
|
|||||||||||
|
(Level
1)
|
(Level
2)
|
Total
|
||||||||||
|
(In
thousands)
|
||||||||||||
|
Certificates
of deposit (1)
|
$ | 35 | $ | -- | $ | 35 | ||||||
|
Total
|
$ | 35 | -- | $ | 35 | |||||||
|
|
(1)
|
Included in
cash and cash equivalents on the Company’s Consolidated Balance
Sheets.
|
In
addition to financial instruments that the Company is required to recognize at
fair value on the Consolidated Balance Sheets, the Company has certain financial
instruments that are recognized at historical cost. The Company has
estimated the fair value of those financial instruments including cash and cash
equivalents, restricted cash, marketable securities, note payable to bank and
long-term debt. The fair value estimates are made at a discrete point
in time based on relevant market information and information about the financial
instruments. Fair value estimates are based on judgments regarding
current economic conditions, risk characteristics of various financial
instruments, and other factors. These estimates are subjective in
nature and involve uncertainties and matters of significant judgment and,
therefore, cannot be determined with precision. Changes in
assumptions could significantly affect the estimates. Accordingly, the estimates
are not necessarily indicative of what the Company could realize in a current
market exchange.
For those financial
instruments, the following table provides the value recognized on the
Consolidated Balance Sheets and the approximate fair value at September 30, 2009
and September 30, 2008.
|
September
30,
|
September
30,
|
|||||||||||||||
|
2009
|
2008
|
|||||||||||||||
|
Carrying
|
Fair
|
Carrying
|
Fair
|
|||||||||||||
|
Amount
|
Value
|
Amount
|
Value
|
|||||||||||||
|
(In
thousands)
|
||||||||||||||||
|
Cash and cash
equivalents, excluding certificates of
|
||||||||||||||||
|
deposits of
$35 and $63 in 2009 and 2008
|
$ | 44,617 | $ | 44,617 | $ | 11,561 | $ | 11,561 | ||||||||
|
Restricted
cash
|
25 | 25 | 817 | 817 | ||||||||||||
|
Marketable
securities
|
-- | -- | 380 | 380 | ||||||||||||
|
Note payable
to bank
|
15,000 | 15,000 | 3,215 | 3,215 | ||||||||||||
|
Long-term
debt
|
10,474 | 10,617 | 11,639 | 11,895 | ||||||||||||
The carrying value
of cash, cash equivalents and restricted cash approximates fair value due to the
nature of the cash, cash investments and restricted cash. The
carrying value of the marketable securities in fiscal 2008 approximates fair
value because the security was marked-to-market. The carrying value
of the note payable to the bank approximates fair value because the instrument
bears a negotiated variable interest rate. The fair value of the
long-term debt is based on the discounted value of expected cash flows using an
estimated discount rate of 3.25% and 5.0% at September 30, 2009 and September
30, 2008, which the Company could currently obtain for debt with similar
remaining maturities.
Marketable
securities consists of 1 million shares of common stock acquired in a sales
transaction. Unrealized gains or losses in the security are recorded
in Accumulated OCI, unless the Company determines that a decline in the fair
value of the security is other-than-temporary. If a decline in the
fair value of a security is determined to be other-than-temporary, then the cost
basis of the security must be written down to the current fair value and the
adjustment must be recorded as a component of earnings. Many factors go into the
determination of whether a decline in value of a given security represents a
temporary or other-than-temporary loss. In the fourth quarter of
fiscal 2008, the Company determined that the investment had incurred an
other-than-temporary impairment and wrote off $900,000. In the third quarter of
fiscal 2009, the issuer of the security filed a voluntary petition under Chapter
11 of the U.S Bankruptcy Code and was subject to delisting from the NASDAQ Stock
Market. As a result, the Company determined that the impairment of
the investment was other-than-temporary and wrote down the remaining balance of
$380,000 to zero, recording the loss in Other expense. The fair value
of the security as of September 30, 2008 was as follows (in
thousands):
|
Gross
|
Gross
|
|||||||||||||||
|
Unrealized
|
Unrealized
|
Estimated
|
||||||||||||||
|
Cost
|
Gain
|
Loss
|
Fair
Value
|
|||||||||||||
|
September 30,
2008
|
$ | 380 | $ | -- | $ | -- | $ | 380 | ||||||||
The Company did not
hold any other marketable securities as of September 30, 2009. There
is no contractual maturity date for the equity investment held by the
Company.
4. Derivative
Instruments and Hedging Activities:
The Company uses
derivative instruments to manage some of its exposures to foreign currency
risks. The objective for holding derivatives is to minimize these risks using
the most effective methods to eliminate or reduce the impact of these exposures.
The Company uses cash flow hedge accounting in accordance with authoritative
accounting guidance to account for hedges. At the inception of the hedge, the
hedging relationship to a forecasted transaction, the risk management objective
and the strategy for undertaking the hedge is documented. Quarterly, forward
rates are used to evaluate hedging effectiveness. For effective hedges,
unrealized gains and losses are included in Accumulated OCI. If the derivative
no longer meets hedge accounting criteria, or the terms of the hedged item
change so the derivative no longer qualifies for hedge accounting, the
derivative is marked-to-market. Any amounts in Accumulated OCI relating to a
derivative that no longer qualifies for hedge accounting are transferred out of
Accumulated OCI and reported in earnings during the period in which hedge
accounting no longer applies. At maturity or termination, the gain or loss on
the derivative is calculated and reported in earnings.
All derivatives are
recorded on the Consolidated Balance Sheets at fair value. If the derivative is
designated a fair value hedge, the changes in the fair value of the derivative
and of the hedged item attributable to the hedged risk are recognized in
earnings. If the derivative is designated as a cash flow hedge, the effective
portions of changes in the fair value of the derivative are recorded in
Accumulated OCI and are recognized in earnings when the cash flow hedge ceases.
Ineffective portions of changes in the fair value of cash flow hedges are
recognized in earnings.
Foreign exchange
contracts used to hedge forecasted international intercompany sales on credit
for up to 18 months in the future are designated as cash flow hedging
instruments. Derivative gains and losses included in Accumulated OCI are
reclassified to earnings when forecasted transactions become receivables. As of
September 30, 2009, the Company had no foreign exchange contracts designated as
cash flow hedges and therefore had no net derivative gains or losses being
reported as a separate component of Accumulated OCI.
The Company does
not employ hedges against foreign currency exposures of its net investment in
foreign subsidiaries. Results of operations may be impacted by
changing foreign exchange rates to the extent that exchange rates fluctuate from
period to period. Combined translation and transaction gains (losses)
of ($347,000), ($414,000), and $233,000 are included in Other income (expense)
in the Consolidated Statements of Operations.
When present, the
foreign exchange contracts are reported on the Company’s Consolidated Balance
Sheets in prepaid expenses and other current assets or in other accrued
liabilities. As of September 30, 2009, the Company had no foreign
exchange contracts.
During fiscal 2009,
the Company recognized the following gains (losses) related to foreign exchange
contracts (in thousands):
|
Year
Ended
|
||||
|
September
30, 2009
|
||||
|
Cash
Flow Hedges
|
||||
|
Effective
portion
|
||||
|
Gain (loss)
recognized in OCI
|
$ | (292 | ) | |
|
Gain (loss)
reclassified from Accumulated OCI into net sales
|
$ | 452 | ||
|
Ineffective
portion
|
||||
|
Gain (loss)
recognized in Other income (expense), net
|
$ | -- | ||
|
Fair
Value Hedges
|
||||
|
Gain (loss)
recognized in Other income (expense), net
|
$ | (213 | ) | |
5. Inventories:
Inventories at
September 30, 2009 and 2008 are summarized as follows (in
thousands):
|
2009
|
2008
|
|||||||
|
Parts and raw
materials
|
$ | 37,493 | $ | 44,762 | ||||
|
Work-in-process
|
14,332 | 27,100 | ||||||
|
Finished
goods
|
13,985 | 16,911 | ||||||
| $ | 65,810 | $ | 88,773 | |||||
6. Property, Plant and
Equipment:
Property,
plant and equipment at September 30, 2009 and 2008 are summarized as
follows (in thousands):
|
2009
|
2008
|
|||||||
|
Buildings and
improvements
|
$ | 33,755 | $ | 32,463 | ||||
|
Machinery and
equipment
|
52,981 | 48,712 | ||||||
|
Furniture,
fixtures and leasehold improvements
|
10,498 | 11,682 | ||||||
|
Vehicles and
aircraft
|
7,606 | 10,035 | ||||||
| 104,840 | 102,892 | |||||||
|
Less
accumulated depreciation and amortization
|
(69,291 | ) | (60,430 | ) | ||||
| 35,549 | 42,462 | |||||||
|
Land and land
improvements
|
7,706 | 7,447 | ||||||
| $ | 43,255 | $ | 49,909 | |||||
Depreciation
expense was $10.5 million, $10.3 million and $9.8 million for fiscal 2009, 2008
and 2007, respectively.
The Company sold an
aircraft during the third quarter of fiscal 2009 for approximately $1.5 million
and recognized a gain on the sale of approximately $253,000. The Company also
sold a storage facility located near Kalispell, Montana during the third quarter
of fiscal 2009 for approximately $200,000 and recognized a gain on the sale of
approximately $152,000.
7. Intangible
Assets:
Amortization
expense for intangible assets was $1.1 million, $1.1 million and $936,000 for
fiscal 2009, 2008 and 2007, respectively. Based primarily on patent
rights granted and recorded at September 30, 2009, and assuming no subsequent
impairment of the underlying assets, the annual estimated amortization expense
is expected to be as follows (in thousands):
|
Year
Ending
|
||||
|
September 30,
|
Total
|
|||
|
2010
|
$931 | |||
|
2011
|
710 | |||
|
2012
|
476 | |||
|
2013
|
369 | |||
|
2014
|
254 | |||
|
Thereafter
|
109 | |||
Accumulated
amortization was $5.4 million and $4.3 million at September 30, 2009 and 2008,
respectively.
As
part of a routine review of its patent portfolio, the Company abandoned patents
and patent applications valued at historical cost of $338,000, $311,000 and
$366,000 in fiscal 2009, 2008 and 2007, respectively. Patent
abandonments are reported as part of Research and Development
expense.
8. Line of Credit:
The Company has a
$30 million Credit Agreement, renewable annually, with Wells Fargo Trade Bank
(Trade Bank) with an expiration date of March 1, 2010. Borrowings are
collateralized by certain assets of the Company and bear interest at the bank’s
prime lending rate, 3.25% as of September 30, 2009, or at the Company’s option,
LIBOR plus 2.25%, or 2.54% as of that date. The agreement requires monthly
interest payments only, until March 1, 2010, when the then outstanding principal
balance is due and payable in full. The agreement provides for a non-refundable
annual commitment fee equal to 0.10% of the credit limit, commencing March 1,
2008. Additionally, the agreement contains various restrictive financial and
non-financial covenants. The financial covenants include measurements of
tangible net worth, total liabilities divided by tangible net worth and a
maximum borrowing limit based on a Funded Debt to Earnings before Interest,
Taxes, Depreciation and Amortization (EBITDA) ratio and a maximum borrowing
limit based upon total accounts receivable. At September 30, 2009, there was
$15.0 million in advances outstanding under the agreement, which is reported as
a current liability.
The Company has
been in discussions with the Trade Bank regarding its compliance with the Funded
Debt to EBITDA covenant. There exists an ambiguity in interpretation which
is unresolved, but which if interpreted as noncompliance with the covenant,
would allow the Trade Bank to notify the Company that the non-compliance
constitutes an event of default under the facility that (i) prevents further
borrowings and (ii) gives them the right to accelerate the payment of all
amounts outstanding under the loan. The bank has not provided the Company
with any notice of default (which is also subject to a right of cure within
twenty calendar days of the notice). In view of this ambiguity in
interpretation, the Company does not anticipate being able to request further
advances under the Credit Agreement until this matter is resolved. If
interpreted in favor of the Trade Bank, there would be a Funded Debt to EBIDTA
ratio requirement of not more than 2:1 as of September 30, 2009 (EBITDA for the
trailing twelve-month period ending September 30, 2009 was a negative
number). The Company continues to discuss credit facility requirements
with the Trade Bank with a view toward arranging a facility that resolves any
issues regarding borrowing limits and outstanding advances.
9. Long-Term Debt:
Long-term debt at
September 30, 2009 and September 30, 2008 is summarized as follows (in
thousands):
|
2009
|
2008
|
|||||||
|
Mortgage term
note payable in monthly installments of
|
||||||||
|
$23,
including interest at a blended rate of 5.5%, maturing on
|
||||||||
|
September
1, 2014. (A)
|
$ | 1,120 | $ | 1,328 | ||||
|
Mortgage term
note payable in monthly installments of $49,
|
||||||||
|
including
interest at a blended rate of 3.81% up to January 2012
|
||||||||
|
when
it will change to $53, including interest at a blended rate
of
|
||||||||
|
6.81%,
maturing on January 1, 2017. (B)
|
3,765 | 4,206 | ||||||
|
Mortgage term
note payable to the Pennsylvania Industrial
|
||||||||
|
Development
Authority (PIDA) in monthly installments of $6,
|
||||||||
|
including
interest at 4.25%, maturing on December 1, 2008. (C)
|
-- | 12 | ||||||
|
Mortgage term
note payable to Sovereign Bank in monthly
|
||||||||
|
installments
of $15, including interest at 4.5%, maturing
|
||||||||
|
August
15, 2021. (D)
|
1,602 | 1,705 | ||||||
|
Mortgage term
note payable to the Raiffeisenbank Hallein
|
||||||||
|
in
monthly installments of EUR 25, including interest at
3.5%,
|
||||||||
|
maturing
on March 5, 2016. (E)
|
2,517 | 2,748 | ||||||
|
Mortgage term
note payable to the Raiffeisenbank Hallein
|
||||||||
|
in
quarterly installments of EUR 14 plus interest at 5.75%,
|
||||||||
|
maturing
July 5, 2016. (F)
|
1,470 | 1,640 | ||||||
| 10,474 | 11,639 | |||||||
|
Less current
portion
|
1,214 | 1,222 | ||||||
|
|
$ | 9,260 | $ | 10,417 | ||||
|
|
(A)
|
The mortgage
term note payable is collateralized by a first lien deed of trust on the
Kalispell office and manufacturing facility and by all fixtures and
personal property of the Company necessary for the operation of the
facility. The Montana State Board of Investments provided 80%
of the financing with Bank of America providing the remaining
20%. The notes are personally guaranteed by Raymon F. Thompson,
the Company’s Chairman and Chief Executive
Officer.
|
|
|
(B)
|
The mortgage
term note payable is collateralized by a first lien deed of trust on the
manufacturing facility located at Birch Grove Road in Kalispell, Montana
and by all fixtures and personal property of the Company necessary for the
operation of the facility. The Montana State Board of
Investments provided 75% of the financing with First Interstate Bank
providing the remaining 25%.
|
|
|
(C)
|
The mortgage
term note payable to PIDA was collateralized by a first lien upon the
premises in Coopersburg, Pennsylvania upon which the Rhetech, Inc. office
and manufacturing facility resides. The net book value of
assets pledged under the agreement was $4.4 million at September 30,
2008.
|
|
|
(D)
|
The mortgage
term note payable to Sovereign Bank for the expansion of the Rhetech, Inc.
manufacturing facility is collateralized by a second lien upon the
premises in Coopersburg, Pennsylvania by Lehigh County Industrial
Development Authority and guaranteed by Semitool,
Inc.
|
|
|
(E)
|
The mortgage
term note payable to Raiffeisenbank Hallein is collateralized by a lien on
the Salzburg, Austria premises.
|
|
|
(F)
|
The mortgage
term note payable to Raiffeisenbank Hallein is collateralized by a second
lien on the Salzburg, Austria premises. The loan agreement
provides the option of converting the loan to a foreign
currency. For loans converted to U.S. dollars, the interest
rate is LIBOR, rounded to the nearest 1/8% + 0.875%. In
September 2008, the Company converted the loan to U.S. dollars at an
interest rate of 3.625% and is currently making payments of $50,000 per
quarter with the intent of settling the loan in
2018.
|
Principal
maturities for long-term debt at September 30, 2009, are summarized as
follows (in thousands):
|
Year
Ending
|
Notes
|
|||
|
September 30,
|
Payable
|
|||
|
2010
|
$ 1,214 | |||
|
2011
|
1,261 | |||
|
2012
|
1,289 | |||
|
2013
|
1,342 | |||
|
2014
|
1,307 | |||
|
Thereafter
|
4,061 | |||
| $10,474 | ||||
10. Accumulated Other Comprehensive
Income (Loss):
The Company’s
accumulated other comprehensive income (loss) consists of unrealized losses on
cash flow hedges and foreign currency translation adjustments resulting from
translating both Semitool Japan’s financial statements from the Japanese Yen and
Semitool Austria’s financial statements from the Euro, to the U.S.
dollar.
Accumulated other
comprehensive income (loss) at September 30, 2009 and 2008 consisted of the
following components (in thousands):
|
2009
|
2008
|
|||||||
|
Unrealized
loss on derivative instruments qualifying as cash flow
hedges
|
$ | -- | $ | (160 | ) | |||
|
Cumulative
translation adjustments
|
905 | (272 | ) | |||||
| $ | 905 | $ | (432 | ) | ||||
11. Employee Benefit and Stock-Based
Compensation Plans:
Semitool maintains
a profit-sharing plan and trust under Section 401(k) of the Internal Revenue
Code. Under the terms of the plan, U.S. employees may make voluntary
contributions to the plan. Semitool contributes a matching amount
equal to 50% of the employee’s voluntary contribution for up to 5% of the
employee’s compensation. Semitool may also make non-matching
contributions to the plan. As of January 1, 2009, the company
temporarily suspended the matching portion of the 401K plan as part of its
downsizing efforts (See Note 12). Total contribution cost for this
plan was approximately $1.1 million for both fiscal years ended September 30,
2008 and 2007.
Semitool Europe
Ltd. maintains a defined contribution pension agreement. This pension
agreement is open to all employees with more than three months of
service. The employer and employee contributions are invested in each
individual member’s personal pension plan. The employer has an
obligation to make contributions at one-half of the contribution rate paid by
the employee, subject to a rate between 2.5% and 5.0% of the employee’s
salary. The total pension cost for this plan for the years ended
September 30, 2009, 2008 and 2007 approximated $33,000, $36,000 and $40,000,
respectively.
The Company’s other
foreign subsidiaries do not operate their own pension plans, but retirement
benefits are generally provided to employees through government plans operated
in their respective countries.
In
February 2004, the Board of Directors adopted and the shareholders approved the
2004 Stock Option Plan (the 2004 Plan), replacing the expiring 1994 Stock Option
Plan. Upon approval of the 2007 Stock Incentive Plan (the 2007 Plan)
in March 2007, the 2007 Plan immediately replaced the 2004
Plan. Options that were granted under the 2004 Plan generally become
exercisable at a rate of 5% per quarter commencing three months after the grant
date and have a requisite service period of five years. The Company
has granted options that qualify as incentive stock options to employees
(including officers and employee directors) and nonqualified stock options to
employees, directors and consultants. The options generally have a
ten-year term, unless earlier terminated by the discontinuation of service by
the grantee. Option exercises are settled with newly issued common
shares.
The total shares
reserved for issuance under the 2007 Plan are 3,207,730 at September 30, 2009,
which includes an initial 1,000,000 shares plus all shares that remained
available for grants of options under the 2004 Plan as of the date the 2007 Plan
was approved plus any shares that would otherwise return to the 2004 Plan as a
result of forfeiture of options previously granted under the 2004
Plan. The 2007 Plan provides for the grant of various awards
including stock options, stock appreciation rights and restricted stock
awards. As of September 30, 2009, only stock options and restricted
stock awards have been awarded under the 2007 Plan. The Company may
grant options that qualify as incentive stock options only to
employees. Awards other than incentive stock options may be granted
to employees, directors and consultants. Restricted stock awards
granted under the 2007 Plan generally vest at a rate of 20% per year with 20%
vesting immediately upon issuance and have a requisite service period of four
years. Stock options granted under the 2007 Plan generally have a
ten-year term, unless earlier terminated by the discontinuation of service by
the grantee. Stock option exercises and restricted stock are settled
with newly issued common shares.
Stock-based
compensation expense recognized during the fiscal years ending September 30,
2009, 2008 and 2007 was $1.1 million, $1.8 million and $1.1 million,
respectively.
Stock
Options
The fair value of
each stock option grant is estimated on the date of grant using the
Black-Scholes option pricing model. Expected volatilities are based on a blended
rate of historical and implied volatilities from the traded options on the
Company’s stock. The expected term of stock options granted is based
on analyses of historical employee termination rates, option exercises and other
factors. The risk-free rates are based on the U.S. Treasury yield in
effect at the time of the grant. The assumptions used in the
Black-Scholes model for fiscal 2008 and 2007are presented
below. There were no stock options granted in fiscal
2009.
|
2008
|
2007
|
||||||
|
Expected
stock price volatility
|
51.6
|
%
|
51.6
|
%
|
|||
|
Risk-free
interest rate
|
4.4
|
%
|
4.6
|
%
|
|||
|
Dividend
yield
|
0.0
|
%
|
0.0
|
%
|
|||
|
Expected life
of options (in years)
|
5.1
|
5.1
|
The weighted
average grant date fair values based on the Black-Scholes option pricing model
for stock options granted in fiscal 2008 and 2007 were $4.77 and $5.58 per
share, respectively.
The following
summary shows stock option activity for the three years ended September 30,
2009:
|
2009
|
2008
|
2007
|
||||||||||||||||||||||
|
Weighted
|
Weighted
|
Weighted
|
||||||||||||||||||||||
|
Average
|
Average
|
Average
|
||||||||||||||||||||||
|
Exercise
|
Exercise
|
Exercise
|
||||||||||||||||||||||
|
Stock
Option Activity
|
Shares
|
Price
|
Shares
|
Price
|
Shares
|
Price
|
||||||||||||||||||
|
Outstanding,
beginning of year
|
1,401,856 | $ | 8.11 | 1,779,750 | $ | 7.69 | 1,922,426 | $ | 7.53 | |||||||||||||||
|
Granted
|
-- | -- | 5,000 | $ | 9.49 | 62,000 | $ | 11.05 | ||||||||||||||||
|
Exercised
|
(2,750 | ) | $ | 6.62 | (354,719 | ) | $ | 5.81 | (169,676 | ) | $ | 6.94 | ||||||||||||
|
Forfeited
|
(106,325 | ) | $ | 7.85 | (28,175 | ) | $ | 10.63 | (35,000 | ) | $ | 8.65 | ||||||||||||
|
Outstanding,
end of year
|
1,292,781 | $ | 8.14 | 1,401,856 | $ | 8.11 | 1,779,750 | $ | 7.69 | |||||||||||||||
|
Exercisable,
end of year
|
1,173,996 | $ | 8.07 | 1,102,081 | $ | 7.99 | 1,246,956 | $ | 7.52 | |||||||||||||||
As
of September 30, 2009, $437,000 of total unrecognized compensation cost related
to non-vested stock options is expected to be recognized over a weighted average
period of 0.9 years. The weighted average remaining contractual term
for options outstanding and exercisable at September 30, 2009 was 4.2 years and
4.0 years, respectively. The aggregate intrinsic value for options
outstanding and exercisable at September 30, 2009 was $1.3 million and $1.3
million, respectively. The total intrinsic value of stock options
exercised during fiscal 2009, 2008 and 2007 was $4,000, $968,000 and $900,000,
respectively.
The Company granted
a total of 5,000 stock options during fiscal 2008 with exercise prices equal to
the market price of the stock on the grant date. The weighted-average
exercise price and weighted-average fair market value of these awards were $9.49
and $4.77, respectively.
The Company granted
a total of 62,000 stock options during fiscal 2007 with exercise prices equal to
the market price of the stock on the grant date. The weighted-average
exercise price and weighted-average fair market value of these awards were
$11.05 and $5.58, respectively.
The following table
summarizes information about stock options outstanding at September 30,
2009:
|
Options
Outstanding
|
Options
Exercisable
|
|||||||||||||||||||||
|
Weighted
|
Weighted
|
|||||||||||||||||||||
|
Average
|
Weighted
Average
|
Average
|
||||||||||||||||||||
|
Number
|
Exercise
|
Remaining
|
Number
|
Exercise
|
||||||||||||||||||
|
Range
of Exercise Prices
|
of
Shares
|
Price
|
Contractual
Life
|
of
Shares
|
Price
|
|||||||||||||||||
|
(In
years)
|
||||||||||||||||||||||
| $ 3.98 - $ 4.84 | 191,091 | $ | 4.27 | 3.7 | 191,091 | $ | 4.27 | |||||||||||||||
| $ 6.95 - $ 10.27 | 913,565 | $ | 8.17 | 4.3 | 802,980 | $ | 8.13 | |||||||||||||||
| $ 10.55 - $ 14.19 | 169,625 | $ | 11.27 | 4.8 | 161,425 | $ | 11.19 | |||||||||||||||
| $ 15.88 - $ 19.25 | 18,500 | $ | 17.76 | 0.4 | 18,500 | $ | 17.76 | |||||||||||||||
| 1,292,781 | $ | 8.14 | 4.2 | 1,173,996 | $ | 8.07 | ||||||||||||||||
The exercise and
sale of certain qualified options resulted in the treatment of those options as
nonqualified options for tax purposes. As a result, the Company
received tax benefits associated with those options of $235,000, $247,000 in
fiscal 2008 and 2007, respectively, which were recorded as additional
capital. The Company recorded no benefits in fiscal
2009.
Restricted Stock
Awards
The following
summary shows restricted stock activity for the three years ended September 30,
2009:
|
2009
|
2008
|
2007
|
||||||||||||||||||||||
|
Weighted
|
Weighted
|
Weighted
|
||||||||||||||||||||||
|
Average
|
Average
|
Average
|
||||||||||||||||||||||
|
Grant
Date
|
Grant
Date
|
Grant
Date
|
||||||||||||||||||||||
|
Restricted
Stock Activity
|
Shares
|
Fair
Value
|
Shares
|
Fair
Value
|
Shares
|
Fair
Value
|
||||||||||||||||||
|
Nonvested,
beginning of year
|
204,690 | $ | 9.02 | 12,250 | $ | 9.64 | -- | $ | -- | |||||||||||||||
|
Granted
|
14,500 | $ | 4.23 | 271,700 | $ | 9.01 | 13,000 | $ | 9.68 | |||||||||||||||
|
Vested
|
(55,660 | ) | $ | 8.65 | (61,420 | ) | $ | 9.01 | (750 | ) | $ | 10.04 | ||||||||||||
|
Forfeited
|
(14,590 | ) | $ | 9.12 | (17,840 | ) | $ | 9.33 | -- | $ | -- | |||||||||||||
|
Nonvested,
end of year
|
148,940 | $ | 8.69 | 204,690 | $ | 9.02 | 12,250 | $ | 9.64 | |||||||||||||||
The fair value of
the restricted stock was calculated based upon the fair market value of the
Company’s stock at the date of the grant. As of September 30, 2009,
$857,000 of total unrecognized compensation cost related to restricted stock
awards is expected to be recognized over a weighted average period of 1.3
years.
12. Downsizing
Costs:
In
November 2008 and January 2009, the Company announced and implemented plans to
align its cost structure with forecasted business activity levels. On a combined
basis, the cost reduction plans consisted primarily of a 35% reduction in the
Company’s worldwide work force, salaried staff pay cuts, reduced working hours
and overtime, mandatory leave, temporary suspension of company-paid 401(k) plan
matching and a three-week facilities shutdown in December 2008. One-time
involuntary termination costs of $2.6 million were reported as a separate
component of operating expenses in fiscal 2009. All costs related to the
downsizing plan have been incurred and paid.
|
Year
Ended
|
||||
|
September
30, 2009
|
||||
|
Liability for
one-time involuntary termination costs, beginning of
period
|
$ | -- | ||
|
One-time
involuntary termination costs incurred during the period
|
2,566 | |||
|
One-time
involuntary termination costs paid during the period
|
2,566 | |||
|
Liability for
one-time involuntary termination costs, end of period
|
$ | -- | ||
13. Income
Taxes:
The provision
(benefit) for income taxes for the years ended September 30, 2009, 2008 and 2007
consists of the following (in thousands):
|
2009
|
2008
|
2007
|
||||||||||
|
Federal:
|
||||||||||||
|
Current
|
$ | (1,326 | ) | $ | 1,901 | $ | (1,083 | ) | ||||
|
Deferred
|
(7,055 | ) | (256 | ) | (1,689 | ) | ||||||
|
State:
|
||||||||||||
|
Current
|
142 | 225 | 638 | |||||||||
|
Deferred
|
(816 | ) | (145 | ) | (702 | ) | ||||||
|
Foreign:
|
||||||||||||
|
Current
|
331 | 1,507 | 873 | |||||||||
|
Deferred
|
163 | (286 | ) | 71 | ||||||||
| $ | (8,561 | ) | $ | 2,946 | $ | (1,892 | ) | |||||
Domestic and
foreign components of income (loss) before income taxes for the years ended
September 30, 2009, 2008 and 2007 are as follows (in thousands):
|
2009
|
2008
|
2007
|
||||||||||
|
Domestic
|
$ | (21,226 | ) | $ | 7,592 | $ | (1,681 | ) | ||||
|
Foreign
|
1,237 | 1,391 | 5,020 | |||||||||
| $ | (19,989 | ) | $ | 8,983 | $ | 3,339 | ||||||
The components of
the deferred tax assets and liabilities as of September 30, 2009 and 2008 are as
follows (in thousands):
|
2009
|
2008
|
|||||||
|
Deferred tax
assets:
|
||||||||
|
Accrued
warranty
|
$ | 1,473 | $ | 2,755 | ||||
|
Net
operating loss (NOL) carryforwards
|
7,705 | 280 | ||||||
|
Tax
credit carryforwards
|
6,107 | 2,748 | ||||||
|
Deferred
profit
|
1,360 | 3,166 | ||||||
|
Other
accrued liabilities
|
1,223 | 1,817 | ||||||
|
Inventories
|
2,331 | 2,323 | ||||||
|
Equity
compensation
|
583 | 587 | ||||||
|
Asset
impairment
|
342 | 342 | ||||||
|
Other
|
209 | 157 | ||||||
|
Deferred tax
assets
|
21,333 | 14,175 | ||||||
|
Deferred tax
liabilities:
|
||||||||
|
Depreciation
and amortization
|
(2,188 | ) | (3,023 | ) | ||||
|
Other
|
(285 | ) | -- | |||||
|
Deferred tax
liabilities
|
(2,473 | ) | (3,023 | ) | ||||
|
Net deferred
tax asset
|
$ | 18,860 | $ | 11,152 | ||||
Semitool has incurred a federal net
operating loss of approximately $19.5 million which can be carried back 2 years or forward 20
years. On November 6, 2009, the Worker, Homeownership, and Business Assistance
Act of 2009 was signed into law and includes provisions for the potential
carryback of NOL’s of up to 5 years. The Company has not yet determined the
benefits of this potential increased carryback period. Semitool has net
operating loss carryforwards totaling approximately $24 million in various
states. The Company estimates the tax effect of these state net
operating losses to be approximately $825,000. The losses expire in
fiscal years 2010 through 2029. Semitool has a Federal Research Credit
carryforward of approximately $3.5 million which will begin to expire in fiscal
year 2025. Semitool has a Research Credit carryforward in the State
of Montana of approximately $1.1 million, which will begin to expire in fiscal
year 2025. The Company also has an Alternative Minimum Tax credit
carryforward of approximately $1.1 million that does not expire and a Foreign
Tax Credit carryforward of approximately $236,000 which will expire by fiscal
year 2019.
On
November 16, 2009, we entered in a definitive agreement to be acquired by
Applied Materials, Inc., a Delaware corporation (see additional information in
Note 20). With the completion of the pending tender offer there may be certain
limitations to the utilization of the NOL’s and credit carryforwards available
to Applied Materials. The magnitude of these limitations, if any, have not yet
been determined by the company.
Cumulative
undistributed earnings of foreign subsidiaries, for which no U.S. income or
foreign withholding taxes have been recorded, were approximately $21.3 million
at September 30, 2009. Such earnings are expected to be reinvested
indefinitely. Determination of the amount of unrecognized deferred
tax liability with respect to such earnings is not practicable. The
additional taxes payable on the earnings of foreign subsidiaries, if remitted,
would be substantially offset by U.S. tax credits for foreign taxes already
paid.
Semitool has
concluded that based on its history of taxable income and sources of future
income, that it is more likely than not that all of the deferred tax assets will
be realized and that no valuation allowance is necessary.
The differences
between the consolidated provision (benefit) for income taxes and income taxes
computed using income before income taxes and the U.S. federal income tax rate
for the years ended September 30, 2009, 2008 and 2007 are as follows (in
thousands):
|
2009
|
2008
|
2007
|
||||||||||
|
Amount
computed using the statutory rate
|
$ | (6,996 | ) | $ | 3,144 | $ | 1,169 | |||||
|
Increase
(decrease) in taxes resulting from:
|
||||||||||||
|
State
taxes, net of federal benefit
|
(226 | ) | (10 | ) | (173 | ) | ||||||
|
Effect
of foreign taxes/foreign exchange
|
(470 | ) | 309 | (1,003 | ) | |||||||
|
Research
and experimentation credit
|
(1,544 | ) | (386 | ) | (2,388 | ) | ||||||
|
Meals
and entertainment and other permanent items
|
680 | 686 | 777 | |||||||||
|
Extraterritorial
income exclusion
|
-- | -- | (520 | ) | ||||||||
|
Incentive
stock options
|
386 | 272 | 222 | |||||||||
|
Domestic
production deduction
|
-- | (262 | ) | -- | ||||||||
|
Subpart
F income net of related foreign tax credit
|
(215 | ) | (103 | ) | 20 | |||||||
|
Other,
net
|
(176 | ) | (704 | ) | 4 | |||||||
| $ | (8,561 | ) | $ | 2,946 | $ | (1,892 | ) | |||||
The Federal
Research Credit (R&E Credit) expired on December 31,
2007. Because legislation extending the R&E Credit was signed
into law after September 30, 2008, only one quarter of the full year R&E
Credit was realized in fiscal year 2008. In fiscal 2009, the R&E
Credit for the remaining three quarters from fiscal year 2008 was recognized in
addition to the full year R&E Credit for fiscal year 2009.
Effective October
1, 2007, the Company recognizes and measures its uncertain income tax positions
following the two-step approach defined in authoritative accounting
literature. The first step is to evaluate the tax position for
recognition by determining if the weight of available evidence indicates that it
is more likely than not that the position will be sustained on audit, including
resolution of related appeals or litigation processes, if any. The
second step is to measure the tax benefit as the largest amount that is more
than 50% likely of being realized upon ultimate settlement.
As
a result of the implementation of its accounting for uncertain income tax
positions, the Company increased its estimate of net unrecognized tax benefits
and accounted for the increase as a cumulative effect of a change in accounting
principle that resulted in a $671,000 decrease to beginning retained
earnings. Total unrecognized tax benefits at October 1, 2007, if
recognized, would impact the Company’s tax rate. The Company
anticipates that the amount of unrecognized tax benefits could change in the
next twelve months but does not expect those changes to have a significant
impact on the results of operations or the financial position of the
Company.
A
reconciliation of the beginning and ending amount of unrecognized tax benefits
is as follows:
|
Year
Ended September 30,
|
||||||||
|
2009
|
2008
|
|||||||
|
(In
thousands)
|
||||||||
|
Unrecognized
tax benefits balance at the beginning of the fiscal year
|
$ | 2,223 | $ | 2,421 | ||||
|
Prior year
additions
|
265 | 25 | ||||||
|
Current year
additions
|
201 | 197 | ||||||
|
Prior year
reductions
|
(464 | ) | (179 | ) | ||||
|
Reductions
due to lapse of statue of limitations
|
(163 | ) | (241 | ) | ||||
|
Unrecognized
tax benefits balance at the end of the fiscal year
|
$ | 2,062 | $ | 2,223 | ||||
As
of September 30, 2009, the Company is potentially subject to U.S. federal income
tax examinations for the fiscal tax years 2005 through 2008 and to non-U.S.
income tax examinations for fiscal tax years 2003 through 2008. In
addition, the Company is potentially subject to state income tax examinations
for fiscal tax years 2005 through 2008. Although they have not been
assessed, the Company includes potential interest and penalties related to
unrecognized tax benefits within its provision for taxes. The accrued potential
interest and penalties related to unrecognized tax benefits was approximately
$24,000 as of September 30, 2009. The above amount would have an
effect on the effective tax rate if recognized.
As
of September 30, 2008, the Company was potentially subject to U.S. federal
income tax examinations for the fiscal tax years 2005 through 2007 and to
non-U.S. income tax examinations for fiscal tax years 2002 through
2007. In addition, the Company was potentially subject to state
income tax examinations for fiscal tax years 2004 through 2007. We
included potential interest and penalties related to unrecognized tax benefits
within our provision for taxes, although they have not been
assessed. As of the date of implementation, the Company had $283,000
of accrued potential interest and penalties related to unrecognized tax
benefits. The accrued potential interest and penalties related to
unrecognized tax benefits decreased approximately $170,000 in the year ended
September 30, 2008.
14. Related Party
Transactions:
Semitool has
agreements with limited liability companies wholly-owned by Mr. Raymon F.
Thompson, the Company’s chairman and chief executive officer, to lease aircraft
and an aircraft hangar. Under these agreements, rent expense was
approximately $1.9 million for the year ended September 30, 2009, $2.4 million
for the year ended September 30, 2008 and $2.8 million for the year ended
September 30, 2007. The rental rate for
fiscal 2010 is currently $34,100 per month for both the aircraft and the hangar;
the lease terms are month-to-month. The lease amounts were reduced in
response to market conditions affecting the Company’s need for the
aircraft. The amended rates are below-market for the aircraft leased and,
consequently, are on terms more favorable to the Company than could have been
obtained from an unaffiliated party. Because the term of the leases are
month-to-month, it is not expected that the Company will be able to be continue
leasing the aircraft at those below-market rates as economic conditions
improve.
15. Commitments and
Contingencies:
The Company, in its
Articles of Incorporation, has indemnified its officers and the members of its
Board of Directors to the extent permitted by law against any and all
liabilities, costs, expenses, amounts paid in settlement and damages incurred in
such capacity as a result of any lawsuit, or any judicial, administrative or
investigative proceeding in which the officers or directors are
named.
The Company has
entered into agreements with customers that include limited intellectual
property indemnification obligations that are customary in the
industry. These guarantees generally require the Company to
compensate the other party for certain damages and costs incurred as a result of
third party intellectual property claims arising from these
transactions. The nature of the intellectual property indemnification
obligations prevents the Company from making a reasonable estimate of the
maximum potential amount it could be required to pay to its
customers. The Company has not made any indemnification payments
under such agreements and no amount has been accrued in the accompanying
condensed consolidated financial statements with respect to these
indemnification obligations.
Product
Warranties
Obligations for
warranties are accrued concurrently with the revenue recognized on the related
equipment. Provisions for warranty obligations are made based upon
historical costs incurred for such obligations adjusted, as necessary, for
current conditions and factors. Due to the significant uncertainties
and judgments involved in estimating warranty obligations, including changing
product designs and specifications, the ultimate amount incurred for warranty
costs could change in the near term from the Company’s current
estimate.
Changes in the
Company’s accrued warranty liability for fiscal 2009, 2008 and 2007, were as
follows (in thousands):
|
Year
Ended September 30,
|
||||||||||||
|
2009
|
2008
|
2007
|
||||||||||
|
Accrued
warranty balance, beginning of year
|
$ | 9,786 | $ | 7,781 | $ | 7,368 | ||||||
|
Accruals for
new warranties issued during the year
|
6,716 | 11,298 | 9,238 | |||||||||
|
Expirations
and changes in estimates to pre-existing warranties
|
(3,406 | ) | 285 | 2,876 | ||||||||
|
Warranty
labor and materials provided during the year
|
(6,135 | ) | (9,578 | ) | (11,701 | ) | ||||||
|
Accrued
warranty balance, end of year
|
$ | 6,961 | $ | 9,786 | $ | 7,781 | ||||||
Operating
Leases
The Company has
various non-cancelable operating lease agreements for equipment and office space
that expire through the year 2014. Total rent expense for the years
ended September 30, 2009, 2008 and 2007, exclusive of amounts paid to a related
party as described in Note 14, was approximately $2.0 million, $1.9 million and
$1.9 million, respectively. The following table summarizes future
minimum lease payments under all non-cancelable operating leases with initial or
remaining terms in excess of one year as of September 30, 2009 (in
thousands):
|
Year
Ending
|
||||
|
September 30,
|
Total
|
|||
|
2010
|
$1,150 | |||
|
2011
|
497 | |||
|
2012
|
142 | |||
|
2013
|
61 | |||
|
2014
|
4 | |||
|
Thereafter
|
-- | |||
| $1,854 | ||||
Litigation
On or about
November 19, 2009, November 30, 2009 and December 4, 2009, three purported class
action lawsuits related to the tender offer and the merger, captioned Stationary
Engineers Local 39 Pension Trust Fund vs. Semitool, Inc., et al. (Cause No.
DV-09-1461(B)), Stern vs. Thompson, et al. (Cause No. DV-09-1513(C)), and Marvel
v. Thompson, et al., respectively, were filed in the Montana Eleventh Judicial
District Court, County of Flathead, against Semitool, each of Semitool’s
directors, Applied Materials and Jupiter Acquisition Sub, Inc. (the plaintiff in
the Stationary Engineers Local action then filed an amended complaint on or
about November 25, 2009). Motions for expedited proceedings were
filed by the plaintiffs in the first and second actions, respectively, on
November 23, 2009 and December 1, 2009, in each case requesting, among other
things, that the Court expedite discovery and schedule a hearing on such
plaintiff’s proposed motion for a preliminary injunction no later than December
17, 2009, the currently scheduled Expiration Date of the tender
offer. A hearing on the motion for expedited proceedings in the
Stationary Engineers Local action took place on December 9, 2009 and, on
December 10, 2009, the court issued an order denying the plaintiff’s motion for
expedited discovery and issued another order scheduling a hearing on December
15, 2009 in respect of plaintiff’s motion for a preliminary
injunction.
The actions, each brought by a purported shareholder of Semitool, seek certification of a class of all holders of Semitool common stock (except the defendants and their affiliates) and allege, among other things, that Semitool’s directors breached their fiduciary duties by (i) failing to maximize shareholder value; (ii) securing benefits for certain defendants at the expense or to the detriment of Semitool’s public shareholders; (iii) discouraging and/or inhibiting alternative offers to purchase control of Semitool or its assets; and (iv) failing to disclose material non-public information, and that Applied Materials aided and abetted such alleged breaches. The actions seek, among other things, injunctive relief enjoining the defendants from consummating the tender offer and the merger and damages, as well as recovery of the costs of the action, including reasonable attorneys’ and experts’ fees. Semitool believes the claims alleged against it in the actions to be without merit and intends to defend against them vigorously. In addition, Applied Materials has informed the Company that it also believes the allegations against it in the actions to be without merit, and that it intends to defend against the claims vigorously.
The Company is involved in other legal proceedings that arise in the ordinary course of its business, including employment related litigation. Although there can be no assurance as to the ultimate disposition of these matters, it is the opinion of management, based upon the information available at this time, that the currently expected outcome of these matters, individually or in the aggregate, will not have a material adverse effect on its business, financial condition, results of operations or cash flows.
Periodically, but
not less than quarterly, the Company reviews the status of each significant
matter and assesses its potential financial exposure. If the
potential loss from any legal proceeding or claim is considered probable and the
amount can be reasonably estimated, the Company accrues a liability for the
estimated loss. Significant judgment is required in both the
determination of probability and the determination as to whether an exposure is
reasonably estimable. Due to the uncertainties related to these
matters, accruals are based on the best information available at the
time. As additional information becomes available, the Company
reassesses the potential liability related to its pending litigation and claims
and may revise its estimates. Although the Company has not made such
revisions, any future revisions could have a material impact on its results of
operations and financial condition.
16. Shareholders’
Equity:
The Board of
Directors has the authority to issue preferred stock of Semitool in one or more
series and to fix the rights, privileges, preferences and restrictions granted
to or imposed upon any unissued shares of preferred stock, without further vote
or action by the common shareholders. At September 30, 2009 and 2008,
no preferred shares were outstanding.
17. Certain
Concentrations:
At
September 30, 2009 and 2008, trade receivables of the Company were from
companies in the semiconductor industry, and included approximately $40.1
million and $60.6 million, respectively, of foreign
receivables. Accordingly, the Company is exposed to concentrations of
credit risk. The Company routinely assesses the financial strength of
its customers and generally requires no collateral to secure trade
receivables. The Company may require advance payment or utilize
irrevocable letters of credit to mitigate credit risk when considered
appropriate.
18. Segments, Geographic Location and
Major Customers:
The Company
currently operates in one segment whose primary products perform wet
processing. The Company’s current product offerings qualify for
aggregation under authoritative accounting guidance as its products are
manufactured and distributed in the same manner, have similar economic
characteristics and are sold to the same customer base.
Seagate and Amkor
accounted for 11.6% and 10.4%, respectively, of net sales in fiscal
2008. Advanced Micro Devices and Micron/IM Flash accounted for 23.8%
and 10.2%, respectively, of net sales in fiscal 2007. No single
customer accounted for 10.0% or more of net sales in fiscal 2009.
Net sales
information by geographic location based on shipment location for fiscal 2009,
2008 and 2007 is summarized as follows (in thousands):
|
Year
Ended September 30,
|
||||||||||||
|
2009
|
2008
|
2007
|
||||||||||
|
Net sales, by
customer location:
|
||||||||||||
|
United
States
|
$ | 35,455 | $ | 68,195 | $ | 80,646 | ||||||
|
Germany
|
22,727 | 28,683 | 67,739 | |||||||||
|
Europe,
excluding Germany
|
18,721 | 26,455 | 16,790 | |||||||||
|
Japan
|
14,178 | 19,474 | 16,488 | |||||||||
|
Taiwan
|
31,073 | 54,591 | 15,812 | |||||||||
|
Singapore
|
2,762 | 9,941 | 13,546 | |||||||||
|
Korea
|
2,664 | 20,665 | 1,600 | |||||||||
|
Philippines
|
8,718 | 6,619 | -- | |||||||||
|
Asia
other
|
2,742 | 3,981 | 2,599 | |||||||||
| $ | 139,040 | $ | 238,604 | $ | 215,220 | |||||||
Property, plant and
equipment information by geographic location for fiscal 2009 and 2008 is
summarized as follows (in thousands):
|
Year
Ended September 30,
|
||||||||
|
2009
|
2008
|
|||||||
|
Property,
plant and equipment, net:
|
||||||||
|
United
States
|
$ | 31,363 | $ | 37,818 | ||||
|
United
Kingdom
|
3,783 | 3,901 | ||||||
|
Austria
|
7,506 | 7,423 | ||||||
|
Other
countries
|
603 | 767 | ||||||
| $ | 43,255 | $ | 49,909 | |||||
19. Quarterly Financial Data
(Unaudited):
For each quarter of
fiscal 2009 and 2008 (in thousands, except for per share amounts):
|
Year
Ended September 30, 2009
|
||||||||||||||||
|
First
|
Second
|
Third
|
Fourth
|
|||||||||||||
|
Quarter
|
Quarter
|
Quarter
|
Quarter
|
|||||||||||||
|
Net
sales
|
$ | 33,066 | $ | 27,158 | $ | 31,763 | $ | 47,053 | ||||||||
|
Gross
profit
|
$ | 14,161 | $ | 10,691 | $ | 14,342 | $ | 19,894 | ||||||||
|
Downsizing
costs
|
$ | 881 | $ | 1,531 | $ | 137 | $ | 17 | ||||||||
|
Net income
(loss)
|
$ | (7,421 | ) | $ | (4,605 | ) | $ | (1,624 | ) | $ | 2,222 | |||||
|
Earnings
(loss) per basic share
|
$ | (0.23 | ) | $ | (0.14 | ) | $ | (0.05 | ) | $ | 0.07 | |||||
|
Earnings
(loss) per diluted share
|
$ | (0.23 | ) | $ | (0.14 | ) | $ | (0.05 | ) | $ | 0.07 | |||||
|
Year
Ended September 30, 2008
|
||||||||||||||||
|
First
|
Second
|
Third
|
Fourth
|
|||||||||||||
|
Quarter
|
Quarter
|
Quarter
|
Quarter
|
|||||||||||||
|
Net
sales
|
$ | 48,592 | $ | 62,958 | $ | 66,973 | $ | 60,081 | ||||||||
|
Gross
profit
|
$ | 24,172 | $ | 30,072 | $ | 32,102 | $ | 31,049 | ||||||||
|
Net income
(loss)
|
$ | (776 | ) | $ | 2,145 | $ | 3,434 | $ | 1,234 | |||||||
|
Earnings
(loss) per basic share
|
$ | (0.02 | ) | $ | 0.07 | $ | 0.11 | $ | 0.04 | |||||||
|
Earnings
(loss) per diluted share
|
$ | (0.02 | ) | $ | 0.07 | $ | 0.11 | $ | 0.04 | |||||||
20. Subsequent
Event:
On
November 16, 2009, we entered in a definitive agreement to be acquired by
Applied Materials, Inc., a Delaware corporation. Pursuant to the merger
agreement, Applied Materials commenced a tender offer to purchase all of the
outstanding shares of the Company’s common stock at a price of $11 per share,
net to seller in cash, without interest thereon and less any required
withholding tax. The tender offer was commenced on November 19, 2009 and the
initial expiration date is 12:00 midnight, Eastern Standard Time,
on December 17, 2009, subject to extension as described in the offer
materials and the related merger agreement. Subsequent to the completion of the
tender offer and the satisfaction of certain other conditions set forth in the
merger agreement, the Company will merge with a wholly-owned subsidiary of
Applied Materials.
As
of December 14, 2009, no other events or transactions have occurred subsequent
to the Consolidated Balance Sheets date of September 30, 2009 that required
recognition or disclosure.
REPORT
OF INDEPENDENT REGISTERED PUBLIC ACCOUNTING FIRM
Board of Directors
and
Shareholders of
Semitool, Inc.
We
have audited the accompanying consolidated balance sheets of Semitool, Inc. (a
Montana corporation) and subsidiaries as of September 30, 2009 and 2008, and the
related consolidated statements of operations, shareholders’ equity, cash flows,
and comprehensive income for each of the three years in the period ended
September 30, 2009. Our audits of the basic financial statements included the
financial statement schedule listed in the index appearing under Item 15 (a)(2).
These financial statements and financial statement schedule are the
responsibility of the Company's management. Our responsibility is to express an
opinion on these financial statements and financial statement schedule based on
our audits.
We
conducted our audits in accordance with the standards of the Public Company
Accounting Oversight Board (United States). Those standards require that we plan
and perform the audit to obtain reasonable assurance about whether the financial
statements are free of material misstatement. An audit includes examining, on a
test basis, evidence supporting the amounts and disclosures in the financial
statements. An audit also includes assessing the accounting principles used and
significant estimates made by management, as well as evaluating the overall
financial statement presentation. We believe that our audits provide a
reasonable basis for our opinion.
In
our opinion, the financial statements referred to above present fairly, in all
material respects, the financial position of Semitool, Inc. and subsidiaries as
of September 30, 2009 and 2008, and the results of their operations and their
cash flows for each of the three years in the period ended September 30, 2009 in
conformity with accounting principles generally accepted in the United States of
America. Also in our opinion, the related financial statement schedule, when
considered in relation to the basic financial statements taken as a whole,
presents fairly, in all material respects, the information set forth
therein.
We
also have audited, in accordance with the standards of the Public Company
Accounting Oversight Board (United States), Semitool Inc.’s internal control
over financial reporting as of September 30, 2009, based on criteria established
in Internal Control—Integrated
Framework issued by the Committee of Sponsoring Organizations of the
Treadway Commission (COSO) and our report dated December 14, 2009 expressed an
unqualified opinion.
/s/ GRANT THORNTON LLP
Salt Lake City,
Utah
December 14,
2009
REPORT
OF INDEPENDENT REGISTERED PUBLIC ACCOUNTING FIRM
Board of Directors
and
Shareholders of
Semitool, Inc.
We
have audited Semitool, Inc. (a Montana Corporation) and subsidiaries’ internal
control over financial reporting as of September 30, 2009, based on criteria
established in Internal
Control—Integrated Framework issued by the Committee of Sponsoring
Organizations of the Treadway Commission (COSO). Semitool, Inc. and
subsidiaries’ management is responsible for maintaining effective internal
control over financial reporting and for its assessment of the effectiveness of
internal control over financial reporting, included in the accompanying
Management’s Report on Internal Control over Financial Reporting. Our
responsibility is to express an opinion on Semitool, Inc. and subsidiaries’
internal control over financial reporting based on our audit.
We
conducted our audit in accordance with the standards of the Public Company
Accounting Oversight Board (United States). Those standards require that we plan
and perform the audit to obtain reasonable assurance about whether effective
internal control over financial reporting was maintained in all material
respects. Our audit included obtaining an understanding of internal control over
financial reporting, assessing the risk that a material weakness exists, testing
and evaluating the design and operating effectiveness of internal control based
on the assessed risk, and performing such other procedures as we considered
necessary in the circumstances. We believe that our audit provides a reasonable
basis for our opinion.
A
company’s internal control over financial reporting is a process designed to
provide reasonable assurance regarding the reliability of financial reporting
and the preparation of financial statements for external purposes in accordance
with generally accepted accounting principles. A company’s internal control over
financial reporting includes those policies and procedures that (1) pertain to
the maintenance of records that, in reasonable detail, accurately and fairly
reflect the transactions and dispositions of the assets of the company; (2)
provide reasonable assurance that transactions are recorded as necessary to
permit preparation of financial statements in accordance with generally accepted
accounting principles, and that receipts and expenditures of the company are
being made only in accordance with authorizations of management and directors of
the company; and (3) provide reasonable assurance regarding prevention or timely
detection of unauthorized acquisition, use, or disposition of the company’s
assets that could have a material effect on the financial
statements.
Because of its
inherent limitations, internal control over financial reporting may not prevent
or detect misstatements. Also, projections of any evaluation of effectiveness to
future periods are subject to the risk that controls may become inadequate
because of changes in conditions, or that the degree of compliance with the
policies or procedures may deteriorate.
In
our opinion, Semitool, Inc. and subsidiaries maintained, in all material
respects, effective internal control over financial reporting as of September
30, 2009, based on criteria established in Internal Control—Integrated
Framework issued by COSO.
We
also have audited, in accordance with the standards of the Public Company
Accounting Oversight Board (United States), the consolidated balance sheets of
Semitool, Inc. and subsidiaries as of September 30, 2009 and 2008, and the
related consolidated statements of operations, shareholders’ equity, cash flows,
and comprehensive income for each of the three years in the period ended
September 30, 2009 and our report dated December 14, 2009 expressed an
unqualified opinion.
/s/ GRANT THORNTON LLP
Salt Lake City,
Utah
December 14,
2009
Item 9. Changes in and Disagreements with
Accountants on Accounting and Financial Disclosure
None.
Item 9A. Controls and Procedures
|
(a)
|
Evaluation of Disclosure
Controls and Procedures. As of the end of the period covered by
this report, Semitool conducted an evaluation, under the supervision and
with the participation of our principal executive officer and principal
financial officer, of our disclosure controls and procedures (as defined
in Rule 13a-15(e) under the Securities Exchange Act of 1934 (the
“Exchange Act”)). Based on this evaluation, our principal
executive officer and principal financial officer concluded that our
disclosure controls and procedures are effective to ensure that
information required to be disclosed by us in reports that we file or
submit under the Exchange Act is recorded, processed, summarized and
reported within the time periods specified in Securities and Exchange
Commission rules and forms and such information is accumulated and
communicated to management to allow timely decisions regarding required
disclosure.
|
|
(b)
|
Management’s
Report on Internal Control over Financial Reporting. The management of
Semitool is responsible for establishing and maintaining adequate internal
control over financial reporting, as such term is defined in
Rule 13a-15(f) under the Exchange Act. Semitool’s internal
control over financial reporting was designed to provide reasonable
assurance regarding the reliability of financial reporting and the
preparation of financial statements for external purposes in accordance
with generally accepted accounting standards. Under the
supervision and with the participation of management, including our
Chairman and Chief Executive Officer and Chief Financial Officer, we
conducted an assessment of the effectiveness of our internal control over
financial reporting as of September 30, 2009. In making this
assessment, management used the criteria set forth by the Committee of
Sponsoring Organizations of the Treadway Commission (COSO) in
Internal Control — Integrated
Framework.
|
Based on our
assessment using the criteria set forth by COSO in Internal Control — Integrated
Framework, management concluded that our internal control over financial
reporting was effective as of September 30, 2009.
Because of its
inherent limitations, internal control over financial reporting may not prevent
or detect misstatements. Also, projections of any evaluation of effectiveness to
future periods are subject to the risk that controls may become inadequate
because of changes in conditions, or that the degree of compliance with the
policies or procedures may deteriorate.
The effectiveness
of the Company’s internal control over financial reporting as of
September 30, 2009 has been audited by Grant Thornton LLP, an independent
registered public accounting firm, as stated in its report, which appears
herein.
|
(c)
|
Changes in
Internal Control over Financial Reporting. There have not been any changes
in our internal control over financial reporting during our most recently
completed fiscal quarter which have materially affected, or are reasonably
likely to materially affect, our internal control over financial
reporting.
|
Item 9B. Other Information
None.
PART
III
Item 10. Directors, Executive Officers and Corporate
Governance
|
(a)
|
Directors
|
The following
individuals serve, as of December 14, 2009, as the members of our Board of
Directors.
Raymon F. Thompson, age 68,
founded Semitool in 1979 and serves as our Chairman and Chief Executive Officer.
Mr. Thompson holds a number of patents in the semiconductor industry and has
been directly involved in the design and commercialization of our current suite
of semiconductor equipment.
Howard E. Bateman, age 75,
has served on our Board of Directors since 1990. Mr. Bateman formerly owned and
operated Entech, a Pennsylvania company that was an independent sales
representative for our products from 1979 to 1996. Mr. Bateman is Chairman of
our Compensation Committee.
Donald P. Baumann, age 74,
has served on our Board of Directors since 2003. Mr. Baumann currently is a
consultant to the semiconductor equipment industry. From 1994 through 2001 he
served as President of the semiconductor equipment manufacturer, SEZ North
America, a subsidiary of The SEZ Group of Zurich, Switzerland. Earlier in his
career he held senior management positions in worldwide sales and marketing for
other companies in the semiconductor industry. Mr. Baumann is a member of our
Compensation Committee.
Timothy C. Dodkin, age 60,
has been employed by us since 1985 and has served on our Board of Directors
since 1998. Mr. Dodkin served as our European Sales Manager from 1985 to 1986,
when he became Senior Vice President, Managing Director of Semitool Europe, Ltd.
From September 2001 to June 2003 he was our Senior Vice President, Global Sales
and Marketing and from June 2003 to present he has served as Executive Vice
President. Prior to joining us, Mr. Dodkin worked at Cambridge Instruments, a
semiconductor equipment manufacturer, for ten years in national and
international sales.
Daniel J. Eigeman, age 75,
has served on the Company’s Board of Directors since 1985. From 1971 to 1993,
Mr. Eigeman was President of Eigeman, Hanson & Co., P.C., and from 1993 to
1999 was a shareholder of Junkermier, Clark, Campanella, Stevens, P.C., both
accounting firms. Mr. Eigeman, a certified public accountant, is a member of our
Audit Committee.
Charles P. Grenier, age 60,
has served on our Board of Directors since 2003. Mr. Grenier was Executive Vice
President of Plum Creek Timber Company, a New York Stock Exchange listed
company, from 1994 to 2000, and he was a director of that company from 1995 to
2000. Mr. Grenier graduated from Stanford University with a bachelor of arts in
economics and holds a masters of business administration from Harvard
University. Mr. Grenier is a member of our Audit Committee.
Steven C. Stahlberg, age 43,
has served on our Board of Directors since 2004. Mr. Stahlberg, a certified
public accountant, is a founder of Stahlberg & Sutherland, CPAs, which
specializes in management advisory services, cash flow analysis and forecasting,
and employee relations. Prior to forming his firm, he worked extensively in
governmental and nonprofit auditing as well as management advisory services. Mr.
Stahlberg is the Chairman of our Audit Committee.
Steven R. Thompson, age 46,
has served on the Company’s Board of Directors since 2008. Mr.
Thompson is the owner of a small business in the outdoor recreation market.
Prior to starting this business in 1997, Mr. Thompson worked at the Company from
1982 to 1997, his last position being Vice President and General Manager of the
Thermal Products Division.
There are no family
relationships among any of our officers or directors except that Mr. Raymon F.
Thompson is the father of Mr. Steven R. Thompson.
For information
with respect to executive officers, see Part I, Item 1 of this annual report on
Form 10-K, under “Executive Officers of the Registrant.”
Audit
Committee
The Audit Committee
consists of Messrs. Stahlberg, Eigeman and Grenier. The Board of
Directors has determined that at least one member of the Audit Committee, Mr.
Stahlberg, is a “financial expert” within the meaning of Item 407(d)(5)(ii) of
Regulation S-K of the Exchange Act. Mr. Stahlberg is a certified public
accountant and has served on our Board of Directors and Audit Committee since
2004. Mr. Stahlberg is a founder of Stahlberg & Sutherland, CPAs, which
specializes in management advisory services, cash flow analysis and forecasting,
and employee relations. Prior to forming his firm, he worked extensively in
governmental and nonprofit auditing as well as management advisory services. In
the course of his career, Mr. Stahlberg acquired (i) an understanding of
generally accepted accounting principles and financial statements, (ii) the
ability to assess the general application of such principles in connection with
the accounting for estimates, accruals and reserves, (iii) experience preparing,
auditing, analyzing or evaluating financial statements that present a breadth
and level of complexity of accounting issues that are generally comparable to
the breadth and complexity of issues that can reasonably be expected to be
raised by the Company’s financial statements, (iv) an understanding of internal
control over financial reporting, and (v) an understanding of audit committee
functions.
The Board of
Directors also considers Mr. Eigeman and Mr. Grenier to be “financial experts,”
but has elected to designate Mr. Stahlberg as a “financial expert” for purposes
of Item 407(d)(5)(ii) of Regulation S-K of the Exchange Act.
Code
of Conduct
We
have adopted a code of business conduct for all of our employees and directors,
including our principal executive officer, other executive officers, principal
financial officer and senior financial personnel. A copy of our code of business
conduct is available free of charge on our company website at www.semitool.com.
We intend to post on our website any material changes to, or waivers from our
code of business conduct, if any, within five business days of any such
event.
SECTION
16(A) BENEFICIAL OWNERSHIP REPORTING COMPLIANCE
Section 16(a) of
the Exchange Act requires that our executive officers and directors, and persons
owning more than ten percent of any class of our registered securities file
reports of ownership and changes in ownership with the SEC and the National
Association of Securities Dealers, Inc. Executive officers, directors and
greater than ten percent shareholders are required by SEC regulation to furnish
us with copies of all Section 16(a) forms they file. Based solely on our review
of the copies of such forms received by us, or written representations from
certain reporting persons, we believe that, for the fiscal year ended September
30, 2009, all executive officers, directors and greater than 10% shareholders
complied with all applicable filing requirements except for the following: in
November 2009, it came to our attention that Mr. Timothy C. Dodkin, an officer
and director of the Company, had failed to file Forms 4 with the SEC for certain
sale transactions on two occasions in 2008. Mr. Dodkin subsequently filed a Form
4 reporting those transactions in November 2009.
Item 11. Executive Compensation
Compensation
Discussion And Analysis
Overview
of Compensation Program
The Compensation
Committee has responsibility for establishing, implementing and monitoring
adherence to our compensation philosophy. The Compensation Committee seeks to
ensure that the total compensation paid to the executive officers and members of
the Board is fair, reasonable and competitive. Generally, the types of
compensation and benefits provided to the Named Executive Officers (as defined
in the Summary Compensation Table) are similar to those provided to all other
executive officers.
Compensation
Objective and Philosophy
The objective of
our compensation program is to provide a total compensation package that will
enable us to:
|
•
|
attract,
motivate and retain outstanding employees, including Named Executive
Officers;
|
|
|
•
|
align the
financial interests of our employees, including our Named Executive
Officers, with the interests of our shareholders;
|
|
|
•
|
provide
incentives for superior company and individual Named Executive Officers
performance; and
|
|
|
•
|
encourage
each Named Executive Officer to have a stake in our long-term performance
and success.
|
To
achieve this objective, the Compensation Committee has designed a compensation
philosophy that seeks to combine “fixed” forms of compensation such as base
salaries and certain other perquisites and ancillary benefits with “at-risk”
forms of compensation such as performance-based cash bonuses and long-term
equity incentive awards. In particular, the Compensation Committee believes that
paying “fixed” forms of compensation that are competitive relative to our
Compensation Peer Group (as defined below) helps to ensure that we maintain our
ability to attract, motivate and retain individuals of superior ability and
managerial talent in key positions. Likewise, the Compensation Committee
believes that awarding “at-risk” forms of compensation helps to further align
our employees’ interests with those of our shareholders by providing incentives
for superior performance relative to established goals, while also encouraging
employees to value our long-term performance. Thus, our compensation program
allows us to reward short-term achievement of objectives and to foster long-term
participation in our success.
We
use four basic categories of compensation. First, we set base salaries at levels
designed to attract and retain qualified executives based on their levels of
experience relevant to our business. Second, we may offer performance-based cash
bonuses meant to reward achievement of certain key financial and operational
goals, subject to the Company’s overall financial performance. Third, we may
grant long-term equity incentive awards, which vest over time, to encourage
sustained loyalty and performance and to foster in each executive a sense of
ownership and shared purpose. Finally, we may offer ancillary benefits that the
Compensation Committee has determined to be widely offered within our
Compensation Peer Group. All of these categories of compensation have
been impacted by general economic conditions as well as specific economic
conditions affecting the semiconductor industry.
To
date, the Compensation Committee has not established any formal policy or target
for the relative balance of “fixed” and “at-risk” compensation. The mix of these
types of compensation is evaluated on a case-by-case basis. For example, the
Chief Executive Officer of the Company, Mr. Thompson, has never received “at
risk” compensation because he is a significant shareholder in the Company and
has declined this form of compensation.
Process
for Setting Executive Compensation
The Compensation
Committee understands that we compete with many companies for top
executive-level talent. Accordingly, the Compensation Committee strives to
implement compensation packages for our executive officers that are competitive
with total compensation paid to similarly situated executives of the companies
comprising what we refer to as our “Compensation Peer Group”. The
members of this Compensation Peer Group may vary depending on the nature of the
executive role being considered, as the Compensation Committee may deem it
appropriate in the case of certain executive roles to refer to the practices of
similarly situated companies within the semiconductor industry and in the case
of other executive roles to refer more generally to the practices of companies
similar to ours in terms of size, location, operations, etc. In addition to
comparing compensation levels to the appropriate Compensation Peer Group, the
Compensation Committee also determines the appropriate metrics that will be used
to define the various performance goals underlying certain elements of the
“at-risk” compensation we offer.
Companies within
the Compensation Peer Group change, but have included Applied Materials, Inc.,
Asyst Technologies, Inc., Electroglas, Inc., FSI International, Inc., KLA
Tencor, Inc., Kulicke & Soffa, Inc., Lam Research, Inc., Mattson Technology,
Inc., Novellus Systems, Inc. and Varian Semiconductor Equipment Associates,
Inc. The Company does not employ benchmarking against these companies
because of the disparities between the Company's size, strategic goals, and line
of business in relation to the various members of this peer group. Instead,
the Company's practice has been to observe the general trends and compensation
methodologies of these companies and use that information as one of the various
criteria upon which our executive compensation programs are designed and
implemented.
Ultimately, the
Compensation Committee makes all compensation decisions for our executive
officers. Often, these decisions will be based on data obtained by the
Compensation Committee from relevant compensation surveys and other public
sources, as well as individual performance, internal comparables and other
related factors as deemed appropriate by the members of the committee. In
addition, from time to time, the Compensation Committee may solicit the input of
our Chairman and Chief Executive Officer, Mr. Thompson, with respect to
executive compensation matters.
Executive
Compensation Components
The following
discussion further describes the components and mix of compensation we pay to
our executive officers, as well as how we generally determine the amount of each
component. It also explains how each component of compensation fits into our
overall compensation objectives and affects decisions regarding other components
of compensation. This discussion and analysis should be read together with the
Summary Compensation Table (and the related narrative disclosure for the table)
that appears directly following this Compensation Discussion and
Analysis.
As
referenced above, the principal components of compensation for our executive
officers are:
|
•
|
base
salary;
|
|
|
•
|
performance-based
cash bonuses;
|
|
|
•
|
long-term
equity incentive awards; and
|
|
|
•
|
ancillary
benefits.
|
Base
Salary
We
provide our executive officers and other employees with base salaries to
compensate them for services rendered during the fiscal year. Base salary ranges
for executive officers are determined for each executive based on his or her
position and responsibility, with appropriate reference to market data from the
Compensation Peer Group, as well as current general economic conditions and
conditions affecting the semiconductor industry.
During its review
of base salaries for executive officers for fiscal 2009, the Compensation
Committee primarily considered:
|
•
|
peer data
obtained from public sources;
|
|
|
•
|
the results
of its own internal review and appraisal of the executive's compensation,
both individually and relative to other executive officers;
and
|
|
|
•
|
the
individual performance and responsibility of the
executive.
|
Base salary levels
are considered annually as part of our performance review process, as well as
upon a promotion or other material change in job responsibility. Changes in base
salary levels may be merit-based or circumstance-based as determined appropriate
by the Compensation Committee. In reviewing market data, the Compensation
Committee considered the surveys that track the executive compensation of other
leading companies in the semiconductor and semiconductor equipment industries,
many of which are included in the RDG Semiconductor Composite Index used in the
Stock Performance Graph. In reviewing individual executive performance, the
Compensation Committee considered factors including decision-making skills,
business and financial acumen, ability to drive results, and the executive’s
overall performance in his or her role.
As
a result of recent economic conditions existing at the time, commencing in
January 2009, the executive officers of the Company voluntarily took reductions
in salary of between 25% and 60%. The salaries in existence
immediately prior to such reductions were reinstated (along with all other
salaries in the Company) effective November 16, 2009 due to improved economic
conditions and the financial condition of the Company.
Performance-Based
Cash Incentive Compensation
Cash bonuses
periodically may be granted to executive officers on the basis of subjective
criteria, including the performance of the Company and the individual. In
addition, there is an Executive Bonus Plan (the “Plan”) that currently applies
only to our President and Chief Operating Officer, Mr. Murphy, which provides
for the payment of annual cash incentive awards based on the achievement of
certain performance criteria related principally to the growth in Company
revenues. The Plan is administered by the Compensation Committee. Sales revenue
is the principal measure used under the Plan to determine cash awards. However,
the Compensation Committee may also increase or decrease the award based on its
evaluation of other criteria specified in the Plan. Due to decreasing Company
revenues over the prior fiscal year, there was no award made to Mr. Murphy under
this Plan for the fiscal year ended September 30, 2009. In addition,
the Compensation Committee did not exercise any discretion in establishing an
award based on the other criteria specified in the Plan.
Long-Term
Equity Incentive Compensation
Long-term equity
incentive compensation is another key component of our “at-risk” compensation
package. Whereas performance-based cash compensation ultimately ties individual
success to predefined corporate performance targets, the value of long-term
incentive compensation is even more directly related to the value created for
our shareholders in the form of appreciating stock prices.
Grants of
equity-based awards are made to Named Executive Officers and other eligible
employees based upon performance criteria of both the individual and the
Company, as well as conditions affecting the financial performance of the
Company. When making equity award decisions, the Compensation Committee
considers market data relating to the Compensation Peer Group, the grant size,
the forms of long-term equity compensation available to it under existing plans,
the status of awards granted in previous years, our performance, the value of
the specific position to us and individual performance criteria. The
principal performance goals are increased Company revenues, gross margins and
net profits, and the individual’s contribution to those goals. In light of
current economic conditions, it has been difficult to achieve those
goals. Existing ownership levels are not a factor in award
determination, as the Compensation Committee wants to encourage executives to
hold our stock in order to achieve alignment between management and
shareholders’ interests. All long-term equity incentive compensation awards are
currently granted pursuant to our 2007 Stock Incentive Plan. No long-term equity
incentive awards were granted to any of our Named Executive Officers for fiscal
2009 because of adverse economic conditions affecting the industry and the
Company and the general reductions in salary and required time off affecting our
general employee population.
Other
Ancillary Benefits
We
provide the Named Executive Officers and other employees with perquisites and
other ancillary benefits that the Compensation Committee believes are consistent
with its objectives and philosophy set forth above. A description of these
perquisites and other ancillary benefits, which the Compensation Committee
periodically reviews and adjusts as deemed necessary, is set forth
below.
Life and Long Term Disability
Insurance: All of our Named Executive Officers and other executive
officers in the United States are enrolled in our group life and disability
insurance plans. All executive participants are entitled to a benefit under the
group life insurance plan equal to their annual base salary in effect on the
date of death, up to a maximum benefit of $300,000. The long term disability
plan provides a monthly benefit to executive officers in the event of disability
of 60% of the participant’s annual base salary up to a maximum monthly amount of
$6,000.
Executive Health Plan: On
February 15, 2006, the Board of Directors adopted the Semitool, Inc.
Supplemental Executive Health Plan (the “Health Plan”). The purpose of the
Health Plan is to provide designated executive participants and their
beneficiaries with certain accident and health care benefits. Currently, the two
participants are the Chief Executive Officer, Mr. Thompson, and the President
and Chief Operating Officer, Mr. Murphy. The Health Plan is intended to qualify
as fully insured under a policy of accident and health insurance, and not to be
treated as a “self-insured medical reimbursement plan” under Internal Revenue
Code Section 105(h)(6). The Health Plan is intended to meet all other applicable
requirements of ERISA and the Internal Revenue Code. The insurance policy
described in the Health Plan provides for the reimbursement of certain health
care expenses not covered by the Semitool Health Benefit Plan up to a maximum of
$50,000 per annum for each participant.
Tax and Accounting
Implications: As part of its role in developing and overseeing our
compensation programs, the Compensation Committee reviews and considers the
deductibility of executive compensation under Section 162(m) of the Internal
Revenue Code, which provides that we may not deduct compensation of more than
$1,000,000 that is paid to certain individuals unless certain conditions are
met. To qualify for deductibility under Section 162(m), compensation in excess
of $1,000,000 per year paid to the Named Executive Officers at the end of such
fiscal year generally must be “performance-based” compensation as determined
under Section 162(m). The Compensation Committee generally intends to stay
within the requirements for full deductibility of executive compensation under
Section 162(m). However, the Compensation Committee will balance the costs and
burdens involved in such compliance against the value to us and our shareholders
of the tax benefits that we would obtain as a result, and may in certain
instances pay compensation that is not fully deductible if, in its
determination, such
costs and burdens outweigh such benefits.
The Compensation
Committee also considers the accounting effect that each compensation component
may have on the Company and recipients of the relevant compensation (for
example, restricted stock or cash bonuses). When determining the appropriate
compensation component, the Compensation Committee’s goal is to consider the
relative cost of the component from an accounting standpoint along with its
potential benefit as a compensation tool.
Chief
Executive Officer Compensation
The Company’s Chief
Executive Officer is Raymon F. Thompson. The compensation of the Chief Executive
Officer is reviewed annually. Mr. Thompson’s base salary for the fiscal year
ended September 30, 2009 was established by the Compensation Committee at
$380,000 in part by comparing the base salaries of chief executive officers at
other companies of similar size. Subsequent to that salary
determination by the Compensation Committee, Mr. Thompson’s base salary was
voluntarily reduced to $307,800 on November 1, 2008 and then again on December
1, 2008 to $150,000 as a result of recent adverse economic conditions, but was
reinstated (along with all other salaries in the Company) to the established
amount effective November 16, 2009 due to the improved financial condition
of the Company.
EXECUTIVE
COMPENSATION
The following
tables set forth certain compensation information for our Chief Executive
Officer, Chief Financial Officer, and three other most highly compensated
executive officers of the Company (collectively the “Named Executive Officers”)
for the fiscal year ended September 30, 2009.
Summary
Compensation Table
The following table
sets forth certain information concerning compensation of each Named Executive
Officer during the fiscal year ended September 30, 2009.
|
Name and Principal Position
|
Year
|
Salary
($)
|
Bonus
($)
|
Stock
Awards
($)
(1)
|
Option
Awards
($) (1)
|
All Other Compensation ($)
|
Total
($)
|
||||||||||||||||||
|
Raymon F.
Thompson
|
2009
|
182,324 | -- | -- | -- | 269,073 | (2) | 451,397 | |||||||||||||||||
|
Chairman of the Board
|
2008
|
373,681 | -- | -- | -- | 238,189 | 611,870 | ||||||||||||||||||
|
and
Chief Executive Officer
|
2007
|
361,014 | -- | -- | -- | 213,828 | 574,842 | ||||||||||||||||||
|
Larry E.
Murphy
|
2009
|
334,263 | -- | 55,569 | 214,709 | 17,374 | (3) | 621,915 | |||||||||||||||||
|
President and
|
2008
|
413,016 | -- | 165,385 | 269,183 | 64,414 | 911,998 | ||||||||||||||||||
|
Chief
Operating Officer
|
2007
|
399,015 | -- | -- | 268,448 | 55,181 | 722,644 | ||||||||||||||||||
|
Timothy C.
Dodkin
|
2009
|
200,582 | -- | 3,553 | 8,879 | 17,221 | (4) | 230,235 | |||||||||||||||||
|
Executive Vice President
|
2008
|
325,598 | -- | 7,036 | 17,477 | 63,629 | 413,740 | ||||||||||||||||||
|
2007
|
304,012 | -- | -- | 26,972 | 100,655 | 431,639 | |||||||||||||||||||
|
Larry A.
Viano
|
2009
|
159,173 | -- | 17,763 | 13,318 | 10,083 | (5) | 200,337 | |||||||||||||||||
|
Vice
President and
|
2008
|
196,674 | 40,000 | 35,179 | 19,070 | 17,199 | 308,122 | ||||||||||||||||||
|
Chief
Financial Officer
|
2007
|
190,007 | -- | -- | 23,908 | 42,220 | 256,135 | ||||||||||||||||||
|
Herbert
Oetzlinger
|
2009
|
163,953 | -- | 20,780 | 5,165 | 207,479 | (6) | 397,377 | |||||||||||||||||
|
Vice
President, Sales (Europe)
|
2008
|
216,798 | -- | 20,237 | 10,927 | 319,629 | 567,591 | ||||||||||||||||||
|
|
|||||||||||||||||||||||||
________________
|
(1)
|
The amount
shown is the expense recognized in the Company’s financial statements,
without any reduction for risk of forfeiture, for each officer’s
outstanding restricted stock and stock options. Assumptions used in
determining the fair values of the option awards for are set forth in the
“Employee Benefit and Stock Option Plans” footnote of the Company’s
financial statements included in this annual report on Form 10-K and on
its annual reports on Form 10-K for fiscal 2008 and 2007, which are
incorporated herein by reference.
|
|
(2)
|
Represents
amounts paid by the Company on behalf of Mr. Thompson in fiscal 2009 as
follows: (i) $5,337 for Health, Life and Long Term Disability Insurance
and (ii) $263,736 for incremental cost incurred by the Company for the
personal use of the corporate aircraft on behalf of Mr.
Thompson.
|
|
(3)
|
Represents
amounts paid by the Company on behalf of Mr. Murphy in fiscal 2009 as
follows: (i) $5,337 for Health, Life and Long Term Disability Insurance,
(ii) $620 as a car allowance, (iii) $7,547 for Supplemental Executive
Health Benefits paid by the Company on behalf of Mr. Murphy and (iv)
$3,870 for personal payroll taxes paid by the Company for Stock Awards to
Mr. Murphy.
|
|
(4)
|
Represents
amounts paid by the Company on behalf of Mr. Dodkin in fiscal 2009 as
follows: (i) $2,450 for Health, Life and Long Term Disability Insurance,
(ii) $9,983 as a car allowance, and (iii) $4,788 categorized as
miscellaneous.
|
|
(5)
|
Represents
amounts paid by the Company on behalf of Mr. Viano in fiscal 2009 as
follows: (i) $5,337 for Health, Life and Long Term Disability Insurance
and (ii) $4,746 as a car allowance.
|
|
(6)
|
Represents
amounts paid by the Company on behalf of Mr. Oetzlinger in fiscal 2009 as
follows: (i) $1,661 for Health Insurance, (ii) $17,980 for contribution
accruals to Mr. Oetzlinger’s Austrian Pension Agreement, (iii) $18,402 as
a car allowance, (iv) $166,225 in accrued commissions and (v) $3,211
categorized as miscellaneous.
|
Grants
of Plan-Based Awards Table
No
stock-based awards were granted to any of the Named Executive Officers during
the fiscal year ended September 30, 2009.
Outstanding
Equity Awards Table
The following table
sets forth certain information concerning outstanding equity awards for each
Named Executive Officer as of September 30, 2009. No equity awards have been
granted to Raymon F. Thompson, the Company’s Chief Executive
Officer.
|
Option
Awards
|
Stock
Awards
|
||||||||||||||||||||
|
Market
|
|||||||||||||||||||||
|
Number
of
|
Number
of
|
Value
of
|
|||||||||||||||||||
|
Securities
|
Securities
|
Number
of
|
Shares
or
|
||||||||||||||||||
|
Underlying
|
Underlying
|
Shares
or
|
Units
of
|
||||||||||||||||||
|
Unexercised
|
Unexercised
|
Units
of
|
Stock
|
||||||||||||||||||
|
Options
|
Options
|
Options
|
Options
|
Stock
That
|
That
Have
|
||||||||||||||||
| (#) | (#) |
Exercise
|
Expiration
|
Have
Not
|
Not
|
||||||||||||||||
|
Name
|
Exercisable
(1)
|
Unexercisable
(1)
|
Price
($)
|
Date
|
Vested
(#)
|
Vested
($) (2)
|
|||||||||||||||
|
Larry E.
Murphy
|
100,000 | -- | 10.55 |
06/03/14
|
|||||||||||||||||
| 40,000 | -- | 7.03 |
09/27/14
|
||||||||||||||||||
| 57,000 | 3,000 | 7.67 |
11/01/14
|
||||||||||||||||||
| 19,500 | (3) | 164,775 | |||||||||||||||||||
|
Timothy C.
Dodkin
|
30,000 | -- | 8.15 |
09/21/11
|
|||||||||||||||||
| 40,000 | -- | 8.73 |
10/02/11
|
||||||||||||||||||
| 40,000 | -- | 3.98 |
04/15/13
|
||||||||||||||||||
| 7,500 | 2,500 | 7.90 |
10/10/15
|
||||||||||||||||||
| 1,200 | (4) | 10,140 | |||||||||||||||||||
|
Larry A.
Viano
|
4,000 | -- | 7.22 |
01/06/10
|
|||||||||||||||||
| 5,000 | -- | 9.88 |
02/27/11
|
||||||||||||||||||
| 20,000 | -- | 3.98 |
04/15/13
|
||||||||||||||||||
| 11,250 | 3,750 | 7.90 |
10/10/15
|
||||||||||||||||||
| 6,000 | (4) | 50,700 | |||||||||||||||||||
|
Herbert
Oetzlinger
|
20,000 | -- | 8.69 |
10/17/10
|
|||||||||||||||||
| 10,000 | -- | 9.26 |
01/29/12
|
||||||||||||||||||
| 20,000 | -- | 3.98 |
04/15/13
|
||||||||||||||||||
| 4,000 | 1,000 | 7.95 |
09/30/15
|
||||||||||||||||||
| 6,750 | (5) | 57,038 | |||||||||||||||||||
_______________
|
(1)
|
All options
vest quarterly over a five-year period from the grant date of the award.
All option awards expire ten years from the date of
grant.
|
|
(2)
|
The market
value was determined by multiplying the number of shares shown in the
table by $8.45 which was the closing market price on September 30, 2009,
the last trading day of the fiscal year. Vesting is subject to continued
employment with the Company.
|
|
(3)
|
The unvested
stock awards consist of the following restricted stock awards: 16,000
shares granted on October 19, 2007 of which 4,000 shares vest annually on
November 19, 2008 through November 19, 2011 and 10,000 shares granted on
May 19, 2008 of which 2,500 shares vest annually on June 19, 2009 through
June 19, 2012.
|
|
(4)
|
The unvested
awards consist of restricted stock granted on October 19, 2007 which vests
in equal tranches on an annual basis on November 19, 2008 through November
19, 2011.
|
|
(5)
|
The unvested
awards consist of restricted stock units granted on January 31, 2008 which
vest in equal tranches on an annual basis on November 19, 2008 through
November 19, 2011.
|
Option
Exercises and Stock Vested Table
The following table
sets forth certain information concerning vesting of restricted stock for each
Named Executive Officer during the fiscal year ended September 30, 2009. No
Named Executive Officers exercised any stock options during the fiscal year
ended September 30, 2009. In addition, there are no stock option exercises or
restricted stock vesting for Raymon F. Thompson as none of his compensation is
stock-based.
|
Stock
Awards
|
|||||||||
|
Name
|
|
Number
of
Shares
Acquired on Vesting (#)
|
Value
Realized
on
Vesting
($) (1)
|
||||||
|
Larry E.
Murphy
|
6,500 | 21,325 | |||||||
|
Timothy C.
Dodkin
|
400 | 940 | |||||||
|
Larry A.
Viano
|
2,000 | 4,700 | |||||||
|
Herbert
Oetzlinger
|
2,250 | 5,288 | |||||||
________________
|
(1)
|
The value
realized equals the closing price of the Company’s Common Stock on the
vesting date, multiplied by the number of shares that
vested.
|
POTENTIAL
PAYMENTS UPON TERMINATION OR CHANGE-IN-CONTROL
Other than as
described below, there are no contractual arrangements with any Named Executive
Officer to pay any amounts to that individual in the event of a change in
control of the Company.
Larry E. Murphy. Mr. Murphy’s
employment offer obligates the Company to pay him six months of gross salary
(excluding bonuses and other compensation) plus a pro rata cash bonus for the
year of termination in the event he is terminated, unless the termination is the
result of misconduct. Additionally, in August 2009, Mr. Murphy entered into a
change in control agreement with us that provides for the payment of severance
benefits in the event that his employment is terminated in connection with a
change in control. The severance benefits are payable if his employment with us
is terminated within two years following a change of control, unless Mr. Murphy
is terminated for cause or the termination is the result of Mr. Murphy’s
voluntary resignation (which does not include resignations resulting from a
material adverse change in responsibilities, status, base salary, authority or
location of workplace) or his death or disability.
Mr. Murphy’s
severance benefits under the change in control agreement generally consist of a
lump sum cash payment equal to two times the sum of his highest annual base
salary received in the three previous full fiscal years. He is also entitled to
receive coverage for one and one-half years under our health, disability and
life insurance programs unless he obtains coverage through another employer. In
addition, Mr. Murphy’s change in control agreement provides that all outstanding
unvested equity rights held by Mr. Murphy at the time of termination will
accelerate and be fully vested at such time and all blackout periods, conditions
or restrictions for exercise of any options or disposition of any restricted
stock granted to Mr. Murphy shall terminate and all options shall remain
exercisable until the expiration of ten years from the grant date (but not
longer than the original expiration date) and the restricted stock shall be
transferred to Mr. Murphy as soon as reasonably practicable
thereafter.
Timothy C. Dodkin. In August
2009, Mr. Dodkin entered into a change in control agreement with us that
provides for the payment of severance benefits in the event that his employment
is terminated in connection with a change in control. The severance benefits are
payable if his employment with us is terminated within two years following a
change of control, unless Mr. Dodkin is terminated for cause or the termination
is the result of Mr. Dodkin’s voluntary resignation (which does not include
resignations resulting from a material adverse change in responsibilities,
status, base salary, authority or location of workplace) or his death or
disability.
Mr. Dodkin’s
severance benefits under the change in control agreement generally consist of a
lump sum cash payment equal to two times the sum of his highest annual base
salary received in the three previous full fiscal years. He is also entitled to
receive coverage for one and one-half years under our health, disability and
life insurance programs unless he obtains coverage through another employer. In
addition, Mr. Dodkin’s change in control agreement provides that all outstanding
unvested equity rights held by Mr. Dodkin at the time of termination will
accelerate and be fully vested at such time and all blackout periods, conditions
or restrictions for exercise of any options or disposition of any restricted
stock granted to Mr. Dodkin shall terminate and all options shall remain
exercisable until the expiration of ten years from the grant date (but not
longer than the original expiration date) and the restricted stock shall be
transferred to Mr. Dodkin as soon as reasonably practicable
thereafter.
Larry A. Viano. In August
2009, Mr. Viano entered into a change in control agreement with us that provides
for the payment of severance benefits in the event that his employment is
terminated in connection with a change in control. The severance benefits are
payable if his employment with us is terminated within two years following a
change of control, unless Mr. Viano is terminated for cause or the termination
is the result of Mr. Viano’s voluntary resignation (which does not include
resignations resulting from a material adverse change in responsibilities,
status, base salary, authority or location of workplace) or his death or
disability.
Mr. Viano’s
severance benefits under the change in control agreement generally consist of a
lump sum cash payment equal to two times the sum of his highest annual base
salary received in the three previous full fiscal years. He is also entitled to
receive coverage for one and one-half years under our health, disability and
life insurance programs unless he obtains coverage through another employer. In
addition, Mr. Viano’s change in control agreement provides that all outstanding
unvested equity rights held by Mr. Viano at the time of termination will
accelerate and be fully vested at such time and all blackout periods, conditions
or restrictions for exercise of any options or disposition of any restricted
stock granted to Mr. Viano shall terminate and all options shall remain
exercisable until the expiration of ten years from the grant date (but not
longer than the original expiration date) and the restricted stock shall be
transferred to Mr. Viano as soon as reasonably practicable
thereafter.
Herbert Oetzlinger. In August
2009, Mr. Oetzlinger entered into a change in control agreement with us that
provides for the payment of severance benefits in the event that his employment
is terminated in connection with a change in control. The severance benefits are
payable if his employment with us is terminated within two years following a
change of control, unless Mr. Oetzlinger is terminated for cause or the
termination is the result of Mr. Oetzlinger’s voluntary resignation (which does
not include resignations resulting from a material adverse change in
responsibilities, status, base salary, authority or location of workplace) or
his death or disability.
Mr. Oetzlinger’s
severance benefits under the change in control agreement generally consist of a
lump sum cash payment equal to two times the sum of his highest annual base
salary received in the three previous full fiscal years. He is also entitled to
receive coverage for one and one-half years under our health, disability and
life insurance programs unless he obtains coverage through another employer. In
addition, Mr. Oetzlinger’s change in control agreement provides that all
outstanding unvested equity rights held by Mr. Oetzlinger at the time of
termination will accelerate and be fully vested at such time and all blackout
periods, conditions or restrictions for exercise of any options or disposition
of any restricted stock granted to Mr. Oetzlinger shall terminate and all
options shall remain exercisable until the expiration of ten years from the
grant date (but not longer than the original expiration date) and the restricted
stock shall be transferred to Mr. Oetzlinger as soon as reasonably practicable
thereafter.
The following table
sets forth, the cash consideration and the estimated benefits value that each of
Semitool’s executive officers would receive in accordance with the terms of the
Control Agreements if such individual’s employment had been terminated without
cause or such individual had terminated his or her employment for good reason
following the consummation of the Offer in accordance with the terms of the
Control Agreement, assuming such event occurred on September 30,
2009:
|
Name
|
Lump Sum
Severance Salary Payment
|
Continuation
of Insurance Benefits
|
Total
|
|||||||||
|
Larry E.
Murphy
|
$ | 840,000 | (1) | $ | 13,932 | $ | 853,932 | |||||
|
Larry A.
Viano
|
$ | 400,000 | (2) | $ | 13,888 | $ | 413,888 | |||||
|
Timothy C.
Dodkin
|
$ | 795,115 | (3) | $ | 3,792 | (10) | $ | 798,907 | ||||
|
Herbert
Oetzlinger
|
$ | 442,444 | (4) | $ | 2,323 | (11) | $ | 444,767 | ||||
|
Richard C.
Hegger
|
$ | 331,000 | (5) | $ | 13,794 | $ | 344,794 | |||||
|
Klaus H.
Pfeifer
|
$ | 320,000 | (6) | $ | 13,675 | $ | 333,675 | |||||
|
Richard P.
Schuster
|
$ | 314,000 | (7) | $ | 13,758 | $ | 327,758 | |||||
|
Paul M.
Siblerud
|
$ | 284,400 | (8) | $ | 13,644 | $ | 298,044 | |||||
|
James L.
Wright
|
$ | 352,000 | (9) | $ | 13,622 | $ | 365,622 | |||||
________________
(1) Based
on a base salary of $420,000, which is the highest base salary for Mr. Murphy in
the last three-year period.
(2) Based
on a base salary of $200,000, which is the highest base salary for Mr. Viano in
the last three-year period.
(3) Based
on a base salary of $397,557, which is the highest base salary for Mr. Dodkin in
the last three-year period.
(4) Based
on a base salary of $221,222, which is the highest base salary for Mr.
Oetzlinger in the last three-year period.
(5) Based
on a base salary of $165,500, which is the highest base salary for Mr. Hegger in
the last three-year period.
(6) Based
on a base salary of $160,000, which is the highest base salary for Mr. Pfeifer
in the last three-year period.
(7) Based
on a base salary of $157,000, which is the highest base salary for Mr. Schuster
in the last three-year period.
(8) Based
on a base salary of $142,200, which is the highest base salary for Mr. Siblerud
in the last three-year period.
(9) Based on a base
salary of $176,000, which is the highest base salary for Mr. Wright in the last
three-year period.
(10) Mr.
Dodkin’s insurance benefits are paid in British pounds; the amount shown here is
based on the September 30, 2009 exchange rate of $1.60 per £1.00.
(11) Mr.
Oetzlinger’s insurance benefits are paid in Euros; the amount shown here is
based on the September 30, 2009 exchange rate of $1.46 per €1.00.
In
addition to the change in control agreements described above, in the event the
tender offer by Applied Materials is successful, our executive officers will
receive payment in exchange for their stock-based awards that are outstanding
immediately prior to the first acceptance by Applied Materials of any shares of
our common stock tendered in the tender offer, or the acceptance time. The
merger agreement provides that each unexercised stock option for the Company’s
common stock, whether vested or unvested, which is outstanding immediately prior
to the acceptance time, including stock options held by our executive officers
and directors, will be cancelled and the holders of such options will become
eligible to receive a lump sum cash payment equal to $11.00, less the exercise
price per share for the option, multiplied by the number of shares of our common
stock subject to the unexercised portion of such option immediately prior to the
acceptance time, without interest and subject to withholding tax. As of December
1, 2009, Semitool’s executive officers and directors held vested options to
purchase an aggregate of 628,300 shares of our common stock, with exercise
prices ranging from $3.98 to $15.875 per share and a weighted average exercise
price of $7.99 per share, and unvested options to purchase an aggregate of
21,200 shares, with exercise prices ranging from $7.90 to $9.06 per share and a
weighted average exercise price of $8.32 per share. In the event a stock option
has an exercise price per share equal to or greater than $11.00, the option will
be cancelled, without any consideration being payable in respect thereof. Each
restricted stock unit issued by the Company and outstanding immediately prior to
the acceptance time, including restricted stock units held by our executive
officers, to the extent not previously vested and settled in full, will be
cancelled and the holders of such restricted stock units will be entitled to
receive a lump sum cash payment equal to $11.00 multiplied by the number of
shares subject to the unvested and unsettled portion of the restricted stock
unit, without interest and subject to any withholding tax. As of December 1,
2009, Semitool’s executive officers held restricted stock units representing
4,500 shares of our common stock, and none of Semitool’s directors held
restricted stock units. In addition, each outstanding share that is the subject
of a restricted stock award, including those held by our directors and executive
officers, immediately prior to the acceptance time will vest in full as of such
time and all repurchase rights, risk of forfeiture or other conditions of such
restricted stock awards will lapse. The holders of such shares subject to
restricted stock awards will be entitled to receive $11.00 per share without
interest and subject to any required withholding tax.
COMPENSATION
OF DIRECTORS
Upon becoming a
member of the Board, non-employee directors receive restricted stock awards for
500 shares of our Common Stock, and thereafter receive on an annual basis
restricted stock awards for 500 Shares if re-elected to the Board. Our
non-employee directors also receive an $8,000 quarterly fee, but do not receive
any additional amounts for Board meetings attended. Members of the Audit
Committee (other than the Chairman) receive an additional $1,500 quarterly fee
and members of the Compensation Committee receive an additional $500 quarterly
fee, respectively, for service on those committees. The Chairman of the Audit
Committee receives an additional $2,500 quarterly fee. All non-employee
directors are reimbursed for expenses incurred in connection with attending
Board and committee meetings. Employee directors of the Company do not receive
compensation for their services as directors. Mr. Steven R. Thompson,
a non-employee director, did not accept any compensation during fiscal year 2009
for his services as a director and has indicated that he will not accept any
compensation for his service as a director during the coming fiscal
year.
At the
November 18, 2008 quarterly meeting of the Board, a resolution was
unanimously adopted to reduce the fees of the directors by 10% until such time
as economic conditions permit a reinstatement of such reduction.
The following table
sets forth certain information concerning the compensation of the Company’s
non-employee directors for the fiscal year ended September 30,
2009:
|
Name
|
Fees
Earned or Paid in Cash
($)
(1)
|
Stock
Awards
($)
(2)
|
Option
Awards
($)
(2)
|
Non-Equity
Incentive Plan Compensation
($)
|
All
Other Compensation
($)(3)
|
Total
($)
|
||||||||||||||||||
|
Howard E.
Bateman
|
31,450 | 2,160 | -- | -- | 38,850 | 72,460 | ||||||||||||||||||
|
Donald P.
Baumann
|
31,450 | 2,160 | -- | -- | -- | 33,610 | ||||||||||||||||||
|
Daniel J.
Eigeman
|
35,150 | 2,160 | -- | -- | -- | 37,310 | ||||||||||||||||||
|
Charles P.
Grenier
|
35,150 | 2,160 | -- | -- | -- | 37,310 | ||||||||||||||||||
|
Steven C.
Stahlberg
|
38,850 | 2,160 | -- | -- | -- | 41,010 | ||||||||||||||||||
________________
|
(1)
|
Each
non-employee director received $8,000 in quarterly fees for the first
quarter of the fiscal year and $7,200 per quarter
thereafter. In addition to the quarterly fees, the following
committee fees were paid: Audit Committee chair- $2,500 for the first
quarter of the fiscal year and $2,250 per quarter thereafter to Mr.
Stahlberg; Audit Committee members- $1,500 for the first quarter of the
fiscal year and $1,350 per quarter thereafter to Mr. Eigeman and Mr.
Grenier; Compensation Committee members- $500 for the first quarter of the
fiscal year and $450 per quarter thereafter to Mr. Bateman and Mr.
Baumann.
|
|
(2)
|
Amount shown
for fiscal 2009 is the expense recognized in the Company’s financial
statements, without any reduction for risk of forfeiture, for each
director’s outstanding restricted stock and stock
options.
|
|
(3)
|
Included in
Other Compensation is an amount paid for consulting services. Mr. Bateman
has experience in the semiconductor industry and is paid consulting fees
for advice related to the semiconductor industry, which consulting
services is unrelated to his role as a director of the
Company.
|
Compensation
Committee Interlocks and Insider Participation
Messrs. Bateman and
Baumann, both of whom are “independent” under the applicable NASDAQ listing
standards, served on the Compensation Committee during fiscal year 2009. No
member of the Compensation Committee is or was formerly an officer or an
employee of the Company or its subsidiaries. There were no interlocks or insider
participation between any member of the Board or the Compensation Committee and
any member of the board of directors or compensation committee of another
company.
Compensation
Committee Report
The Compensation
Committee reviewed and discussed the “Compensation Discussion and Analysis”
contained in this annual report on Form 10-K with the Company’s management.
Based on our review and discussions, the Compensation Committee has recommended
to the Company’s Board that the “Compensation Discussion and Analysis” be
included in this annual report on Form 10-K for the fiscal year ended September
30, 2009.
Submitted
by the Compensation Committee
of
the Board of Directors
Howard E. Bateman,
Chairman
Donald P.
Baumann
Incorporation
by Reference
Notwithstanding
anything to the contrary set forth in any of the Company’s previous filings
under the Securities Act of 1933, as amended (the “Securities Act”), or the
Exchange Act that might incorporate future filings, including this annual report
on Form 10-K, the report of the compensation committee that appears herein shall
not be deemed to be soliciting material or to be filed with the Securities and
Exchange Commission under the Securities Act of 1933 or the Exchange Act or
incorporated by reference in any document so filed.
Item 12. Security Ownership of Certain Beneficial Owners
and Management and Related Shareholder Matters
Security
Ownership Of Certain Beneficial Owners And Management
The following table
sets forth certain information with respect to the beneficial ownership of the
Company’s Common Stock as of December 1, 2009 for (i) each person who
is known by the Company to beneficially own more than 5% of the Company’s Common
Stock, (ii) each of the Company’s directors, (iii) each of the “Named
Executive Officers” (as defined above under “Executive Compensation”) and
(iv) all directors and executive officers as a group. The address of each
of the persons in this table not otherwise provided is c/o Semitool, Inc., 655
West Reserve Drive, Kalispell, Montana 59901.
|
Name
and Address of Beneficial Owner (1)
|
Number
of Shares
Owned (#) (2)
|
Right
to Acquire
(#) (3)
|
Total
(#)
|
Percent
of
Class
(1)
|
|||||
|
Raymon F. and
Ladiene A. Thompson (4)
|
9,845,918
|
--
|
9,845,918
|
30.0
|
%
|
||||
|
Howard E.
Bateman
|
13,500
|
16,000
|
29,500
|
*
|
|||||
|
Donald P.
Baumann
|
1,500
|
9,000
|
10,500
|
*
|
|||||
|
Daniel J.
Eigeman
|
15,300
|
14,000
|
29,300
|
*
|
|||||
|
Charles P.
Grenier
|
3,500
|
9,000
|
12,500
|
*
|
|||||
|
Steven C.
Stahlberg
|
1,650
|
7,000
|
8,650
|
*
|
|||||
|
Steven R.
Thompson (5)
|
7,000
|
--
|
7,000
|
*
|
|||||
|
Larry E.
Murphy
|
48,313
|
200,000
|
248,313
|
*
|
|||||
|
Timothy C.
Dodkin
|
17,455
|
118,500
|
135,955
|
*
|
|||||
|
Larry A.
Viano
|
13,650
|
41,750
|
55,400
|
*
|
|||||
|
Herbert
Oetzlinger
|
3,250
|
54,250
|
57,500
|
*
|
|||||
|
All directors
and executive officers as a group (16 persons)
|
10,025,602
|
631,725
|
10,657,327
|
32.4
|
%
|
||||
|
Artis Capital
Management, L.P. (6)
|
2,920,000
|
--
|
2,920,000
|
8.9
|
%
|
||||
|
One Market Plaza, Spear Street
Tower, Suite 1700
|
|||||||||
|
San Francisco, CA
94105
|
|||||||||
|
Royce &
Associates, LLC (7)
|
3,279,635
|
--
|
3,279,635
|
10.0
|
%
|
||||
|
1414 Avenue of the
Americas,
|
|||||||||
|
New York, NY 10019
|
|||||||||
|
Wells Fargo
& Company (8)
|
2,951,318
|
--
|
2,951,318
|
9.0
|
%
|
||||
|
420 Montgomery
Street
|
|||||||||
|
San Francisco, CA
94104
|
|||||||||
|
T. Rowe Price
Associates, Inc. (9)
|
1,826,600
|
--
|
1,826,600
|
5.6
|
%
|
||||
|
100 E. Pratt Street
|
|||||||||
|
Baltimore, MD 21202
|
________________
|
*
|
Less than
1%
|
|
(1)
|
Beneficial
ownership is determined in accordance with the rules of the SEC. In
computing the number of shares beneficially owned by a person and the
percentage ownership of that person, shares of Common Stock subject to
options held by that person that are currently exercisable or exercisable
within 60 days of December 1, 2009 are deemed outstanding. Such shares,
however, are not deemed outstanding for the purpose of computing the
percentage ownership of each other person. Except as indicated in the
footnotes to this table and pursuant to applicable community property
laws, the persons named in the table have sole voting and investment power
with respect to the shares set forth opposite such person’s
name.
|
|
(2)
|
Excludes
shares that may be acquired through the exercise of outstanding
options.
|
|
(3)
|
Represents
shares that an individual has a right to acquire within 60 days of
December 1, 2009.
|
|
(4)
|
Includes
160,000 shares held in the name of the Floyd Foundation Trust, of which
Mr. R. Thompson is the trustee.
|
|
(5)
|
Mr. S.
Thompson is the custodian for 7,000 shares of stock held in the name of
four minor children.
|
|
(6)
|
Based on a
Schedule 13-G/A filed with the SEC on February 17, 2009, Artis Capital
Management, L.P., a California corporation, has shared voting power and
shared dispositive power with respect to 2,920,000 shares of the Company’s
Common Stock.
|
|
(7)
|
Based on a
Schedule 13-G/A filed with the SEC on January 30, 2009, Royce &
Associates, LLC, a New York corporation, has sole voting power and sole
dispositive power with respect to 3,279,635 shares of the Company’s Common
Stock.
|
|
(8)
|
Based on a
Schedule 13-G/A filed with the SEC on January 22, 2009. The Schedule 13G
was filed by Wells Fargo & Company on its own behalf and on behalf of
certain of its subsidiaries identified therein, including Wells Fargo
Bank, N.A., Wells Fargo Investments, LLC and A.G. Edwards and Sons,
LLC. Aggregate beneficial ownership reported by Wells Fargo
& Company in the Schedule 13-G/A is on a consolidated basis and
includes any beneficial ownership separately reported therein by
subsidiaries of Wells Fargo & Company. Wells Fargo & Company, a
Delaware corporation, on such a consolidated basis had aggregate
beneficial ownership with respect to 2,951,318 shares of the Company’s
Common Stock. Wells Fargo Bank, N.A., individually had sole dispositive
power of 2,009,756 shares of the Company's Common Stock and sole voting
power with respect to 88,570 share of the Company's Common
Stock.
|
|
(9)
|
Based on a
Schedule 13-G/A filed with the SEC on February 11, 2009, T. Rowe Price
Associates, Inc., a Maryland corporation, has sole voting and sole
dispositive power with respect to 1,826,600 shares of the Company’s Common
Stock.
|
Changes
in Control
We
have entered into a merger agreement with Applied Materials, Inc., pursuant to
which the Company would merge with a wholly-owned subsidiary of Applied
Materials following a tender offer and merger. The tender offer is
described in our Current Report on Form 8-K filed with the SEC on
November 17, 2009, in the Schedule TO filed by Applied Materials with the
SEC as of November 19, 2009, as subsequently amended, and the exhibits
incorporated therein, and in our Schedule 14D-9 filed with the SEC as of
November 19, 2009, as subsequently amended, and the exhibits
incorporated therein. The Schedule 14D-9 and the Schedule TO have been made
available to our shareholders by mail and are otherwise available on request
from our offices or Applied Materials.
If
the tender offer is consummated as described in the merger agreement and the
related filings made with the SEC, a change in control of the Company will occur
as described therein. The persons acquiring control, the amount of consideration
used by those persons, the basis of control, the percentage of voting securities
of the registrant to be acquired by the persons acquiring control, and the
identity of the persons from whom control would be assumed are described in the
Schedule TO and Schedule 14D-9 referred to above. The source of funds used for
the acquisition of control is the cash reserves of Applied
Materials.
Equity
Compensation Plans
The following table
summarizes our equity compensation plans as of September 30, 2009:
|
Number
of
securities
to be
issued
upon
exercise
of
outstanding
options
|
Weighted-average
exercise price
of
outstanding
options
|
Number
of securities remaining available for future issuance under stock option
plans
|
||||||||||
|
Equity
compensation plans approved by shareholders
|
1,292,781 | $8.14 | 3,207,730 | |||||||||
Item 13. Certain Relationships and Related Transactions,
and Director Independence
Certain
Relationships And Related Transactions
In
accordance with our Audit Committee Charter, our Audit Committee is responsible
for reviewing all related party transactions for potential conflicts of interest
on an ongoing basis and approving all such transactions (if such transactions
are not approved by another independent body of the Board). The following were
reportable transactions and relationships that occurred or were entered into
since the beginning of fiscal year 2009 between the Company and certain
affiliated parties:
During the fiscal
year ended September 30, 2009, the Company leased three airplanes and
an aircraft hangar from limited liability companies wholly-owned by our Chairman
and Chief Executive Officer, Mr. Thompson. Under these lease agreements,
the Company made rental payments aggregating $1.9 million during the fiscal year
ended September 30, 2009. Mr. Thompson has access to the aircraft for
personal use and any such use of the aircraft by Mr. Thompson is shown as
additional compensation to him in the Summary Compensation Table based on the
incremental cost to the Company for such use. For the fiscal year ended
September 30, 2009, the additional compensation to Mr. Thompson for
such use was $263,736 (See “Summary Compensation Table”). The Company and
Mr. Thompson terminated one of the aircraft lease agreements in July 2009
and amended the two remaining aircraft lease agreements to lower the amount of
monthly rent payable by the Company under those agreements.
The Company’s
current lease payments aggregate to $34,100 per month. The lease
terms are month-to-month. The lease amounts
were reduced in response to market conditions affecting the Company’s need for
the aircraft. The amended rates are below-market for the aircraft leased
and, consequently, are on terms more favorable to the Company than could have
been obtained from an unaffiliated party. Because the term of the leases
are month-to-month, it is not expected that the Company will be able to be
continue leasing the aircraft at those below-market rates as economic conditions
improve.
Board Independence
The Board of
Directors has affirmatively determined that all of the directors are independent
under Rule 5065(a)(2) of the Marketplace Rules of NASDAQ except for Messrs. R.
Thompson and Dodkin, who are executive officers of the Company and,
consequently, not considered “independent”, and Mr. S. Thompson, who is the son
of Mr. R. Thompson. All members of the Audit and Compensation
Committees are independent pursuant to NASDAQ listing standards and the SEC
rules.
Item 14. Principal Accounting Fees and
Services
Audit
and Non-Audit Fees
The following table
presents fees billed by Grant Thornton LLP for professional services rendered
for the fiscal years ended September 30, 2009 and 2008.
|
Fiscal
2009
|
Fiscal
2008
|
|||||||
|
Audit Fees
(1)
|
$ | 740,618 | $ | 853,824 | ||||
|
Audit-Related
Fees (2)
|
20,321 | -- | ||||||
|
Tax Fees
(3)
|
96,124 | 63,365 | ||||||
|
All Other
Fees (4)
|
-- | -- | ||||||
|
Total
|
$ | 857,063 | $ | 917,189 | ||||
________________
|
(1)
|
Audit Fees
consist of fees billed for professional services rendered for the
integrated audit of the Company’s consolidated annual financial statements
and of its internal control over financial reporting and review of the
interim consolidated financial statements included in quarterly reports
and services that are normally provided by the Company’s independent
registered public accounting firm in connection with statutory and
regulatory filings or engagements.
|
|
(2)
|
Audit-Related
Fees consist of fees billed for assurance and related services that are
reasonably related to the performance of the audit or review of the
Company’s consolidated financial statements and are not reported under
“Audit Fees.” In fiscal 2009, Audit-Related fees consisted primarily
of fees incurred for due diligence related to the Applied Materials
acquisition.
|
|
(3)
|
Tax Fees
consist of fees billed for professional services rendered for tax
compliance, tax advice and tax planning (domestic and international).
These services include assistance regarding federal, state and
international tax compliance and tax
planning.
|
|
(4)
|
All Other
Fees consist of fees for products and services other than the services
reported above.
|
Policy
on Audit Committee Pre-Approval of Audit and Non-Audit Services of Independent
Registered Public Accountants
The Audit
Committee’s policy is to pre-approve all audit and non-audit services provided
by the independent registered public accountants. These services may include
audit services, audit-related services, tax services and other services.
Pre-approval is generally provided for up to one year and any pre-approval is
detailed as to the particular service or category of services and is generally
subject to a specific budget. The Audit Committee has delegated pre-approval
authority to its Chairperson when it is necessary to expedite services. The
independent registered public accountants and management are required to
periodically report to the full Audit Committee regarding the extent of services
provided by the independent registered public accountants in accordance with
this pre-approval, and the fees for the services performed to
date. The independent registered public accountants performed
statutory audits under the de minimus exception established by the SEC in fiscal
2009 and fiscal 2008.
PART
IV
Item 15. Exhibits and Financial Statement
Schedules
|
(a)
|
The following
documents are filed as a part of this
report:
|
|
1.
|
Financial
Statements:
|
The financial
statements and reports of the independent registered public accounting firms
listed below are set forth under Item 8 of this Annual Report on Form 10-K and
are incorporated herein by reference:
Consolidated
Balance Sheets
at
September 30, 2009 and September 30, 2008
Consolidated
Statements of Operations
for the Years Ended
September 30, 2009, September 30, 2008 and September 30, 2007
Consolidated
Statements of Changes in Shareholders’ Equity
for the Years Ended
September 30, 2009, September 30, 2008 and September 30, 2007
Consolidated
Statements of Cash Flows
for the Years Ended
September 30, 2009, September 30, 2008 and September 30, 2007
Consolidated
Statements of Comprehensive Income (Loss)
for the Years Ended
September 30, 2009, September 30, 2008 and September 30, 2007
Notes to
Consolidated Financial Statements
Reports of
Independent Registered Public Accounting Firm
|
2.
|
Financial Statement
Schedules:
|
Schedule II –
Valuation and Qualifying Accounts
|
3.
|
Exhibits:
|
(a) The
exhibits listed below are filed as part of this Annual Report on Form 10-K or
are incorporated herein by reference:
|
Exhibit No.
|
Description
|
|
2.1
|
Agreement and
Plan of Merger dated as of November 16, 2009 by and among Semitool, Inc.,
Applied
Materials, Inc., and
Jupiter Acquisition Sub, Inc. (21)
|
|
2.2
|
Form of
Tender and Support Agreement (22)
|
|
3.1
|
Restated
Articles of Incorporation of the
Company (1)
|
|
3.8
|
Amendment to
the Restated Articles of Incorporation of the
Company (2)
|
|
3.9
|
Correction to
the Amendment of the Restated Articles of Incorporation of the
Company (2)
|
|
3.2
(ii)
|
Amended
Bylaws of Semitool, Inc. (3)
|
|
10.1
|
Semitool,
Inc. 2004 Stock Option
Plan (3) *
|
|
10.12
|
Agreement
between the Company and the Semitool European
Companies (1)
|
|
10.13
|
Change in
Control Severance Agreement between Larry Viano and the Company dated
August 10, 2009 (19)
|
|
10.14
|
Change in
Control Severance Agreement between Larry Murphy and the Company dated
August 10, 2009 (19)
|
|
10.15
|
Change in
Control Severance Agreement between Timothy C. Dodkin and the Company
dated
August 10,
2009 (19)
|
|
10.16
|
Change in
Control Severance Agreement between Herbert Oetzlinger and the Company
dated
August 10,
2009 (19)
|
|
10.17
|
Change in
Control Severance Agreement dated August 10,
2009 (19)
|
|
10.2/10.3
|
Aircraft
lease agreement, dated January 15, 2004, as amended by Amendment No 1,
dated March 31, 2004,
between the Company and
EAGLE I LLC (3)
|
|
10.21
|
Amendment No.
4 to Aircraft Lease between Eagle I, LLC and the Company dated August 28,
2009 (20)
|
|
10.22
|
Amendment No.
2 to Aircraft Lease between Eagle II, LLC and the Company dated August 28,
2009 (20)
|
|
10.23
|
Termination
to Aircraft Lease between Eagle III, LLC and the Company dated August 28,
2009 (20)
|
|
10.4
|
Aircraft
lease agreement, dated March 31, 2004, between the Company and EAGLE II
LLC (3)
|
|
10.41
|
Employment
Agreement between Larry A. Viano and the Company dated June 1,
2003 (4) *
|
|
10.42
|
Employment
Agreement between Timothy C. Dodkin and the Company dated June 30,
2003 (4) *
|
|
10.43
|
Employment
Agreement between Larry Murphy and the Company dated April 20,
2004 (5) *
|
|
10.44
|
Aircraft
lease agreement, dated August 22, 2004, between the Company and EAGLE III
LLC (6)
|
|
10.45
|
Credit
Agreement, dated as of November 1, 2004, between the Company and Wells
Fargo HSBC Trade Bank,
N.A. (6)
|
|
10.46
|
Loan
Agreement, dated May 17, 2005, between Raiffeisenbank Hallein and Semitool
Austria, GmbH (7)
|
|
10.47
|
First
Amendment to Credit Agreement between Wells Fargo HSBC Trade Bank, N.A.
and the Company dated
December 6,
2005 (8)
|
|
10.48
|
Executive
Bonus Plan for Larry E. Murphy, President and Chief Operating Officer
dated October 1, 2005 (9)
|
|
10.49
|
Loan
Agreement, dated August 21, 2008, between Raiffeisenbank Hallein and
Semitool Austria, GmbH
|
|
10.5
|
Supplemental
Executive Health Plan dated February 15,
2006 (10)
|
|
10.6
|
Guaranty and
Suretyship agreement dated August 15,
2006 (11)
|
|
10.7
|
Loan
Agreement, dated August 15, 2006, between Sovereign Bank, Lehigh County
Industrial Development
Authority and Rhetech, Inc.
(12)
|
|
10.8
|
Term Loan
Agreement between First Interstate Bank and the Company dated December 29,
2006 (13)
|
|
10.9
|
Semitool 2007
Stock Incentive Plan (14)
|
|
10.91
|
Semitool 2007
Non-Qualified Stock Option Award Agreement (14)
|
|
10.92
|
Semitool 2007
Stock Option Award Agreement (14)
|
|
10.93
|
Semitool 2007
Restricted Stock Bonus Award Agreement (Non-Employee Directors)
(14)
|
|
10.94
|
Semitool 2007
Restricted Stock Bonus Award Agreement (14)
|
|
10.95
|
Amendment No.
3, dated June 5, 2007, to Aircraft Lease Agreement, dated January 15,
2004,
between Eagle I, LLC and
Semitool, Inc. (15)
|
|
10.96
|
Second
Amendment to Credit Agreement between Wells Fargo HSBC Trade Bank, N.A.
and the
Company dated September 1,
2007 (16)
|
|
10.97
|
Semitool 2007
Restricted Stock Unit Award Agreement (17)
|
|
10.98
|
Third
Amendment to Credit Agreement between Wells Fargo HSBC Trade Bank, N.A.
and the Company
dated February 4, 2008
(18)
|
|
21.1
|
|
|
23.1
|
|
|
31.1
|
|
|
31.2
|
|
|
32.1
|
|
|
32.2
|
________________
|
(1)
|
Incorporated
herein by reference to the identically numbered exhibits to the Company’s
Registration Statement on
Form S-1 (File No.
33-87548), which became effective on February 2,
1995.
|
|
(2)
|
Incorporated
herein by reference to the identically numbered exhibit to the Company’s
Quarterly Report on Form 10-Q,
date of report March 31,
2000.
|
|
(3)
|
Incorporated
herein by reference to the identically numbered exhibit to the Company’s
Quarterly Report on Form 10-Q,
date of report March 31,
2004.
|
|
(4)
|
Incorporated
herein by reference to the identically numbered exhibit to the Company’s
Quarterly Report on Form 10-Q,
date of report June 30,
2003.
|
|
(5)
|
Incorporated
herein by reference to Exhibit 10.1 to the Company’s Quarterly Report on
Form 10-Q,
date of report June 30,
2004.
|
|
(6)
|
Incorporated
herein by reference to the identically numbered exhibit to the Company’s
Annual Report on Form 10-K,
date of report September
30, 2004.
|
|
(7)
|
Incorporated
herein by reference to the identically numbered exhibit to the Company’s
Quarterly Report on Form 10-Q,
date of report June 30,
2005.
|
|
(8)
|
Incorporated
herein by reference to the identically numbered exhibit to the Company’s
Quarterly Report on Form 10-Q,
date of report December 6,
2005.
|
|
(9)
|
Incorporated
herein by reference to Exhibit 10.1 to the Company’s Report on Form 8-K,
date of report October 1, 2005.
|
|
(10)
|
Incorporated
herein by reference to the identically numbered exhibit to the Company’s
Report on Form 8-K,
date of report February 15,
2006.
|
|
(11)
|
Incorporated
herein by reference to the identically numbered exhibit to the Company’s
Report on Form 8-K,
date of report August 15,
2006.
|
|
(12)
|
Incorporated
herein by reference to the identically numbered exhibit to the Company’s
Annual Report on Form 10-K,
date of report September
30, 2006.
|
|
(13)
|
Incorporated
herein by reference to the identically numbered exhibit to the Company’s
Report on Form 8-K,
date of report December 29,
2006.
|
|
(14)
|
Incorporated
herein by reference to the identically numbered exhibit to the Company’s
Quarterly Report on Form 10-Q,
date of report March 31,
2007.
|
|
(15)
|
Incorporated
herein by reference to the identically numbered exhibit to the Company’s
Report on Form 8-K,
date of report June 5,
2007.
|
|
(16)
|
Incorporated
herein by reference to the identically numbered exhibit to the Company’s
Annual Report on Form 10-K,
date of report September
30, 2007.
|
|
(17)
|
Incorporated
herein by reference to the identically numbered exhibit to the Company’s
Quarterly Report on Form 10-Q,
date of report December 31,
2007.
|
|
(18)
|
Incorporated
herein by reference to Exhibit 10.97 to the Company’s Quarterly Report on
Form 10-Q,
date of report March 31,
2008.
|
|
(19)
|
Incorporated
herein by reference to the identically numbered exhibit to the Company’s
Report on Form 8-K,
date of report August 10,
2009.
|
|
(20)
|
Incorporated
herein by reference to the identically numbered exhibit to the Company’s
Report on Form 8-K,
date of report August 28,
2009.
|
|
(21)
|
Incorporated
herein by reference to Exhibit (d)(1) to the Schedule TO of Applied
Materials, Inc. and Jupiter Acquisition
Sub, Inc. filed on
November 19, 2009.
|
|
(22)
|
Incorporated
herein by reference to Exhibit (d)(1) to the Schedule TO of Applied
Materials, Inc. and Jupiter Acquisition
Sub, Inc. filed on
November 19, 2009.
|
|
*
|
Denotes a
management contract or compensatory plan or
arrangement.
|
(b) Exhibits. The Exhibits listed in Item 15(a)(3)(a) hereof are
filed as part of this Annual Report on Form 10-K or are incorporated herein by
reference.
(c) Financial Statement
Schedules. See Item 15(a)(2) above.
Pursuant to the
requirements of Section 13 or 15(d) of the Securities Exchange Act of 1934, the
registrant has duly caused this report to be signed on its behalf by the
undersigned, thereunto duly authorized.
|
Dated: December
14, 2009
|
SEMITOOL,
INC.
|
||
|
By:
|
/s/Raymon F.
Thompson
|
||
|
Raymon F.
Thompson
|
|||
|
Chairman of
the Board and Chief Executive Officer
|
|||
|
(Principal
Executive Officer)
|
|||
Pursuant to the
requirements of the Securities Exchange Act of 1934, this report has been signed
below by the following persons on behalf of the Registrant and in the capacities
and on the dates indicated:
|
Signature
|
Title
|
Date
|
||
|
/s/Raymon F.
Thompson
|
||||
|
Raymon F.
Thompson
|
Chairman of
the Board and
|
December 14,
2009
|
||
|
Chief
Executive Officer
|
||||
|
(Principal
Executive Officer)
|
||||
|
/s/Larry A.
Viano
|
||||
|
Larry A.
Viano
|
Vice
President, Chief Financial Officer
|
December 14,
2009
|
||
|
and
Treasurer
|
||||
|
(Principal
Accounting Officer, Principal Financial Officer)
|
||||
|
/s/Howard E.
Bateman
|
||||
|
Howard E.
Bateman
|
Director
|
December 14,
2009
|
||
|
/s/Donald P.
Baumann
|
||||
|
Donald P.
Baumann
|
Director
|
December 14,
2009
|
||
|
/s/Timothy C.
Dodkin
|
||||
|
Timothy C.
Dodkin
|
Director and
Executive Vice President
|
December 14,
2009
|
||
|
/s/Daniel J.
Eigeman
|
||||
|
Daniel J.
Eigeman
|
Director
|
December 14,
2009
|
||
|
/s/Charles P.
Grenier
|
||||
|
Charles P.
Grenier
|
Director
|
December 14,
2009
|
||
|
/s/Steven C.
Stahlberg
|
||||
|
Steven C.
Stahlberg
|
Director
|
December 14,
2009
|
||
|
/s/Steven R.
Thompson
|
||||
|
Steven R.
Thompson
|
Director
|
December 14,
2009
|
SEMITOOL,
INC.
SCHEDULE
II ---- VALUATION AND QUALIFYING ACCOUNTS
For the years ended
September 30, 2009, 2008 and 2007
(Amounts in
Thousands)
|
Additions
|
||||||||||||||||||
|
Balance
at
|
Charged
to
|
Charged
|
Balance | |||||||||||||||
|
Beginning
|
Costs
and
|
to
Other
|
at End | |||||||||||||||
|
of
Period
|
Expenses
|
Accounts
|
Deductions | of Period | ||||||||||||||
|
Year ended
September 30, 2009:
|
||||||||||||||||||
|
Deducted
from asset accounts:
|
||||||||||||||||||
|
Allowance
for doubtful accounts
|
$ | 259 | $ | -- | $ | -- | $ | -- | $ | 259 | ||||||||
|
Inventory
allowance
|
4,070 | 4,521 | -- | 4,537 | 4,054 | |||||||||||||
|
Year ended
September 30, 2008:
|
||||||||||||||||||
|
Deducted
from asset accounts:
|
||||||||||||||||||
|
Allowance
for doubtful accounts
|
259 | -- | -- | -- | 259 | |||||||||||||
|
Inventory
allowance
|
3,297 | 2,330 | -- | 1,557 | 4,070 | |||||||||||||
|
Year ended
September 30, 2007:
|
||||||||||||||||||
|
Deducted
from asset accounts:
|
||||||||||||||||||
|
Allowance
for doubtful accounts
|
269 | -- | -- | 10 | 259 | |||||||||||||
|
Inventory
allowance
|
2,850 | 3,662 | -- | 3,215 | 3,297 | |||||||||||||
81