Attached files
 Atlas Investor
Presentation December 2009 Exhibit 99.2 |
 Introduction to
the Select/Atlas Team 2 Atlas Acquisition Holdings Corp. Leadership Select Staffing Leadership D. Stephen Sorensen (Chairman and CEO) o Entrepreneur and builder of the Select Staffing business from a small regional player to a ~$1.5 billion revenue national leader o Arthur Andersen, GolderThomaCressey, Mark Twain Bank o University of Chicago MBA Paul J. Sorensen (President) o Has led Select to achieving double-digit—and sometimes triple-digit—revenue growth over the last few years o Computer Sciences Corporation, Booz Allen & Hamilton o Harvard Business School MBA Jeff R. Mitchell (CFO) o Director of Financial Services at Rio Tinto o Founder of Compensation Advisors o CPA at PriceWaterhouseCoopers Fred Pachon o Claims Adjuster – Republic Indemnity o Investigator – Industrial Indemnity o Unit Claims Supervisor – Crum & Foster o Disability Manager – Western General o Regional Manager – Monarch Life o Risk manager of the year 2009 James N. Hauslein (Chairman and CEO) o Successful Operator / Business Builder o Chairman and CEO, Sunglass Hut (1987 – 2001) o Sunglass Hut sold to Luxottica Group (2001) o Private Equity Experience (1984 – 1991) o Hauslein & Company, Inc. (2001 to Present) o SPAC Experience: o Director Freedom/GLG Partners Inc: $3.4 billion merger o Director Liberty Acquisition Gaurav Burman (President) o Over 10 years of successful private equity investing o Managing Partner at Elephant Capital plc o Director – Global private equity at Dresdner Kleinwort Wasserstein (1998 – 2005) o Board member Dabur International |
 Table of
Contents 3 Transaction Highlights Overview of Select Staffing Business Overview of Transaction Summary Appendices |
 Transaction
Highlights |
 Select Staffing /
Atlas Merger Highlights 5 Quality Asset: Select Staffing is the #2 private U.S. staffing company with best-in-class
profitability and exciting growth story o ~$1.5 billion of revenue and ~$92 million of Adjusted EBITDA in 2009 o Attractively positioned in the highest growth areas of the staffing sector o Best-in-class approach to cost and risk management o Experienced consolidator in a fragmented industry Very Compelling Valuation: Transaction is priced at discounted entry valuation versus publicly traded
peers: o 9.2x 2009E Adjusted EBITDA — 43% discount to publicly traded peers o 8.2x 2010E EBITDA — 38% discount to publicly traded peers Opportune Timing: Temporary staffing sector is poised for recovery in the economy and
post-cyclical growth o Temporary staffing payrolls have been positive for the last four straight months, after 19 months of decline o Staffing company valuation trends are correlated with recovery in GDP growth De-Leveraging Story: Atlas-backed recapitalization will enable Select Staffing to pursue
future growth opportunities o Transaction reduces indebtedness by up to $250 million, bringing leverage down from: o 4.9x to 2.5x–3.1x of Total Debt/ 2010E EBITDA, depending on level of redemptions o Debt can be further reduced by $30-$40 million in 2010 with cash from operations; leverage as
low as 2.2x o The post closing balance sheet will allow Select to grow both organically and through
acquisitions |
 Overview of
Select Staffing Business |
 Select Staffing
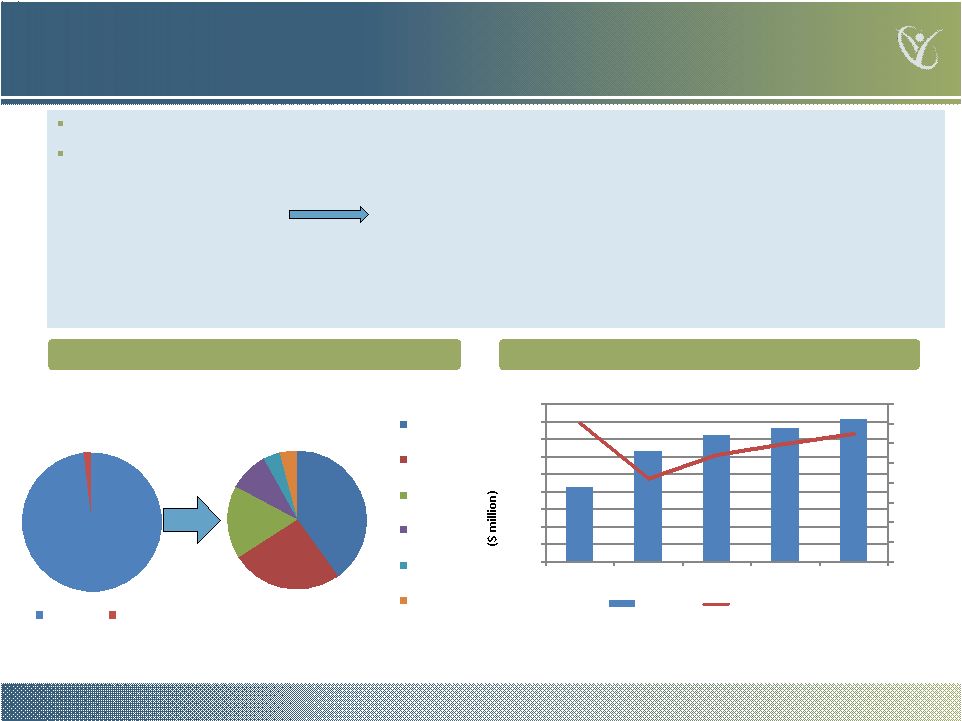
Introduction 7 Diversification Story — Revenue Contribution Revenue and EBITDA Margin (%) 40% 26% 17% 9% 4% 4% California South Midwest Northeast Central Other West 98% 2% California Other 2005 Today Note: 1Adjusted EBITDA for 2008A and 2009E Founded in 1985 and family - owned: corporate headquarters in Santa Barbara, CA Differentiated business strategy: o Large, Diverse and Loyal Customer Base o Larger Branch
Offices Industry-leading margins o Industry Best Practices Approach to Risk Management o Rapid Growth Through Acquisitions o Experienced and Proven Management Team Source: Company information 857 1,266 1,445 1,527 1,625 7.0% 4.2% 5.4% 6.0% 6.5% 0.0% 1.0% 2.0% 3.0% 4.0% 5.0% 6.0% 7.0% 8.0% 0 200 400 600 800 1,000 1,200 1,400 1,600 1,800 2006A 2007A 2008A (1) 2009E (1) 2010E Revenue EBITDA Margin(%) |
 Favorable Macro
Trends 8 Labor market is beginning to show signs of stabilization: o Temporary staffing, a leading indicator, positive for the last four straight months, after 19
months of decline o Labor Department unemployment report released on Dec 4, 2009 shows nonfarm payrolls fall by just
11,000 in November 2009, slowing sharply from 111,000 drop in October o Other leading indicators, such as hours worked and manufacturing over time rose in November as well o Staffing companies are trading at valuations reflecting strong prospects in 2010 The temporary staffing market recovery is evident in Select’s recent sales performance and
published reports by public staffing businesses Select Weekly Sales Associates on Assignment Source: Company information and US Department of Labor 2007A 2008A 2009A Linear (2009A) 2007A 2008A 2009A Linear (2009A) |
  Attractive Position
in High Growth Areas 9 Positioning in the market Select operates in the largest and highest growth segments of the staffing sector o Commercial, Financial/Accounting and Professional Employment Organization (“PEO”)
o Approximately 90% of revenue is in the Commercial segment, with projected 2010 growth rate of over
10% o Company growth assumptions conservative at 6.4% organic revenue growth for 2010 o According to the Staffing Industry Analysts: “Commercial staffing is traditionally first out of the gate in an economic recovery, and we expect this time will be no exception. While we are holding our projection of 24% contraction in commercial revenue for 2009,
we project 11% growth in 2010, greater than our projection of 6% growth for
professional. The bullish projections for commercial are driven by the industrial
segment. Although industrial still has a long way to go to recover its losses, respondents to our monthly pulse survey have noted “widespread improvement” in month-to-month sequential trends in this segment.” – October 2009 Select Staffing core business focuses on the commercial market – the fastest growing area in temporary staffing solid underpinning for 2009 and 2010 growth projections Industry Projections of Growth Rates Select % of Revenue Contribution to Select Growth Commercial 11.0% 87% 9.6% Financial / Accounting 8.0% 5% 0.4% PEO 0.0% 6% 0.0% 10.0% 2010 Company Projection 6.4% Select 2009 / 2010 industry-analysis projected growth rate in 2010 = Source: Staffing Industry Analysts Report, October and December 2009
|
 Staffing
Revenues Correlated with GDP Growth 10 Temporary employment revenue tracks GDP growth with outsize performance on an upswing Source: Staffing Industry Analysts Report, October and December 2009 Staffing sector growth is directly correlated to GDP growth GDP is forecasted to rise in 2010 Staffing Industry Analysts expect the temporary employment sector to grow by 5% overall in 2010 U.S. GDP growth (estimates and projections) 1Q09 1 2Q09 1 3Q09 1 4Q09 FY09 1Q10 2Q10 3Q10 4Q10 FY10 FY11 Philadelphia Fed (6.4)% (0.7)% 2.8% 2.7% (2.5)% 2.3% 2.4% 2.6% 2.9% 2.4% 3.1% Conference Board (6.4)% (0.7)% 2.8% 3.2% (2.4)% 1.0% 1.8% 2.1% 2.6% 2.0% na WSJ 2 (6.4)% (0.7)% 2.8% 2.9% na 2.7% 3.0% 2.9% 3.0% 2.8% na Notes: 1 Actual (release from U.S. Bureau of Economic Analysis) 2 Median of all responses 2 |
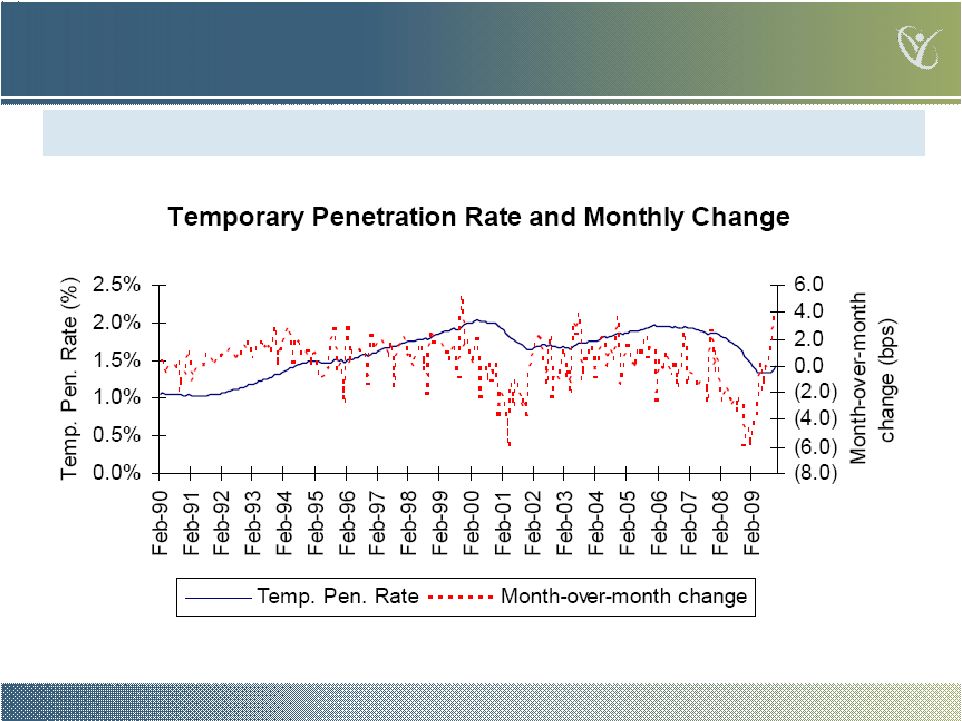 Temporary
Employment and Penetration 11 Temporary penetration on the upswing — head room for increased penetration based on recent US peak penetration rate of ~2% versus 4.8% in the UK, 2.8% in Netherlands and 2.5% in France
Source: Staffing Industry Analysts Report, December 2009 and International Labor
Organization Report |
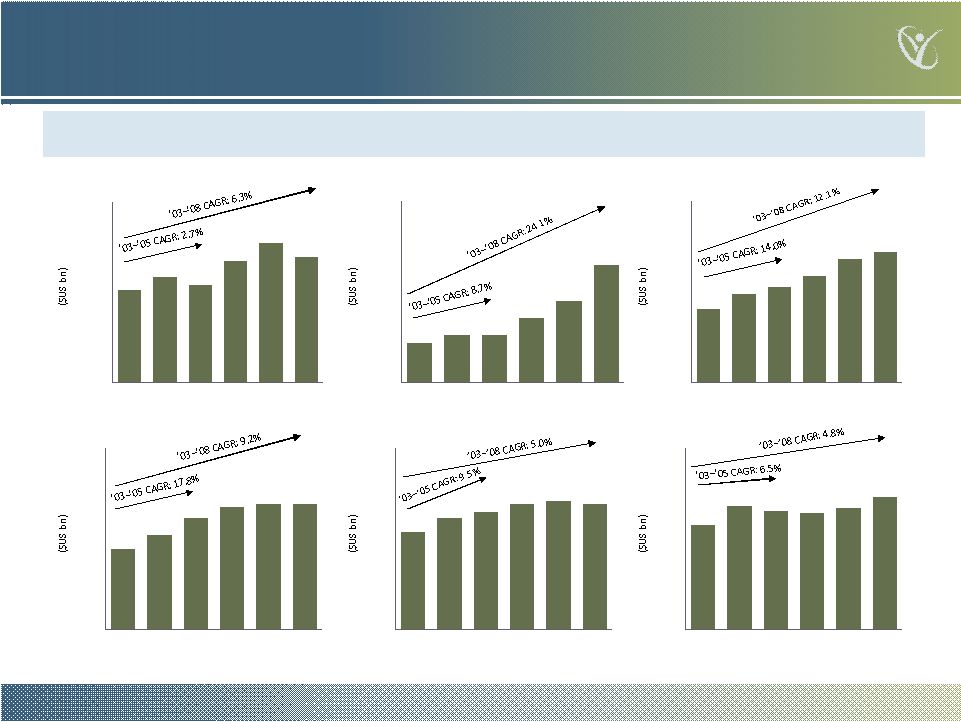 $1.7
$2.0 $2.0 $1.9 $2.0 $2.2 $ -- $1.0 $2.0 $3.0 2003 2004 2005 2006 2007 2008 $4.3 $4.9 $5.2 $5.5 $5.7 $5.5 $ -- $2.0 $4.0 $6.0 $8.0 2003 2004 2005 2006 2007 2008 $0.9 $1.0 $1.2 $1.3 $1.4 $1.4 $ -- $1.0 $2.0 2003 2004 2005 2006 2007 2008 $12.2 $14.7 $15.8 $17.6 $20.5 $21.6 $ -- $10.0 $20.0 $30.0 2003 2004 2005 2006 2007 2008 $6.6 $7.8 $7.8 $10.8 $13.4 $19.5 $ -- $10.0 $20.0 $30.0 2003 2004 2005 2006 2007 2008 $20.5 $23.4 $21.6 $26.9 $30.8 $27.8 $ -- $10.0 $20.0 $30.0 $40.0 2003 2004 2005 2006 2007 2008 Strong Expected Growth out of a Downturn Adecco Randstad 1 Manpower Trueblue Kelly Services Spherion Coming out of the previous economic cycle, the staffing sector experienced robust revenue
growth Note: 1 Randstad not pro forma for the Vedior acquisition for comparability purposes with prior periods 12 Source: Company information |
  Best-in-Class EBITDA Margins 13 Demonstrated track record of sustained growth and best-in-class profitability Successful integration of key acquisitions — consistently delivering operational savings and reductions ahead of schedule and budget Value created through cost savings; industry leading safety practices and cost-saving
aggressive early settlement of claims Highly disciplined approach to cash
generation o Best - in - class profitability – 2009E Adjusted EBITDA margin of 6.0% vs. a mean of 2.4% for the core peers o DSO of 39 days as of September 6, 2009, 14 days less than average of the core peers Notable lack of customer concentration – top 10 clients accounted for just 9.8% of 2009 YTD revenue 2009E and 2010 EBITDA Margin A/R Days Sales Outstanding (“DSO”) Source: Company information and Capital IQ |
 Best-in-Class Cost Management SG&A as % of Revenues Source: Company information and Capital IQ Proactive cost management insures margin stability: $18 million of reduction in gross profit in
nine months of 2009 were offset by $17 million of SG&A reduction during the same
period Fortress branch strategy oFocus on EBITDA
delivery at branch (not just gross margin) oBarbell strategy: 3-4
“price competitive” anchor enterprise customers + many higher margin,
mid-size customers o Enhances revenue stability o Leverages fixed costs o Maximizes branch profitability Potential for operating leverage at branch and corporate levels oSuperior customer
retention and new client recruitment o Select’s 104-person sales force landed 7,000 new accounts in 2008; 5,621 in 2009 YTD
(through 10/31) o Successful retention: 75% of 20 largest clients in 2004 were still customers in 2008 o Average relationship term of Select’s top 10 customers is 6 years 14 2008 YTD 2009 |
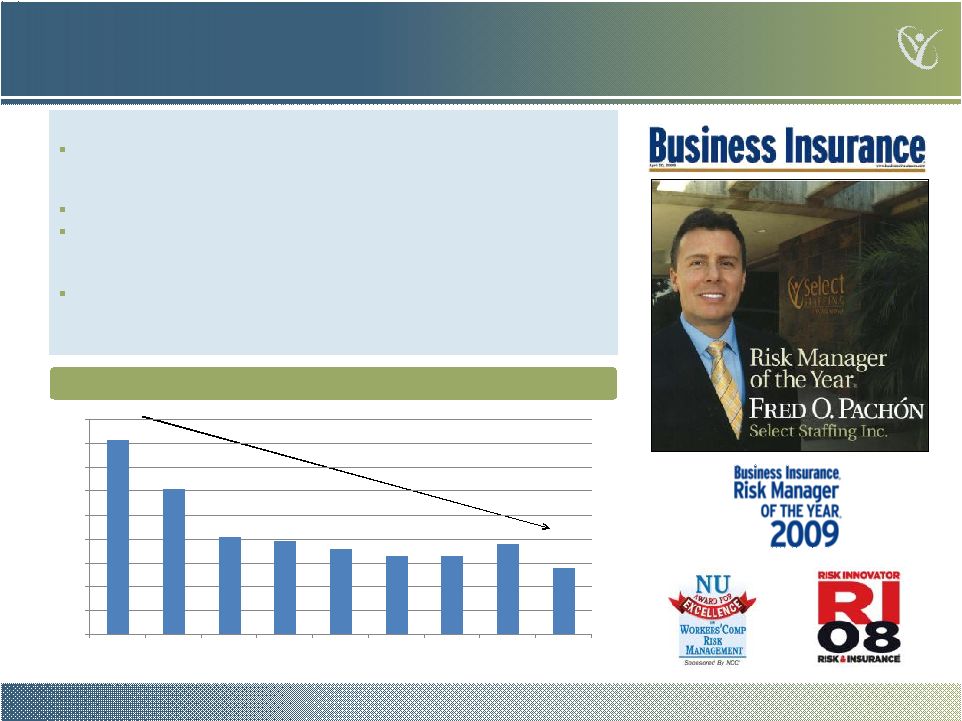 Best-in-Class Risk Management Best-in-class approach to risk management Select is the low cost leader despite 40% sales concentration in the state California, which is the 6th most expensive state in the U.S. for employer expenditure on Workers Comp at $1.28 / $100 of wages Named Risk Manager of the Year for 2009 by Business Insurance magazine Select has achieved a 65% reduction in injury frequency from 2001 to YTD 2009 o Pro-active, incentive based, post-injury cost containment program Smallest % of workers’ compensation expense amongst peer group o Pro-active liability management approach o Incentive programs to employees with the best safety record Injury Rate Comparison for Select (per 100,000 billable hours) Source: Company information and Morgan Stanley Investment Banking 8.1 6.1 4.1 3.9 3.6 3.3 3.3 3.8 2.8 0 1 2 3 4 5 6 7 8 9 2001 2002 2003 2004 2005 2006 2007 2008 YTD 2009 15 |
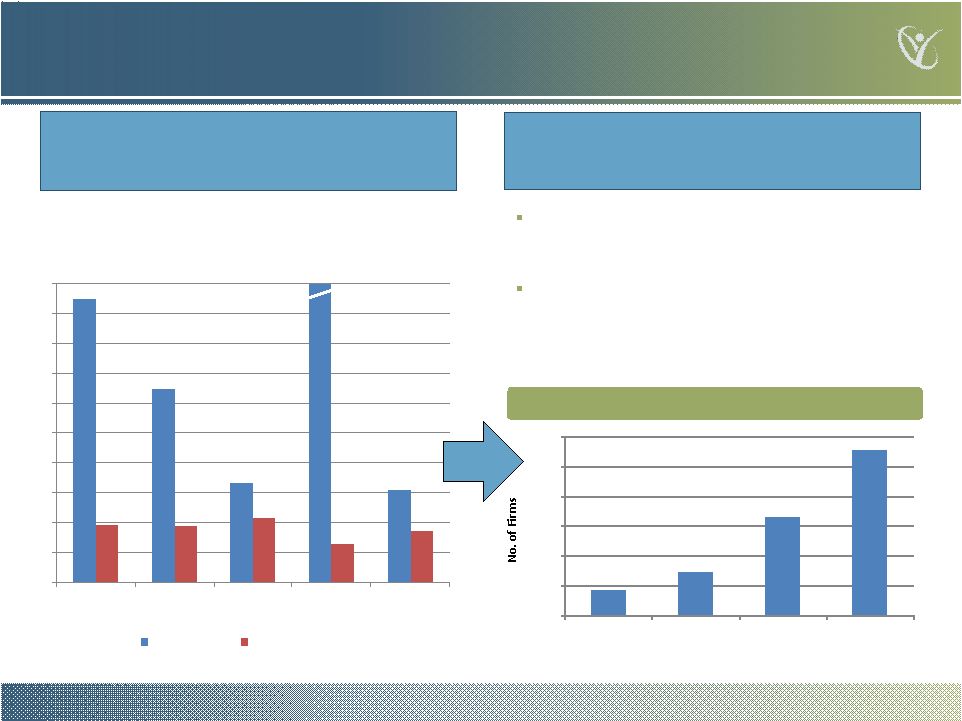  19.0x
13.0x 6.6x 6.1x 3.8x 3.8x 4.3x 2.6x 3.4x 0.0x 2.0x 4.0x 6.0x 8.0x 10.0x 12.0x 14.0x 16.0x 18.0x 20.0x RemedyTemp - May 06 Albest - June 2007 Tandem - Oct 2007 Resolve - Jan 2008 Westaff - Mar 2009 TEV/EBITDA Acquisition Multiple (x) Pre-Synergies Post-Synergies Experienced Consolidator of Fragmented Space Select is an experienced industry consolidator with a proven track record of creating value from acquisitions through operational restructuring Source: Staffing Industry Report 2009 – May 2009, Morgan Stanley Investment Banking and Company information Staffing market size ~ $320Bn of revenue worldwide and ~$100Bn in U.S., with top 10 global players capturing only ~1/3 of total revenue Industry is ripe for consolidation o Over 100 companies having revenues of $100+ million Worldwide staffing market remains highly fragmented, creating numerous opportunities for future acquisitions 284.0x Largest US Staffing Firms by Revenue 16 17 29 66 111 0 20 40 60 80 100 120 $1bn + $ 500mm + $ 200mm + $ 100mm + Revenue ($mm) |
 Overview of
Transaction |
 Select Staffing
/ Atlas Merger Highlights 18 Atlas is acquiring 100% of Select Staffing for newly issued Atlas shares Select Staffing is valued at $840 million at closing (pre earnout) Select Staffing is valued at 2010E EBITDA multiple of 8.2 x vs. 13.2x for publicly traded core comparable companies o 25.8 million Atlas warrants will be exchanged for 1.677 million Atlas Shares o Atlas founders will surrender/cancel 1.0 million shares Atlas cash of up to $185 million will de-lever the Select Staffing balance sheet by up to $250 million of debt $92 million of Second Lien debt is repaid with $25 million of Atlas cash and 7.0 million newly-issued Atlas shares First Lien debt and revolver will be reduced by up to $160 million with the balance of Atlas
cash Ownership is 44.7% Atlas, 43.1% Select Staffing and 12.2% Second Lien debt holders (pre earnout and no redemption) Select Shareholders have an opportunity to earn additional shares through the earnout plan as follows: o EBITDA-based earnout: up to 6.0 million shares if 2010 audited EBITDA between $98 mm and $113 mm o 2010 Stock Performance-based earnout: 2.0 mm shares when stock trades at or above $15/share for 20/30 trading days before April 2011 o Shares obtained under Stock-Performance-based earnout would be credited against shares received through EBITDA-based earnout 1 3 2 Note: 1 Multiple pro forma for 3.2 million of earnout shares (valued at $10/share issue price) for
projected $106 million of EBITDA in 2010. Post earnout TEV = $872 million 2 Remaining $8 million of Second Lien debt may exercise a right to
receive 0.8 million newly-issued Atlas shares 3
If remaining Second Lien exercise the right to receive 0.8 million shares, ownership will be:
44.1% Atlas, 42.5% Select Staffing and 13.4% Second Lien debt holders 4 Expires 45 days after Select files its annual report on Form
10-k with respect to the fiscal year ending December 26, 2010 4 |
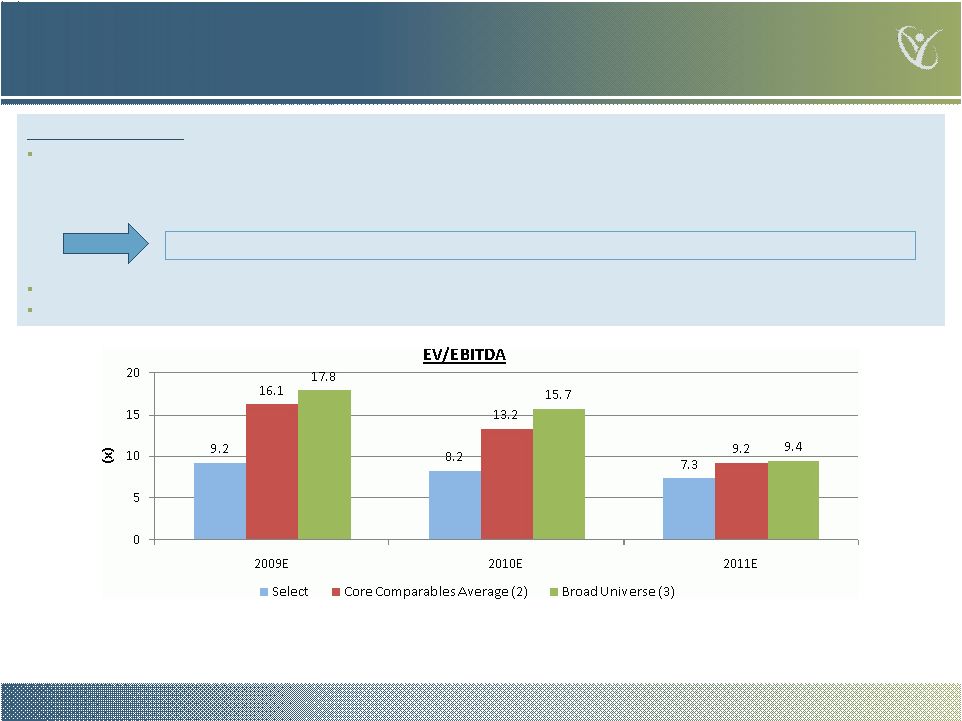 Attractive
Valuation Relative to Peers 19 Attractive Valuation: Implied multiple of 8.2x¹2010E EBITDA; Total Enterprise Value of $840 million at closing (pre earnout) o Core Public comparables (Adecco, Manpower, Randstad, Spherion and True Blue) trade at a mean of
13.2x 2010E EBITDA o Core Public comparables 2010E multiples based on current forecasts Select transaction valuation is attractive on both forward and trailing multiple basis; pre- and post-earnout Select is valued at an implied multiple of 9.2x 2009E EBITDA, compared to a core comparable companies’ mean value of 16.1x 2009E EBITDA Select is valued at an implied multiple of 7.3x¹2011E EBITDA, compared to a core comparable companies’ mean value of 9.2x 2011E EBITDA Source: Company information and Capital IQ Note: 1Multiple pro forma for 3.2 million of earnout shares (valued at $10/share issue price) for
projected $106 million of EBITDA in 2010. Post earnout TEV = $872 million 2Core
Comparables Average includes: Adecco, Manpower, Randstad, Spherion and True Blue. Excluding from the comparables average are Kelly Services, Resources Connection and Robert Half 3Includes all comparables mentioned above |
  Attractive
Valuation Pre- and Post-Earnout Note: 1Assuming 0% Redemption 2Ownership based on $518 million of closing debt; maximum closing debt per closing condition
of merger agreement of $528 million Pro Forma for full earnout does not change implied 2010E EV/EBITDA multiple materially, and results in a maximum dilution of 4.2% for Atlas shareholders If full earnout EBITDA levels are achieved, this will allow Select to de-lever faster thereby increasing
equity value 20 Valuation ($mm, unless stated) Transaction EV 2010E EBITDA Implied 2010E EV/EBITDA (x) 2010E EV /EBITDA for Core Comparables At Close 1 Pro Forma for 2010E EBITDA Earnout 1 Pro Forma for Full Earnout 1 Ownership (mm, unless stated) Shares (mm) % Ownership Shares (mm) % Ownership Shares (mm)% Ownership Atlas Shareholders 25.7 44.7% 25.7 42.4% 25.7 40.5% Select Shareholders 24.7 43.1% 27.9 46.1% 30.7 48.5% Second Lien Shareholders 7.0 12.2% 7.0 11.6% 7.0 11.0% Total 57.4 100.0% 60.6 100.0% 63.4 100.0% 8.0x 13.2x 7.9x 8.2x 13.2x 13.2x Pro Forma for 2010E EBITDA Earnout 1 $840 $872 $106 $106 Pro Forma for Full Earnout 1 $900 $113 At Close 1 |
 Illustrative
Share Price Analysis 2009E Mean EV/EBITDA for comparables 2010E Mean EV/EBITDA for comparables 21 (numbers are in millions, except per share price) 2009 Multiples 2010 Multiples EV/EBITDA Multiple 10.0x 12.0x 14.0x 16.1x 10.0x 12.0x 13.2x 16.0x Share Price 11.34 $ 14.54 $ 17.14 $ 20.38 $ 13.10 $ 16.35 $ 18.41 $ 23.24 $ Warrant Value (1) 0.74 $ 0.95 $ 1.11 $ 1.32 $ 0.85 $ 1.06 $ 1.20 $ 1.51 $ Unit Value 12.08 $ 15.49 $ 18.25 $ 21.71 $ 13.95 $ 17.41 $ 19.61 $ 24.75 $ Calculations: Adjusted EBITDA 91.7 $ (FY 2009 Estimate) 106.0 $ (FY 2010 Projection) Enterprise Value 917 $ 1,101 $ 1,284 $ 1,477 $ 1,060 $ 1,272 $ 1,399 $ 1,696 $ Debt at closing (2) (266) $ (266) $ (266) $ (266) $ (266) $ (266) $ (266) $ (266) $ Equity Value at closing 651 $ 835 $ 1,018 $ 1,211 $ 794 $ 1,006 $ 1,133 $ 1,430 $ Number of shares outstanding (3)(4) 57.4 57.4 59.4 59.4 60.6 61.5 61.5 61.5 Notes: (1) Warrant value reflects value of equity issued to retire one Atlas warrant (2) Debt at closing reflects 0% redemption case and is based on $518mm of debt at closing
(3) Number of shares outstanding for 2009 includes 2 million earn out shares if illustrated
share price is above $15.00 (4) Number of shares outstanding for 2010 includes 2 million
of earn out shares if projected share price is above $15.00. Also includes EBITDA based earn out shares, which are calculated as follows: For every $1 million incremental EBITDA beyond $98 million, Select earns 400,000 shares (if share
price earn out is not earned) or 266,667 Shares (if share price based earn out
are earned). Total earn out shares are capped at 6 million shares |
  Value Creation
through De-Leveraging - Illustrative $185 million of Atlas cash and 7.0 million of shares will be used to reduce Select debt load by up
to $250 million Leverage is down 5.6x to 2.9x 2009E EBITDA and 4.9x to 2.5x 2010E
EBITDA Outstanding indebtedness can be further reduced in 2010 by estimated $30 – $40 million cash flow from operations, which would further reduce leverage from 2.5x to 2.2x 22 0% Redemption 15% Redemption 30% Redemption Atlas Investment Atlas Investment Atlas Investment ($mm, unless stated) Before Cash Shares (mm) After 1 Cash Shares (mm) After 1 Cash Shares (mm) After 1 Revolver $15.0 ($15.0) - $0.0 ($15.0) - $0.0 ($15.0) - $0.0 First Lien $391.0 ($145.0) $246.0 ($115.0) $276.0 ($85.0) $306.0 Second Lien $100.0 ($25.0) 7.0 2 $8.0 ($25.0) 7.0 2 $8.0 ($25.0) 7.0 2 $8.0 Unsecured Debt $12.0 - - $12.0 - - $12.0 - - $12.0 Total Debt $518.0 ($185.0) $266.0 ($155.0) $296.0 ($125.0) $326.0 2009E EBITDA $91.7 2010E EBITDA $106.0 Leverage (x): 2009E 5.6x 2.9x 3.2x 3.6x 2010E 4.9x 2.5x 2.8x 3.1x Note: 1 Assuming 0% Redemption 2 Remaining $8 million of Second Lien debt may exercise a right to receive 0.8 million
newly-issued Atlas shares 3 Analysis assumes $518 million of closing debt; maximum closing debt per closing condition of
merger agreement of $528 million |
 Summary
|
 Conclusion
Quality Asset —#2 private U.S. staffing company with best-in-class profitability
and an exciting growth story Very Compelling Valuation — ~40% EV/EBITDA multiple discount over comparables Opportune Timing — Temporary staffing sector recovering De-Leveraging Story — Leverage reduced from 4.9x to 2.5x – 3.1x 2010E EBITDA, depending on level of redemptions Select Staffing’s outstanding industry performance and market-leading metrics, combined with Atlas’ cash infusion and Atlas-backed recapitalization will create a superior public company equity investment opportunity 24 |
 Appendix |
 Select
Staffing Financials |
 Selected Summary
Financials 27 Source: Company information ($mm) FY 2008A FY 2009E 1,2 FY 2010E 2 FY 2011E Revenue $1,445.5 $1,526.9 $1,625.1 $1,782.6 COGS 1,177.6 81.5% 1,267.8 83.0% 1,338.6 82.4% 1,464.8 82.2% Gross Margin 267.9 18.5% 259.1 17.0% 286.5 17.6% 317.8 17.8% Licensees' Share of gross margin 22.8 1.6% 27.0 1.8% 30.0 1.8% 32.8 1.8% Total Gross Margin 245.1 17.0% 232.1 15.2% 256.5 15.8% 284.9 16.0% SG&A 173.4 12.0% 155.8 10.2% 150.5 9.3% 165.7 9.3% Reported EBITDA $71.7 5.0% $76.3 5.0% $106.0 6.5% $119.3 6.7% Non-recurring SG&A (3) 7.0 0.5% 15.4 1.0% - - - - Adjusted EBITDA $78.7 5.4% $91.7 6.0% $106.0 6.5% $119.3 6.7% (1) 2009 Adjusted EBITDA includes YTD GAAP EBITDA, company's Q4 EBITDA forecast, adjustments for
non-recurring acquisition related expenses and full year effect of acquisitions (2)
Does not reflect the costs associated with the Atlas/Select merger (3) Adjusted EBITDA
in 2008 and 2009 is pro forma for non-recurring SG&A expenses which represent cost savings achieved post acquisitions. Non-recurring SG&A costs include the following: (a) One time costs related to acquisitions such as legal fees,severance, consulting fees,
etc. (b) Cost savings achieved due to reduction in costs such as salary of
terminated employees, rent for discontinued locations etc. |
 Valuation |
 Selected
Trading Comparables — Core 29 Source: Capital IQ and Company information (In $mm, except per share
data) Stock Price Market Enterprise Revenue EBITDA EPS Trading Data and Size 12/8/09 Cap Value 2009E 2010E 2011E 2009E 2010E 2011E 2009E 2010E 2011E Adecco SA 54.89 9,561 10,489 21,616 22,963 24,707 677 825 1,087 2.22 2.43 3.43 Randstad Holding NV 48.82 8,277 9,986 18,200 18,175 19,509 558 630 834 1.69 2.08 2.96 Manpower Inc. 55.24 4,334 4,042 15,770 16,477 18,493 222 269 429 0.73 1.09 2.41 TrueBlue, Inc. 13.64 598 502 1,004 1,019 1,096 29 37 59 0.20 0.29 0.61 Spherion Corp. 6.10 310 322 1,665 1,677 1,827 27 36 52 -0.07 0.05 0.19 Select Staffing - - - 840 1,527 1,625 1,783 92 106 119 - - - Total Debt/ EBITDA Margin TEV/Revenue TEV/EBITDA P/E Multiples LTM EBITDA 2009E 2010E 2011E 2009E 2010E 2011E 2009E 2010E 2011E 2009E 2010E 2011E Adecco SA 2.4x 3.1 3.6 4.4 0.49 0.46 0.42 15.5x 12.7x 9.6x 24.7x 22.6x 16.0x Randstad Holding NV 4.8 3.1 3.5 4.3 0.55 0.55 0.51 17.9 15.8 12.0 28.8 23.5 16.5 Manpower Inc. 2.5 1.4 1.6 2.3 0.26 0.25 0.22 18.2 15.0 9.4 nm 50.8 22.9 TrueBlue, Inc. nm 2.9 3.6 5.4 0.50 0.49 0.46 17.1 13.7 8.6 nm 46.6 22.5 Spherion Corp. 0.6 1.6 2.1 2.8 0.19 0.19 0.18 12.0 9.0 6.2 nm nm 32.1 Median 2.4 2.9 3.5 4.3 0.49 0.46 0.42 17.1 13.7 9.4 26.8 35.0 22.5 Mean 2.6 2.4 2.9 3.8 0.40 0.39 0.36 16.1 13.2 9.2 26.8 35.9 22.0 |
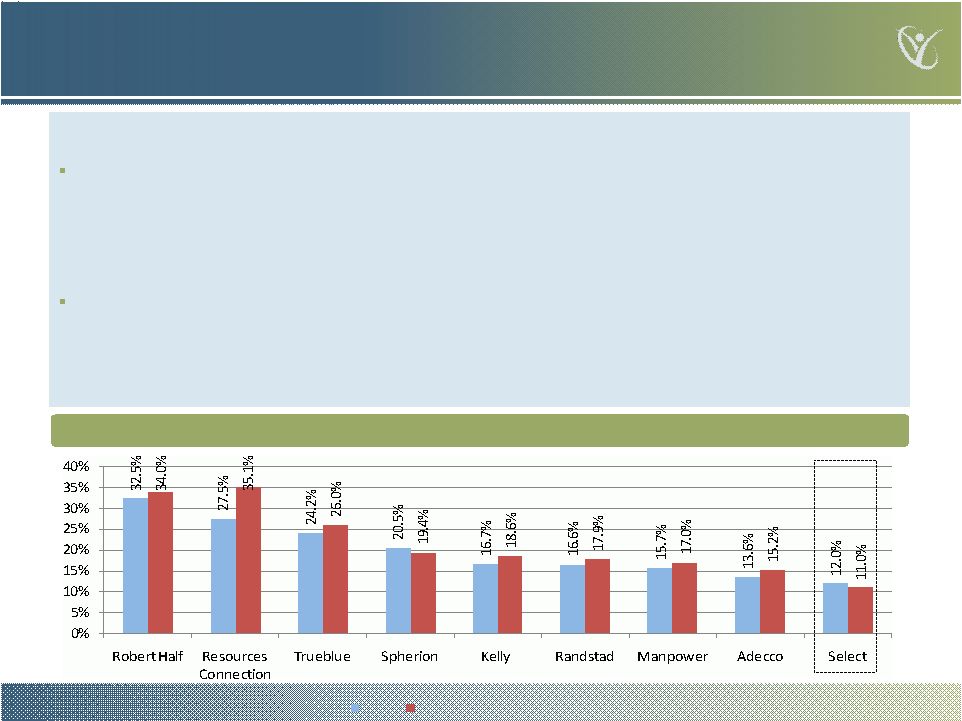
 Selected Trading
Comparables — Broad Universe 30 Source: Capital IQ and Company information (In $mm, except per share data) Stock Price Market Enterprise Revenue EBITDA EPS Trading Data and Size 12/8/09 Cap Value 2009E 2010E 2011E 2009E 2010E 2011E 2009E 2010E 2011E Adecco SA 54.89 9,561 10,489 21,616 22,963 24,707 677 825 1,087 2.22 2.43 3.43 Randstad Holding NV 48.82 8,277 9,986 18,200 18,175 19,509 558 630 834 1.69 2.08 2.96 Manpower Inc. 55.24 4,334 4,042 15,770 16,477 18,493 222 269 429 0.73 1.09 2.41 TrueBlue, Inc. 13.64 598 502 1,004 1,019 1,096 29 37 59 0.20 0.29 0.61 Kelly Services Inc. 11.61 406 396 4,170 4,277 4,416 (39) 27 58 -1.26 -0.25 0.25 Spherion Corp. 6.10 310 322 1,665 1,677 1,827 27 36 52 -0.07 0.05 0.19 Robert Half International Inc. 25.31 3,821 3,415 3,004 2,954 1,827 131 176 52 0.21 0.37 0.19 Resources Connection Inc. 20.40 927 770 530 538 3,493 8 31 311 -0.10 0.23 0.93 Select Staffing - - - 840 1,527 1,625 1,783 92 106 119 - - - Total Debt/ EBITDA Margin TEV/Revenue TEV/EBITDA P/E Multiples LTM EBITDA 2009E 2010E 2011E 2009E 2010E 2011E 2009E 2010E 2011E 2009E 2010E 2011E Adecco SA 2.4x 3.1 3.6 4.4 0.49 0.46 0.42 15.5x 12.7x 9.6x 24.7x 22.6x 16.0x Randstad Holding NV 4.8 3.1 3.5 4.3 0.55 0.55 0.51 17.9 15.8 12.0 28.8 23.5 16.5 Manpower Inc. 2.5 1.4 1.6 2.3 0.26 0.25 0.22 18.2 15.0 9.4 nm 50.8 22.9 TrueBlue, Inc. nm 2.9 3.6 5.4 0.50 0.49 0.46 17.1 13.7 8.6 nm 46.6 22.5 Kelly Services Inc. nm nm 0.6 1.3 0.09 0.09 0.09 nm 14.7 6.8 nm nm 47.0 Spherion Corp. 0.6 1.6 2.1 2.8 0.19 0.19 0.18 12.0 9.0 6.2 nm nm 32.1 Robert Half International Inc. 0.0 4.4 6.0 2.8 1.14 1.16 1.87 26.0 19.4 11.0 nm nm 27.2 Resources Connection Inc. nm 1.5 5.7 8.9 1.45 1.43 0.22 nm 25.0 11.6 nm nm 29.5 Median 2.4 2.9 3.5 3.6 0.49 0.47 0.32 17.5 14.9 9.5 26.8 35.0 25.1 Mean 2.1 2.6 3.3 4.0 0.58 0.58 0.50 17.8 15.7 9.4 26.8 35.9 26.7 |
 Transaction
Details |
 Illustrative Pro Forma Capitalization 32 Note: 1Share count is based on forecasted $518 million of debt at closing; level of debt at closing will
determine amount of shares issued to Select Shareholders Shares % of Common % with Earnout Shares % of Common % with Earnout Shares % of Common % with Earnout Common to Select Shareholders¹ 24,723,000 43.1% 39.0% 24,723,000 45.4% 40.9% 24,723,000 48.1% 43.1% Common Shares to Second Lien holders 7,000,000 12.2% 11.0% 7,000,000 12.9% 11.6% 7,000,000 13.6% 12.2% Sub-Total Newly Issued Shares 31,723,000 31,723,000 31,723,000 Atlas Shareholders and Warrant holders 25,677,000 44.7% 40.5% 22,677,000 41.7% 37.5% 19,677,000 38.3% 34.3% Total Outstanding Shares at Closing 57,400,000 100.0% 90.5% 54,400,000 100.0% 90.1% 51,400,000 100.0% 89.5% Select Earn Out Shares 6,000,000 9.5% 6,000,000 9.9% 6,000,000 10.5% Total Outstanding Shares post Earnout 63,400,000 100.0% 100.0% 60,400,000 100.0% 100.0% 57,400,000 100.0% 100.0% Debt at Closing (266,000,000) $ (296,000,000) $ (326,000,000) $ Total EV at Atlas Share Price of $10.00 840,000,000 $ 840,000,000 $ 840,000,000 $ EV/EBITDA Multiple of 2009 Estimated EBITDA of $91.7 million 9.16x 9.16x 9.16x $91,720,000.00 No Redemption 15% Redemption 30% Redemption |
 Thank
You |