Attached files
| file | filename |
|---|---|
| 8-K - 8-K - Duke Energy Ohio, Inc. | a09-35222_18k.htm |
Exhibit 99.1
|
|
Commercial Power Supplemental Information December 2009 |
|
|
2 SAFE HARBOR STATEMENT Some of the statements in this document concerning future company performance will be forward-looking within the meanings of the securities laws. Actual results may materially differ from those discussed in these forward-looking statements, and you should refer to the additional information contained in Duke Energy’s 2008 Form 10-K filed with the SEC and our other SEC filings concerning factors that could cause those results to be different than contemplated in this document. REG G DISCLOSURE In addition, this document includes certain non-GAAP financial measures as defined under SEC Regulation G. A reconciliation of those measures to the most directly comparable GAAP measures is available on our Investor Relations website at www.duke-energy.com. |
|
|
Objectives 3 The objectives of this presentation are to provide supplemental information on our Commercial Power and Duke Energy Ohio businesses. |
|
|
Redefining Our Boundaries Ohio Regulatory Environment • 1999 Deregulation • The goal of deregulation was a fully competitive electric market • Functionally separated generation from transmission and distribution • Generation became deregulated and transmission and distribution remained regulated • Generation rates • Ensure stable rates to customers; • Maintain solvent utilities; and • Introduce competition for generation Principles of Deregulation in Ohio: 4 RSP Effective (nonresidential) Senate Bill 221 Signed 2005 2008 ESP Effective 2009 Deregulation Passed 1999 2006 RSP Effective (residential) Market Development Period (All Rates Frozen) • All rates frozen from Jan. 1, 2000 to Dec. 31, 2004 • Rate Stabilization Plan (RSP) – Jan. 1, 2005 to Dec. 31, 2008 • Electric Security Plan (ESP) – Jan. 1, 2009 to Dec. 31, 2011 • Senate Bill 221 signed on May 1, 2008 (required ESP filing; optional Market Rate Option (MRO)) Ohio Deregulation Time Line |
|
|
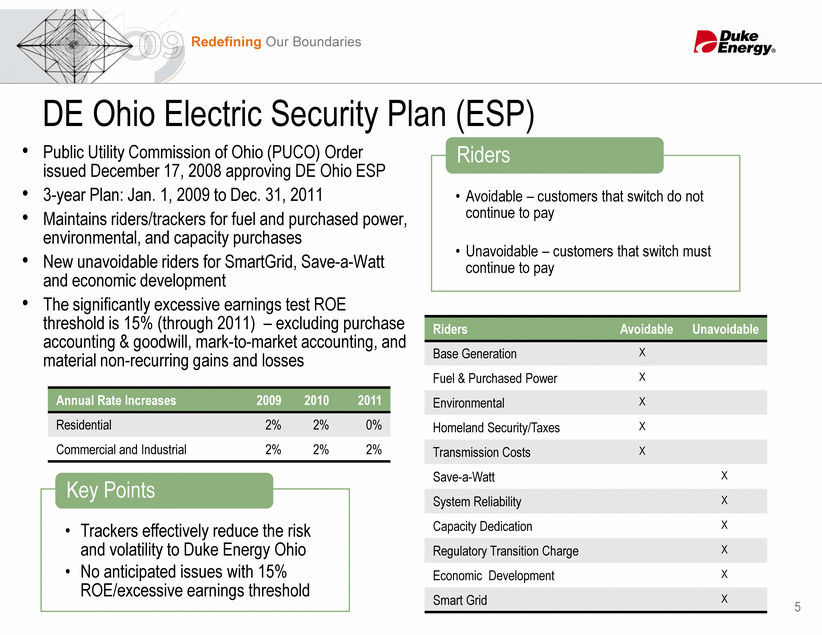
Redefining Our Boundaries DE Ohio Electric Security Plan (ESP) • Public Utility Commission of Ohio (PUCO) Order issued December 17, 2008 approving DE Ohio ESP • 3-year Plan: Jan. 1, 2009 to Dec. 31, 2011 • Maintains riders/trackers for fuel and purchased power, environmental, and capacity purchases • New unavoidable riders for SmartGrid, Save-a-Watt and economic development • The significantly excessive earnings test ROE threshold is 15% (through 2011) – excluding purchase • Avoidable – customers that switch do not continue to pay • Unavoidable – customers that switch must continue to pay Riders 5 accounting & goodwill, mark-to-market accounting, and material non-recurring gains and losses Annual Rate Increases 2009 2010 2011 Residential 2% 2% 0% Commercial and Industrial 2% 2% 2% Riders Avoidable Unavoidable Base Generation X Fuel & Purchased Power X Environmental X Homeland Security/Taxes X Transmission Costs X Save-a-Watt X System Reliability X Capacity Dedication X Regulatory Transition Charge X Economic Development X Smart Grid X • Trackers effectively reduce the risk and volatility to Duke Energy Ohio • No anticipated issues with 15% ROE/excessive earnings threshold Key Points |
|
|
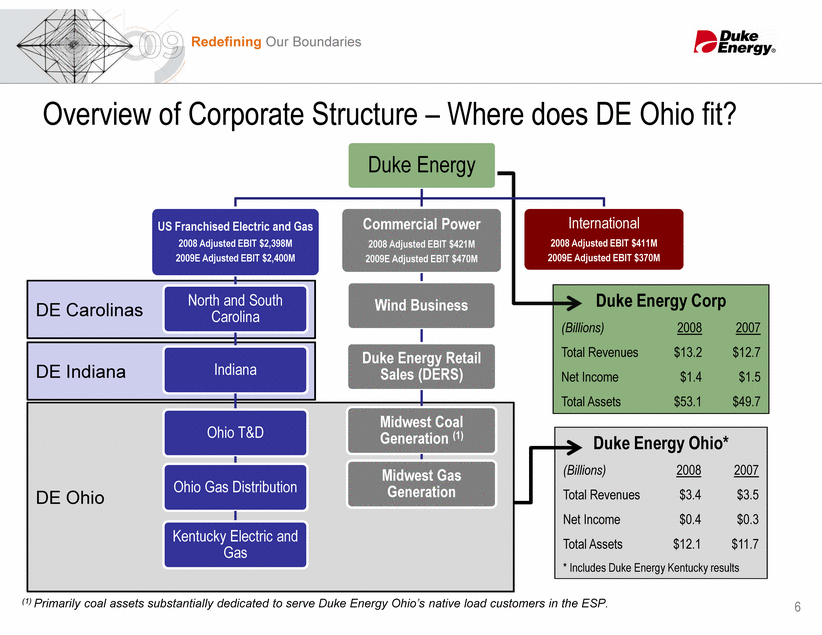
Redefining Our Boundaries Duke Energy Corp DE Carolinas Overview of Corporate Structure – Where does DE Ohio fit? Duke Energy US Franchised Electric and Gas 2008 Adjusted EBIT $2,398M 2009E Adjusted EBIT $2,400M North and South Carolina Commercial Power 2008 Adjusted EBIT $421M 2009E Adjusted EBIT $470M Wind Business International 2008 Adjusted EBIT $411M 2009E Adjusted EBIT $370M Duke Energy Ohio* (Billions) 2008 2007 Total Revenues $3.4 $3.5 Net Income $0.4 $0.3 Total Assets $12.1 $11.7 * Includes Duke Energy Kentucky results (Billions) 2008 2007 Total Revenues $13.2 $12.7 Net Income $1.4 $1.5 Total Assets $53.1 $49.7 DE Ohio DE Indiana 6 (1) Primarily coal assets substantially dedicated to serve Duke Energy Ohio’s native load customers in the ESP. Indiana Ohio T&D Ohio Gas Distribution Kentucky Electric and Gas Duke Energy Retail Sales (DERS) Midwest Coal Generation (1) Midwest Gas Generation |
|
|
7 How is DE Ohio revenue reported on the Income Statement? Commercial Power US Franchised Electric & Gas Midwest Gas Generation Midwest Coal Generation (1) Ohio Transmission and Distribution Ohio Gas Distribution DE Ohio Regulated Non-Regulated Regulated Electric Regulated Natural Gas Native load (ESP2): Regulated Electric Non-Regulated Electric Kentucky Electric Kentucky Gas Regulated Electric Regulated Natural Gas - Dedicated to serve Duke Energy Ohio’s native load customers in the ESP. - Upon adoption of FAS 71 in December 2008. Revenue classification on SEC financial statements Revenue classification on SEC financial statements Non-Native (wholesale): Non-Regulated Electric |
|
|
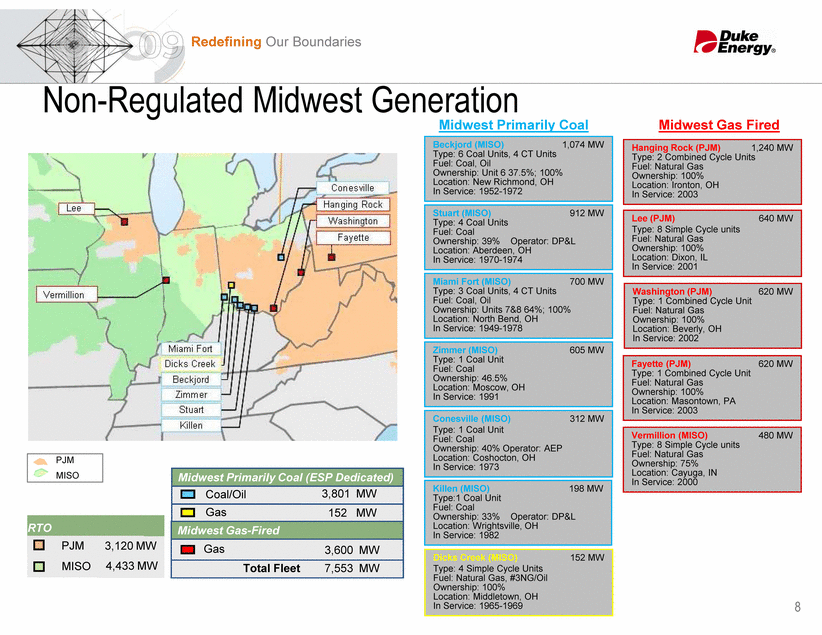
Redefining Our Boundaries Non-Regulated Midwest Generation Miami Fort (MISO) 700 MW Type: 3 Coal Units, 4 CT Units Fuel: Coal, Oil Ownership: Units 7&8 64%; 100% Location: North Bend, OH Beckjord (MISO) 1,074 MW Type: 6 Coal Units, 4 CT Units Fuel: Coal, Oil Ownership: Unit 6 37.5%; 100% Location: New Richmond, OH In Service: 1952-1972 Stuart (MISO) 912 MW Type: 4 Coal Units Fuel: Coal Ownership: 39% Operator: DP&L Location: Aberdeen, OH In Service: 1970-1974 Midwest Primarily Coal Hanging Rock (PJM) 1,240 MW Type: 2 Combined Cycle Units Fuel: Natural Gas Ownership: 100% Location: Ironton, OH In Service: 2003 Lee (PJM) 640 MW Type: 8 Simple Cycle units Fuel: Natural Gas Ownership: 100% Location: Dixon, IL In Service: 2001 Washington (PJM) 620 MW Type: 1 Combined Cycle Unit Fuel: Natural Gas Ownership: 100% Midwest Gas Fired 8 PJM MISO 152 MW Gas 3,801 MW Coal/Oil Midwest Primarily Coal (ESP Dedicated) 7,553 MW Total Fleet 3,600 MW Gas Midwest Gas-Fired Dicks Creek (MISO) 152 MW Type: 4 Simple Cycle Units Fuel: Natural Gas, #3NG/Oil Ownership: 100% Location: Middletown, OH In Service: 1965-1969 In Service: 1949-1978 Zimmer (MISO) 605 MW Type: 1 Coal Unit Fuel: Coal Ownership: 46.5% Location: Moscow, OH In Service: 1991 Conesville (MISO) 312 MW Type: 1 Coal Unit Fuel: Coal Ownership: 40% Operator: AEP Location: Coshocton, OH In Service: 1973 Killen (MISO) 198 MW Type:1 Coal Unit Fuel: Coal Ownership: 33% Operator: DP&L Location: Wrightsville, OH In Service: 1982 Fayette (PJM) 620 MW Type: 1 Combined Cycle Unit Fuel: Natural Gas Ownership: 100% Location: Masontown, PA In Service: 2003 Location: Beverly, OH In Service: 2002 Vermillion (MISO) 480 MW Type: 8 Simple Cycle units Fuel: Natural Gas Ownership: 75% Location: Cayuga, IN In Service: 2000 RTO MISO PJM 3,120 MW 4,433 MW |
|
|
Redefining Our Boundaries Serves native-load customers under the ESP Remaining generation sold into MISO wholesale markets Midwest Coal Generation Current Margin Highest Lowest 9 • Pricing • ESP contract pricing (2009-2011) • Wholesale market power prices • Coal prices • Weather • Customer demand/volume/switching • Acquisition of switched customers via competitive retail arm, Duke Energy Retail Sales (DERS) • Level of O&M costs • Performance of fleet Drivers of Adjusted Earnings Duke Energy Retail Sales purchases generation through MISO market to serve customers acquired through switching Lower than ESP but higher than wholesale (Approx 4,000 MW of primarily coal) |
|
|
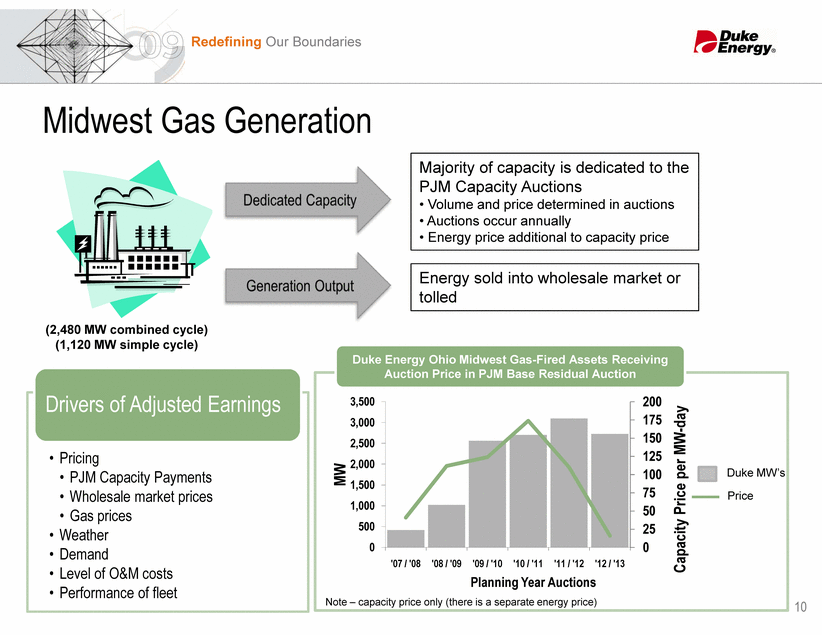
Redefining Our Boundaries Midwest Gas Generation Energy sold into wholesale market or tolled Majority of capacity is dedicated to the PJM Capacity Auctions • Volume and price determined in auctions • Auctions occur annually • Energy price additional to capacity price 10 • Pricing • PJM Capacity Payments • Wholesale market prices • Gas prices • Weather • Demand • Level of O&M costs • Performance of fleet Drivers of Adjusted Earnings (2,480 MW combined cycle) (1,120 MW simple cycle) 0 25 50 75 100 125 150 175 200 0 500 1,000 1,500 2,000 2,500 3,000 3,500 '07 / '08 '08 / '09 '09 / '10 '10 / '11 '11 / '12 '12 / '13 Capacity Price per MW-day MW Planning Year Auctions Note – capacity price only (there is a separate energy price) Price Duke Energy Ohio Midwest Gas-Fired Assets Receiving Auction Price in PJM Base Residual Auction Duke MW’s |
|
|
Commercial Power Supplemental Information December 2009 |
Duke Energy Corporation
Non-GAAP Reconciliations
Commercial Power Supplemental Information
December 2009
Adjusted Segment EBIT for 2008
The materials for Duke Energy’s Commercial Power Supplemental Information presentation dated December 2009 references 2008 adjusted segment EBIT. Adjusted segment EBIT and adjusted Other net expense are non-GAAP financial measures as they represent reported segment EBIT and reported Other net expense adjusted for the impact of special items and the mark-to market impacts of economic hedges in the Commercial Power segment. Special items represent certain charges and credits which management believes will not be recurring on a regular basis. Mark-to-market adjustments reflect the mark-to-market impact of derivative contracts, which is recognized in GAAP earnings immediately as such derivative contracts do not qualify for hedge accounting or regulatory accounting, used in Duke Energy’s hedging of a portion of the economic value of certain of its generation assets in the Commercial Power segment. The economic value of the generation assets is subject to fluctuations in fair value due to market price volatility of the input and output commodities (e.g., coal, power) and, as such, the economic hedging involves both purchases and sales of those input and output commodities related to the generation assets. Because the operations of the generation assets are accounted for under the accrual method, management believes that excluding the impact of mark-to-market changes of the economic hedge contracts from adjusted earnings until settlement better matches the financial impacts of the hedge contract with the portion of the economic value of the underlying hedged asset. The most directly comparable GAAP measures for adjusted segment EBIT and adjusted Other net expense are reported segment EBIT and reported Other net expense, which represents segment and Other results from continuing operations, including any special items and the mark-to-market impacts of economic hedges in the Commercial Power segment. Reconciliations of adjusted segment EBIT for the year-ended December 31, 2008 to the most directly comparable GAAP measures are included below.
Forecasted Adjusted Segment EBIT for 2009
The materials for Duke Energy’s Commercial Power Supplemental Information presentation dated December 2009 references forecasted 2009 adjusted segment EBIT for each of the business segments. Adjusted segment EBIT is a non-GAAP financial measure as it represents reported segment EBIT adjusted for the impact of special items and the mark-to market impacts of economic hedges in the Commercial Power segment. Special items represent certain charges and credits which management believes will not be recurring on a regular basis. Mark-to-market adjustments reflect the mark-to-market impact of derivative contracts, which is recognized in GAAP earnings immediately as such derivative contracts do not qualify for hedge accounting or regulatory accounting, used in Duke Energy’s hedging of a portion of the economic value of certain of its generation assets in the Commercial Power segment (as discussed above under “Adjusted Segment EBIT for 2008”). The most directly comparable GAAP measures for adjusted segment EBIT, adjusted total segment EBIT, and adjusted Other net expense are reported segment EBIT, reported total segment EBIT, and reported Other net expense which represent segment and Other results from continuing operations, including any special items and
the mark-to-market impacts of economic hedges in the Commercial Power segment. Due to the forward-looking nature of these non-GAAP financial measures for 2009, information to reconcile them to the most directly comparable GAAP financial measures is not available at this time, as management is unable to project special items or mark-to-market adjustments for future periods.
DUKE ENERGY CORPORATION
ADJUSTED TO REPORTED EARNINGS RECONCILIATION
December 2008 Year-to-Date
(Dollars in millions, except per-share amounts)
|
|
|
|
|
Special Items (Note 1) |
|
|
|
|
|
|
|
|
|
||||||||||||
|
|
|
Adjusted |
|
Costs to |
|
Crescent |
|
Emission |
|
Economic |
|
Discontinued |
|
Total |
|
Reported |
|
||||||||
|
SEGMENT EARNINGS BEFORE INTEREST AND TAXES FROM CONTINUING OPERATIONS |
|
|
|
|
|
|
|
|
|
|
|
|
|
|
|
|
|
||||||||
|
|
|
|
|
|
|
|
|
|
|
|
|
|
|
|
|
|
|
||||||||
|
U.S. Franchised Electric and Gas |
|
$ |
2,398 |
|
$ |
— |
|
$ |
— |
|
$ |
— |
|
$ |
— |
|
$ |
— |
|
$ |
— |
|
$ |
2,398 |
|
|
|
|
|
|
|
|
|
|
|
|
|
|
|
|
|
|
|
|
||||||||
|
Commercial Power |
|
421 |
|
— |
|
— |
|
(82 |
)(F) |
(75 |
)(B) |
— |
|
(157 |
) |
264 |
|
||||||||
|
|
|
|
|
|
|
|
|
|
|
|
|
|
|
|
|
|
|
||||||||
|
International Energy |
|
411 |
|
— |
|
— |
|
— |
|
— |
|
— |
|
— |
|
411 |
|
||||||||
|
|
|
|
|
|
|
|
|
|
|
|
|
|
|
|
|
|
|
||||||||
|
Total reportable segment EBIT |
|
3,230 |
|
— |
|
— |
|
(82 |
) |
(75 |
) |
— |
|
(157 |
) |
3,073 |
|
||||||||
|
|
|
|
|
|
|
|
|
|
|
|
|
|
|
|
|
|
|
||||||||
|
Other |
|
(310 |
) |
(44 |
)(A) |
(214 |
)(E) |
— |
|
— |
|
— |
|
(258 |
) |
(568 |
) |
||||||||
|
|
|
|
|
|
|
|
|
|
|
|
|
|
|
|
|
|
|
||||||||
|
Total reportable segment and Other EBIT |
|
$ |
2,920 |
|
$ |
(44 |
) |
$ |
(214 |
) |
$ |
(82 |
) |
$ |
(75 |
) |
$ |
— |
|
$ |
(415 |
) |
$ |
2,505 |
|
|
|
|
|
|
|
|
|
|
|
|
|
|
|
|
|
|
|
|
||||||||
|
Interest Expense |
|
(741 |
) |
— |
|
— |
|
— |
|
— |
|
— |
|
— |
|
(741 |
) |
||||||||
|
Interest Income and Other |
|
131 |
|
— |
|
— |
|
— |
|
— |
|
— |
|
— |
|
131 |
|
||||||||
|
Income Taxes from Continuing Operations |
|
(773 |
) |
17 |
|
83 |
|
30 |
|
27 |
|
— |
|
157 |
|
(616 |
) |
||||||||
|
Discontinued Operations, net of taxes |
|
— |
|
— |
|
— |
|
— |
|
— |
|
16 |
(C) |
16 |
|
16 |
|
||||||||
|
Extraordinary Items, net of taxes |
|
— |
|
— |
|
— |
|
— |
|
— |
|
67 |
(D) |
67 |
|
67 |
|
||||||||
|
|
|
|
|
|
|
|
|
|
|
|
|
|
|
|
|
|
|
||||||||
|
Net Income |
|
$ |
1,537 |
|
$ |
(27 |
) |
$ |
(131 |
) |
$ |
(52 |
) |
$ |
(48 |
) |
$ |
83 |
|
$ |
(175 |
) |
$ |
1,362 |
|
|
|
|
|
|
|
|
|
|
|
|
|
|
|
|
|
|
|
|
||||||||
|
EARNINGS PER SHARE, BASIC |
|
$ |
1.21 |
|
$ |
(0.02 |
) |
$ |
(0.10 |
) |
$ |
(0.04 |
) |
$ |
(0.04 |
) |
$ |
0.07 |
|
$ |
(0.13 |
) |
$ |
1.08 |
|
|
|
|
|
|
|
|
|
|
|
|
|
|
|
|
|
|
|
|
||||||||
|
EARNINGS PER SHARE, DILUTED |
|
$ |
1.21 |
|
$ |
(0.02 |
) |
$ |
(0.10 |
) |
$ |
(0.04 |
) |
$ |
(0.04 |
) |
$ |
0.06 |
|
$ |
(0.14 |
) |
$ |
1.07 |
|
Note 1 - Amounts for special items are presented net of any related minority interest.
|
(A) - |
$21 million recorded in Operation, maintenance and other and $23 million recorded in Depreciation and amortization (all Operating Expenses) on the Consolidated Statements of Operations. |
|
|
|
|
(B) - |
$72 million loss recorded within Non-regulated electric, natural gas, and other (Operating Revenues) and $3 million loss recorded within Fuel used in electric generation and purchased power-non-regulated (Operating Expenses) on the Consolidated Statements of Operations. |
|
|
|
|
(C) - |
Recorded in Income (Loss) From Discontinued Operations, net of tax on the Consolidated Statements of Operations. |
|
|
|
|
(D) - |
Recorded in Extraordinary Items, net of tax on the Consolidated Statements of Operations. |
|
|
|
|
(E) - |
Recorded in Equity in earnings (loss) of unconsolidated affiliates on the Consolidated Statements of Operations. |
|
|
|
|
(F) - |
Recorded in Impairment charges on the Consolidated Statements of Operations. |
Weighted Average Shares (reported and adjusted) - in millions
|
Basic |
|
1,265 |
|
|
|
|
|
|
|
Diluted |
|
1,268 |
|
* Represents the mark-to-market impact of derivative contracts, which is recognized in earnings immediately as such derivative contracts do not qualify for hedge accounting or regulatory accounting, used in Duke Energy’s hedging of a portion of the economic value of its generation assets in the Commercial Power segment. The economic value of the generation assets is subject to fluctuations in fair value due to market price volatility of the input and output commodities (e.g. coal, power) and, as such, the economic hedging involves both purchases and sales of those input and output commodities related to the generation assets. Because the operations of the generation assets are accounted for under the accrual method, management believes that excluding the impact of mark-to-market changes of the economic hedge contracts from adjusted earnings until settlement better matches the financial impacts of the hedge contract with the portion of the economic value of the underlying hedged asset. Management believes that the presentation of adjusted diluted EPS provides useful information to investors, as it allows them to more accurately compare the company’s performance across periods.

