Attached files
| file | filename |
|---|---|
| 8-K - COURTESY COPY OF CURRENT REPORT ON FORM 8-K - PEPCO HOLDINGS LLC | dec8-phi8k.pdf |
| EX-99 - COURTESY COPY OF WELLS FARGO PRESENTATION - PEPCO HOLDINGS LLC | ex-99.pdf |
| 8-K - CURRENT REPORT ON FORM 8-K - PEPCO HOLDINGS LLC | dec8-phi8k.htm |

WELLS
FARGO • UTILITY
SYMPOSIUM • DECEMBER 9,
2009
Joseph
M. Rigby
President,
Chairman & Chief Executive Officer

Some of
the statements contained in today’s presentations are forward-looking statements
within the meaning of Section 21E of
the Securities Exchange Act of 1934 and are subject to the safe harbor created by the Private Securities Litigation Reform Act of
1995. These statements include all financial projections and any declarations regarding management’s intents, beliefs or current
expectations. In some cases, you can identify forward-looking statements by terminology such as “may,” “will,” “should,” “expects,”
“plans,” “anticipates,” “believes,” “estimates,” “predicts,” “potential” or “continue” or the negative of such terms or other comparable
terminology. Any forward-looking statements are not guarantees of future performance, and actual results could differ materially
from those indicated by the forward-looking statements. Forward-looking statements involve estimates, assumptions, known and
unknown risks, uncertainties and other factors that may cause actual results, levels of activity, performance or achievements to be
materially different from any future results, levels of activity, performance or achievements expressed or implied by such forward-
looking statements. Each forward-looking statement speaks only as of the date of the particular statement, and we undertake no
obligation to publicly update or revise any forward-looking statement, whether as a result of new information, future events or
otherwise. A number of factors could cause actual results or outcomes to differ materially from those indicated by the forward-
looking statements contained in this presentation. These factors include, but are not limited to, prevailing governmental policies
and regulatory actions affecting the energy industry, including with respect to allowed rates of return, industry and rate structure,
acquisition and disposal of assets and facilities, operation and construction of plant facilities, recovery of purchased power
expenses, and present or prospective wholesale and retail competition; changes in and compliance with environmental and safety
laws and policies; weather conditions; population growth rates and demographic patterns; competition for retail and wholesale
customers; general economic conditions, including potential negative impacts resulting from an economic downturn; growth in
demand, sales and capacity to fulfill demand; changes in tax rates or policies or in rates of inflation; rules and changes in
accounting standards or practices; changes in project costs; unanticipated changes in operating expenses and capital
expenditures; the ability to obtain funding in the capital markets on favorable terms; restrictions imposed by Federal and/or state
regulatory commissions, PJM and other regional transmission organizations (NY ISO, ISO New England), the North American
Electric Reliability Council and other applicable electric reliability organizations; legal and administrative proceedings (whether civil
or criminal) and settlements that affect our business and profitability; pace of entry into new markets; volatility in market demand
and prices for energy, capacity and fuel; interest rate fluctuations and credit market concerns; and effects of geopolitical events,
including the threat of domestic terrorism. Readers are referred to the most recent reports filed with the Securities and Exchange
Commission.
1
Safe
Harbor Statement

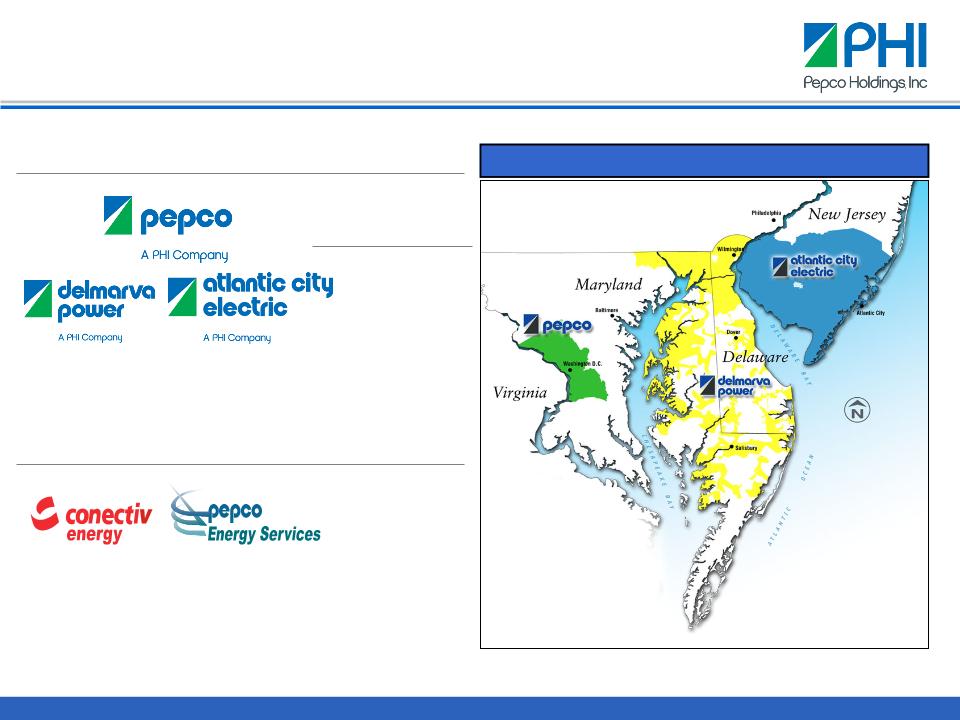
Combined Service Territory
Transmission
& Distribution
Competitive
Energy / Other
2009
- 2013
Forecast
Business
Mix*
70
- 75%
25
- 30%
Note: See Safe
Harbor Statement at the beginning of today’s presentation.
Business
Mix
*
Percentages based on projected operating income.
PHI
Investments
2

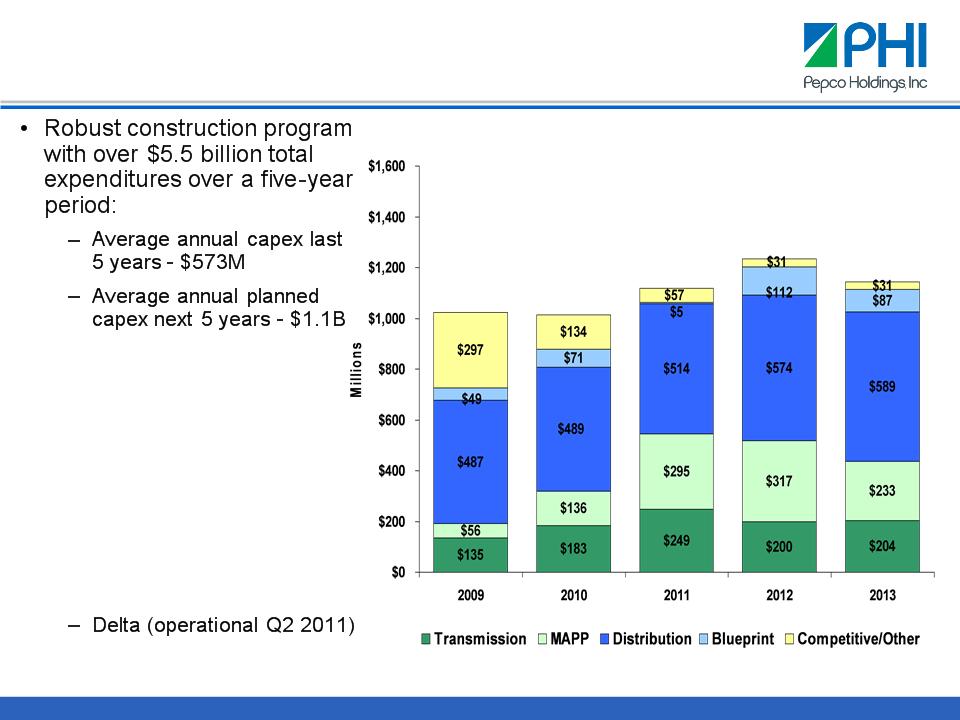
Planned
Construction Expenditures
3
$1,024
$1,013
$1,120
$1,234
$1,144
Note: See Safe
Harbor Statement at the beginning of today’s presentation.
Construction
Expenditures
• Two major Power
Delivery
initiatives:
initiatives:
– Mid-Atlantic
Power
Pathway
Pathway
– Blueprint for the
Future
• Conectiv
Energy
construction projects:
construction projects:
– Cumberland
(operational
Q2 2009)
Q2 2009)

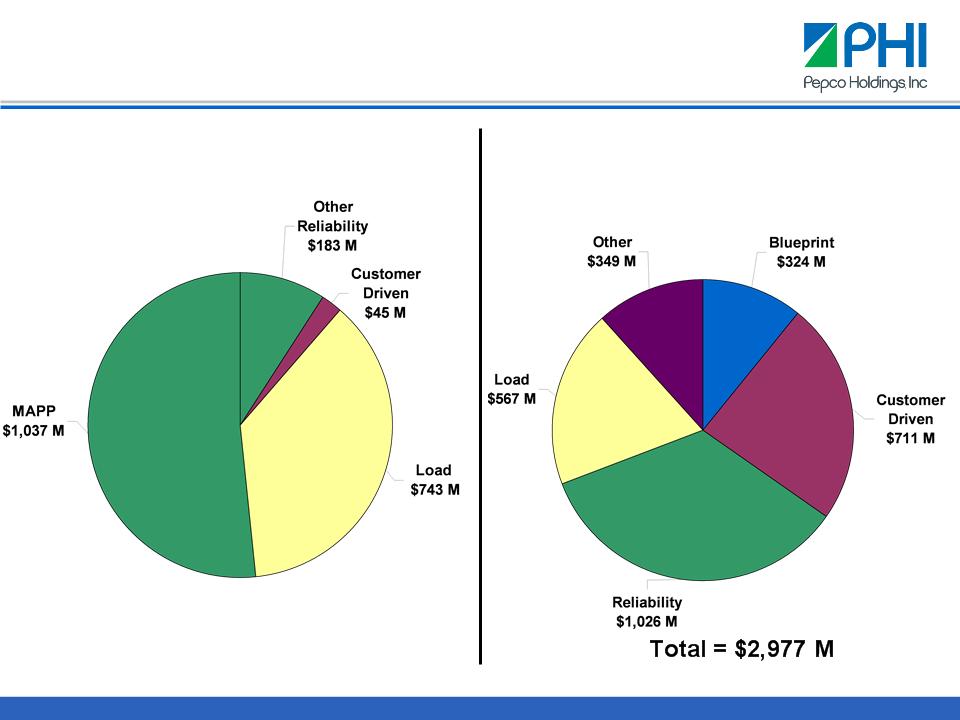
Total
= $2,008 M
Note:
See Safe Harbor statement at beginning of today’s presentation.
4
Transmission
Distribution
Power
Delivery -
Construction Forecast 2009-2013
Construction Forecast 2009-2013

5
Capital
Allocation/Resource Planning
Capital
Allocation
• Detailed planning
process over a 5 year period
• Beyond customer
growth and reliability driven construction, projects compete for
funding
funding
• A risk adjusted cost
of capital specific to the line of business used to assess
returns; post project completion analysis performed to measure results
returns; post project completion analysis performed to measure results
• Evaluation process
entails assigning total value to each project and ranking on a
discretionary/non-discretionary basis involving assessment of specific financial and
non-financial factors
discretionary/non-discretionary basis involving assessment of specific financial and
non-financial factors
Resource
Planning
• Capital allocation
process establishes the required resource plan and determines
the following criteria:
the following criteria:
– Quantity and type of
skilled crafts necessary to complete the work
– Construction
schedule
– Allocation of work
to internal/external resources

• Currently
using
– Cash from
operations
– Proceeds from 2008
financing
• Traditional First
Mortgage Bonds
• Equity
• In
progress
– Federal Grant
Awards
• Under
consideration
– Federal Loan
Guarantee (MAPP Project)
– Continued review of
capital expenditure reductions/deferrals
– Utility Debt (public
and private placement)
– Sale of selected
assets
– Mandatory
Convertible/Hybrids
– Short-term debt
capacity
– Small equity
issuance
6
While a challenging environment, we have adequate
access to the market to finance our plans
access to the market to finance our plans
Capital
Funding Sources

Capital
Allocation Factors
• Transmission
investment earns an
11.3% Return on Equity
11.3% Return on Equity
• Rates adjusted
through a formula
rate process
rate process
• Option to apply for
additional
incentives
incentives
• Incentive filing
approvals:
– MAPP project (as
well as eight
other RTEP projects) was
approved for a 150 basis point
adder raising Return on Equity to
12.8%
other RTEP projects) was
approved for a 150 basis point
adder raising Return on Equity to
12.8%
• MAPP also
awarded:
– Full forward year
CWIP allowed in
rate base
rate base
– 100% recovery of
prudently
incurred costs in case of project
cancellation
incurred costs in case of project
cancellation
7
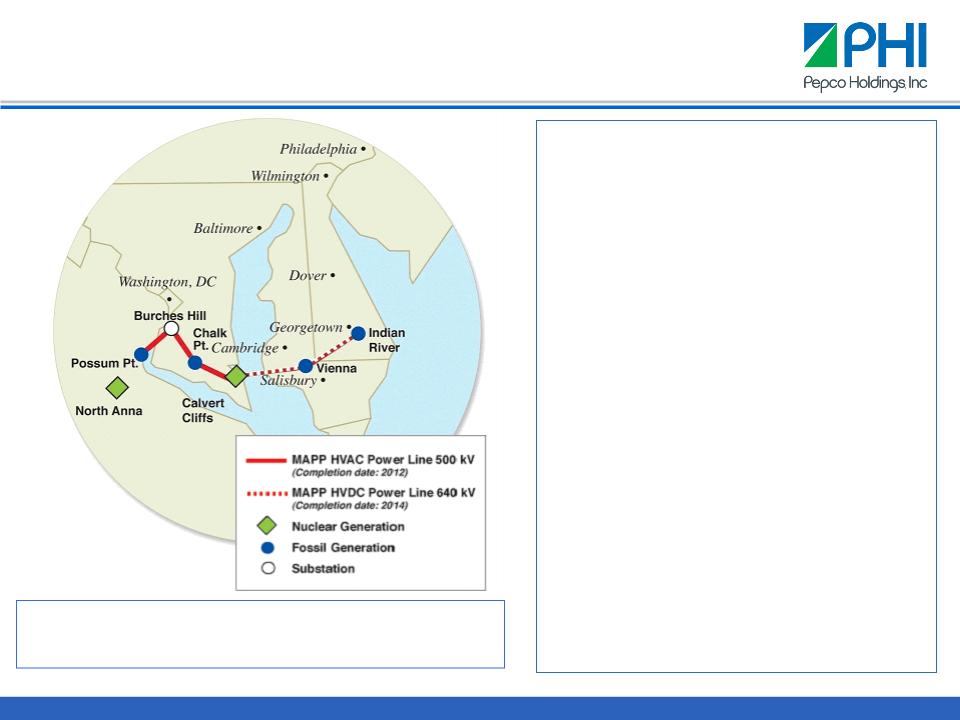
- Cost of project - $1.2 billion
- In-service date - 2014
- Construction currently expected to begin the latter half of 2010
- Total length - 150 miles (~ 30 miles on new right of way)
Note: See Safe
Harbor Statement at the beginning of today’s presentation.
Mid-Atlantic
Power Pathway (MAPP)

· Capital
Allocation Factors
– Public Service
Commission pre-approval
– DOE federal stimulus
funds
· Delaware
– AMI deployment
approved
– Establishment of
regulatory asset approved
– Meter installation
has begun
· District
of Columbia
– Legislation adopted
in June approving AMI
deployment, subject to PSC agreeing to the
sufficiency of federal grants
deployment, subject to PSC agreeing to the
sufficiency of federal grants
– Legislation provides
for cost recovery, and a return
on costs, by the creation of a regulatory asset
on costs, by the creation of a regulatory asset
· Maryland
– AMI system
requirements established
– PSC proceedings
underway for cost recovery
determination
determination
· DOE
awarded $168 million in federal stimulus
funds for Smart Grid projects in October 2009
funds for Smart Grid projects in October 2009
8
• Cost
of project (2008 - 2014) - $422 million
• Full
meter deployment expected by 2014,
contingent upon regulatory approvals
contingent upon regulatory approvals
Note: See Safe
Harbor Statement at the beginning of today’s presentation.
Blueprint
for the Future - Smart Grid

While we operate in a challenging environment, we stay
focused
on customer needs, value creation and efficient financing
on customer needs, value creation and efficient financing
9
Summary
• PHI employs a
comprehensive and deliberate capital
allocation model
allocation model
• We appropriately
address service and reliability
requirements
requirements
• We work to ensure a
clear path for the recovery of
regulated investments
regulated investments
• We work to minimize
our cost of capital while maintaining
a strong credit focus
a strong credit focus
