Attached files
| file | filename |
|---|---|
| 8-K - FORM 8-K - JPMORGAN CHASE & CO | d8k.htm |
Exhibit 99.1
Exhibit 99.1
Jamie Dimon
Chairman and Chief Executive Officer
December 8, 2009
Goldman Sachs US Financial Services Conference
Agenda
Part I — Firm and line of business update
Part II — Key investor topics
Credit update
Loan demand
Fortress balance sheet
Consumer and small business support efforts
Part III
Comments on the environment
Outlook
| 1 |
|
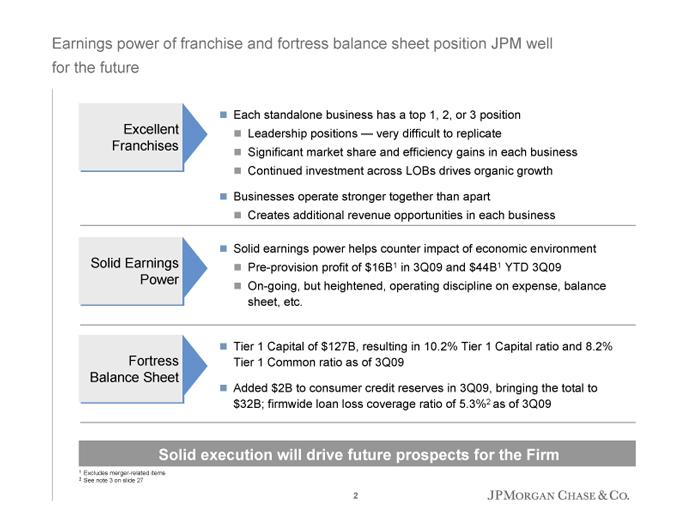
Earnings power of franchise and fortress balance sheet position JPM well for the future
Excellent
Franchises
Each standalone business has a top 1, 2, or 3 position
Leadership positions — very difficult to replicate
Significant market share and efficiency gains in each business
Continued investment across LOBs drives organic growth
Businesses operate stronger together than apart
Creates additional revenue opportunities in each business
Solid Earnings
Power
Solid earnings power helps counter impact of economic environment
Pre-provision profit of $16B1 in 3Q09 and $44B1 YTD 3Q09
On-going, but heightened, operating discipline on expense, balance sheet, etc.
Fortress
Balance Sheet
Tier 1 Capital of $127B, resulting in 10.2% Tier 1 Capital ratio and 8.2% Tier 1 Common ratio as of 3Q09
Added $2B to consumer credit reserves in 3Q09, bringing the total to $32B; firmwide loan loss coverage ratio of 5.3%2 as of 3Q09
Solid execution will drive future prospects for the Firm
| 1 |
|
Excludes merger-related items |
| 2 |
|
See note 3 on slide 27 |
| 2 |
|
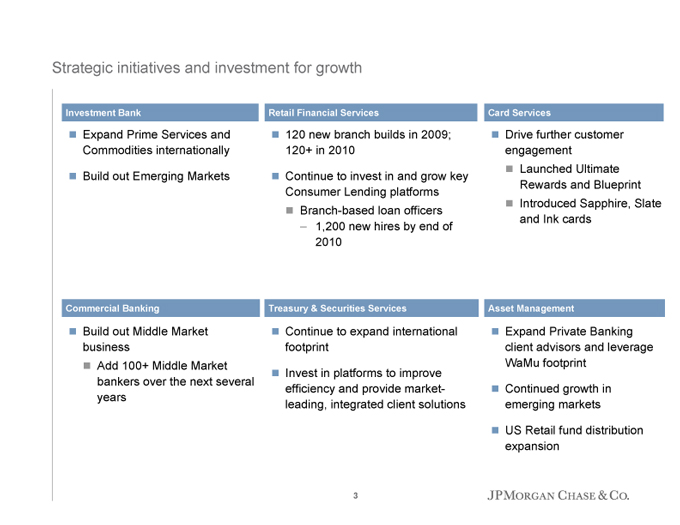
Strategic initiatives and investment for growth
Investment Bank
Expand Prime Services and Commodities internationally
Build out Emerging Markets
Retail Financial Services
120 new branch builds in 2009; 120+ in 2010
Continue to invest in and grow key Consumer Lending platforms
Branch-based loan officers
– 1,200 new hires by end of 2010
Card Services
Drive further customer engagement
Launched Ultimate Rewards and Blueprint
Introduced Sapphire, Slate and Ink cards
Commercial Banking
Build out Middle Market business
Add 100+ Middle Market bankers over the next several years
Treasury & Securities Services
Continue to expand international footprint
Invest in platforms to improve efficiency and provide market-leading, integrated client solutions
Asset Management
Expand Private Banking client advisors and leverage WaMu footprint
Continued growth in emerging markets
US Retail fund distribution expansion
| 3 |
|
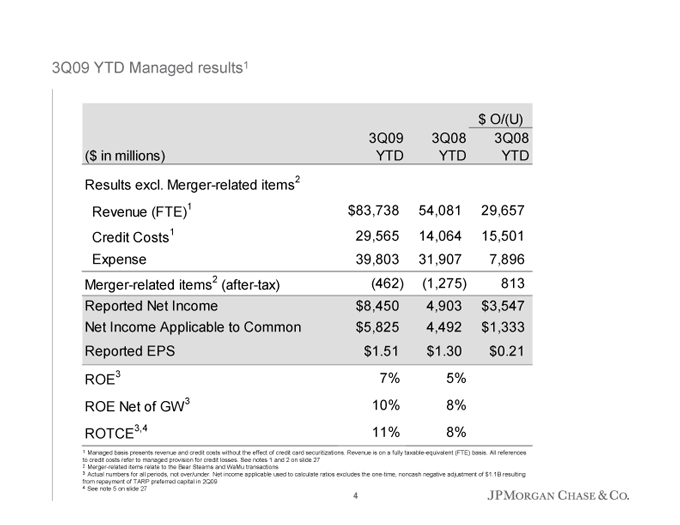
3Q09 YTD Managed results1
$ O/(U)
3Q09 3Q08 3Q08
($ in millions) YTD YTD YTD
Results excl. Merger-related items2
Revenue (FTE)1 $83,738 54,081 29,657
Credit Costs1 29,565 14,064 15,501
Expense 39,803 31,907 7,896
Merger-related items2 (after-tax)(462)(1,275) 813
Reported Net Income $8,450 4,903 $3,547
Net Income Applicable to Common $5,825 4,492 $1,333
Reported EPS $1.51 $1.30 $0.21
ROE3 7% 5%
ROE Net of GW 3 10% 8%
ROTCE3,4 11% 8%
1 Managed basis presents revenue and credit costs without the effect of credit card securitizations. Revenue is on a fully taxable-equivalent (FTE) basis. All references to credit costs refer to managed provision for credit losses. See notes 1 and 2 on slide 27
| 2 |
|
Merger-related items relate to the Bear Stearns and WaMu transactions |
3 Actual numbers for all periods, not over/under. Net income applicable used to calculate ratios excludes the one-time, noncash negative adjustment of $1.1B resulting from repayment of TARP preferred capital in 2Q09
| 4 |
|
See note 5 on slide 27 |
| 4 |
|
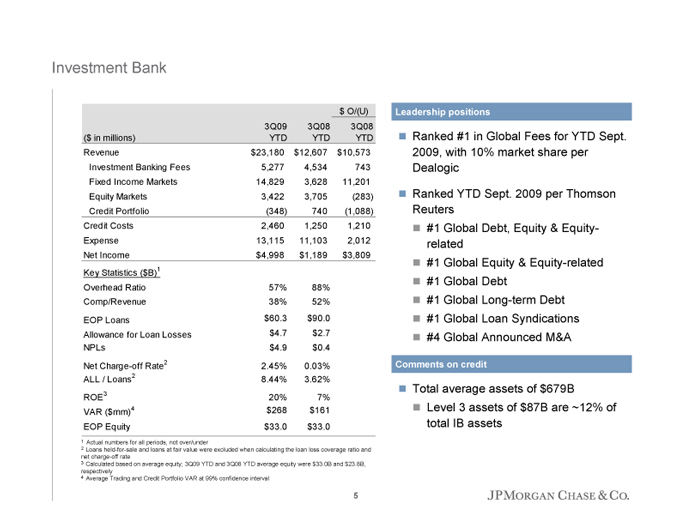
Investment Bank
$ O/(U)
3Q09 3Q08 3Q08
($ in millions) YTD YTD YTD
Revenue $23,180 $12,607 $10,573
Investment Banking Fees 5,277 4,534 743
Fixed Income Markets 14,829 3,628 11,201
Equity Markets 3,422 3,705(283)
Credit Portfolio(348) 740(1,088)
Credit Costs 2,460 1,250 1,210
Expense 13,115 11,103 2,012
Net Income $4,998 $1,189 $3,809
Key Statistics ($B)1
Overhead Ratio 57% 88%
Comp/Revenue 38% 52%
EOP Loans $60.3 $90.0
Allowance for Loan Losses $4.7 $2.7
NPLs $4.9 $0.4
Net Charge-off Rate2 2.45% 0.03%
ALL / Loans2 8.44% 3.62%
ROE3 20% 7%
VAR ($mm)4 $268 $161
EOP Equity $33.0 $33.0
Leadership positions
Ranked #1 in Global Fees for YTD Sept. 2009, with 10% market share per Dealogic
Ranked YTD Sept. 2009 per Thomson Reuters
#1 Global Debt, Equity & Equity-related
#1 Global Equity & Equity-related
#1 Global Debt
#1 Global Long-term Debt
#1 Global Loan Syndications
#4 Global Announced M&A
Comments on credit
Total average assets of $679B
Level 3 assets of $87B are ~12% of total IB assets
1 Actual numbers for all periods, not over/under
2 Loans held-for-sale and loans at fair value were excluded when calculating the loan loss coverage ratio and net charge-off rate
3 Calculated based on average equity; 3Q09 YTD and 3Q08 YTD average equity were $33.0B and $23.8B, respectively
4 Average Trading and Credit Portfolio VAR at 99% confidence interval
5
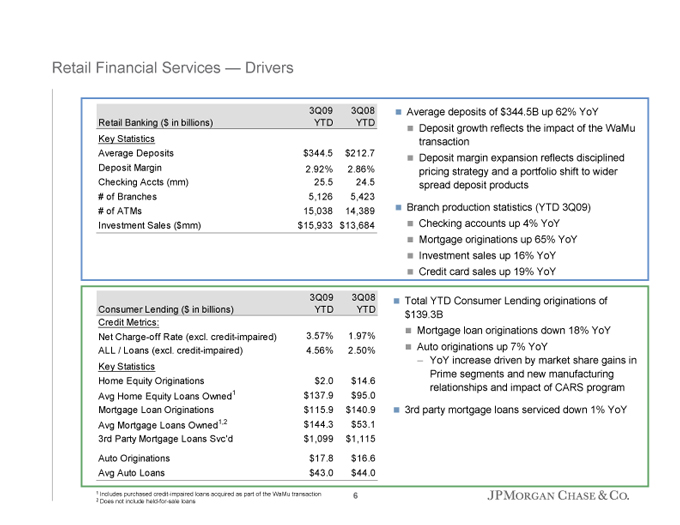
Retail Financial Services — Drivers
3Q09 3Q08
Retail Banking ($ in billions) YTD YTD
Key Statistics
Average Deposits $344.5 $212.7
Deposit Margin 2.92% 2.86%
Checking Accts (mm) 25.5 24.5
# of Branches 5,126 5,423
# of ATMs 15,038 14,389
Investment Sales ($mm) $15,933 $13,684
Average deposits of $344.5B up 62% YoY
Deposit growth reflects the impact of the WaMu transaction
Deposit margin expansion reflects disciplined pricing strategy and a portfolio shift to wider spread deposit products
Branch production statistics (YTD 3Q09)
Checking accounts up 4% YoY
Mortgage originations up 65% YoY
Investment sales up 16% YoY
Credit card sales up 19% YoY
3Q09 3Q08
Consumer Lending ($ in billions) YTD YTD
Credit Metrics:
Net Charge-off Rate (excl. credit-impaired) 3.57% 1.97%
ALL / Loans (excl. credit-impaired) 4.56% 2.50%
Key Statistics
Home Equity Originations $2.0 $14.6
Avg Home Equity Loans Owned1 $137.9 $95.0
Mortgage Loan Originations $115.9 $140.9
Avg Mortgage Loans Owned1,2 $144.3 $53.1
3rd Party Mortgage Loans Svc’d $1,099 $1,115
Auto Originations $17.8 $16.6
Avg Auto Loans $43.0 $44.0
Total YTD Consumer Lending originations of $139.3B
Mortgage loan originations down 18% YoY
Auto originations up 7% YoY
– YoY increase driven by market share gains in Prime segments and new manufacturing relationships and impact of CARS program
3rd party mortgage loans serviced down 1% YoY
1 Includes purchased credit-impaired loans acquired as part of the WaMu transaction
2 Does not include held-for-sale loans
6
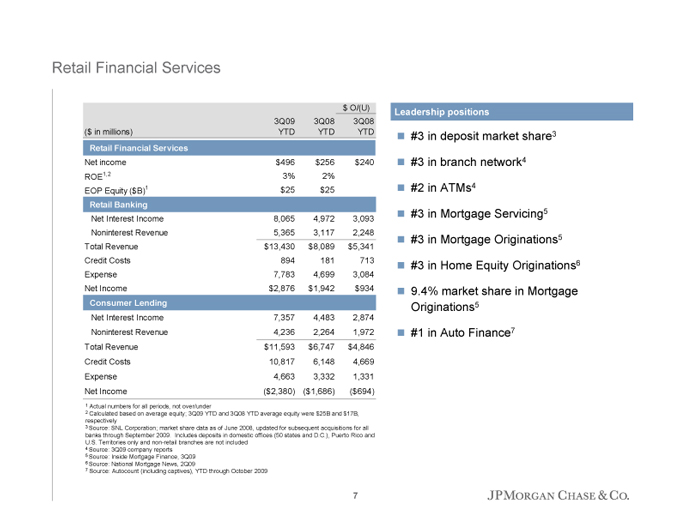
Retail Financial Services
$ O/(U)
3Q09 3Q08 3Q08
($ in millions) YTD YTD YTD
Retail Financial Services
Net income $496 $256 $240
ROE1,2 3% 2%
EOP Equity ($B)1 $25 $25
Retail Banking
Net Interest Income 8,065 4,972 3,093
Noninterest Revenue 5,365 3,117 2,248
Total Revenue $13,430 $8,089 $5,341
Credit Costs 894 181 713
Expense 7,783 4,699 3,084
Net Income $2,876 $1,942 $934
Consumer Lending
Net Interest Income 7,357 4,483 2,874
Noninterest Revenue 4,236 2,264 1,972
Total Revenue $11,593 $6,747 $4,846
Credit Costs 10,817 6,148 4,669
Expense 4,663 3,332 1,331
Net Income($2,380)($1,686)($694)
Leadership positions
#3 in deposit market share3
#3 in branch network4
#2 in ATMs4
#3 in Mortgage Servicing5
#3 in Mortgage Originations5
#3 in Home Equity Originations6
9.4% market share in Mortgage Originations5
#1 in Auto Finance7
| 1 |
|
Actual numbers for all periods, not over/under |
| 2 |
|
Calculated based on average equity; 3Q09 YTD and 3Q08 YTD average equity were $25B and $17B, respectively |
3 Source: SNL Corporation; market share data as of June 2008, updated for subsequent acquisitions for all banks through September 2009. Includes deposits in domestic offices (50 states and D.C.), Puerto Rico and U.S. Territories only and non-retail branches are not included
| 4 |
|
Source: 3Q09 company reports |
| 5 |
|
Source: Inside Mortgage Finance, 3Q09 |
| 6 |
|
Source: National Mortgage News, 2Q09 |
| 7 |
|
Source: Autocount (including captives), YTD through October 2009 |
| 7 |
|
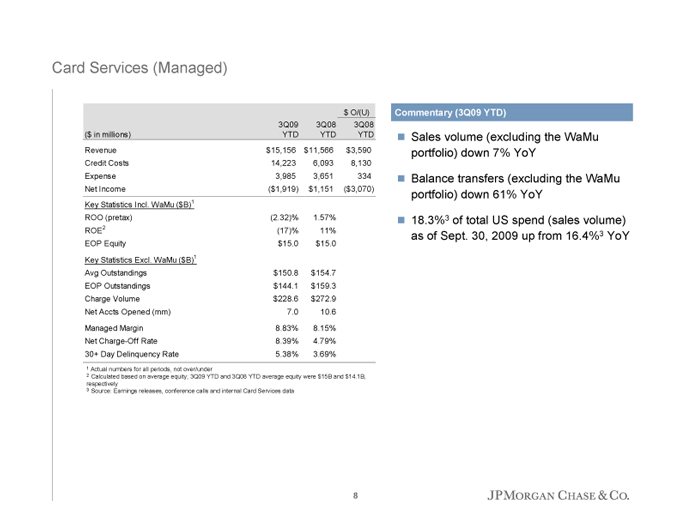
Card Services (Managed)
$ O/(U)
3Q09 3Q08 3Q08
($ in millions) YTD YTD YTD
Revenue $15,156 $11,566 $3,590
Credit Costs 14,223 6,093 8,130
Expense 3,985 3,651 334
Net Income($1,919) $1,151($3,070)
Key Statistics Incl. WaMu ($B)1
ROO (pretax)(2.32)% 1.57%
ROE2(17)% 11%
EOP Equity $15.0 $15.0
Key Statistics Excl. WaMu ($B)1
Avg Outstandings $150.8 $154.7
EOP Outstandings $144.1 $159.3
Charge Volume $228.6 $272.9
Net Accts Opened (mm) 7.0 10.6
Managed Margin 8.83% 8.15%
Net Charge-Off Rate 8.39% 4.79%
30+ Day Delinquency Rate 5.38% 3.69%
Commentary (3Q09 YTD)
Sales volume (excluding the WaMu portfolio) down 7% YoY
Balance transfers (excluding the WaMu portfolio) down 61% YoY
18.3%3 of total US spend (sales volume) as of Sept. 30, 2009 up from 16.4%3 YoY
| 1 |
|
Actual numbers for all periods, not over/under |
| 2 |
|
Calculated based on average equity; 3Q09 YTD and 3Q08 YTD average equity were $15B and $14.1B, respectively |
| 3 |
|
Source: Earnings releases, conference calls and internal Card Services data |
| 8 |
|
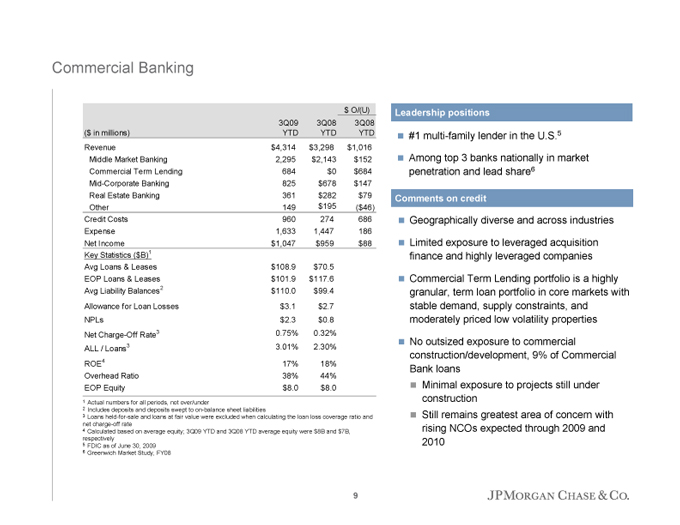
Commercial Banking
$ O/(U)
3Q09 3Q08 3Q08
($ in millions) YTD YTD YTD
Revenue $4,314 $3,298 $1,016
Middle Market Banking 2,295 $2,143 $152
Commercial Term Lending 684 $0 $684
Mid-Corporate Banking 825 $678 $147
Real Estate Banking 361 $282 $79
Other 149 $195($46)
Credit Costs 960 274 686
Expense 1,633 1,447 186
Net Income $1,047 $959 $88
Key Statistics ($B)1
Avg Loans & Leases $108.9 $70.5
EOP Loans & Leases $101.9 $117.6
Avg Liability Balances2 $110.0 $99.4
Allowance for Loan Losses $3.1 $2.7
NPLs $2.3 $0.8
Net Charge-Off Rate3 0.75% 0.32%
ALL / Loans3 3.01% 2.30%
ROE4 17% 18%
Overhead Ratio 38% 44%
EOP Equity $8.0 $8.0
Leadership positions
#1 multi-family lender in the U.S.5
Among top 3 banks nationally in market penetration and lead share6
Comments on credit
Geographically diverse and across industries
Limited exposure to leveraged acquisition finance and highly leveraged companies
Commercial Term Lending portfolio is a highly granular, term loan portfolio in core markets with stable demand, supply constraints, and moderately priced low volatility properties
No outsized exposure to commercial construction/development, 9% of Commercial Bank loans
Minimal exposure to projects still under construction
Still remains greatest area of concern with rising NCOs expected through 2009 and 2010
| 1 |
|
Actual numbers for all periods, not over/under |
| 2 |
|
Includes deposits and deposits swept to on-balance sheet liabilities |
3 Loans held-for-sale and loans at fair value were excluded when calculating the loan loss coverage ratio and net charge-off rate
| 4 |
|
Calculated based on average equity; 3Q09 YTD and 3Q08 YTD average equity were $8B and $7B, respectively |
| 5 |
|
FDIC as of June 30, 2009 |
| 6 |
|
Greenwich Market Study, FY08 |
9
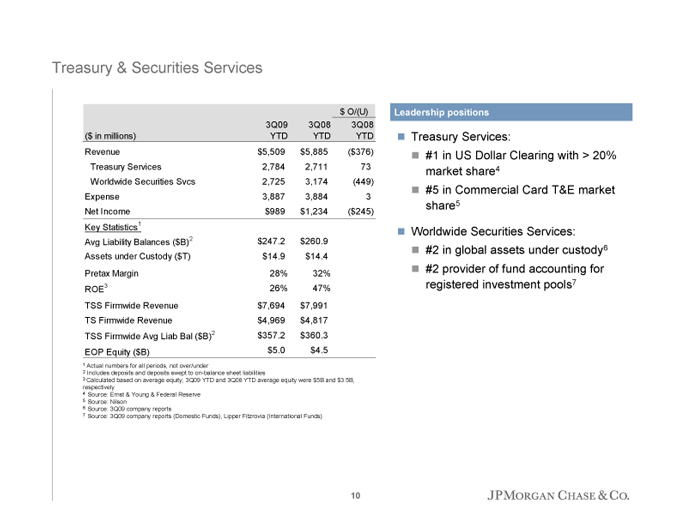
Treasury & Securities Services
$ O/(U)
3Q09 3Q08 3Q08
($ in millions) YTD YTD YTD
Revenue $5,509 $5,885($376)
Treasury Services 2,784 2,711 73
Worldwide Securities Svcs 2,725 3,174(449)
Expense 3,887 3,884 3
Net Income $989 $1,234($245)
Key Statistics1
Avg Liability Balances ($B)2 $247.2 $260.9
Assets under Custody ($T) $14.9 $14.4
Pretax Margin 28% 32%
ROE3 26% 47%
TSS Firmwide Revenue $7,694 $7,991
TS Firmwide Revenue $4,969 $4,817
TSS Firmwide Avg Liab Bal ($B)2 $357.2 $360.3
EOP Equity ($B) $5.0 $4.5
Leadership positions
Treasury Services:
#1 in US Dollar Clearing with > 20% market share4
#5 in Commercial Card T&E market share5
Worldwide Securities Services:
#2 in global assets under custody6
#2 provider of fund accounting for registered investment pools7
| 1 |
|
Actual numbers for all periods, not over/under |
| 2 |
|
Includes deposits and deposits swept to on-balance sheet liabilities |
| 3 |
|
Calculated based on average equity; 3Q09 YTD and 3Q08 YTD average equity were $5B and $3.5B, respectively |
| 4 |
|
Source: Ernst & Young & Federal Reserve |
| 5 |
|
Source: Nilson |
| 6 |
|
Source: 3Q09 company reports |
| 7 |
|
Source: 3Q09 company reports (Domestic Funds), Lipper Fitzrovia (International Funds) |
10
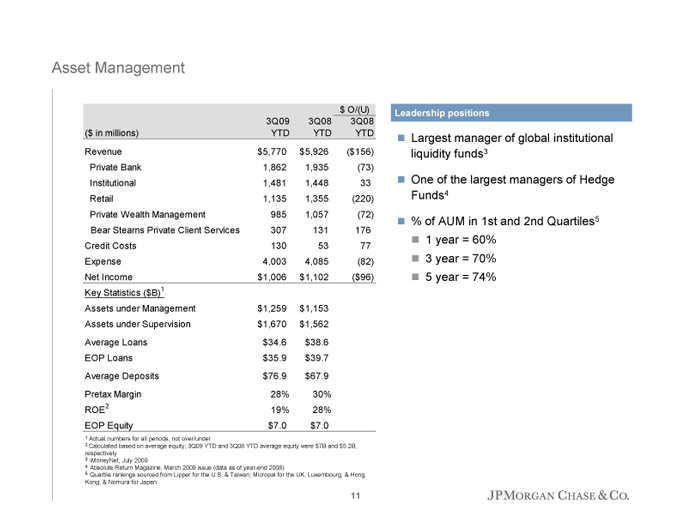
Asset Management
$ O/(U)
3Q09 3Q08 3Q08
($ in millions) YTD YTD YTD
Revenue $5,770 $5,926($156)
Private Bank 1,862 1,935(73)
Institutional 1,481 1,448 33
Retail 1,135 1,355(220)
Private Wealth Management 985 1,057(72)
Bear Stearns Private Client Services 307 131 176
Credit Costs 130 53 77
Expense 4,003 4,085(82)
Net Income $1,006 $1,102($96)
Key Statistics ($B)1
Assets under Management $1,259 $1,153
Assets under Supervision $1,670 $1,562
Average Loans $34.6 $38.6
EOP Loans $35.9 $39.7
Average Deposits $76.9 $67.9
Pretax Margin 28% 30%
ROE2 19% 28%
EOP Equity $7.0 $7.0
Leadership positions
Largest manager of global institutional liquidity funds3
One of the largest managers of Hedge Funds4
% of AUM in 1st and 2nd Quartiles5
1 year = 60%
3 year = 70%
5 year = 74%
| 1 |
|
Actual numbers for all periods, not over/under |
| 2 |
|
Calculated based on average equity; 3Q09 YTD and 3Q08 YTD average equity were $7B and $5.2B, respectively |
| 3 |
|
iMoneyNet, July 2009 |
| 4 |
|
Absolute Return Magazine, March 2009 issue (data as of year-end 2008) |
5 Quartile rankings sourced from Lipper for the U.S. & Taiwan; Micropal for the UK, Luxembourg, & Hong Kong; & Nomura for Japan
11
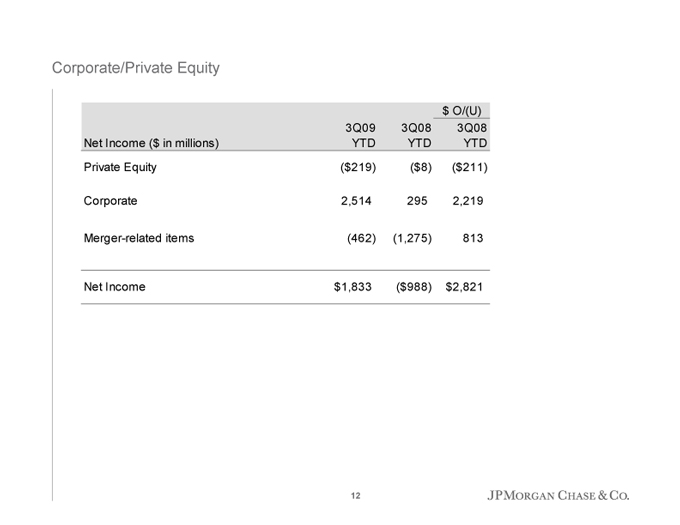
Corporate/Private Equity
$ O/(U)
3Q09 3Q08 3Q08
Net Income ($ in millions) YTD YTD YTD
Private Equity ($219) ($8) ($211)
Corporate 2,514 295 2,219
Merger-related items (462) (1,275) 813
Net Income $1,833 ($988) $2,821
12
Agenda
Page
Key Investor Topics 13
Appendix 23
13
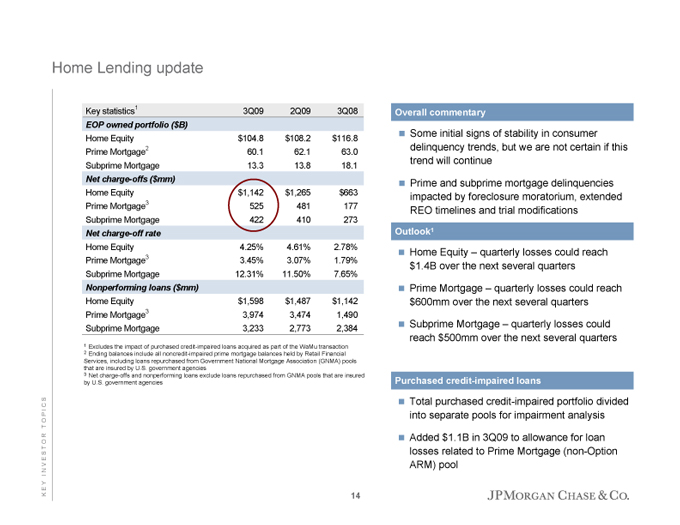
Home Lending update
KEY INVESTOR TOPICS
Key statistics1 3Q09 2Q09 3Q08
EOP owned portfolio ($B)
Home Equity $104.8 $108.2 $116.8
Prime Mortgage2 60.1 62.1 63.0
Subprime Mortgage 13.3 13.8 18.1
Net charge-offs ($mm)
Home Equity $1,142 $1,265 $663
Prime Mortgage3 525 481 177
Subprime Mortgage 422 410 273
Net charge-off rate
Home Equity 4.25% 4.61% 2.78%
Prime Mortgage3 3.45% 3.07% 1.79%
Subprime Mortgage 12.31% 11.50% 7.65%
Nonperforming loans ($mm)
Home Equity $1,598 $1,487 $1,142
Prime Mortgage3 3,974 3,474 1,490
Subprime Mortgage 3,233 2,773 2,384
Overall commentary
Some initial signs of stability in consumer delinquency trends, but we are not certain if this trend will continue
Prime and subprime mortgage delinquencies impacted by foreclosure moratorium, extended REO timelines and trial modifications
Outlook1
Home Equity – quarterly losses could reach $1.4B over the next several quarters
Prime Mortgage – quarterly losses could reach $600mm over the next several quarters
Subprime Mortgage – quarterly losses could reach $500mm over the next several quarters
Purchased credit-impaired loans
Total purchased credit-impaired portfolio divided into separate pools for impairment analysis
Added $1.1B in 3Q09 to allowance for loan losses related to Prime Mortgage (non-Option ARM) pool
1 Excludes the impact of purchased credit-impaired loans acquired as part of the WaMu transaction
2 Ending balances include all noncredit-impaired prime mortgage balances held by Retail Financial Services, including loans repurchased from Government National Mortgage Association (GNMA) pools that are insured by U.S. government agencies
3 Net charge-offs and nonperforming loans exclude loans repurchased from GNMA pools that are insured by U.S. government agencies
14
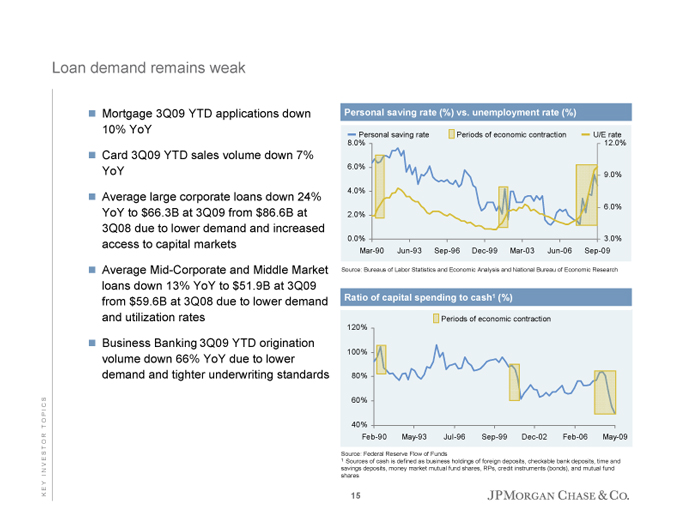
Loan demand remains weak
Mortgage 3Q09 YTD applications down 10% YoY
Card 3Q09 YTD sales volume down 7% YoY
Average large corporate loans down 24% YoY to $66.3B at 3Q09 from $86.6B at 3Q08 due to lower demand and increased access to capital markets
Average Mid-Corporate and Middle Market loans down 13% YoY to $51.9B at 3Q09 from $59.6B at 3Q08 due to lower demand and utilization rates
Business Banking 3Q09 YTD origination volume down 66% YoY due to lower demand and tighter underwriting standards
K E Y I N V E S T O R T O P I C S
Personal saving rate (%) vs. unemployment rate (%)
Personal saving rate Periods of economic contraction U/E rate
| 8.0% |
|
12.0% |
6.0%
9.0%
4.0%
6.0%
2.0%
| 0.0% |
|
3.0% |
Mar-90 Jun-93 Sep-96 Dec-99 Mar-03 Jun-06 Sep-09
Source: Bureaus of Labor Statistics and Economic Analysis and National Bureau of Economic Research
Ratio of capital spending to cash 1 (%)
Periods of economic contraction
120%
100%
80%
60%
40%
Feb-90 May-93 Jul-96 Sep-99 Dec-02 Feb-06 May-09
Source: Federal Reserve Flow of Funds
1 Sources of cash is defined as business holdings of foreign deposits, checkable bank deposits, time and savings deposits, money market mutual fund shares, RPs, credit instruments (bonds), and mutual fund shares
15
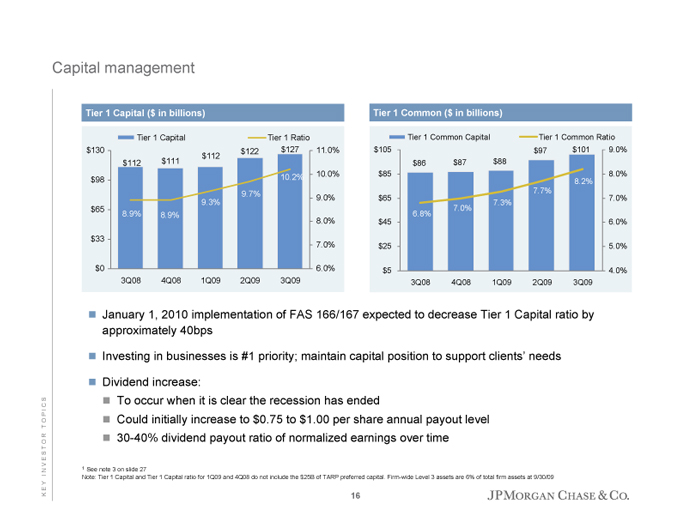
Capital management
Tier 1 Capital ($ in billions)
$130 $122 $127 11.0%
$112 $111 $112
$98 10.2% 10.0%
| 9.7% |
|
9.0% |
9.3%
$65 8.9% 8.9%
8.0%
$33
7.0%
$0 6.0%
3Q08 4Q08 1Q09 2Q09 3Q09
Tier 1 Common ($ in billions)
Tier 1 Common Capital Tier 1 Common Ratio
$105 $97 $101 9.0%
$86 $87 $88
$85 8.0%
8.2%
7.7%
$65 7.0%
7.3%
7.0%
6.8%
$45 6.0%
$25 5.0%
$5 4.0%
3Q08 4Q08 1Q09 2Q09 3Q09
January 1, 2010 implementation of FAS 166/167 expected to decrease Tier 1 Capital ratio by approximately 40bps
Investing in businesses is #1 priority; maintain capital position to support clients’ needs
Dividend increase:
To occur when it is clear the recession has ended
Could initially increase to $0.75 to $1.00 per share annual payout level
30-40% dividend payout ratio of normalized earnings over time
KEY INVESTOR TOPICS
1 See note 3 on slide 27
Note: Tier 1 Capital and Tier 1 Capital ratio for 1Q09 and 4Q08 do not include the $25B of TARP preferred capital. Firm-wide Level 3 assets are 6% of total firm assets at 9/30/09
16
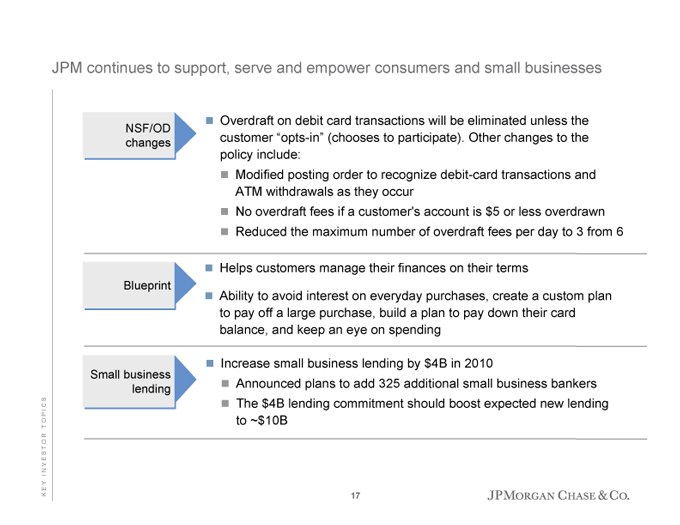
JPM continues to support, serve and empower consumers and small businesses
Overdraft on debit card transactions will be eliminated unless the NSF/OD changes customer “opts-in” (chooses to participate). Other changes to the policy include:
Modified posting order to recognize debit-card transactions and ATM withdrawals as they occur
No overdraft fees if a customer’s account is $5 or less overdrawn
Reduced the maximum number of overdraft fees per day to 3 from 6
Blueprint
Helps customers manage their finances on their terms
Ability to avoid interest on everyday purchases, create a custom plan to pay off a large purchase, build a plan to pay down their card balance, and keep an eye on spending
Small business lending
Increase small business lending by $4B in 2010
Announced plans to add 325 additional small business bankers
The $4B lending commitment should boost expected new lending to ~$10B
K E Y I N V E S T O R T O P I C S
17
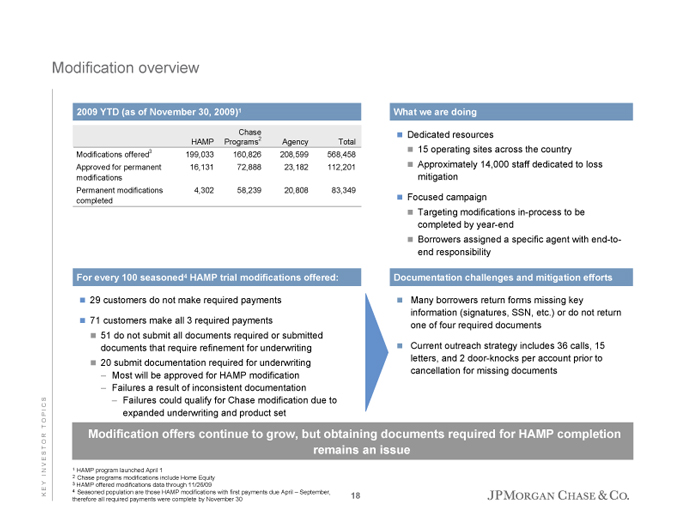
Modification overview
2009 YTD (as of November 30, 2009)1
Chase
HAMP Programs2 Agency Total
Modifications offered3 199,033 160,826 208,599 568,458
Approved for permanent 16,131 72,888 23,182 112,201
modifications
Permanent modifications 4,302 58,239 20,808 83,349
completed
For every 100 seasoned4 HAMP trial modifications offered:
29 customers do not make required payments
71 customers make all 3 required payments
51 do not submit all documents required or submitted documents that require refinement for underwriting
20 submit documentation required for underwriting
– Most will be approved for HAMP modification
– Failures a result of inconsistent documentation
– Failures could qualify for Chase modification due to expanded underwriting and product set
What we are doing
Dedicated resources
15 operating sites across the country
Approximately 14,000 staff dedicated to loss mitigation
Focused campaign
Targeting modifications in-process to be completed by year-end
Borrowers assigned a specific agent with end-to-end responsibility
Documentation challenges and mitigation efforts
Many borrowers return forms missing key information (signatures, SSN, etc.) or do not return one of four required documents
Current outreach strategy includes 36 calls, 15 letters, and 2 door-knocks per account prior to cancellation for missing documents
Modification offers continue to grow, but obtaining documents required for HAMP completion remains an issue
1 HAMP program launched April 1
2 Chase programs modifications include Home Equity
3 HAMP offered modifications data through 11/26/09
4 Seasoned population are those HAMP modifications with first payments due April – September, therefore all required payments were complete by November 30
18
KEY INVESTOR TOPICS
Comments on regulatory reform
OTC derivatives
Consumer Financial Protection Agency
Incentive compensation
Risk, leverage and capital requirements
Resolution authority
KEY INVESTOR TOPICS
19
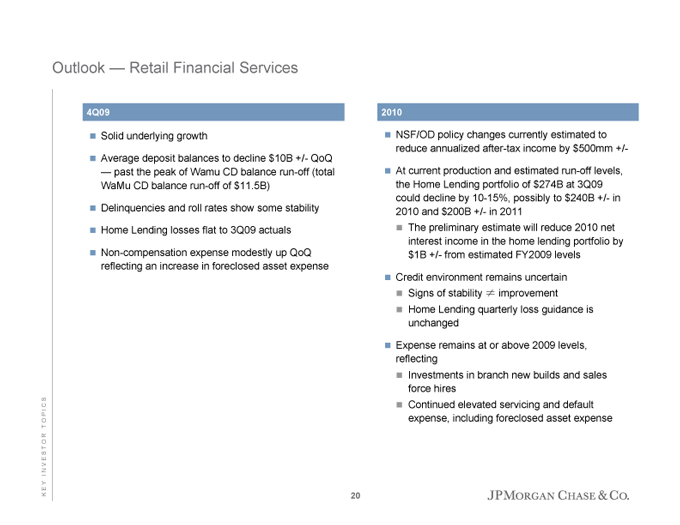
Outlook — Retail Financial Services
4Q09
Solid underlying growth
Average deposit balances to decline $10B +/- QoQ — past the peak of Wamu CD balance run-off (total WaMu CD balance run-off of $11.5B)
Delinquencies and roll rates show some stability
Home Lending losses flat to 3Q09 actuals
Non-compensation expense modestly up QoQ reflecting an increase in foreclosed asset expense
2010
NSF/OD policy changes currently estimated to reduce annualized after-tax income by $500mm +/-
At current production and estimated run-off levels, the Home Lending portfolio of $274B at 3Q09 could decline by 10-15%, possibly to $240B +/- in 2010 and $200B +/- in 2011
The preliminary estimate will reduce 2010 net interest income in the home lending portfolio by
$1B +/- from estimated FY2009 levels
Credit environment remains uncertain
Signs of stability ≠ improvement
Home Lending quarterly loss guidance is unchanged
Expense remains at or above 2009 levels, reflecting
Investments in branch new builds and sales force hires
Continued elevated servicing and default expense, including foreclosed asset expense
KEY INVESTORTOPICS
20
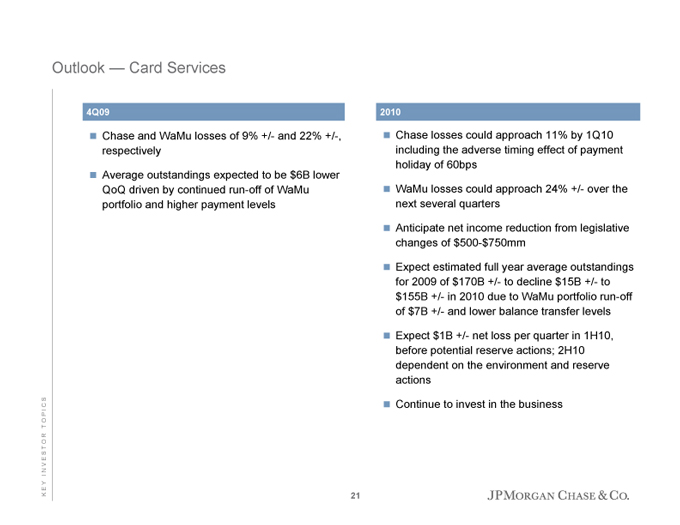
Outlook — Card Services
4Q09
Chase and WaMu losses of 9% +/- and 22% +/-, respectively
Average outstandings expected to be $6B lower QoQ driven by continued run-off of WaMu portfolio and higher payment levels
2010
Chase losses could approach 11% by 1Q10 including the adverse timing effect of payment holiday of 60bps
WaMu losses could approach 24% +/- over the next several quarters
Anticipate net income reduction from legislative changes of $500-$750mm
Expect estimated full year average outstandings for 2009 of $170B +/- to decline $15B +/- to $155B +/- in 2010 due to WaMu portfolio run-off of $7B +/- and lower balance transfer levels
Expect $1B +/- net loss per quarter in 1H10, before potential reserve actions; 2H10 dependent on the environment and reserve actions
Continue to invest in the business
KEY INVESTORTOPICS
21
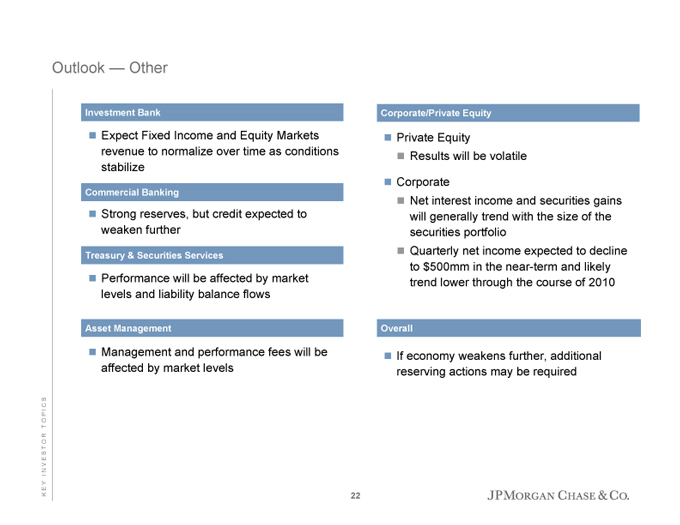
Outlook — Other
Investment Bank
Expect Fixed Income and Equity Markets revenue to normalize over time as conditions stabilize
Commercial Banking
Strong reserves, but credit expected to weaken further
Treasury & Securities Services
Performance will be affected by market levels and liability balance flows
Asset Management
Management and performance fees will be affected by market levels
Corporate/Private Equity
Private Equity
Results will be volatile
Corporate
Net interest income and securities gains will generally trend with the size of the securities portfolio
Quarterly net income expected to decline to $500mm in the near-term and likely trend lower through the course of 2010
Overall
If economy weakens further, additional reserving actions may be required
K E Y I N V E S T O R T O P I C S
22
Agenda
Page
Key Investor Topics 13
Appendix 23
23
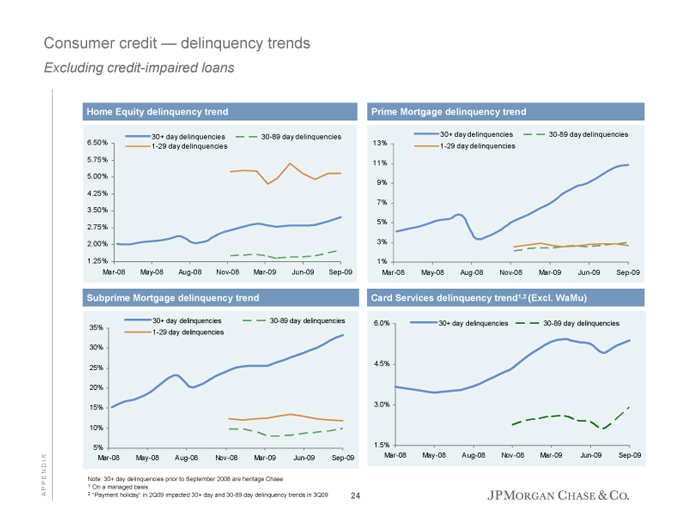
Consumer credit — delinquency trends
Excluding credit-impaired loans
Home Equity delinquency trend
30+ day delinquencies 30-89 day delinquencies
| 6.50% |
|
1-29 day delinquencies |
5.75%
5.00%
4.25%
3.50%
2.75%
2.00%
1.25%
Mar-08 May-08 Aug-08 Nov-08 Mar-09 Jun-09 Sep-09
Prime Mortgage delinquency trend
30+ day delinquencies 30-89 day delinquencies
13% 1-29 day delinquencies
11%
9%
7%
5%
3%
1%
Mar-08 May-08 Aug-08 Nov-08 Mar-09 Jun-09 Sep-09
Subprime Mortgage delinquency trend
30+ day delinquencies 30-89 day delinquencies
35% 1-29 day delinquencies
30%
25%
20%
15%
10%
5%
Mar-08 May-08 Aug-08 Nov-08 Mar-09 Jun-09 Sep-09
Card Services delinquency trend1,2 (Excl. WaMu)
| 6.0% |
|
30+ day delinquencies 30-89 day delinquencies |
4.5%
3.0%
1.5%
Mar-08 May-08 Aug-08 Nov-08 Mar-09 Jun-09 Sep-09
Note: 30+ day delinquencies prior to September 2008 are heritage Chase
| 1 |
|
On a managed basis |
| 2 |
|
“Payment holiday” in 2Q09 impacted 30+ day and 30-89 day delinquency trends in 3Q09 24 |
A P P E N D I X
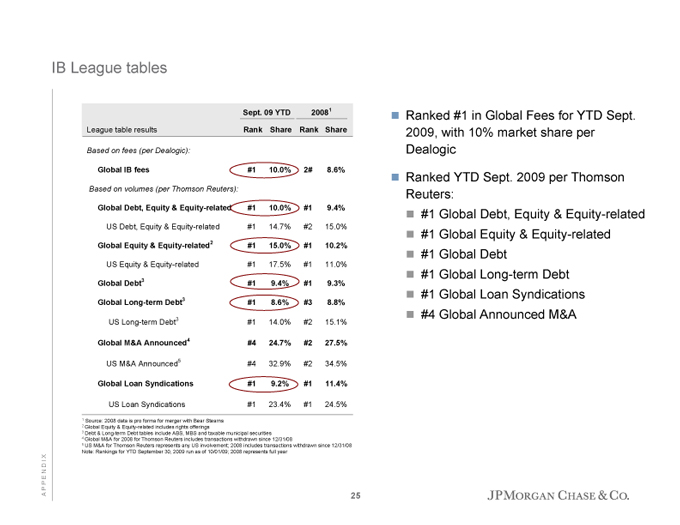
IB League tables
Sept. 09 YTD 20081
League table results Rank Share Rank Share
Based on fees (per Dealogic):
Global IB fees #1 10.0% 2# 8.6%
Based on volumes (per Thomson Reuters):
Global Debt, Equity & Equity-related #1 10.0% #1 9.4%
US Debt, Equity & Equity-related #1 14.7% #2 15.0%
Global Equity & Equity-related2 #1 15.0% #1 10.2%
US Equity & Equity-related #1 17.5% #1 11.0%
Global Debt3 #1 9.4% #1 9.3%
Global Long-term Debt3 #1 8.6% #3 8.8%
US Long-term Debt3 #1 14.0% #2 15.1%
Global M&A Announced4 #4 24.7% #2 27.5%
US M&A Announced5 #4 32.9% #2 34.5%
Global Loan Syndications #1 9.2% #1 11.4%
US Loan Syndications #1 23.4% #1 24.5%
Ranked #1 in Global Fees for YTD Sept. 2009, with 10% market share per Dealogic
Ranked YTD Sept. 2009 per Thomson Reuters:
#1 Global Debt, Equity & Equity-related
#1 Global Equity & Equity-related
#1 Global Debt
#1 Global Long-term Debt
#1 Global Loan Syndications
#4 Global Announced M&A
| 1 |
|
Source: 2008 data is pro forma for merger with Bear Stearns |
| 2 |
|
Global Equity & Equity-related includes rights offerings |
| 3 |
|
Debt & Long-term Debt tables include ABS, MBS and taxable municipal securities |
| 4 |
|
Global M&A for 2008 for Thomson Reuters includes transactions withdrawn since 12/31/08 |
5 US M&A for Thomson Reuters represents any US involvement; 2008 includes transactions withdrawn since 12/31/08 Note: Rankings for YTD September 30, 2009 run as of 10/01/09; 2008 represents full year
25
A P P E N D I X
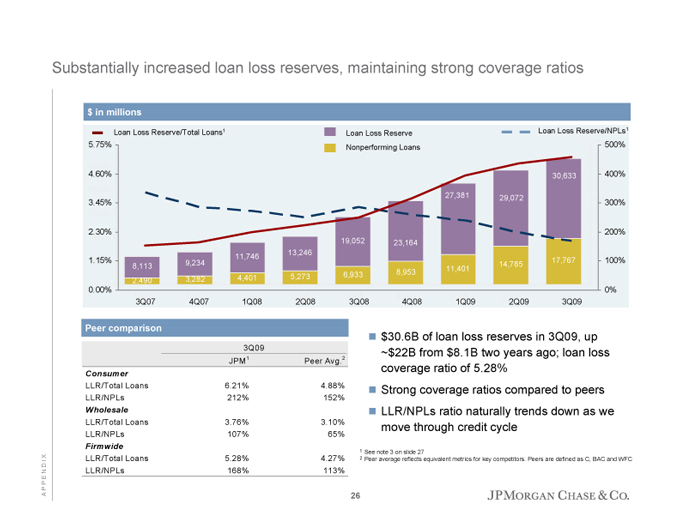
Substantially increased loan loss reserves, maintaining strong coverage ratios
$ in millions
Loan Loss Reserve/Total Loans1 Loan Loss Reserve Loan Loss Reserve/NPLs1
5.75% Nonperforming Loans 500%
| 4.60% |
|
30,633 400% |
27,381 29,072 3%
| 3.45% |
|
300% |
| 2.30% |
|
200% |
19,052 23,164
11,746 13,246
| 1.15% |
|
8,113 9,234 14,785 17,767 100% |
11,401
2,490 3,282 4,401 5,273 6,933 8,953 0%
0.00%
3Q07 4Q07 1Q08 2Q08 3Q08 4Q08 1Q09 2Q09 3Q09
Peer comparison
3Q09
JPM 1 Peer Avg.2
Consumer
LLR/Total Loans 6.21% 4.88%
LLR/NPLs 212% 152%
Wholesale
LLR/Total Loans 3.76% 3.10%
LLR/NPLs 107% 65%
Firmwide
LLR/Total Loans 5.28% 4.27%
LLR/NPLs 168% 113%
$30.6B of loan loss reserves in 3Q09, up
~$22B from $8.1B two years ago; loan loss coverage ratio of 5.28%
Strong coverage ratios compared to peers
LLR/NPLs ratio naturally trends down as we move through credit cycle
| 1 |
|
See note 3 on slide 27 |
| 2 |
|
Peer average reflects equivalent metrics for key competitors. Peers are defined as C, BAC and WFC |
A P P E N D I X
26
Notes on non-GAAP financial measures and forward-looking statements
This presentation includes non-GAAP financial measures.
1.Financial results are presented on a managed basis, as such basis is described in the firm’s Quarterly Reports on Form 10-Q for the quarters ended March 31, 2009, June 30, 2009 and September 30, 2009 and its Annual Report on Form 10-K for the year ended December 31, 2008.
2.All non-GAAP financial measures included in this presentation are provided to assist readers in understanding certain trend information.
Additional information concerning such non-GAAP financial measures can be found in the above-referenced filings, to which reference is hereby made.
3.The ratio for the allowance for loan losses to end-of-period loans excludes the following: loans accounted for at fair value and loans held-for-sale; purchased credit-impaired loans; the allowance for loan losses related to purchased credit-impaired loans; and, loans from the Washington Mutual Master Trust, which were consolidated on the firm’s balance sheet at fair value during the second quarter of 2009. Additionally, Consumer Lending net charge-off rates exclude the impact of purchased credit-impaired loans. The allowance related to the purchased credit-impaired portfolio was $1.1 billion at September 30, 2009.
4.Tier 1 Common Capital (“Tier 1 Common”) is calculated, for all purposes, as Tier 1 Capital less qualifying perpetual preferred stock, qualifying trust preferred securities, and qualifying minority interest in subsidiaries.
5.Tangible Common Equity (“TCE”) is calculated, for all purposes, as common stockholders equity (i.e., total stockholders’ equity less preferred stock) less identifiable intangible assets (other than MSRs) and goodwill, net of related deferred tax liabilities. The TCE measures used in this presentation are not necessarily comparable to similarly titled measures provided by other firms due to differences in calculation methodologies.
Forward looking statements
This presentation contains forward-looking statements within the meaning of the Private Securities Litigation Reform Act of 1995. Such statements are based upon the current beliefs and expectations of JPMorgan Chase’s management and are subject to significant risks and uncertainties. Actual results may differ from those set forth in the forward-looking statements. Factors that could cause JPMorgan Chase’s actual results to differ materially from those described in the forward-looking statements can be found in JPMorgan Chase’s Quarterly Reports on Form 10-Q for the quarters ended March 31, 2009, June 30, 2009 and September 30, 2009 and its Annual Report on Form 10-K for the year ended December 31, 2008, each of which has been filed with the Securities and Exchange Commission and is available on JPMorgan Chase’s website (www.jpmorganchase.com) and on the Securities and Exchange Commission’s website (www.sec.gov). JPMorgan Chase does not undertake to update the forward-looking statements to reflect the impact of circumstances or events that may arise after the date of the forward-looking statements.
27
A P P E N D I X