Attached files
| file | filename |
|---|---|
| 8-K - CURRENT REPORT ON FORM 8-K - TEMPLE INLAND INC | tin8kir20091202.htm |

1
Our
job is to be the best
Investor
Presentation

2
This
presentation contains “forward-looking statements” within the meaning of
the federal securities laws. These statements reflect management’s current views
with respect to future events and are subject to risk and uncertainties. We note
that a variety of factors and uncertainties could cause our actual results to differ
significantly from the results discussed in the forward-looking statements.
Factors and uncertainties that might cause such differences include, but are not
limited to: general economic, market, or business conditions; the opportunities
(or lack thereof) that may be presented to us and that we may pursue;
fluctuations in costs and expenses including the costs of raw materials,
purchased energy, and freight; changes in interest rates; current conditions in
financial markets could adversely affect our ability to finance our operations;
demand for new housing; accuracy of accounting assumptions related to
impaired assets, pension and postretirement costs, contingency reserves, and
income taxes; competitive actions by other companies; changes in laws or
regulations; our ability to execute certain strategic and business improvement
initiatives; the accuracy of certain judgments and estimates concerning the
integration of acquired operations; and other factors, many of which are beyond
our control.
This
presentation includes non-GAAP financial measures. The
required
reconciliations to GAAP financial measures are included on our website,
www.templeinland.com.
reconciliations to GAAP financial measures are included on our website,
www.templeinland.com.
Forward
Looking Statements

3
Create
Superior and Sustainable Value
• Maximize
ROI
• Profitably grow our
business

4
2009
First Nine Months Results
• Corrugated
Packaging
– Record first nine
months EBIT - $290 million
– 18.3%
ROI
• Building
Products
– Nine months EBITDA -
$25 million
– $16 million
improvement from first nine
months 2008
months 2008
5
• Corrugated
Packaging
• Building
Products
Business
Description
Financial
Highlights
|
($
in Millions)
|
2004
|
2005
|
2006
|
2007
|
2008
|
|
Revenue
|
$3,587
|
$3,723
|
$4,096
|
$3,850
|
$3,884
|
|
EBIT
|
$134
|
$133
|
$331
|
$161
|
$111
|
|
Investment
|
$2,370
|
$2,431
|
$2,620
|
$2,570
|
$2,484
|
|
ROI
|
5.7%
|
5.5%
|
12.6%
|
6.3%
|
4.5%
|
|
EBITDA
|
$340
|
$339
|
$542
|
$364
|
$317
|
Notes: Excludes
2004-2007 timber and timberland segment results.
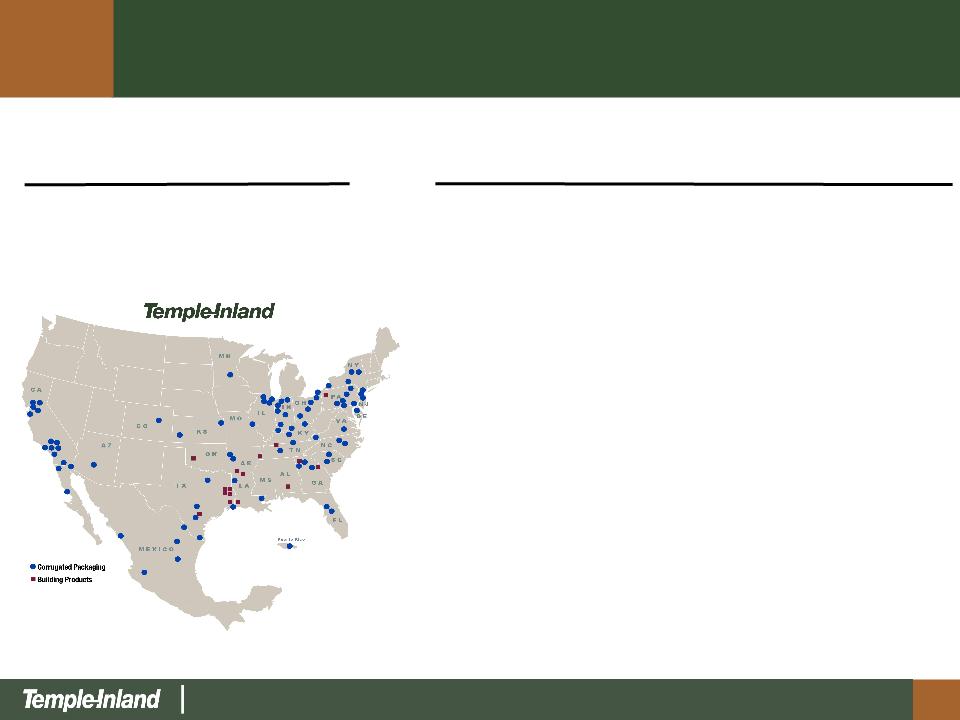
Temple-Inland

6
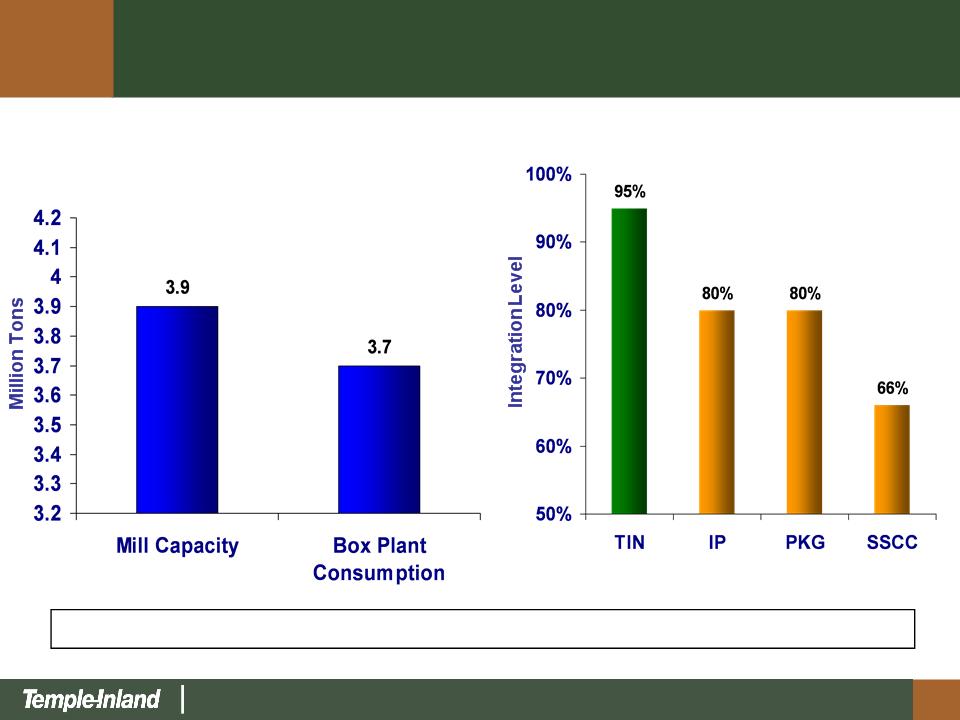
• 7 mills
- 3.9 million
tons
• 63 converting
facilities
- 3.7 million
tons
• # 3 industry
producer
Business
Highlights
Financial
Highlights
|
($
in Millions)
|
2003
|
2004
|
2005
|
2006
|
2007
|
2008
|
|
Revenue
|
$2,700
|
$2,736
|
$2,825
|
$2,977
|
$3,044
|
$3,190
|
|
EBIT
|
$18
|
$96
|
$120
|
$255
|
$287
|
$225
|
|
Investment
|
$2,237
|
$2,042
|
$2,125
|
$2,039
|
$2,004
|
$1,990
|
|
ROI
|
0.8%
|
4.7%
|
5.6%
|
12.5%
|
14.3%
|
11.3%
|
|
EBITDA
|
$185
|
$255
|
$280
|
$408
|
$429
|
$371
|
Corrugated
Packaging Segment Highlights

7
•
Maintain high integration level
- Box
plant consumption =
mill
capacity
• Drive
for
low
cost
- Asset utilization
and manufacturing excellence
• Improve
mix and margins
- Sales
excellence
•
Profitably grow business
-
Organically / Acquisition
Lowering
Costs, Improving Efficiencies and Growing Profitably
Corrugated
Packaging Strategic Initiatives
8
Source: Company
reports
Temple-Inland
is the most integrated producer of corrugated containers
Integration
Level - Highest in the Industry

9
Drive
For Low Cost
• Lower mill
costs
– Enhanced
reliability
– Targeted investments
to reduce energy consumption and
enhance mix flexibility
enhance mix flexibility
• Lower box plant
costs
– Box plant
transformation
• Cultural change to
lower costs by driving asset utilization
• Fewer plants, fewer
machines, fewer people
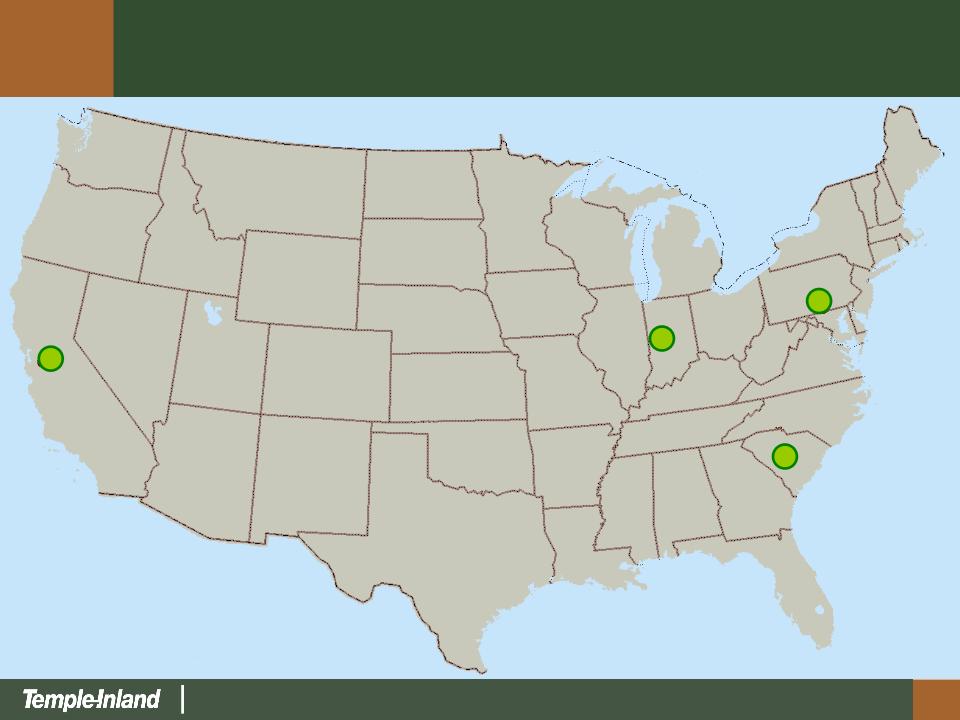
10
Tracy,
CA
Biglerville,
PA
Lexington,
SC
Crawfordsville,
IN
24/7
Plants
11
98”
CORRUGATOR
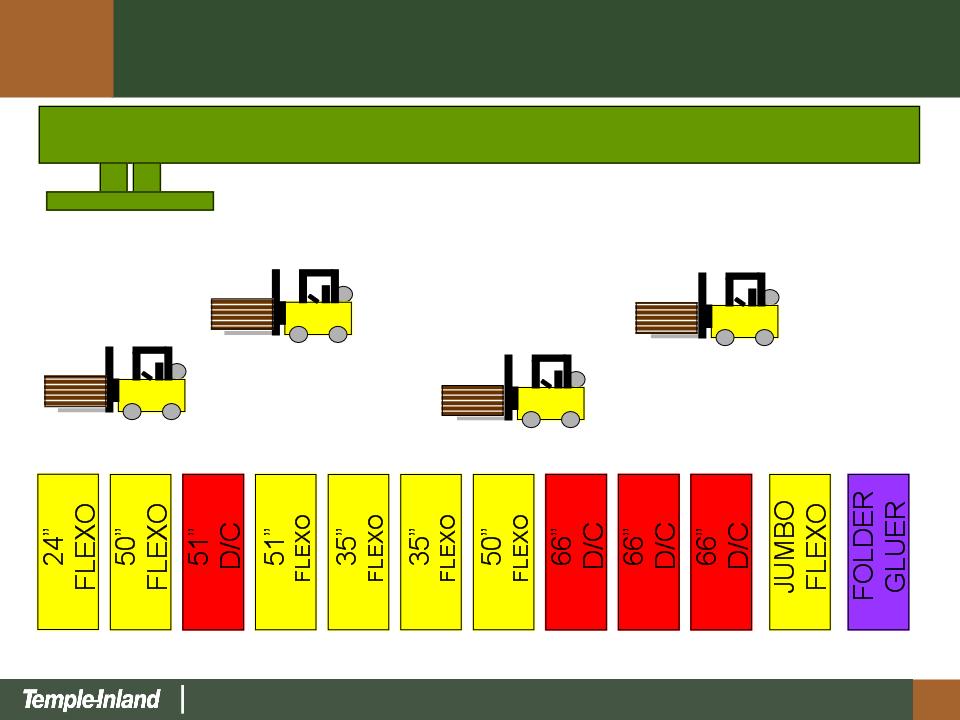
12
Machines
Asset
Utilization
Lexington Plant - Old Layout
Lexington Plant - Old Layout
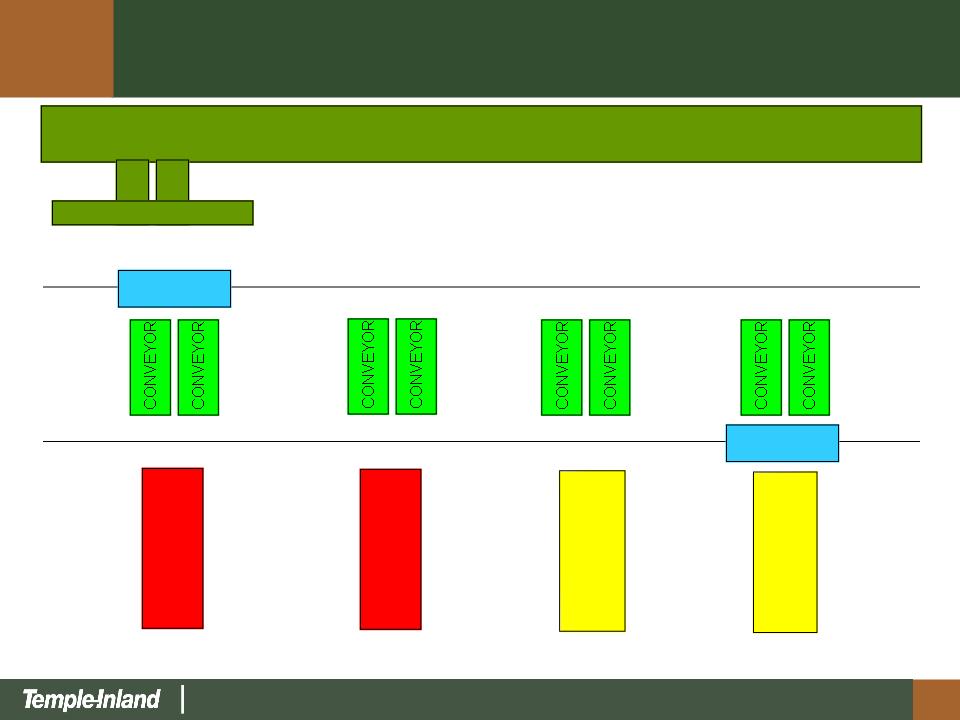
12
98”
CORRUGATOR
T-CART
T-CART
66”
D/C
35”
EVOL
66”
D/C
4
Machines
35”
EVOL
Asset
Utilization
Lexington Plant - New Layout
Lexington Plant - New Layout

13
|
|
Old
|
Future
|
%
∆
|
|
|
|
|
|
|
Machines
|
42
|
22
|
(48%)
|
|
People
|
920
|
703
|
(24%)
|
|
$
Cost/Ton
|
|
|
(34%)
|
|
|
|
|
|
Fewer
machines, fewer people, and lower costs
Note: Representative
of transformation of our four largest box plants.
Structural
Cost Change Underway

14
Improve
Mix and Margins
• Centralized pricing
decision making
• Structured and
disciplined approach to
market
market
• Target customers
where we can create
value
value
15
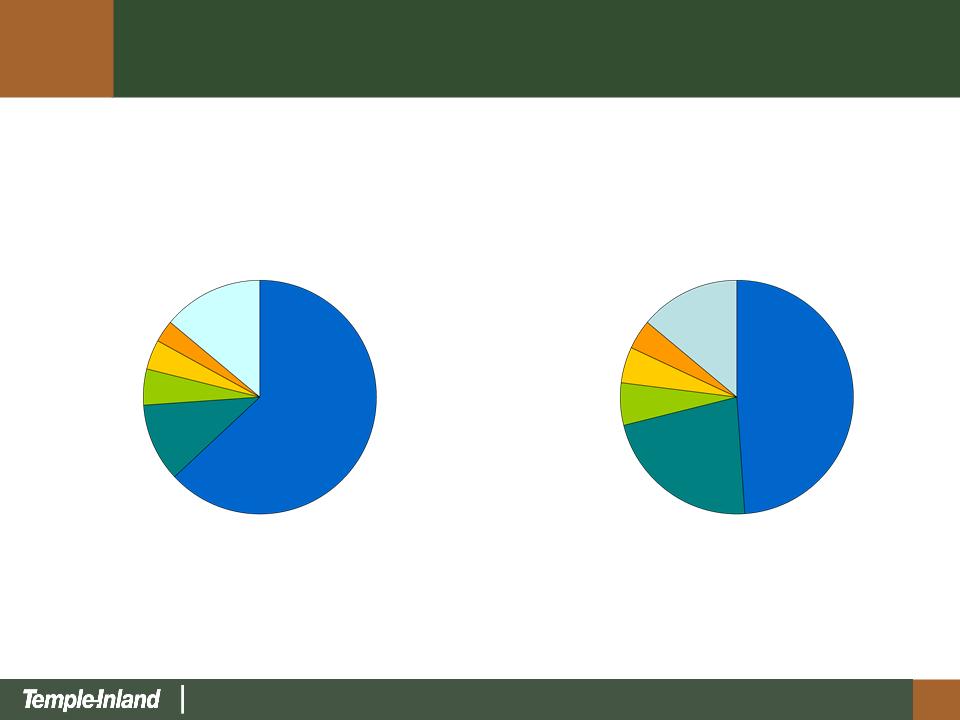
Food
& Beverage
63%
Misc.
Mfg.
3%
Other
14%
Chemicals
4%
Rubber
& Plastics
5%
Paper
& Allied
11%
Food
& Beverage
49%
Paper
& Allied
22%
Rubber
& Plastics
6%
Chemicals
5%
Misc.
Nondurables
4%
Misc.
Durable Goods
14%
Temple-Inland
Industry*
*Source: Fibre Box
Association
Shipments
by End-Use Industry

16
|
EBIT
Historical
PBL JV EBIT (50%)
Synergies
White-top
linerboard production
Total
EBIT
|
3Q/2009
Annualized
$ 9
20
30
$
59
|
|
Investment
Acquisition
(50% interest/50% JV debt)
White-top
production equipment
Total
investment
ROI
|
$
87
10
$
97
61%
|
($
In Millions)
Premier
Boxboard Acquisition Update
17
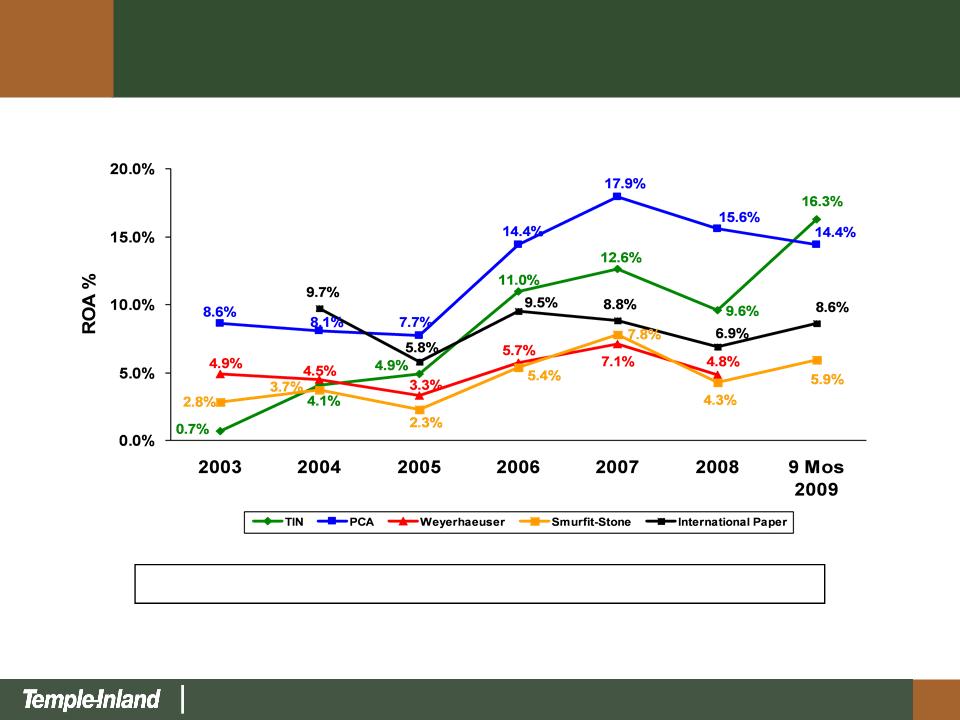
TIN
has highest ROA improvement relative to Peer Group
Notes:
(1) As reported by segment excluding special items
for TIN,
IP and Weyerhaeuser. For TIN and IP, the asset base was adjusted to include
acquisitions made in Q3 2008. (2) For PCA, EBIT =
Gross profit-selling and administrative expenses. (3) For SSCC, EBIT as reported by segment; total assets reported for the company in 2007, 2008 and first nine months 2009. For prior
years, total assets = segment assets + other assets of $3.3 billion.
Gross profit-selling and administrative expenses. (3) For SSCC, EBIT as reported by segment; total assets reported for the company in 2007, 2008 and first nine months 2009. For prior
years, total assets = segment assets + other assets of $3.3 billion.
Corrugated
Packaging - Highest ROA in
Industry
Industry

18
North
American Corrugated Packaging
Industry Fundamentals
Industry Fundamentals
• Consolidating industry
• Significant capacity
rationalization and
downtime
downtime
• Improved
pricing
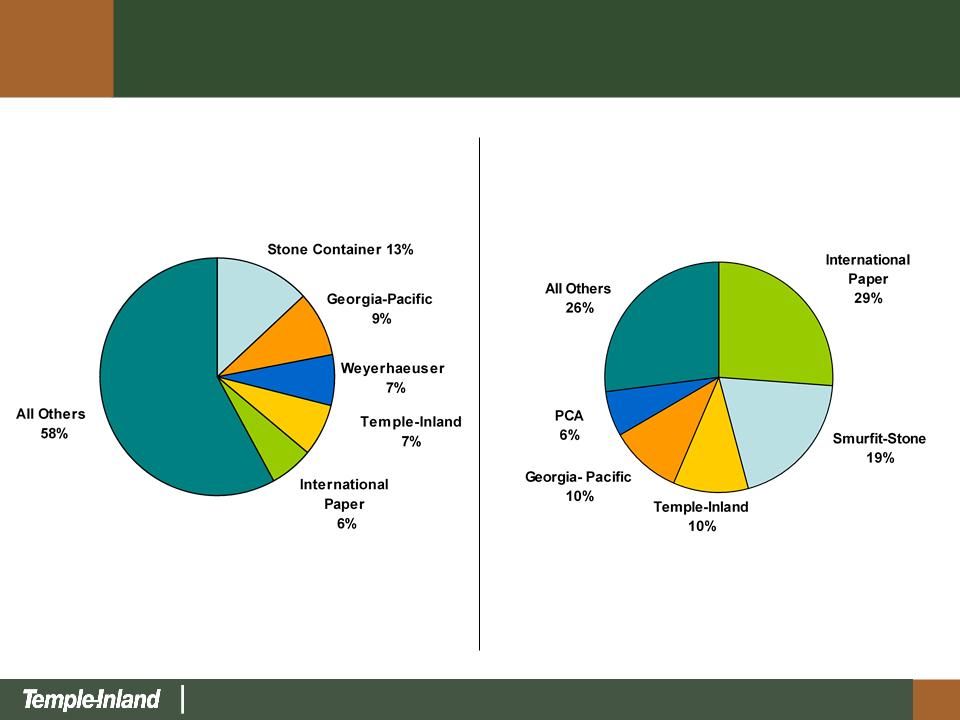
19
Top 5
Producers= 42%
1998
2009
Top 5
Producers= 74%
North
American Containerboard Market Share
1998 versus Today
1998 versus Today
20
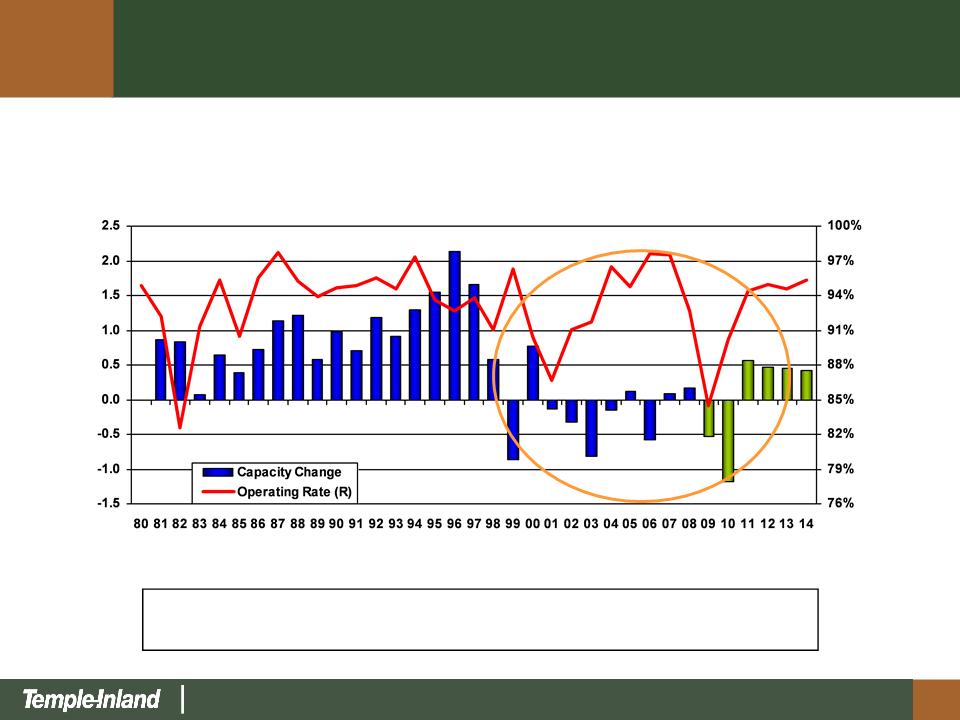
(Million
Short Tons)
Permanent
capacity reductions of 1.8 million tons, 4.5% of North
American capacity, announced for closure by January 2010
American capacity, announced for closure by January 2010
Source:
RISI and
Company
reports
Corrugated
Packaging
Industry Containerboard Capacity Changes and Operating Rate
Industry Containerboard Capacity Changes and Operating Rate

21
Source:
RISI
Linerboard
($/ton)
Improved
Linerboard Pricing
Linerboard
Pricing Trends
Average annual linerboard price has declined only modestly in
2009

22
Corrugated
Packaging Summary
• Track record of
success
• Simple, effective
strategy…execution = results
• Industry
discipline

23
• Portfolio
of Products
– Lumber
– Gypsum
– Particleboard
– MDF
• Lowest
quartile cost converting
operations
operations
• Located
near large, high-growth
markets
markets
Financial
Highlights
Business
Highlights
|
($
in Millions)
|
2004
|
2005
|
2006
|
2007
|
2008
|
|
Revenue
|
$851
|
$898
|
$1,119
|
$806
|
$694
|
|
EBIT
|
$129
|
$125
|
$221
|
$8
|
($40)
|
|
Investment
|
$396
|
$361
|
$586
|
$562
|
$560
|
|
ROI
|
32.6%
|
34.6%
|
37.7%
|
1.4%
|
(7.1%)
|
|
EBITDA
|
$167
|
$160
|
$265
|
$53
|
$8
|
Building
Products

24
Building
Products Strategic Initiatives
• Deliver
tailored portfolio of building products
– Products for new
home, repair and remodeling
and commercial markets
and commercial markets
• Drive
low cost
– Manufacturing
excellence
• Serve
preferred markets
– Favorable
demographics
• Provide
sales excellence
– Unequaled customer
service
25
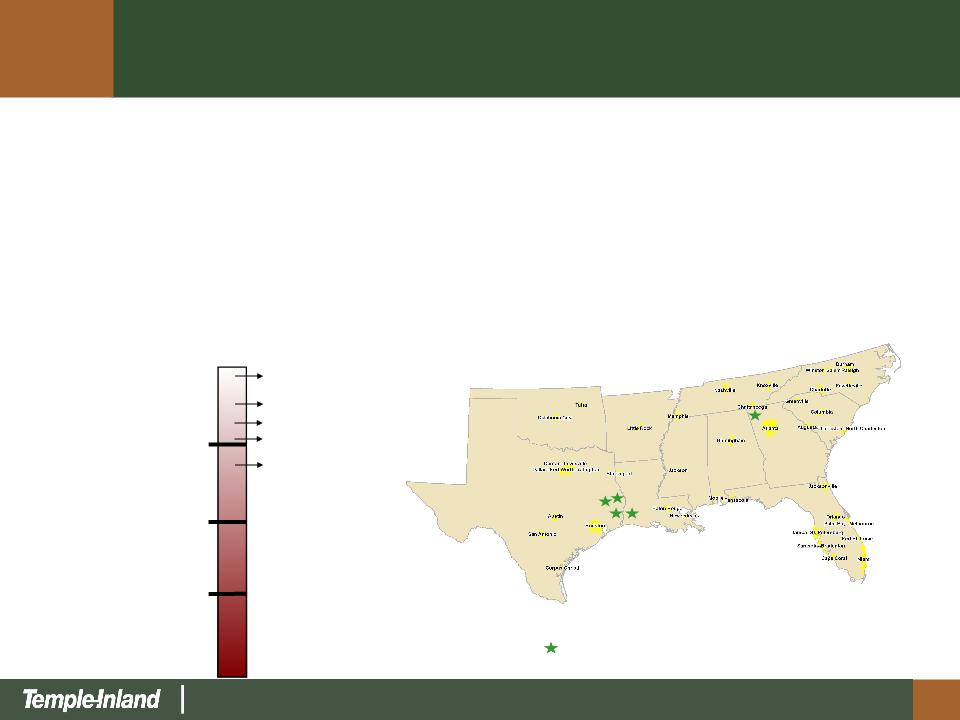
Buna
Pineland
Diboll
Rome
DeQuincy
Lumber
Competitive
Position
Temple-Inland
Sawmills
1st
Quartile
2nd
Quartile
3rd
Quartile
4th
Quartile
Source:
Beck &
RISI Studies
RISI Studies
Temple-Inland
Sawmills
Sawmill
Locations
Lumber
• Low cost, state of
art manufacturing system
• Logistically
advantaged to large growing markets
• Stable fiber supply
at market prices
26
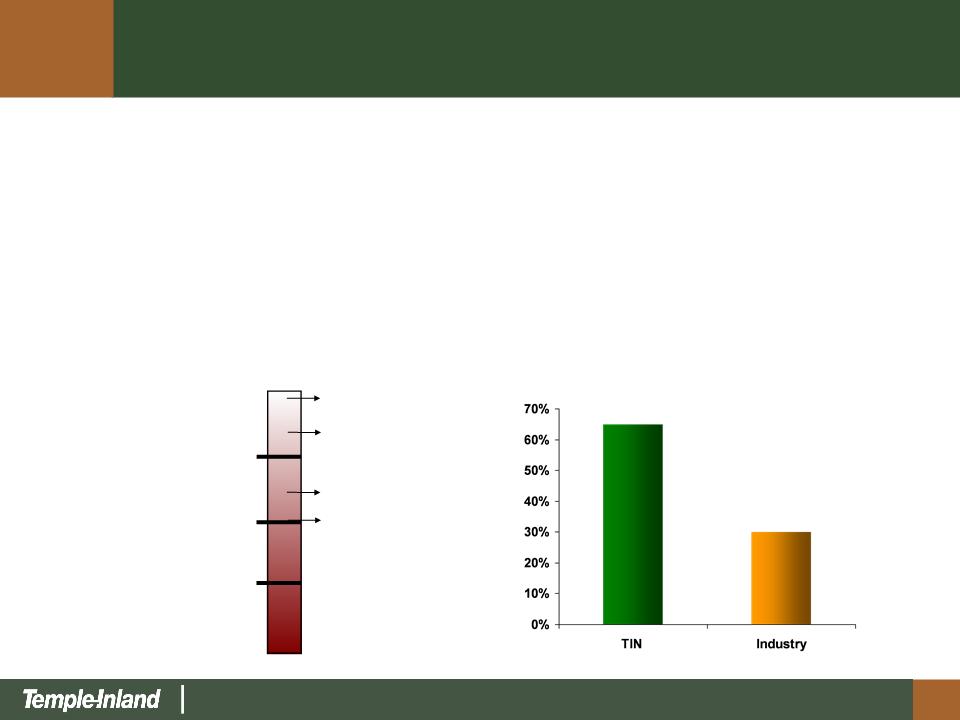
Synthetic
Gypsum Furnish
Gypsum
Competitive
Position
Cumberland
Fletcher
W. Memphis
McQueeney
1st
Quartile
2nd
Quartile
3rd
Quartile
4th
Quartile
Source:
Internal
Analysis
Internal
Analysis
Gypsum
• Low-cost
manufacturing system
• Synthetic gypsum
furnish 65% vs. 30% for industry

27
Panels
Competitive
Position
Monroeville
Hope
Diboll
Thomson
1st
Quartile
2nd
Quartile
3rd
Quartile
4th
Quartile
Source:
Beck Study
Beck Study
PB
MDF
El
Dorado
Mt.
Jewett
Industrial
Panels - Particleboard & MDF
• Lowest cost
system
• High-value
engineered family of
products
products
• Targeted
markets
– Kitchen
cabinets
– Laminators
– MDF laminate
flooring
28
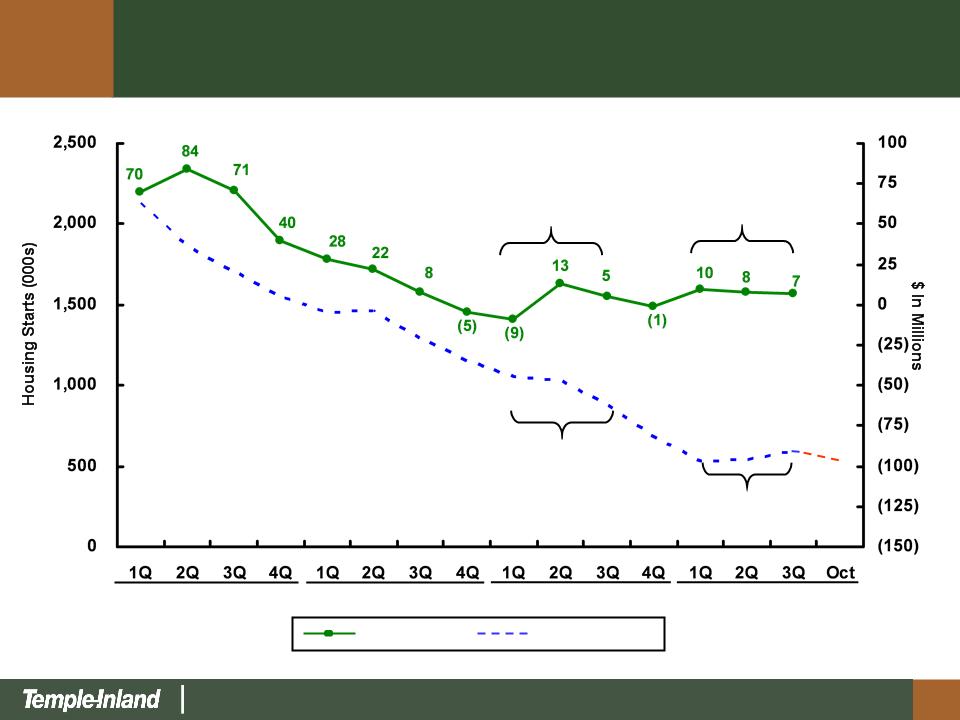
Housing
Starts
TIN
EBITDA
2006
2007
2008
2,127
2009
981
552
529
9
25
Building
Products EBITDA Trends

29
($
In Millions)
|
Temple-Inland
SG&A
Total Cost
*
SG&A/Total
Cost
|
9
mos/ 2009
215
2,546
8.4%
|
|
|
|
|
Wtd. Avg.
SG&A/Total Cost of Peers**
TIN
Rank
|
10.6%
1
|
*Total
cost = SG&A + Cost of sales excluding alternative fuel mixture
credit
**Peers
include: International Paper, Smurfit-Stone, MeadWestvaco, Rock Tenn, Packaging
Corp.
Comparative
SG&A Expenses

30
Total
Debt
$879
Borrowings
Under
Committed
Credit
Facilities
$297
Term
Debt
$582
($
In Millions)
Third
Quarter-End 2009 Debt Structure
31
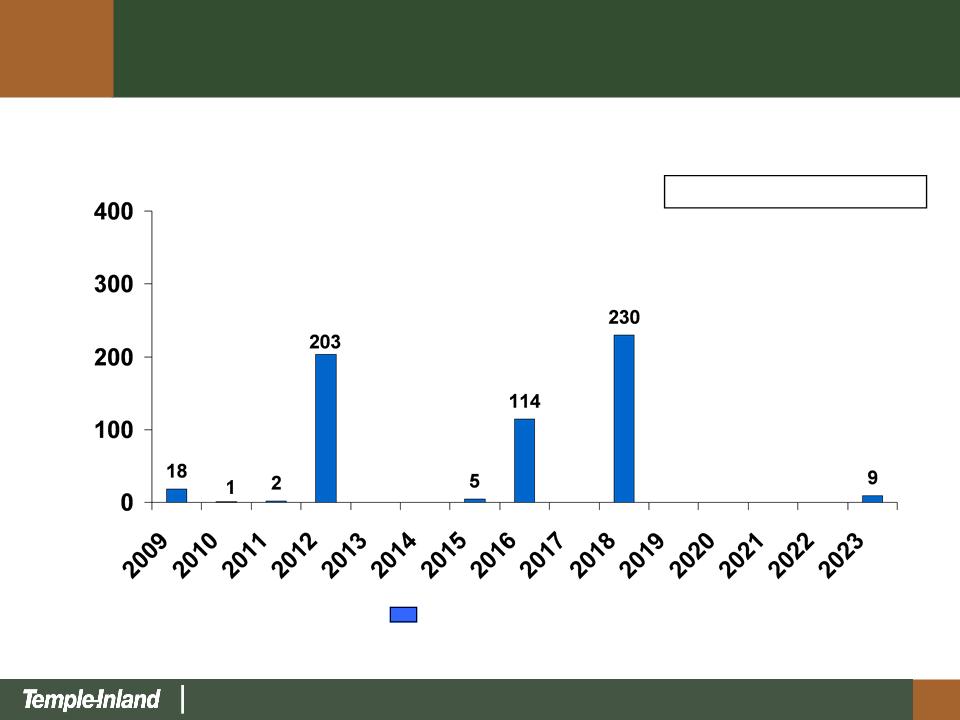
Term
debt
($
In Millions)
Total
Term Debt = $582MM
Term
Debt Maturity Profile as of Third
Quarter-End 2009
Quarter-End 2009

32
($
In Millions)
Accounts
Receivable Committed
Securitization Credit
Facility Agreements Total
|
Committed
Less:
Borrowings
Letters
of credit
|
$
250
(225)
-
|
$
825
( 72)
( 33)
|
$1,075
( 297)
( 33)
|
|
Unused
borrowing capacity
|
$ 25
|
$
720
|
$ 745
|
|
Facility
Maturities
|
Oct.
2012
|
July 2011
($750MM
revolver) |
|
|
Covenants (as
specifically defined):
Debt/total
capital
Interest
coverage *
|
3Q-End
2009
48.7%
8.4x
|
70%
Max
3.0x
Min
|
|
* Best
4 out of 5 trailing
quarters 3Q/2009 = 13.2x
quarters 3Q/2009 = 13.2x
Third
Quarter-End 2009
Committed Credit Facilities
Committed Credit Facilities

33
Financial
Priorities
• Return cash to
shareholders
– Dividend
• Reduce
debt
• Invest in our
business
• Profitably
grow

34
Dec
2009
Create
Superior and Sustainable Value
• Maximize
ROI
• Profitably grow our
business