Attached files
| file | filename |
|---|---|
| 8-K - FORM 8-K - MOSAIC CO | d8k.htm |
 2009 Citi Investment Research Basic Materials Conference Larry Stranghoener, Executive Vice President and Chief Financial Officer December 2, 2009 Exhibit 99.1 |
 Slide 2 Safe Harbor Statement This presentation contains forward-looking statements within the meaning of the
Private Securities Litigation Reform Act of 1995. Such statements
include, but are not limited to, statements about future financial and
operating results. Such statements are based upon the current beliefs
and expectations of The Mosaic Company’s management and are subject to significant risks and uncertainties. These risks and uncertainties include but are not limited to the predictability and volatility of, and customer expectations about, agriculture,
fertilizer, raw material, energy and transportation markets that are subject
to competitive and other pressures and the effects of the current
economic and financial turmoil; the build-up of inventories in the
distribution channels for crop nutrients; changes in foreign currency and exchange rates; international trade risks; changes in government policy; changes in environmental and other governmental regulation, including greenhouse gas regulation;
difficulties or delays in receiving, or increased costs of, necessary
governmental permits or approvals; the effectiveness of our processes for
managing our strategic priorities; adverse weather conditions affecting
operations in Central Florida or the Gulf Coast of the United States,
including potential hurricanes or excess rainfall; actual costs of asset retirement, environmental remediation, reclamation or other environmental regulation differing from
management’s current estimates; accidents and other disruptions
involving Mosaic’s operations, including brine inflows at its
Esterhazy, Saskatchewan potash mine and other potential mine fires, floods,
explosions, seismic events or releases of hazardous or volatile chemicals,
as well as other risks and uncertainties reported from time to time in The Mosaic Company’s reports filed with the Securities and Exchange Commission. Actual
results may differ from those set forth in the forward-looking
statements. |
 Slide 3 Strategic Focus Deliver value for shareholders Focus on Potash and Phosphate •Grow Potash •Strengthen Phosphate Align distribution assets Maintain a strong balance sheet |
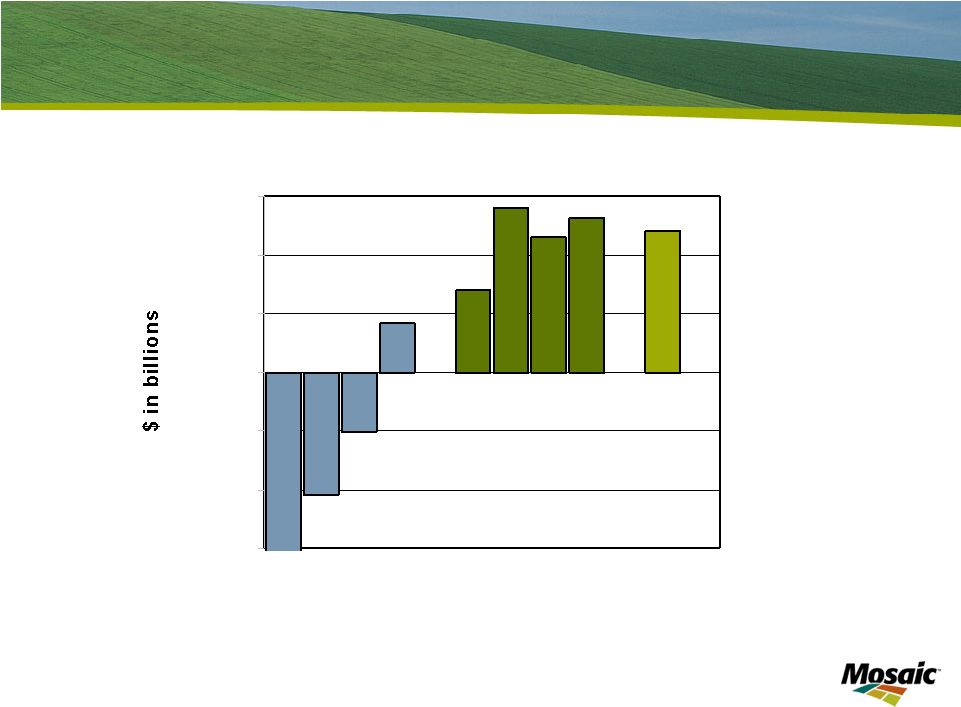 Slide 4 Net Cash Position (Cash Less Debt) $(1,500) $(1,000) $(500) $- $500 $1,000 $1,500 FY2008 FY2009 FY2010 |
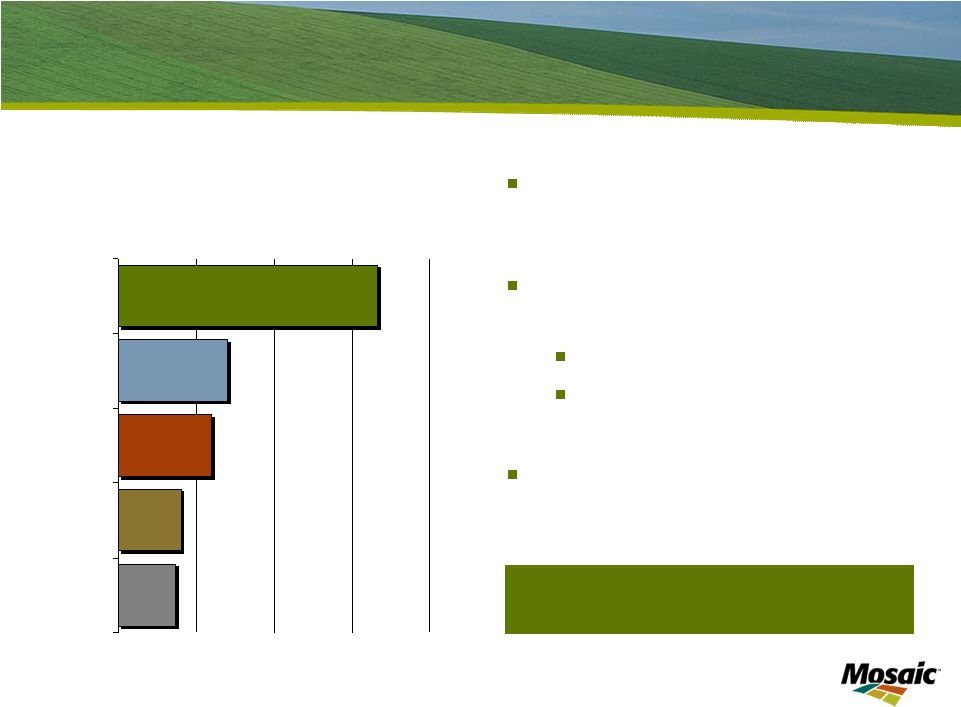
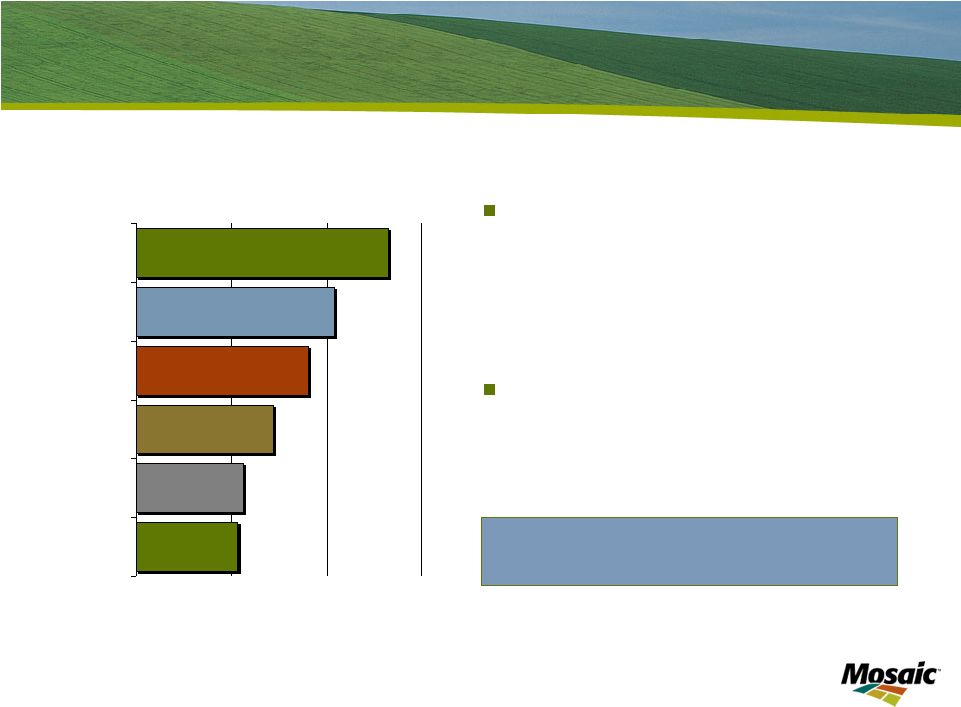 Slide 5 Leading Global Potash Producer Mosaic potash production • 13% Global • 40% North America • Five mines Competitive industry position World capacity approximates 73 million tonnes (all potash products) 0 5 10 15 PotashCorp Mosaic Belaruskali Kali & Salz Silvinit Uralkali Million tonnes product •Potash Fertilizer Capacity Source: Fertecon / Mosaic |
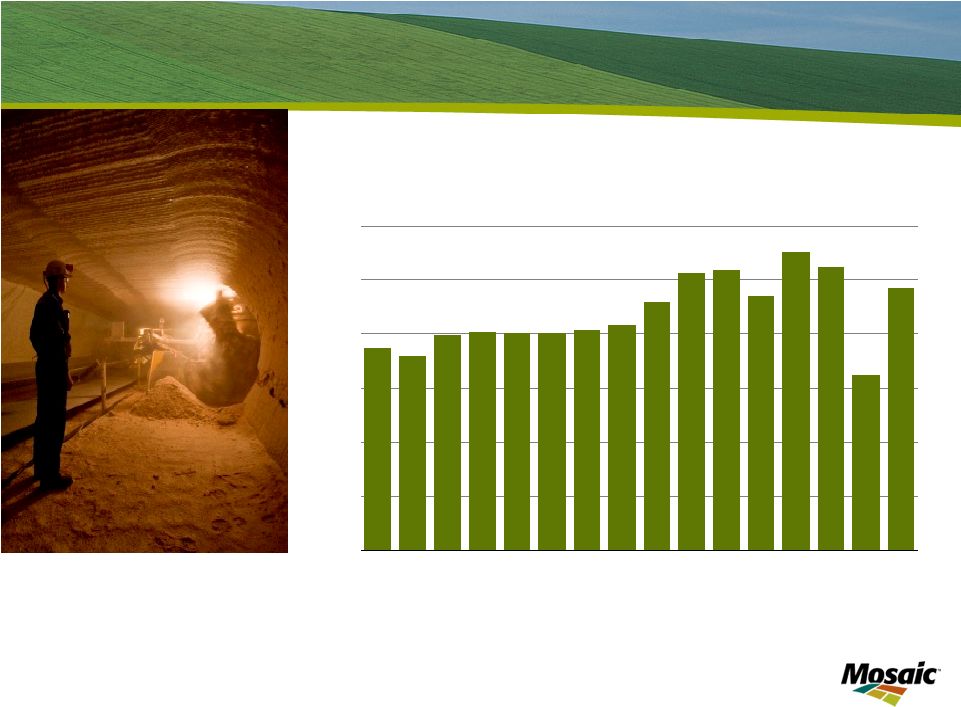 Slide 6 MOP Demand World MOP Demand 0 10 20 30 40 50 60 95 96 97 98 99 00 01 02 03 04 05 06 07 08 09F 10F Mil Tonnes Source: Mosaic |
 Slide 7 Growth Opportunities - Our Potash Expansions * The projected annual capacity includes approximately 1.3 million tonnes (as shaded in blue) that we currently produce under a third party tolling agreement at our Esterhazy, Saskatchewan potash
mine. Based on our present calculations, we believe that our obligation to supply potash under this agreement will expire by August 30, 2010. The customer has filed a lawsuit against us contesting our basis and timing for termination of the agreement. We believe the allegations in the customer’s lawsuit are without merit.
Growth from 10.4 to 16.8* million tonnes Location Estimated Annual Capacity Increase (tonnes in millions) Estimated Completion Belle Plaine 2.0 2015 - 2020 Colonsay 1.3 2011 - 2017 Esterhazy 1.8 2013 - 2016 Total 5.1 - 2 4 6 8 10 12 14 16 18 |
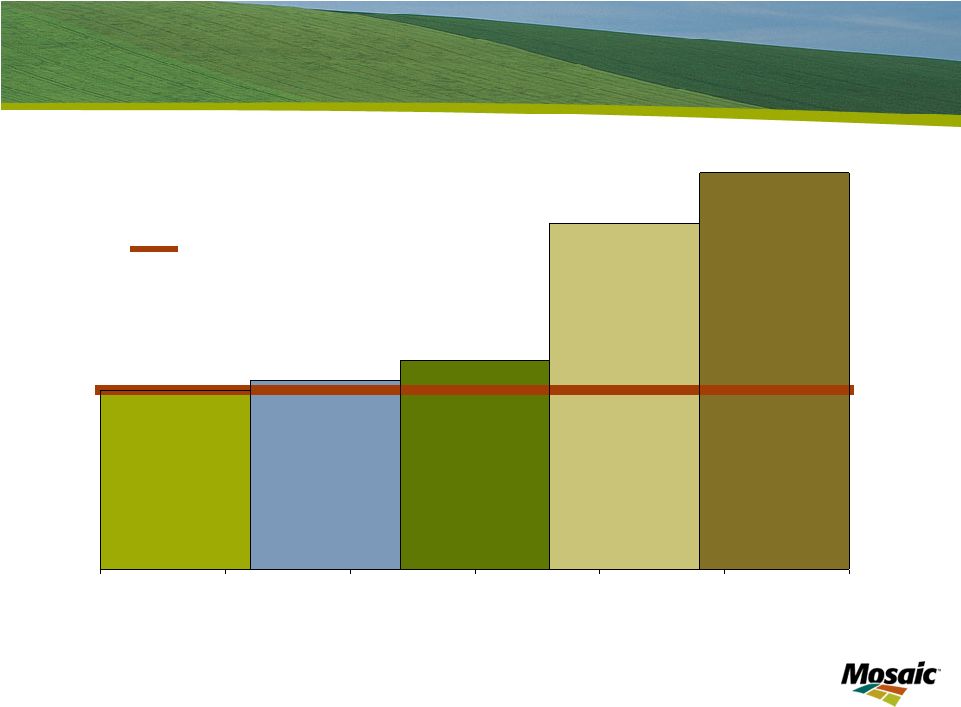
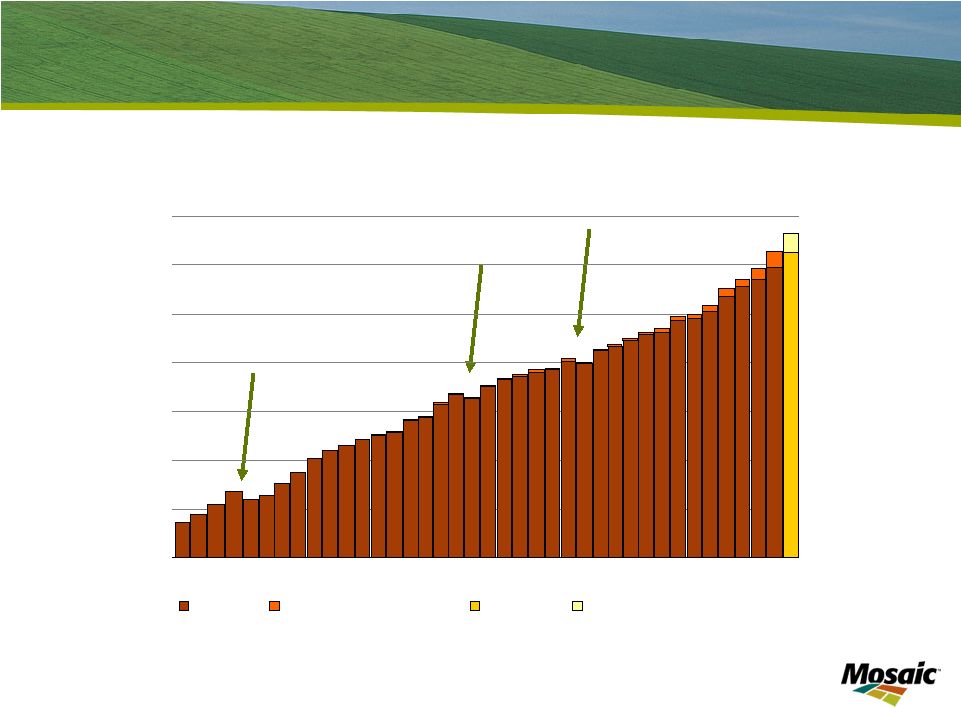
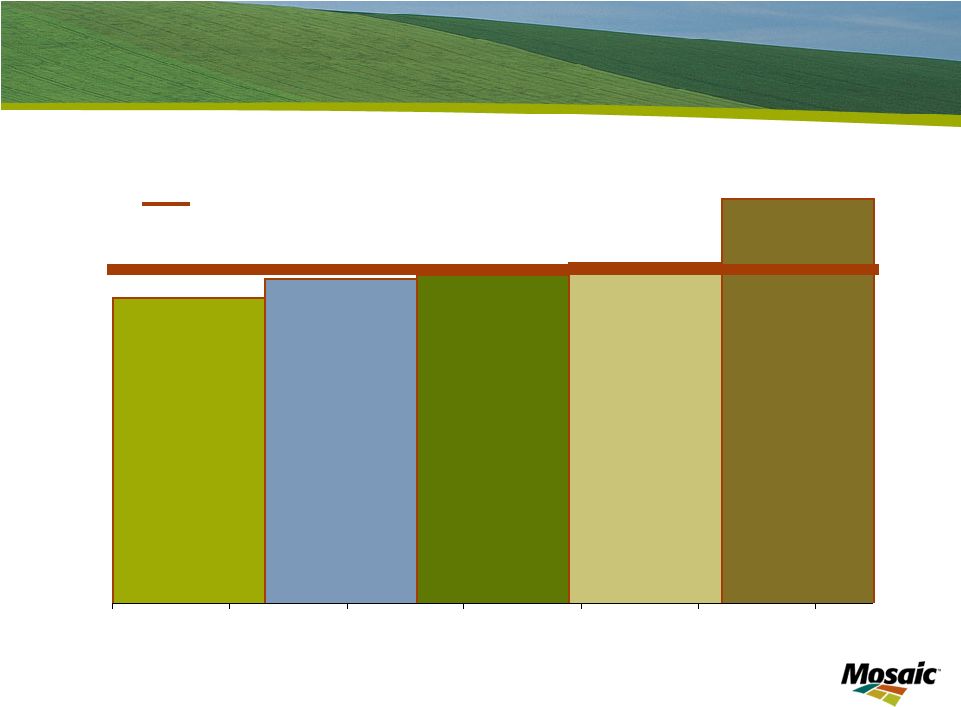 *Excludes Canadian Resource Taxes and Royalties for all Canadian potash producers. Slide 8 Expansions Improve Mosaic’s Cost Structure Source: Mosaic Industry Cost Curve - MOP 2009 Q2 * Delivered US Cornbelt First Quintile Weighted Average Second Quintile Weighted Average Third Quintile Weighted Average Fourth Quintile Weighted Average Fifth Quintile Weighted Average 0 10 20 30 40 50 60 Million Tonnes US$ Tonne Mosaic |
 Slide 9 Shift in Business Mix (sales tonnes) Present Future Potash 49% Phosphates 51% Potash 60% Phosphates 40% |
 Slide 10 World’s Largest Integrated Phosphate Producer World’s largest capacity of finished phosphate fertilizer Mosaic phosphate production share 13% Globally 58% U.S. World scale & efficient operations World capacity approximates 74 million tonnes (DAP/MAP/TSP) 0 3 6 9 12 Mosaic YTH OCP PhosAgro CF •Phosphate Fertilizer Capacity Million tonnes
product Source: Fertecon / Mosaic |
 Slide 11 Phosphate Demand World Processed Phosphate Demand 0 10 20 30 40 50 60 95 96 97 98 99 00 01 02 03 04 05 06 07 08 09F 10F Mil Tonnes Source: Mosaic DAP, MAP and TSP |
 Slide 12 Industry Leading Cost Structure in Phosphate Industry Cost Curve - DAP fob Plant/Port 2009 Q2 First Quintile Weighted Average Second Quintile Weighted Average Third Quintile Weighted Average Fourth Quintile Weighted Average Fifth Quintile Weighted Average 0 5 10 15 20 25 30 Million Tonnes US$ Tonne Mosaic Average Source: Mosaic |
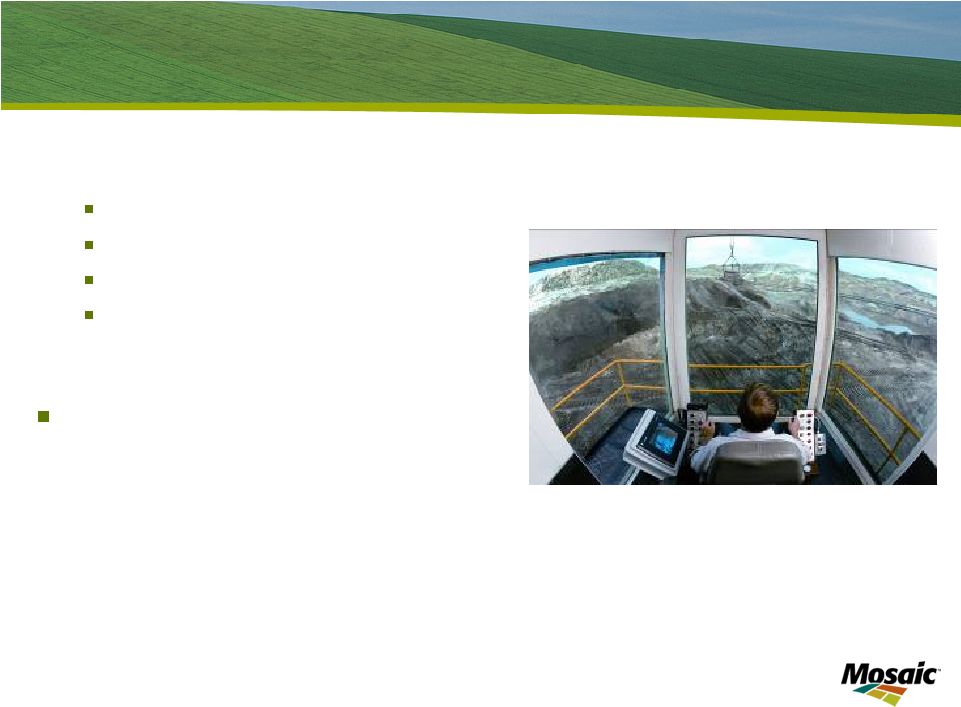 Slide 13 Phosphates Opportunities Operational Cost Savings MRO Contract services Process chemicals Energy – heat recovery and conversion Phosphate Rock and Other Strategic Opportunities |
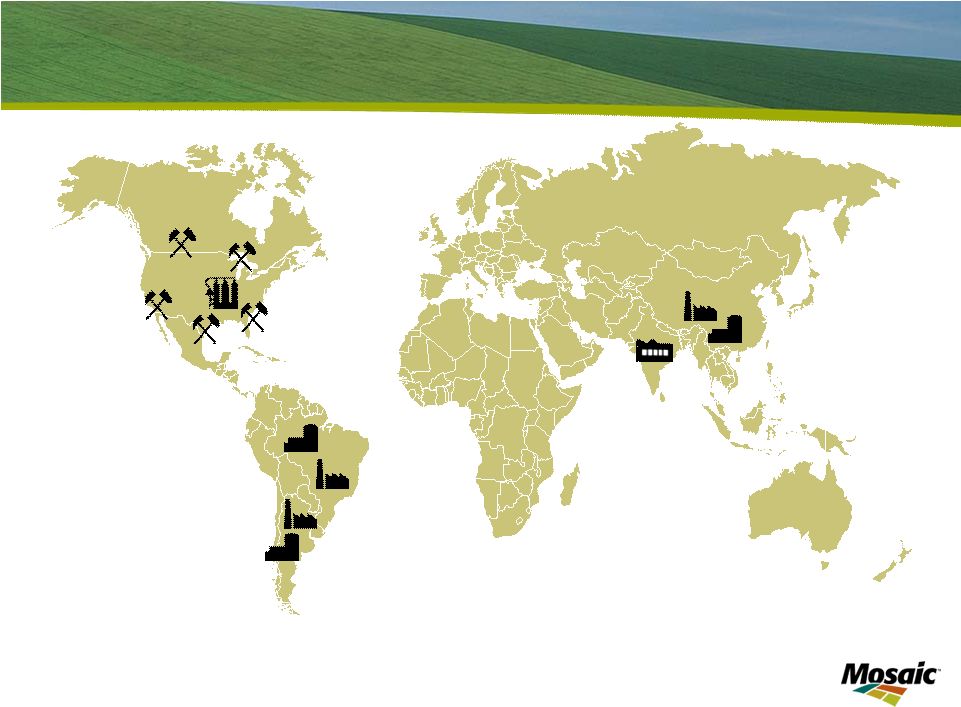 Slide 14 Distribution Assets Aligned with Global Demand Canada 3 Mines United States 9 Current & Future Mines 4 Phosphate Plants Argentina 1 Warehouse & Blender 1 Production/Warehouse Brazil 7 Warehouse & Blender 2 Production/Warehouse China 2 Warehouse & Blender 2 Production/Warehouse India 1 Warehouse |
 Business Outlook |
 Slide 16 Growing Global Affluence + Fuel China and India: GDP & middle class growth trends continue USA: Ethanol growth to 15 billion gallons by 2015* The 2009 mandate for ethanol is 10.5 billion gallons* Brazil: Growth trends in soybean yields and planted area *Source: EPA |
 Slide 17 Growing Grain & Oilseed Use World Grain and Oilseed Use 1.00 1.25 1.50 1.75 2.00 2.25 2.50 2.75 70 72 74 76 78 80 82 84 86 88 90 92 94 96 98 00 02 04 06 08E Source: USDA and Mosaic Bil Tonnes Actual Actual for US Ethanol Forecast Forecast for U.S. Ethanol |
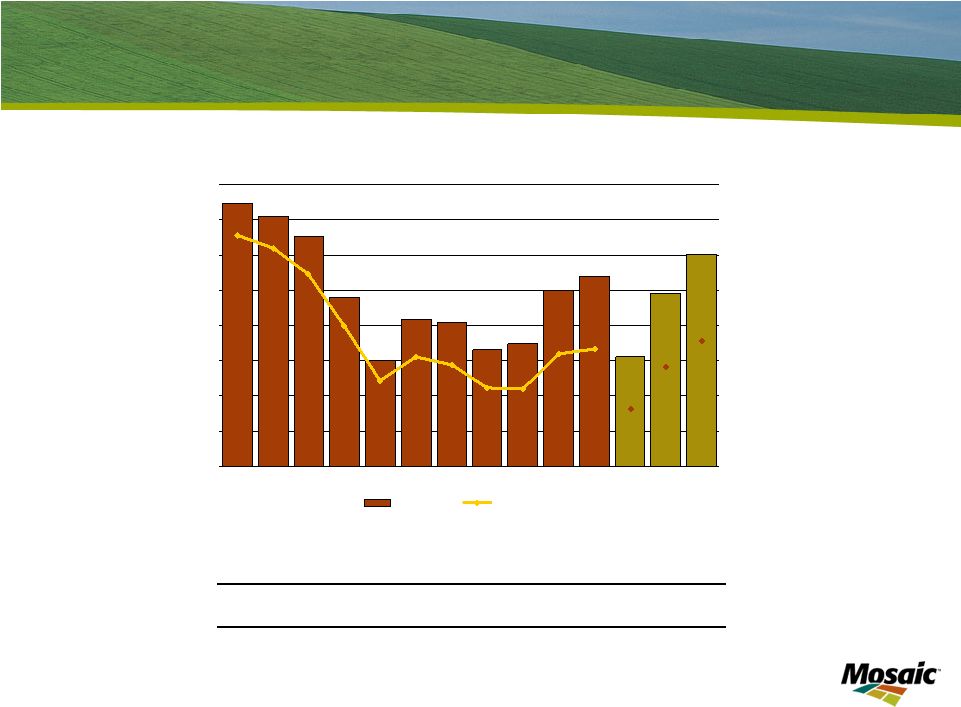 Slide 18 Another Large Crop Needed in 2010 World Grain and Oilseed Stocks 250 300 350 400 450 500 550 600 650 99/00 00/01 01/02 02/03 03/04 04/05 05/06 06/07 07/08 08/09 09/10 10/11 L 10/11 M 10/11 H Mil Tonnes 40 50 60 70 80 90 100 110 120 Days of Use Stocks Days of Use Source: USDA and Mosaic (for 10/11 scenarios) 2010/11 Scenario Assumptions Low Medium High Harvested Area Change -0.5% -0.5% -0.5% Yield Deviation from 11-Year Trend Largest Negative 0 Largest Positve Demand Growth 1.5% 2.0% 2.5% |
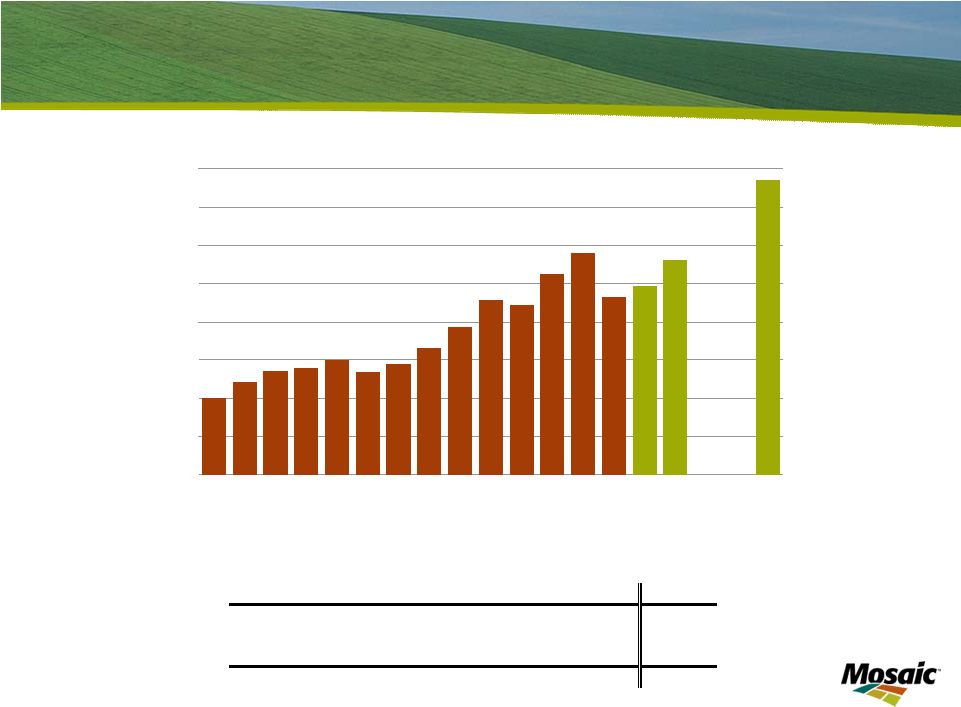
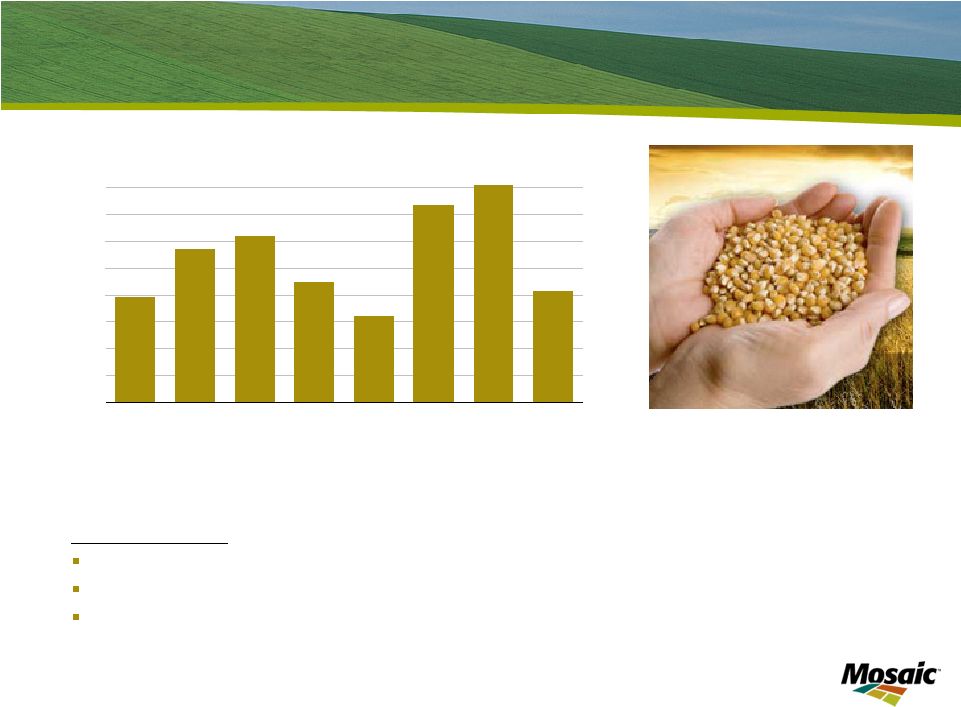 Slide 19 Farm Economics Remain Strong Key assumptions ISU application rate recommendations 2009 and 2010 crops sold at CBOT closing prices on Nov 23, 2009 less basis Fertilizer prices for 2003 - 2009 are from USDA. 2010 fertilizer prices are based on current spot wholesale prices Crop Nutrient Costs on Corn in Iowa Bushels of Corn Per Acre 0 5 10 15 20 25 30 35 40 2003 2004 2005 2006 2007 2008 2009F 2010F Sources: Iowa State University, USDA and Mosaic Bu Corn |
 2007/08 2008/09E 2009/10F 2010/11F 2013/14F Nitrogen 3.3% -1.9% 2.5% 2.4% 7.3% Phosphate 0.3% -10.1% 3.8% 5.3% 17.8% Potash 7.0% -19.5% -3.7% 10.8% 26.7% Total 3.2% -6.8% 1.9% 4.2% 12.6% Source: IFA May & November 2009 Changes in World Fertilizer Consumption Slide 20 Growth Expected to Resume World Nutrient Use 110 120 130 140 150 160 170 180 190 95 96 97 98 99 00 01 02 03 04 05 06 07 08E 09F 10F 13F Source: IFA May & November 2009 Mil Tonnes Fertilizer Year |
 Slide 21 Key Takeaways Global leader with vertically integrated operations Focus on value creation Potash growth projects at attractive capital costs Phosphate growth options in rock reserves and acquisitions Encouraging recent market trends |
 Thank you |