Attached files
| file | filename |
|---|---|
| 8-K - FORM 8-K - Energy Future Holdings Corp /TX/ | d8k.htm |
 EFH
Corp. 2009 BOA/ML Credit Conference Discussion Deck December 2-3, 2009 Exhibit 99.1 |
 1 Safe Harbor Statement This presentation contains forward-looking statements, which are subject to various
risks and uncertainties. Discussion of risks and uncertainties that
could cause actual results to differ materially from management's current
projections, forecasts, estimates and expectations is contained in EFH Corp.'s
filings with the Securities and Exchange Commission (SEC). In addition
to the risks and uncertainties set forth in EFH Corp.'s SEC filings, the
forward-looking statements in this presentation regarding the company’s long- term hedging program could be affected by, among other things: any change in the ERCOT
electricity market, including a regulatory or legislative change that results in wholesale electricity prices not being largely driven by natural gas prices; any decrease in market
heat rates as the long-term hedging program generally does not mitigate
exposure to changes in market heat rates; the unwillingness or failure of any
hedge counterparty or the lender under the commodity collateral posting
facility to perform its obligations under a long-term hedge agreement or
the facility, as applicable; or any other unforeseen event that results in the
inability to continue to use a first lien to secure a substantial portion of the hedges under the long-term hedging program. In addition, the forward-looking
statements in this presentation regarding the company’s new generation
plants could be affected by, among other things, any adverse judicial rulings with respect to the plants’ construction and operating permits. Regulation G This presentation includes certain non-GAAP financial measures. A reconciliation of
these measures to the most directly comparable GAAP measures is included in
the appendix to this presentation. |
 2 2 nd largest competitive electric generator in US Largest lignite/coal and nuclear baseload generation fleet in Texas Low-cost lignite reserves Largest T&D utility in Texas High-growth service territory Constructive regulatory regime Largest retail electricity provider in Texas Strong customer value proposition The #1 power generator, retail electricity provider and transmission & distribution
utility in Texas. Energy Future Holdings Overview |
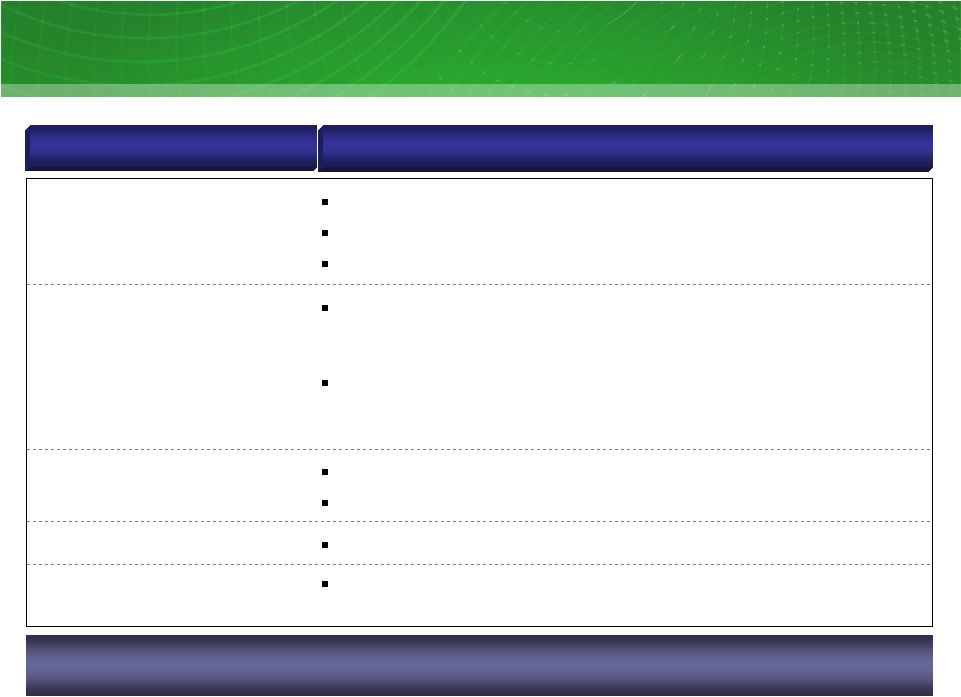
 3 Closed JV with MHI for Comanche Peak 3 & 4 Comanche Peak 3 & 4 DOE ranking (5th) Received CREZ final order for $1.3 billion Implemented new customer care systems at TXU Energy HR processes (Talent Management, Performance Management, other) Over 400,000 AMS meters installed Solid earnings Amended TCEH Credit Agreement Hedging effectiveness Solid safety performance Sandow 5 / Oak Grove 1 & 2 construction on time and on budget Baseload plants performing well Implemented Service Excellence and Governance Where Have We Been? .... Highlights Since Merger National climate and RES leadership Operational Operational achievements achievements Liquidity management improvements Oncor Rate Case completed Financial Financial achievements achievements Strategic Strategic initiatives initiatives |
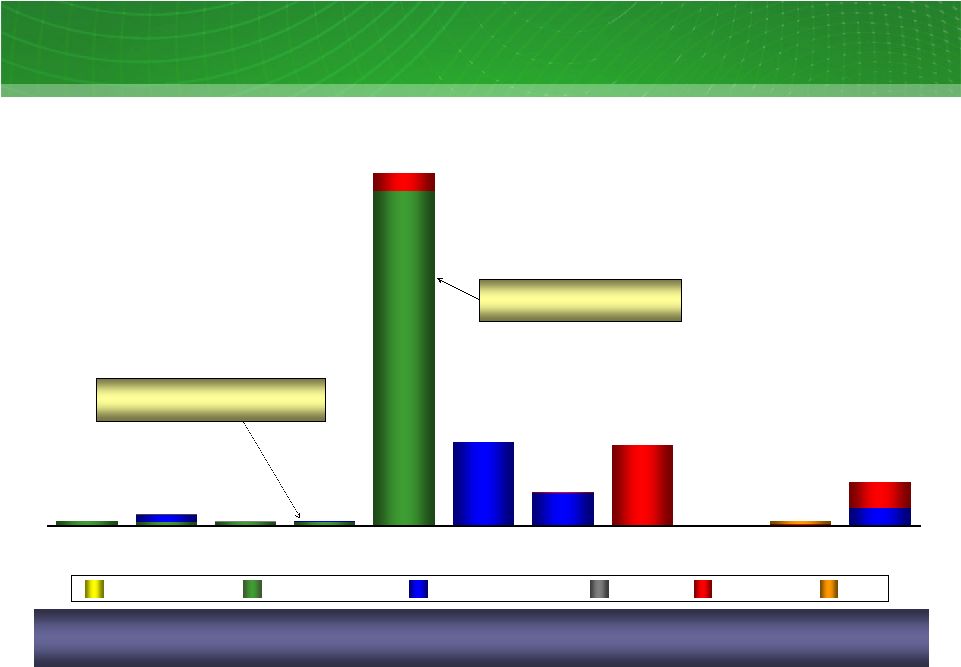
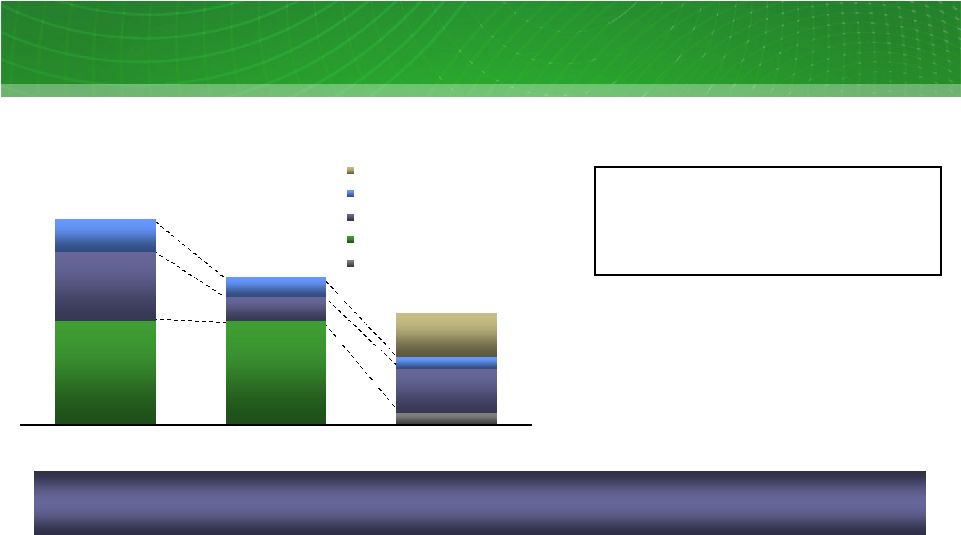
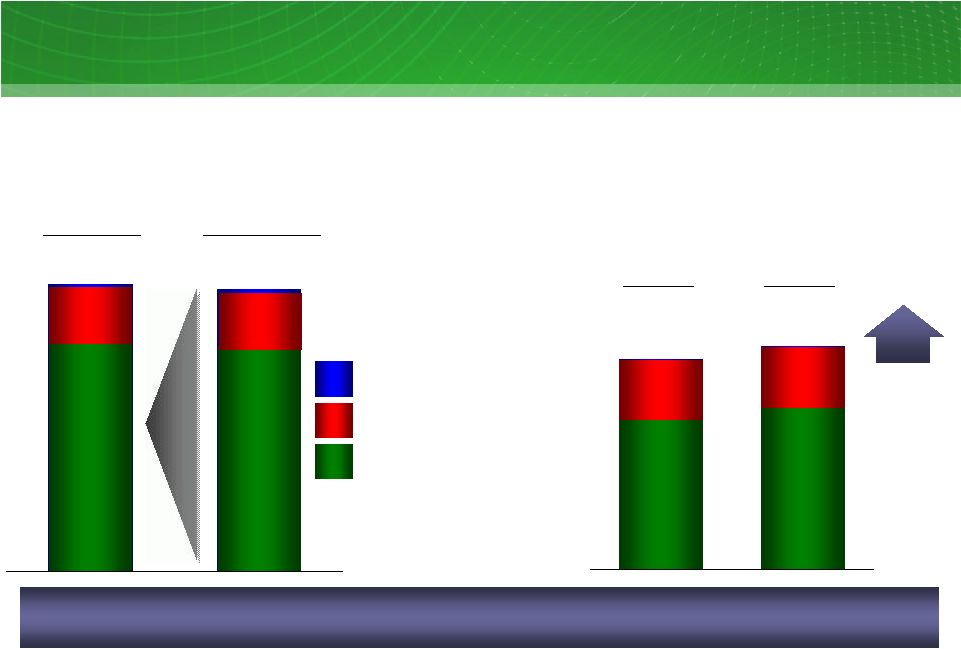 4 1,021 1,044 2,760 2,564 3,819 3,596 1 See Appendix for Regulation G reconciliations and definition. 2 Twelve months ended December 31, 2008. Includes $7 million for 2008 Plan and $21
million for 2008 Actual of Corp. & Other Adjusted EBITDA 3 Year to date results as of September 30, 2008 and 2009. Includes $11 million and
$15 million in 2008 YTD and 2009 YTD, respectively, of Corp. & Other Adjusted EBITDA. EFH maintains solid earnings performance, which reflects operational improvements
and the effectiveness of our hedge program. EFH Corp. Adjusted EBITDA (non-GAAP) 1 2008 Plan 2 vs. 2008 Actual 2 and YTD 08 3 vs. YTD 09 3 ; $ millions TCEH Corp. & Other Oncor 2008 Actual 2008 Plan 4,674 4,578 3,242 3,325 98% of Plan 1,342 1,315 YTD 08 YTD 09 6% EFH Corp. Earnings Performance |
 5 2009E TCEH Adjusted EBITDA $2,760 YTD 9/30/09 2010 TCEH Adjusted EBITDA (non-GAAP) Key Drivers No Guidance for 2010 $? Q4 $300 - $400 $100 - $200 $0 - $100 $325 - $425 2010 Est. Impact vs 2009 (millions) Key Drivers Assumptions New Build 11-13 TWh $7.80/MMBtu hedge price 7.2-7.4 heat rate $56-$58 / MWh power price $34-$37 / MWh margin Retail Margins Potential retail margin expansion driven by lower commodity environment PRB Higher delivered PRB coal costs - $10-$12 / ton - 10-15 million tons Commodity Lower effective NG hedge - $0.34 / MMBtu - 500-550 MMBtu Lower effective HR hedge - $2-$3 / MWh - 60-70 TWh 1 Illustrative for discussion purposes 2 1 See Appendix for Regulation G reconciliations and definition. 2 Total new build generation for 2010 and assumes performance for initial start-up year of operations for
Oak Grove 1 and Sandow 5, and mid-year substantial completion for Oak Grove 2
|
 6 TCEH Open EBITDA (non-GAAP) Estimate $1,900 2010E % $ $/MWh $/MWh TWh Units 5-10% $5.3 - $5.7B $25 - $27 $42 - $44 72 – 78 2010E Estimated power price Assumptions Retail Revenues 4 Profitability percentage (after tax) 5 Wholesale Total baseload generation Average baseload cost TCEH Open EBITDA (non-GAAP) Estimate 10E: $ millions 1 2 3 1 Open EBITDA estimates assume generation is sold at market observed forward prices less production costs and
retail volumes are sold at market observed retail rates and historical retail profitability
percentage. Estimates exclude all impacts of natural gas and power hedging activities, specifically the impacts of the TCEH Long-Term Hedging Program and any heat rate hedges. Additionally, this calculation includes provisions for fuel expense and O&M based on
expected power generation output along with purchased power for sales to retail customers, and
SG&A based on the generation output and sales to retail customers. See Appendix for Regulation G definition. 2 Estimated wholesale power prices for 2010 are based on average ERCOT NZ prices as of 9/30/09. 3 Includes fuel (excluding nuclear fuel amortization), O&M and SG&A expenses 4 Based on an 11¢ / kWh average residential new offer pricing as reflected on the www.powertochoose.org and ~50 TWh of historical TXU Energy total sales 5 Calculation assumes a 35% overall tax rate |
 7 7 7 EFH Corp. Adjusted EBITDA Sensitivities Commodity Percent Hedged at September 30, 2009 Change 2010 Impact $ millions 7X24 market heat rate (MMbtu/MWh) ~70 0.1 MMBtu/MWh ~16 NYMEX gas price ($/MMBtu) >95 $1/MMBtu ~12 Texas gas vs. NYMEX Henry Hub price ($/MMBtu) 3,4 >95 $0.10/MMBtu ~0 Diesel ($/gallon) 5 ~100 $1/gallon ~0 Base coal ($/ton) 6 ~85 $5/ton ~10 Generation operations Baseload generation (TWh) n.a. 1 TWh ~20 Mine productivity (tons produced) n.a. 1 million tons ~5 Retail operations Residential contribution margin ($/MWh) 28 TWh $1/MWh ~28 Residential consumption 28 TWh 1% ~10 Business markets consumption 25 TWh 1% ~4 Impact on EFH Corp. Adjusted EBITDA 10E; mixed measures 1 Balance-of-year (BOY) estimate based on commodity positions as of 9/30/09, net
of long-term hedges and wholesale/retail effects. 2 Simplified representation of heat rate position in a single TWh position. In
reality, heat rate impacts are differentiated across baseload plants (linked primarily to changes in North Zone 7x24), natural gas plants (primarily North Zone 5x16) and wind (primarily West Zone
7x24). 3 Assumes conversion of electricity positions based on a ~8.0 market heat rate with
natural gas being on the margin ~75-90% of the time (i.e., when coal is forecast to be on the margin, no natural gas position is assumed to be generated). 4 The percentage hedged represents the amount of estimated natural gas exposure based on Houston Ship Channel (HSC) gas price sensitivity as a proxy for Texas gas price. 5 Includes fuel surcharge on rail transportation. 6 Excludes fuel surcharge on rail transportation. 2 3 1 The majority of 2010 commodity-related risks are significantly mitigated.
|
    8 Execute an aggressive management plan Deliver top decile/quartile results Maintain a competitive position in marketplace Maintain and enhance TXU Energy brand Identify and mitigate operational risks EFH Corp. Strategic Focus Sustainable, Flexible, Dynamic Organization Operational Excellence Operational Excellence Prudent financial management Optimize balance sheet Optimize hedge platform Identify and execute internal / organic opportunities Financial Optimization Financial Optimization Position for Growth Position for Growth |
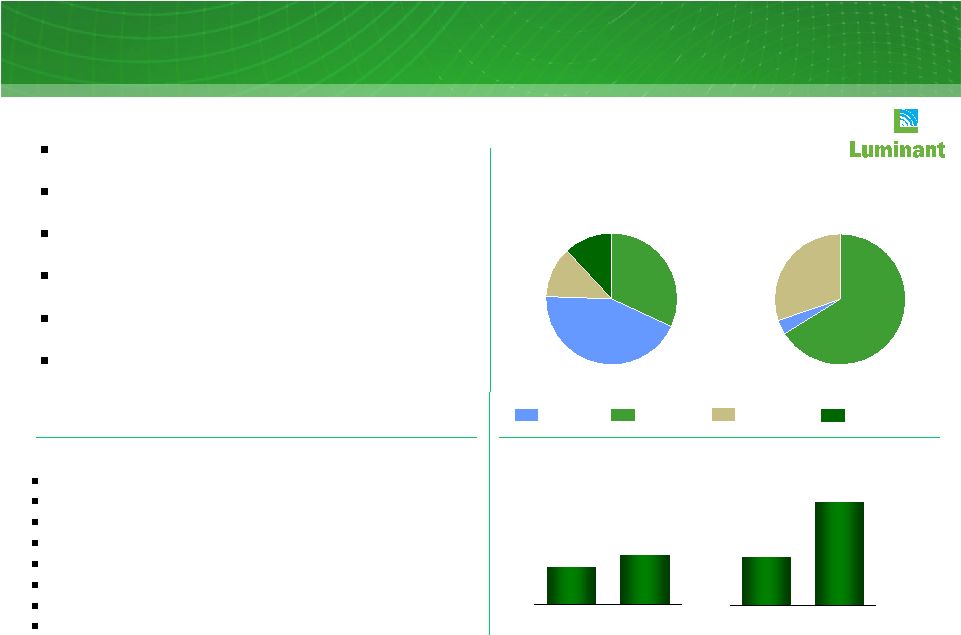 9 1 Installed nameplate capacity. Includes 2,181 MW of new coal-fueled generation
under construction that is expected to come online in 2009 and 2010, 1,953 MW of mothballed gas plant capacity, 655 MW of gas plant capacity currently in Reliability Must Run (RMR) status
with ERCOT. Excludes 2,226 MW of gas-fueled generation from 10 units retired in May 2009. 2 At 9/30/09 3 Excludes purchased power 4 Twelve months ended 9/30/09 5 Total lignite and PRB fuel expense excluding emissions 30% 66% 4% Luminant Overview Business Profile Generation Baseload around-the-clock assets that dispatch at low heat rate levels ~2,200 MW of capacity under construction and/or start-up Low-cost lignite reserves - Luminant mines ~20 million tons of lignite annually Liquidity-light natural gas hedging program designed to provide cash flow security Voluntary SO and NO x emission reduction program expected to reduce emissions below US averages Comanche Peak expansion through Mitsubishi partnership may provide a low-cost nuclear growth option 12% 44% 32% 12% Coal Gas Nuclear Generating capacity 9/30/09 ; MW Total generation 9/30/09 4 ; GWh 18,320 MW 68,869 GWh New Build-Coal Safety Wholesale power prices Baseload reliability Mining operations Fuel costs O&M costs Operational excellence/continuous improvement Stable competitive market Value Drivers 1.33 0.99 Lignite Delivered PRB 2.75 1.30 Lignite Delivered PRB Lignite/coal vs. PRB fuel cost 05-07 Average; $/MMBtu 13E; $/MMBtu 5 2 1 3 2 |
 10 Safety Industry leading performance at plants and mines Operations Ramp up performance of Sandow 5 and Oak Grove 1 and mid-year substantial completion of Oak Grove 2 Top decile/quartile availability at Comanche Peak and existing coal plants Further embed “Luminant Operating System” and drive improvement through Balance of Plant initiative Drive continuous improvement at mines Development Continue to advance Comanche Peak 3 & 4 options Explore opportunities for new technologies, including wind, solar, next generation coal and new demand sources such as plug-in hybrid electric vehicles (PHEV) Risk Management Continue effective and efficient hedging program that is intended to secure cash flows Luminant Areas Of Focus – 2010 |
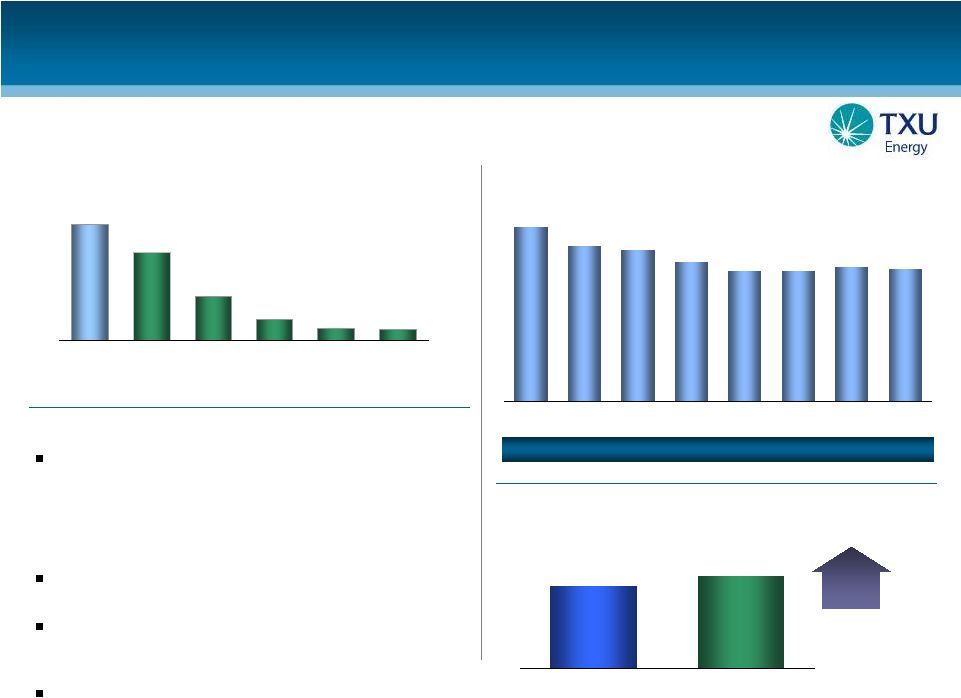 11 TXU Energy is the leading electricity retailer in the ERCOT market. Value Drivers Strong customer value proposition • High brand recognition in Texas competitive areas • Competitive retail prices • Innovative products and services • Committed to low income customer assistance Back Office • Latest Customer Care Platform (SAP) Balance Sheet • Combined TCEH risk management and liquidity efficient capital structure Margins (5–10% net) 1.9 1.5 0.7 0.4 0.2 0.2 TXU Energy Reliant Direct Energy Stream Energy Ambit First Choice Source: Latest available company filings, TXU Energy estimates. Business Profile Residential customers/meters At 6/30/09; millions Sources: NERC, ERCOT 1.6 1.8 US Average ERCOT 13% Projected annual demand growth US avg. and ERCOT; CAGR (2007A-2017E) TXU Energy total residential customers 2002-9/30/09; end of period, thousands 1,876 1,914 1,850 1,982 2,145 2,207 2,477 1,856 2002 2003 2004 2005 2006 2007 2008 09/30/09 TXU Energy has maintained market share since 2006. TXU Energy Overview |
 12 Profitable Growth Maintain margins Expand profitable residential market share and add profitable business markets customers Customer Care System Complete Call Center transition Utilize system to enhance customer experience and brand Risk Management Accurate forecasting of customer needs Active management and monitoring of procurement position to align with changing market conditions TXU Energy Areas Of Focus – 2010 |
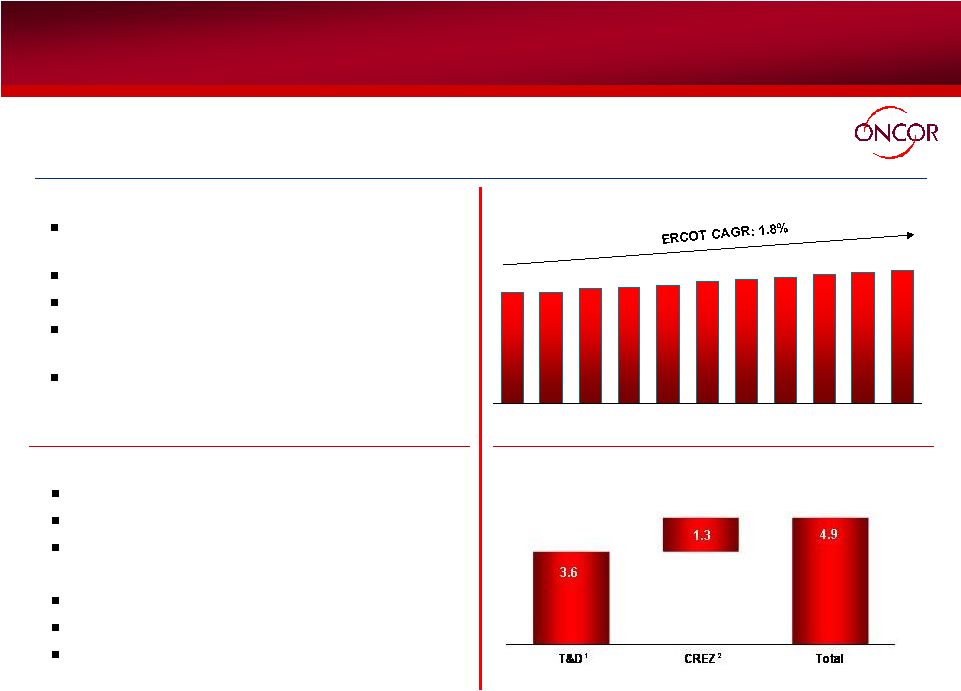 13 Supportive regulatory environment 10.25% authorized ROE Expedited capital expenditure recovery (transmission and AMS) Low operating costs per customer Strong demand growth vs. US average Top quartile reliability (SAIDI) and safety Oncor Overview Value Drivers Business Profile Oncor focuses on maintaining safe operations, achieving a high level of reliability,
minimizing service interruptions and investing in its transmission and
distribution infrastructure to serve a growing customer base. 6 th largest US transmission & distribution company Low costs and high reliability No commodity position Accelerated recovery of investments in advanced meters and transmission $1.3 billion CREZ investment Sources: ERCOT, CDR Report, December 2008 Capital expenditure estimates 08–12E; $ billions Projected peak demand growth 1 Minimum capital spending of $3.6 billion over a five-year period, including
AMS 2 Based on ERCOT cost estimates 4.9 1.3 3.6 62 64 65 66 68 69 70 72 73 74 62 2007A 2008A 2009E 2010E 2011E 2012E 2013E 2014E 2015E 2016E 2017E |
 14 Oncor Areas Of Focus – 2010 Safety and reliability AMS Full deployment of advanced meters expected by 2012 (over 400,000 meters installed through October 2009) Capital investment of ~$690 million Recovery through monthly surcharge over 11 years, began January 2009
(~$2.20 per month for average residential customer) CREZ Obtain CCN’s for priority lines requiring expedited construction Continue construction of ~$1.3 billion of CREZ project 1 Based on ERCOT cost estimates 1 |
 Appendix – Additional Slides and Regulation G Reconciliations |
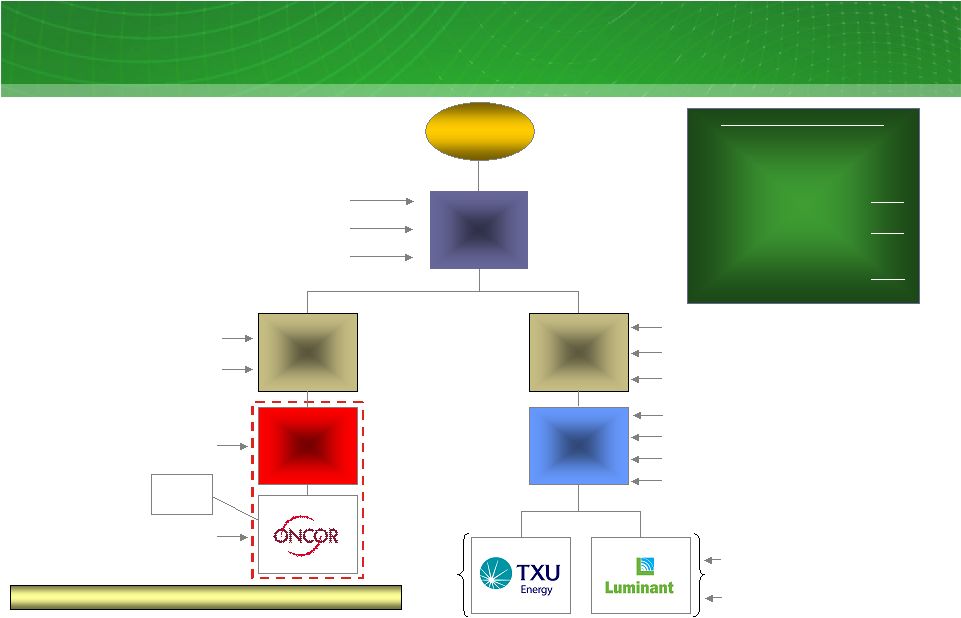 16 EFH Corp. Debt Structure Investor Group EFH $1.9 billion existing debt Guarantor of $4.6 billion EFH Notes $5.7 billion of debt 4 Energy Future Intermediate Holding Company Energy Future Competitive Holdings Company TCEH Oncor Electric Delivery Holdings Ring-fenced entities Guarantor of $6.8 billion TCEH Notes and $4.6 billion EFH Notes Guarantor of TCEH Sr. Secured Facilities and Commodity Collateral Posting Facility (CCP) $0.1 billion of existing debt Guarantor of $6.8 billion Cash Pay and PIK Toggle TCEH Notes Guarantor of TCEH Sr. Secured Facilities and CCP $6.8 billion Cash Pay/PIK Toggle TCEH Notes $22.4 billion Sr. Secured Facilities ³ ~20% Minority Investor $4.6 billion Cash Pay/PIK Toggle EFH Notes $1.6 billion of other debt $0.0 billion of CCP Debt Outstanding ($ billions) As of 9/30/09 Pro-forma ² EFH $ 6.7 EFIH 0.1 EFCH 0.1 TCEH 30.8 Non-regulated 37.7 Oncor 5.7 Total debt 43.4 Cash and cash equivalents 5,6 (2.2) Restricted cash 6 (1.2) Net debt $40.0 EFH Corp. debt structure ¹ As of 9/30/09 Pro-forma ² ; $ billions As of September 30, 2009, the EFH Corp. leverage ratio was 6.95 $0.12 billion New Senior Secured Notes $0.14 billion New Senior Secured Notes 1 Summary diagram includes unamortized discounts and premiums and excludes subsidiaries of EFH that are not
subsidiaries of Energy Future Intermediate Holding Company or Energy Future Competitive Holdings
Company, including TXU Receivables Company, which buys receivables from TXU Energy and sells undivided interests in such receivables under the TXU receivables program. The existing debt amount for EFH includes a financing lease of an indirect subsidiary of EFH not included in
the diagram above. 2 September 30, 2009 balances adjusted to include the effects of the EFH Corp. and EFIH debt exchange/issuance
that closed on November 16, 2009 and the November 1, 2009 PIK election accrual. 3 Includes Deposit Letter of Credit Facility of $1,250 million that is shown as debt on TCEH’s balance
sheet offset by $1,135 million of restricted cash (net of $115 million related to a letter of credit drawn in June 2009). 4 Includes securitization bonds issued by Oncor Electric Delivery Transmission Bond Company LLC and Oncor’s Revolving Credit Facility that had a balance of $537 million. 5 Includes $417 million (including accrued interest) of investments posted with counterparty.
6 Cash and cash equivalents and restricted cash as of September 30, 2009 |
 17 EFH Current Maturity Profile 19,353 1,952 1,028 1,500 4,857 4,633 989 2010 2011 2012 2013 2014 2015 2016 2017 2018 2019 2020+ 309 664 251 305 20,384 4,880 1,974 4,672 11 TCEH-Secured EFH Corp. EFCH TCEH-Revolver TCEH-Unsecured 2,542 EFH Corp. debt maturities 1 (excluding Oncor), 2010-2020 and thereafter 268 $2.70 billion Revolving Credit Facility expires in 2013 $1.25 billion LOC Facility expires in 2014 EFIH As of 9/30/09 Pro-forma 2 ; $ millions 3 3 1 Includes amortization of the $4.1 billion Delayed Draw Term Loan and additional debt issued in May and
November 2009 related to the PIK election of the EFH and TCEH PIK Toggle Notes. 2
September 30, 2009 balances adjusted to include the effects of the EFH Corp. and EFIH debt
exchange/issuance that closed on November 16, 2009 and the November 1, 2009 PIK election accrual. 3 Excludes borrowings under the TCEH Revolving Credit Facility maturing in 2013, the Deposit Letter of Credit
Facility maturing in 2014 and unamortized discounts and premiums. The Credit Amendment approved in Q3 09 increases 2 nd lien debt capacity by $4 billion and Provides unlimited TCEH 1 st lien capacity necessary to extend 2014 TCEH 1 st lien maturities. |
 18 TCEH Amendments / Consents In Q3 2009, TCEH received positive support (60%+ vote) from its secured lenders to amend its Credit Agreement These amendments provide additional debt capacity to de-lever TCEH and provide a vehicle for 2014 TCEH maturity extensions. Credit Agreement Amendments Ability to selectively Extend Revolver / Term Loan B Ability to use unlimited 1st lien Post 2014 bonds and loans to retire Term Loan B at par Trade $1.25 billion 1st lien Accordion for additional $4 billion 2nd lien capacity at TCEH Exclude 2nd lien debt at TCEH from Maintenance Covenant calculation Allow for 1st lien Secured Bond Offering under Accordion |
 19 EFH Corp. and EFIH Exchange Offer In November 2009, EFH Corp. and EFIH completed a SEC- registered debt-for-debt exchange EFH is committed to improving the balance sheet and is evaluating alternatives. Exchange Offer Summary In the exchange, EFH sought to issue up to an aggregate of $3.0 billion of new EFH and EFIH secured 9.75% debt due 2019 for ~$4.5 billion of EFH Legacy and LBO Notes and TCEH LBO Notes Ultimately, ~$350 million of old debt was exchanged for ~$250
million aggregate of new EFH and EFIH debt |
 20 Unlikely source of significant de-levering at current multiples Asset sales De-levering Beyond The Initial Exchange Offer Weighted against competing opportunities Additional private equity Valuation expectations (strategic partners) Reasonable credit profile & maturity schedule (IPO) Public equity EFH and EFIH have in aggregate up to ~$4 billion of additional debt capacity that can be used in future debt issuances or exchanges TCEH has ~$4 billion of additional 2 lien secured debt capacity that can be used in future debt issuances or exchanges Debt issuances/exchanges Commodity market improvement (heat rate, natural gas) Capacity market implementation Further cost or capital reductions Incremental earnings/ cash De-levering Tools EFH has tools available to de-lever and will continue to monitor market conditions to
ensure financial flexibility. Description nd |
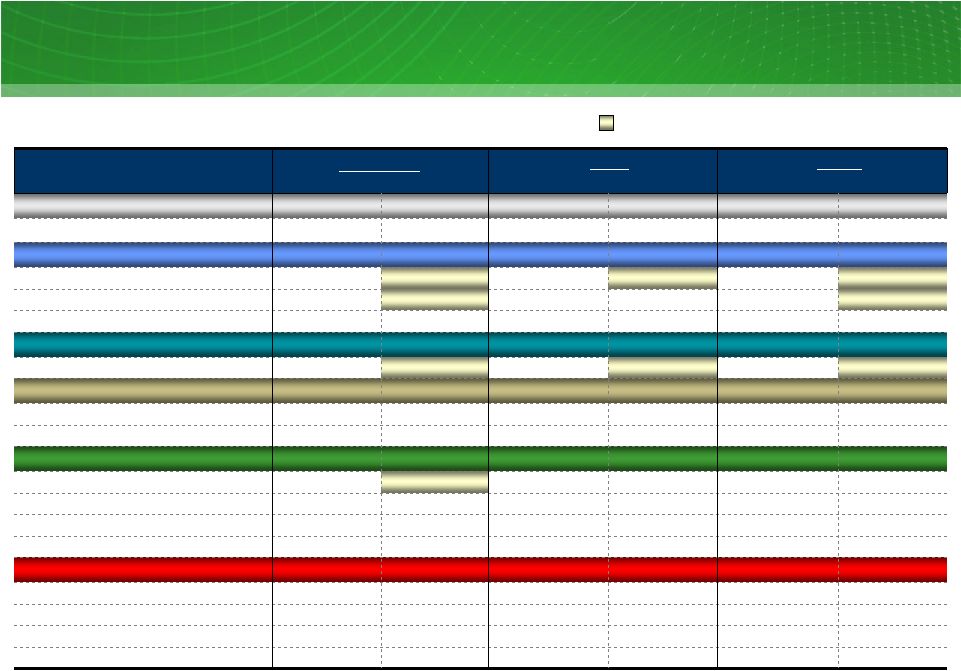 21 B+ (+1) n/a B+ (+2) n/a Caa3 (-2) n/a Sr. Secured Fitch S&P Moody’s EFIH LLC B+ (+1) n/a B+ (+2) n/a Caa3 (-2) n/a Sr. Secured Stable Stable Stable Stable Stable Stable Oncor Outlook Negative Negative Negative Negative Negative Negative EFH Outlook AAA BBB (+6) BBB (+6) BBB- (+5) CCC (-3) CCC (-3) B (0) BB (+3) CCC (-3) CCC (-3) CCC (-3) B+ (+1) B Pre-Exchange AAA BBB+ (+8) BBB+ (+8) BBB+ (+8) CCC (-2) CCC (-2) CCC (-2) B+ (+2) CCC (-2) CCC (-2) CCC (-2) B- (0) B- Current AAA BBB (+6) BBB (+6) BBB- (+5) CCC (-3) CCC (-3) B (0) BB (+3) CCC (-3) CCC (-3) CCC (-3) B (0) B Current Aaa Baa1 (+9) Baa1 (+9) Baa1 (+9) Caa3 (-2) Caa3 (-2) Caa2 (-1) B1 (+3) Caa3 (-2) Caa3 (-2) Caa3 (-2) Caa3 (-2) Caa1 Current BBB+ (+8) Baa1 (+9) Secured Notes BBB+ (+8) Baa1 (+9) Oncor Issuer Rating BBB+ (+8) Baa1 (+9) Secured Credit Facility B- Caa1 EFH Issuer Rating CCC (-2) Caa3 (-2) Unsecured CCC (-2) Caa2 (-1) LBO Cash Pay/PIK Toggle B+ (+2) B2 (+2) Credit Facilities (secured) EFC Holdings Company CCC (-2) Caa3 (-2) Sr. Unsec (Pre – 10/07) B- (0) Caa2 (-1) LBO Cash Pay/PIK Toggle EFH Corp. TCEH Company LLC CCC (-2) Caa3 (-2) Secured AAA Aaa Oncor Transition Bonds CCC (-2) Caa3 (-2) Pre-10/07 debt CCC (-2) Caa3 (-2) PCRBs Pre-Exchange Pre-Exchange Issuer / Security Issuer/Debt Ratings Summary Indicates change in rating pre-exchange vs. post-exchange Issuer/Debt ratings for EFH Corp. and its subsidiaries As of 11/17/09; rating agencies credit ratings Note: Parenthetical amounts represent change in ratings notch from EFH Issuer
Rating. |
 22 EFH Corp. Liquidity Management 4,380 5,814 8,050 EFH Corp. and TCEH have sufficient liquidity to meet their anticipated short-term
needs, but will continue to monitor market conditions to ensure
financial flexibility. EFH Corp. (excluding Oncor) available liquidity
As of 9/30/09; $ millions 5 • Liquidity reflected in the table does not include the unlimited capacity available under the Commodity Collateral Posting Facility for ~ 650 million MMBtu of natural gas hedges 4,100 4,085 2,700 938 1,736 1,250 791 459 482 1,703 Facility Limit LOCs/Cash Borrowings Availability Cash and Equivalents TCEH Letter of Credit Facility ¹ TCEH Revolving Credit Facility ² TCEH Delayed Draw Term Loan Facility ³ Short Term Investments 4 1 Facility to be used for issuing letters of credit for general corporate purposes. Cash borrowings of $1.250
billion were drawn on this facility in October 2007, and, except for $115 million related to a
letter of credit drawn in June 2009, have been retained as restricted cash. Outstanding letters of credit are supported by the restricted cash. 2 Facility availability includes $141 million of undrawn commitments from a subsidiary of Lehman Brothers
that has filed for bankruptcy. These funds are only available from the fronting banks and
the swingline lender, and exclude $26 million of requested draws not funded by the Lehman subsidiary. 3 Facility was used to fund expenditures for constructing certain new generation facilities and environmental
upgrades of existing generation facilities. Reported availability of zero excludes $15
million of commitments from the Lehman subsidiary. 4 Includes $417 million cash and $65 million letter of credit investment, maturing on 3/31/10, in collateral
funding transactions with counterparties to certain interest rate swaps and commodity hedging
transactions. 5 Pursuant to the Public Utility Commission of Texas (PUC) rules, TCEH is required to maintain available
liquidity to assure adequate credit worthiness of TCEH’s retail electric provider
subsidiaries, including the ability to return customer deposits, if necessary. As a result, at 9/30/09, the total availability under the TCEH credit facilities should be further reduced by $237 million. |
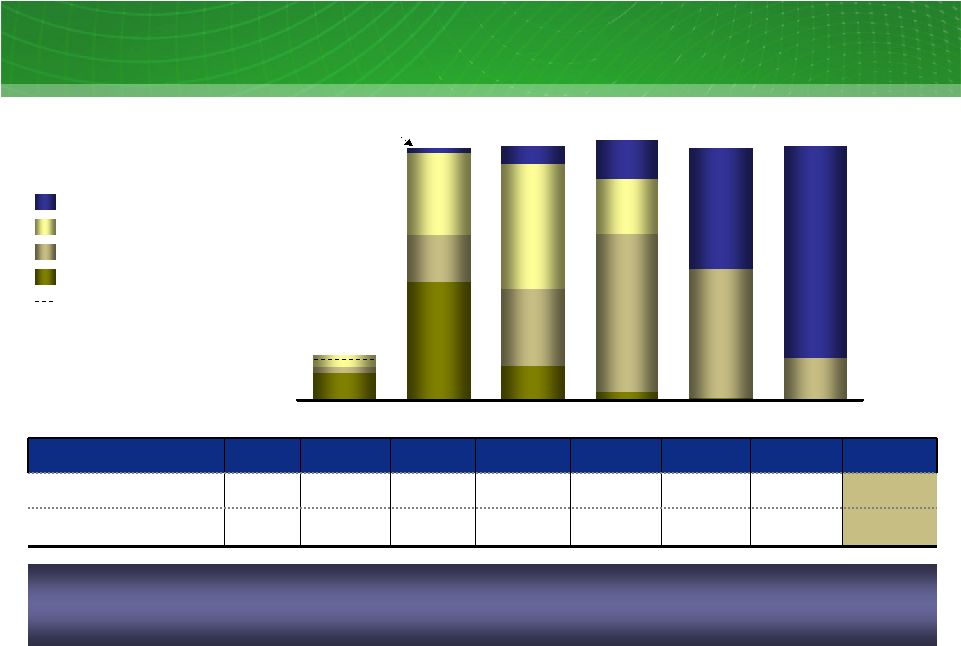 23 23 23 TCEH Natural Gas Exposure TCEH Natural Gas Position 09-14 ¹ ; million MMBtu Hedges Backed by Asset 1 st Lien Open Position 64 272 79 109 176 189 290 125 41 279 490 582 586 4 17 367 300 11 97 28 12 91 600 583 587 95 BAL 09 2010 2011 2012 2013 2014 100% Hedge Level Factor Measure BAL09 2010 2011 2012 2013 2014 Total or Average Natural gas hedging program million MMBtu ~39 ~298 ~466 ~492 ~300 ~97 ~1,692 Overall estimated percent of total NG position hedged percent ~109% ~98% ~93% ~85% ~52% ~16% ~71% TXUE and Luminant Net Positions ³ TCEH has hedged approximately 71% of its estimated Henry Hub-based natural gas price exposure from November 1, 2009 through December 31, 2014 . More than 95% of the natural gas hedges are supported directly by a 1 st lien or by the TCEH Commodity Collateral Posting Facility. Hedges Backed by CCP ² 1 As of 9/30/09. Balance of year 2009 is from November 1, 2009 to December 31, 2009. Assumes
conversion of electricity positions based on a ~8.0 heat rate with natural gas being on the
margin ~75-90% of the time (i.e. when other technologies are forecast to be on the margin, no natural gas position is assumed to be generated). 2 Commodity Collateral Posting Facility is secured by 1st lien. 3 Includes estimated retail/wholesale effects. 2009 position includes ~9 million MMBtu of short gas
positions associated with retail gas puts and proprietary trading positions; excluding these
positions, 2009 position is ~99% hedged. |
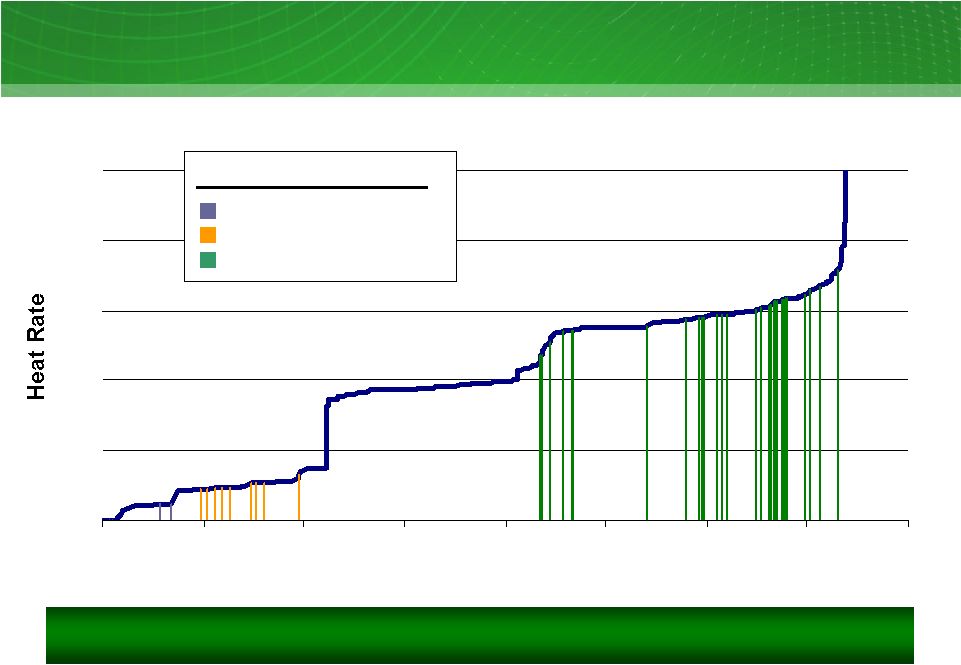 24 1 Summer 2009 ERCOT supply stack - indicative Luminant plants are typically on the “book-ends” of the supply stack. ERCOT’s
marginal price is set by natural gas in most hours of the year. 0 4 8 12 16 20 0 10 20 30 40 50 60 70 80 Cumulative GW Luminant nuclear plant Luminant lignite/coal plants Luminant gas plants Legend ERCOT Supply Stack 1 Excludes 1,953 MW of mothballed gas plant capacity and 2,226 MW of gas-fueled generation from 10 units retired in May 2009. Includes 655 MW of gas plant capacity currently in RMR status with ERCOT. Sources: ERCOT and Energy Velocity ®, Ventyx 1 |
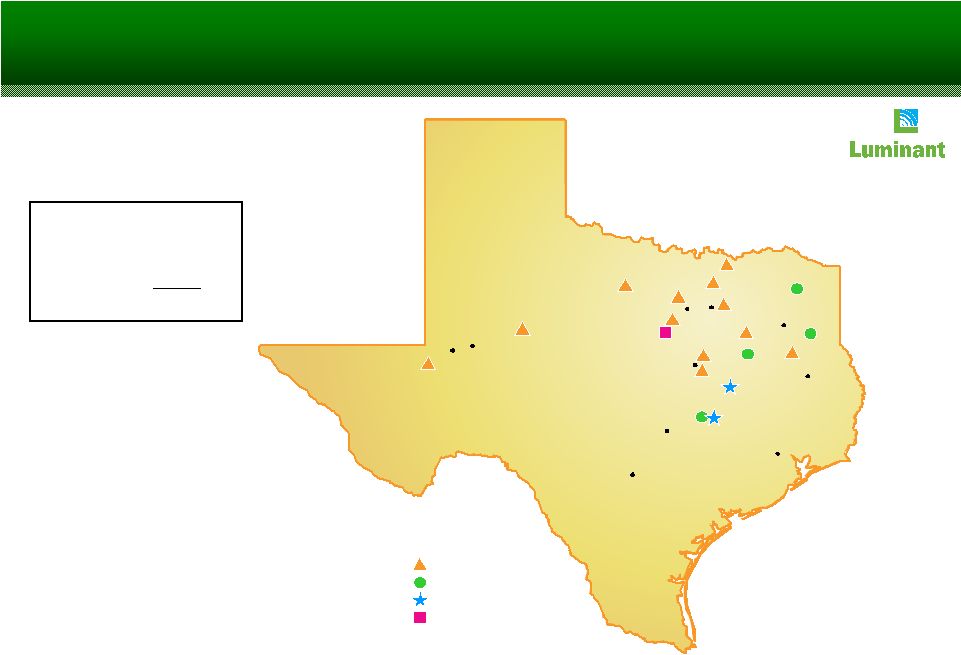 25 Luminant Generation Facilities Generation capacity in ERCOT At 9/30/09; MW Nuclear 2,300 MW Lignite/coal 5,837 Lignite – new 2,181 Natural gas 8,002 Total 18,320 MW 1 Represents 2,181 MW of new lignite-fueled generation under construction that is
expected to come online in 2009 and 2010. 2 Reflects the retirement of 10 units (2,226 MW) of natural gas-fueled generation in
May 2009. HOUSTON SAN ANTONIO AUSTIN WACO MIDLAND LUFKIN ODESSA DALLAS TYLER FORT WORTH Power Plants Natural gas Lignite/coal Lignite, new build Nuclear 1 2 |
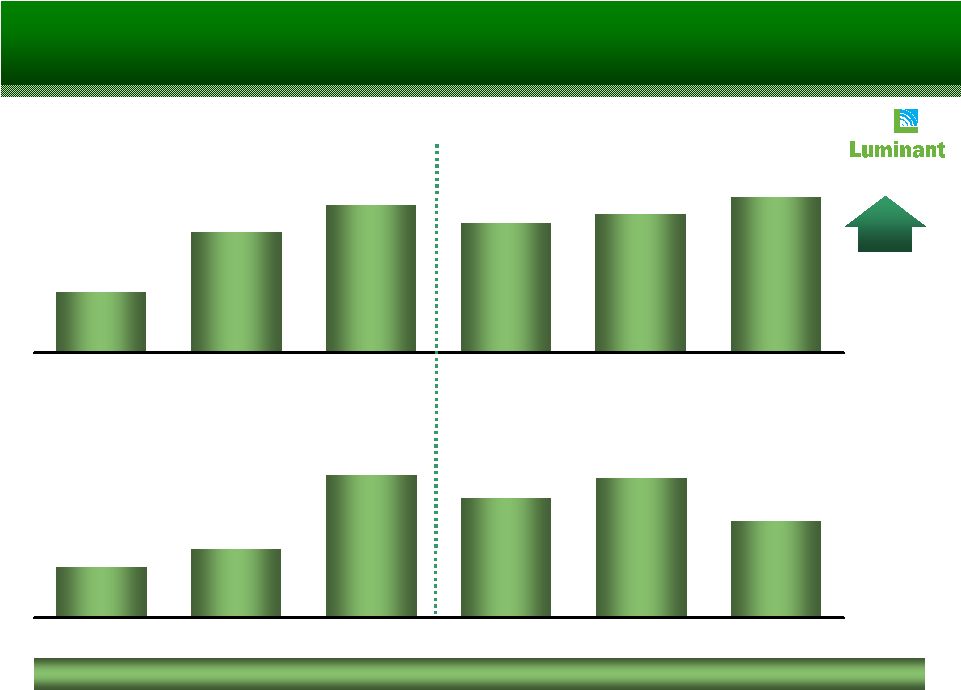 26 82 89 92 90 91 93 02–03 04–05 06–07 08 09E 10E–11E Luminant Operational Achievement 234 318 660 556 650 450 02–03 04–05 06–07 08 09E 10E–11E Baseload capacity factors 02–11E; percent Baseload capital expenditures 02–11E; $ millions 13% Luminant needs to drive sustained high performance at the optimal investment level.
Merger Close 1 Baseload capital expenditures excluding any capital expenditures for Oak Grove and Sandow 5, new mine development, environmental retrofit program, and other development related capital expenditures 1 |
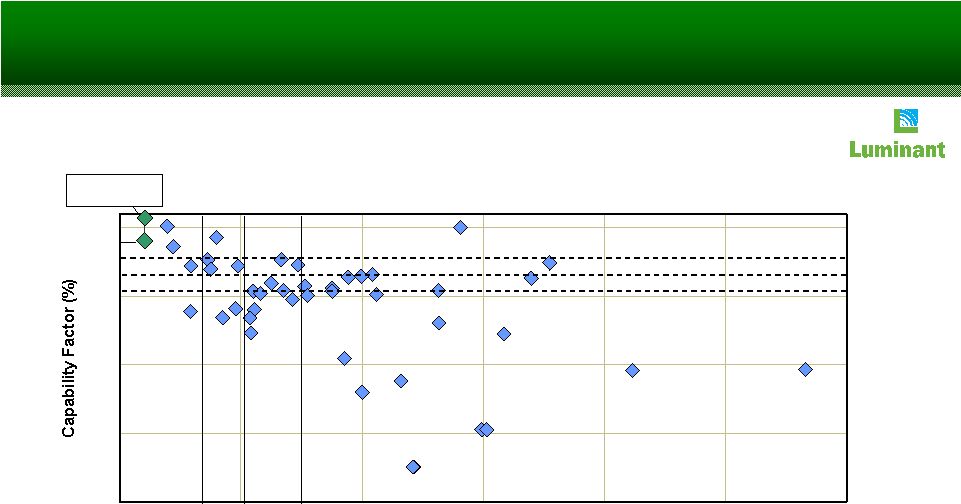 27 75 80 85 90 95 10 15 20 25 30 35 40 $/MWh 1 Benchmarking peer set defined as 18 month fuel cycle U.S. nuclear plants (42 plants / 66
units BWR & PWR). Sources: EUCG May 2009 release for cost and WANO for
Capability Factors. CPNPP adjusted for SGR Outage Decile Quartile Median Decile Quartile Median Nuclear reliability vs. cost ¹ 06–08; percent and $/MWh CPNPP High-Performance Nuclear Operator |
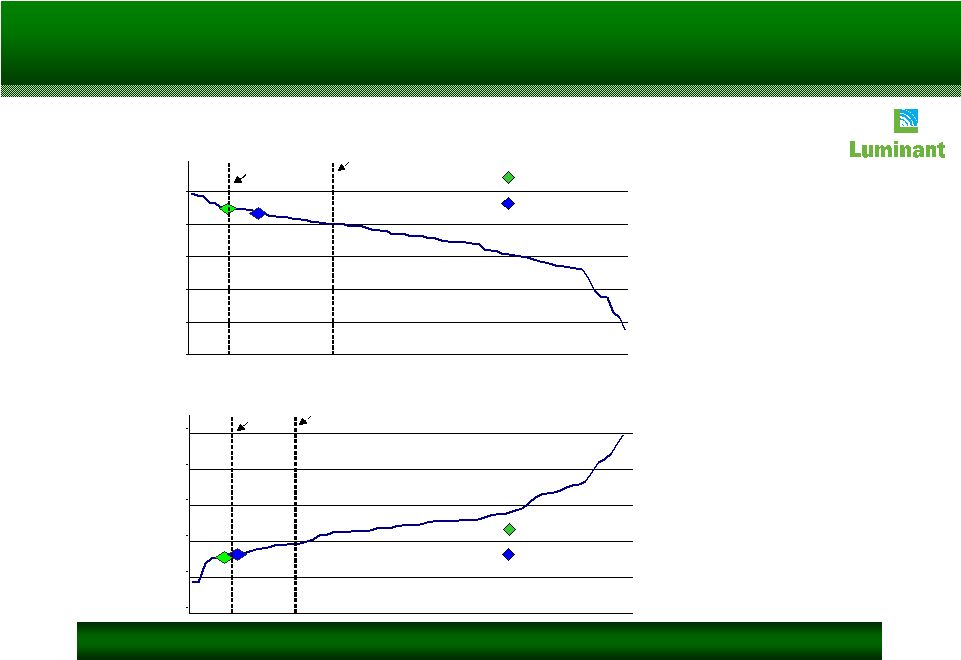 28 High-Performance Coal Operator Luminant vs. US lignite fleet net capacity factors ¹ Percent Top decile 84.7% Top quartile 79.8% Luminant vs. US lignite fleet O&M $/MWh Top decile 3.3 Top quartile 4.0 Luminant has industry leading performance relative to other coal-fueled generators. Luminant 06–08 fleet avg. = 84.7 % Luminant 08 fleet = 83.2% Source: GKS Luminant 06–08 fleet avg. = 3.11 Luminant 08 fleet = 3.29 1 Benchmarking net capacity factors based on GADS. 40 50 60 70 80 90 $0.00 $2.00 $4.00 $6.00 $8.00 $10.00 |
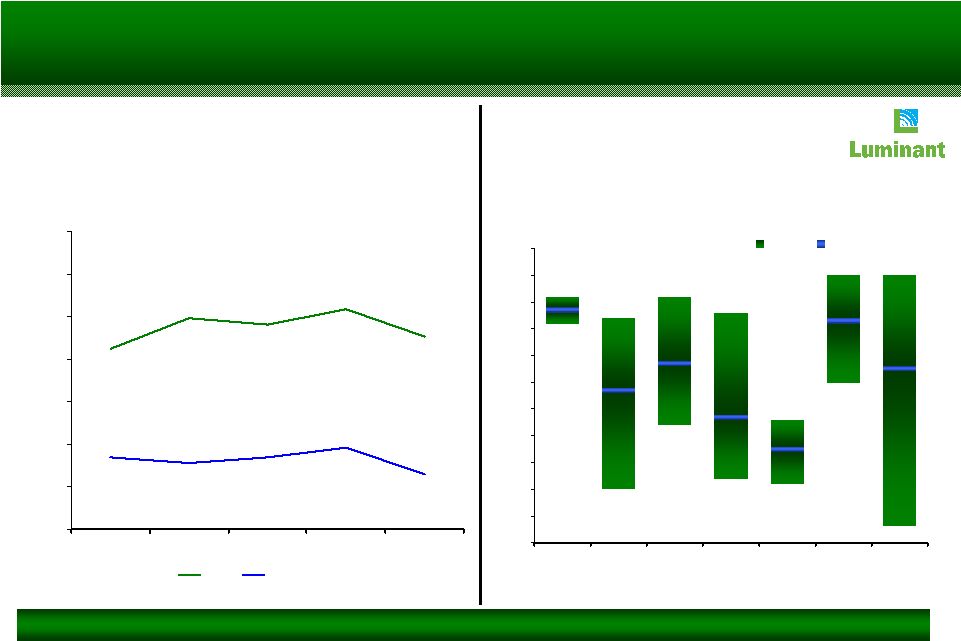 29 High-Performance Coal Operator 65% 70% 75% 80% 85% 90% 95% 100% 2004 2005 2006 2007 2008 EFH Industry Consistent high performance Average coal fleet capacity factor ¹ 04-08; percent Range of coal unit 2-year capacity factors ² 04-08; percent 45% 50% 55% 60% 65% 70% 75% 80% 85% 90% 95% 100% EFH (9) AYE (10) DYN (4) EIX (8) MIR (2) NRG (9) RRI (6) Operator (# of Units) Range 5 Yr Average 1 Based on unscrubbed merchant units greater than 450 MW. Industry total excludes EFH plants. 2 Includes merchant units greater than 450 MW. Source: Velocity Suite (Energy Velocity) |
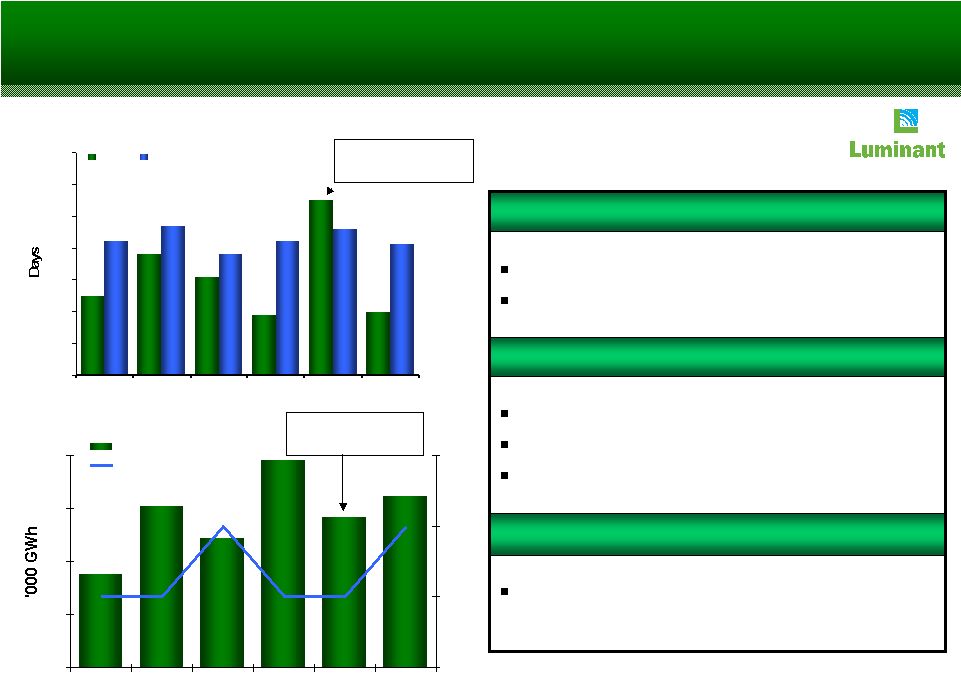 30 0 10 20 30 40 50 60 70 2003 2004 2005 2006 2007 2008 EFH Industry Impact Of Refueling Outages Avg. nuclear fleet refueling outage duration ¹ - 18 month cycle units 03-08; days Nuclear fleet output 03-08; thousand GWh Based on the refueling cycle, 1 refueling outage will occur in 2010 2010 Refueling Outage Impact 2008 reflects 2 refueling outages 2008 outages were 19 days and 21 days 2009 outage was 25 days 2008-2009 Refueling Outage Impact 18 months Duration: ~18-22 days Nuclear Refueling Cycle 1 2005 and 2008 were dual refueling outage years; this graph shows the average outage duration for each of those years. World record steam generator outage World record steam generator outage 16 17 18 19 20 2003 2004 2005 2006 2007 2008 0 1 2 3 EFH # of Refueling Outages |
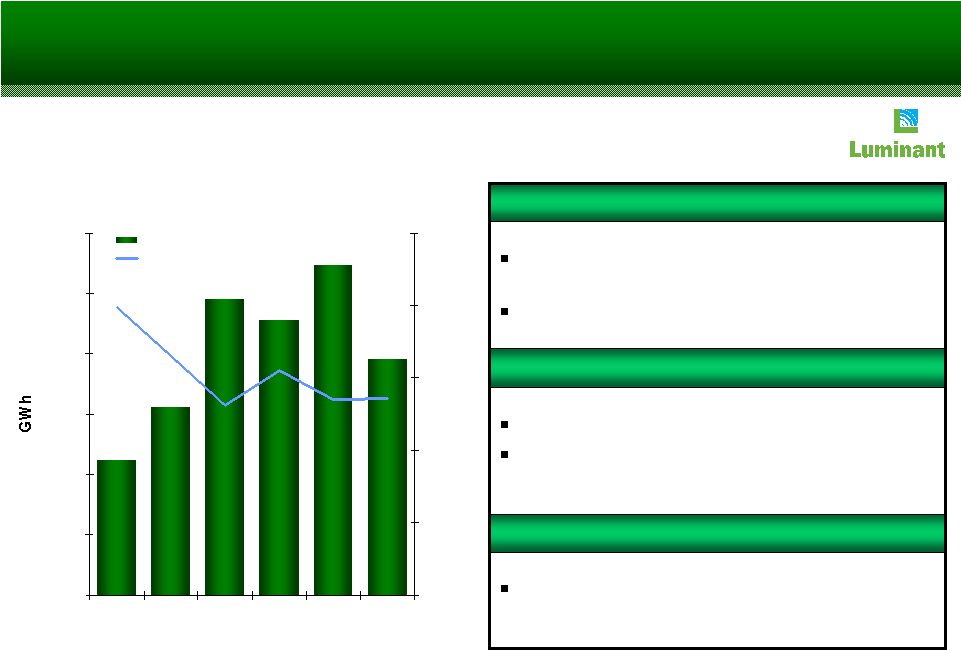 31 41,000 42,000 43,000 44,000 45,000 46,000 47,000 2003 2004 2005 2006 2007 2008 0 50 100 150 200 250 Net Gen # of PO Days Coal Fleet Output Coal fleet output 03-08; GWh YTD overhaul cycle and outage scope drive duration is 121 days 2009 Planned Outage Impact 2008 reflects 136 planned outages days 2008 average major outage duration was 48 days 2008 Planned Outage Impact 3 or 4 year overhaul cycle depending on unit Duration is scope dependent Coal Fleet Planned Outage Cycle |
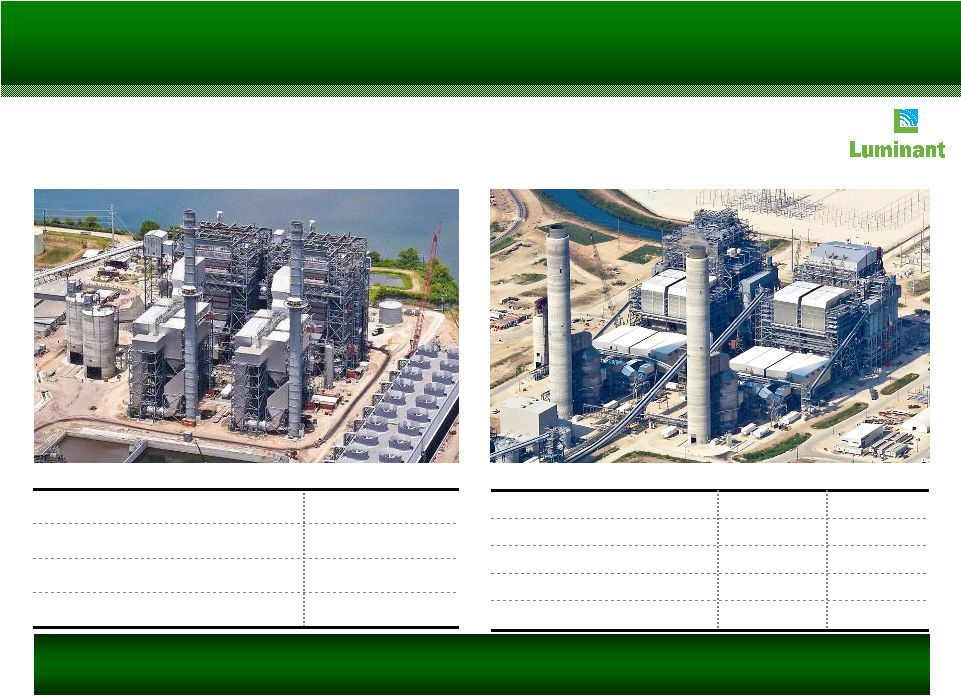 32 32 Luminant Solid-Fuel Development Program Sandow Power Plant Unit 5 Rockdale, Texas Oak Grove Power Plant Robertson County, Texas Texas lignite Texas lignite Primary fuel ~86% ~99% Percent complete at 9/30/09 N/A August 09 Initial synchronization Late 2009 800 MW Unit 1 Unit 2 Estimated net capacity 800 MW Substantial completion date ¹ Mid 2010 Estimated net capacity 581 MW Primary fuel Texas lignite Initial synchronization July 2009 Substantial completion date ¹ September 30, 2009 Luminant’s construction of three new lignite-fueled generating units continues to
track on budget, with Sandow 5 achieving substantial completion on Sept 30 . 1 Substantial completion date is the contractual milestone when Luminant takes over
operations of the unit from the EPC contractor. th
|
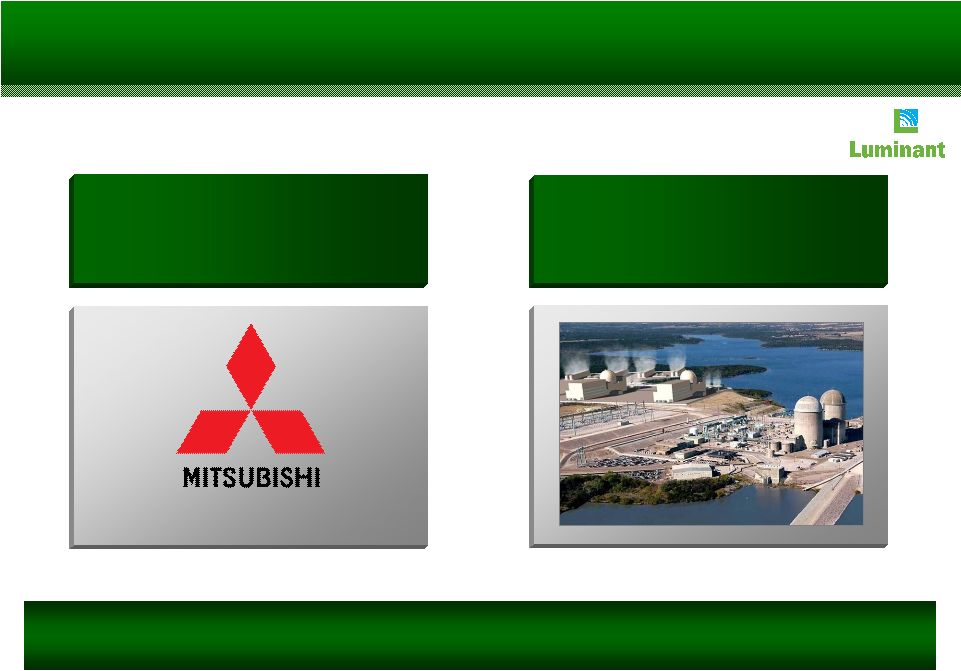 33 Nuclear Expansion HEAVY INDUSTRIES, LTD. …partnering with …partnering with a world-class a world-class equipment provider… equipment provider… Luminant is pursuing the construction of a next-generation nuclear facility by
… … … and leveraging existing and leveraging existing site, water rights and site, water rights and leadership team. leadership team. Project includes two nuclear generation units each having approximately 1,700 MW
(gross) capacity, and is currently ranked 5th (first alternate) for DOE
grants. |
 34 0 10,000 20,000 30,000 40,000 50,000 60,000 70,000 0 4 8 12 16 20 0 500 1,000 1,500 2,000 2,500 3,000 3,500 ERCOT Average Daily Profile Of Load And Wind Source: ERCOT ERCOT average daily profile of load and wind output August 09; mixed measures Wind operating characteristics necessitate additional resources for reliability.
Average Load Average Wind Output Hour Load (aMW) Wind Output (MW) |
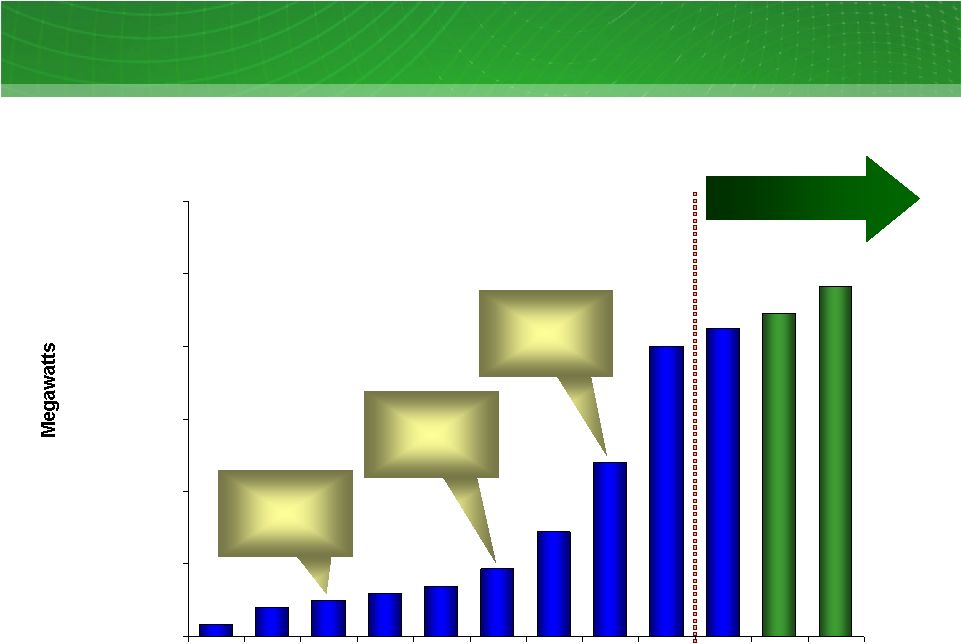 35 Texas Wind Additions 0 2,000 4,000 6,000 8,000 10,000 12,000 Pre 01 01 02 03 04 05 06 07 08 093 09E 10E RPS ¹ Target of 2,880 MW by 2009 RPS ¹ Target of 5,880 MW by 2015 CREZs Designated ERCOT SGIA ² Cumulative wind capacity additions in Texas Pre-01-10E; MW 1 Renewable Portfolio Standard 2 Signed Generation Interconnect Agreement; Includes 60MW of January 2009 installed wind
capacity 3 As of September 30, 2009 Source: ERCOT – September 2009 System Planning Report to the Reliability and Operations Subcommittee |
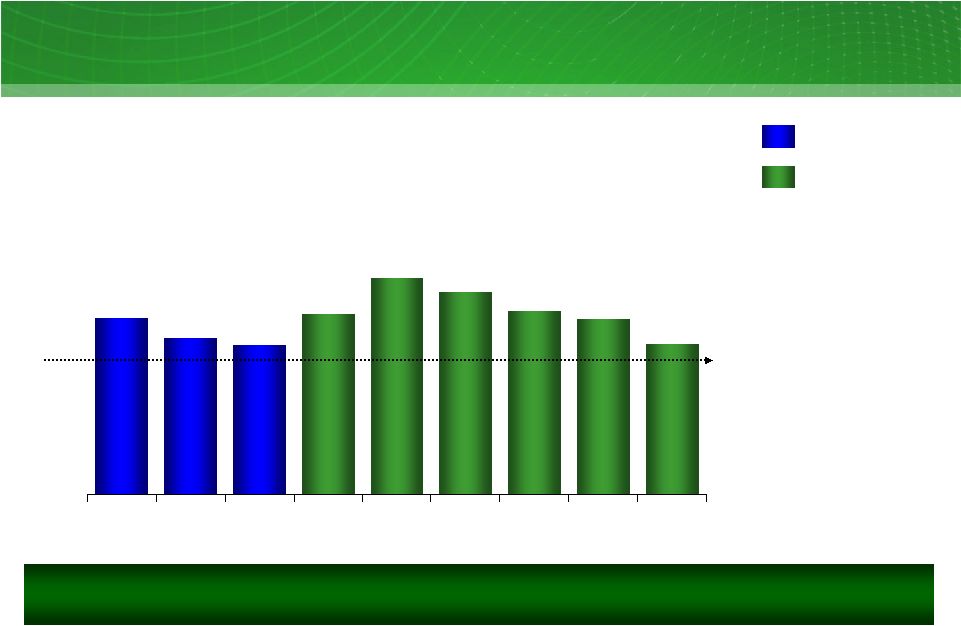 36 ERCOT Reserve Margins ERCOT reserve margin 06-14; percent 16 15 14 17 20 19 17 16 14 0 5 10 15 20 25 06 07 08 09 10 11 12 13 14 May 2009 1 Source: ERCOT (reserve margin projection prior to summer peak and based on the reserve
margin formula in effect at the time) 2 Source: ERCOT CDR as of May 2009 The ERCOT market currently appears to be reasonably positioned to support Texas’ needs through 2013. Year Targeted minimum reserve margin is 12.5% Actuals 2 1 |
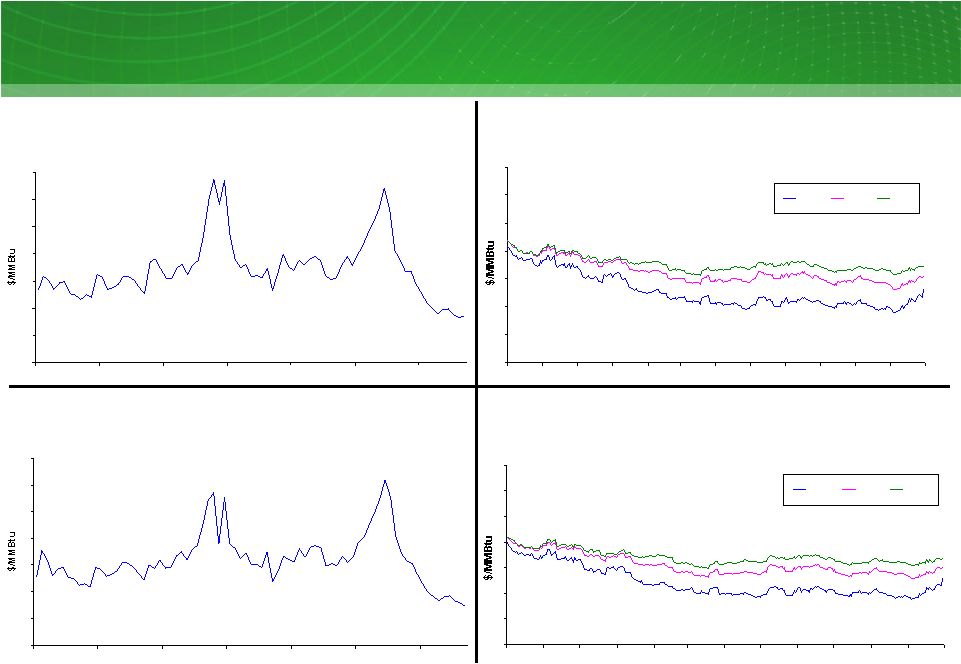 37 0 2 4 6 8 10 12 14 2003 2004 2005 2006 2007 2008 2009 0 2 4 6 8 10 12 14 2003 2004 2005 2006 2007 2008 2009 Houston Ship Channel settled natural gas prices ¹ Jan 03-Sep 09; $/MMBtu Market Price Snapshot NYMEX forward natural gas prices ² Bal 09-11; $/MMBtu NYMEX settled natural gas prices ¹ Jan 03-Sep 09; $/MMBtu Houston Ship Channel forward natural gas prices ² Bal 09-11; $/MMBtu 0 2 4 6 8 10 12 14 Oct-08 Nov-08 Dec-08 Jan-09 Feb-09 Mar-09 Apr-09 May-09 Jun-09 Jul-09 Aug-09 Sep-09 Bal09 2010 2011 0 2 4 6 8 10 12 14 Oct-08 Nov-08 Dec-08 Jan-09 Feb-09 Mar-09 Apr-09 May-09 Jun-09 Jul-09 Aug-09 Sep-09 Bal09 2010 2011 1 Settled prices are monthly averages. 2 Forward prices reflect market observable quotes during the 12 months ended September 30, 2009 for the following delivery periods: Balance of 09, Calendar 2010 and Calendar 2011. Balance of 09 prices reflect an increase in market observable prices in September
capturing projected winter demand for gas. |
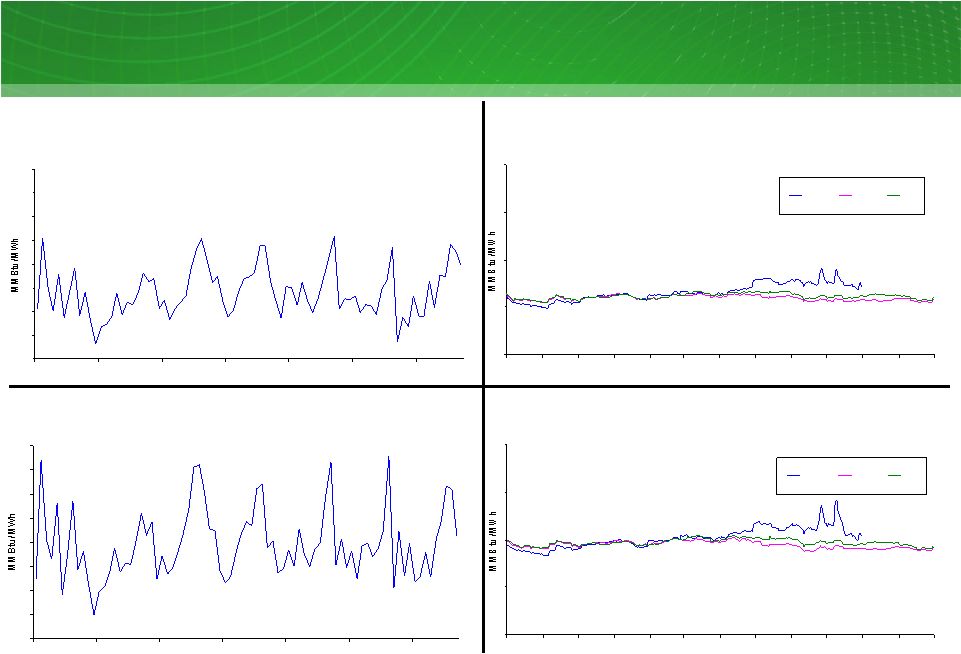 38 5 7 9 11 13 Oct-08 Nov-08 Dec-08 Jan-09 Feb-09 Mar-09 Apr-09 May-09 Jun-09 Jul-09 Aug-09 Sep-09 Bal09 2010 2011 5 7 9 11 13 Oct-08 Nov-08 Dec-08 Jan-09 Feb-09 Mar-09 Apr-09 May-09 Jun-09 Jul-09 Aug-09 Sep-09 Bal09 2010 2011 5 6 7 8 9 10 11 12 13 2003 2004 2005 2006 2007 2008 2009 Market Price Snapshot 5 6 7 8 9 10 11 12 13 2003 2004 2005 2006 2007 2008 2009 ERCOT North Zone 7x24 settled heat rate Jan 03-Sep 09; MMBtu/MWh ERCOT North Zone 7x24 forward heat rate Bal 09-11; MMBtu/MWh ERCOT North Zone 5x16 forward heat rate Bal 09-11; MMBtu/MWh ERCOT North Zone 5x16 settled heat rate Jan 03-Sep 09; MMBtu/MWh 1 Market heat rate calculated by dividing 7x24 and 5x16 power prices, as appropriate, by
Houston Ship Channel natural gas prices. 2 Settled prices are monthly averages. 3 Forward prices reflect market observable quotes during the 12 months ended September 30, 2009 for the following delivery periods: Balance of 09, Calendar 2010 and Calendar 2011. Balance of 09 market observable quotes reflect data up to July 31, 2009 only due to
decreasing sample size for remaining months. 1,2 1,3 1,3 1,2 |
 39 New TXU Energy Marketing Campaign |
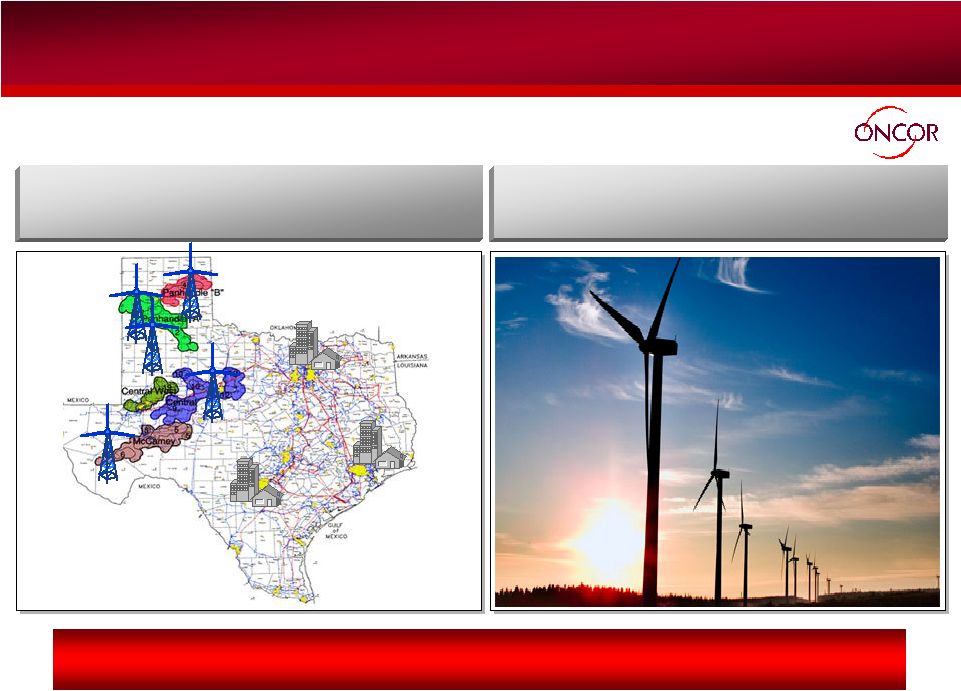 40 New Oncor Infrastructure …to support the continued buildout of wind capacity in Texas Oncor’s investment in CREZ will receive accelerated recovery, consistent with other transmission investment, mitigating regulatory delay. Oncor expects to invest ~$1.3 billion ¹ over the next 4 years on new transmission lines… 1 PUC awarded approximately $1.3 billion (based on ERCOT estimates) of the CREZ buildout to Oncor.
|
 41 Oncor Demand-Side Management Oncor is leading the largest smart-meter deployment in the US with an initiative to have 3.4 million meters connected by 2012 (over 400,000 meters installed through October 2009) Oncor recovers its investment through a PUC-approved surcharge Customer monitoring of consumption “Smart” appliances Dynamic pricing Oncor’s energy efficiency filing has been approved and is reflected in rates. Oncor to deploy ~$690 million of capital for smart meters… …that
will enable key DSM initiatives |
 42 EFH Corp. Stakeholder Commitments Entity Key Commitments We are honoring our commitments to key stakeholders. Create a Sustainable Energy Advisory Board (SEAB) to advise the company on environmental policies Maintain employee compensation, health benefits and retirement programs through end of 2008 Voluntarily filed for PUC review of LBO with regard to Oncor Minimum capital spending of $3.6 billion over a five-year period Demand reduction program including an additional 5-year, $100 million investment in conservation and energy efficiency Deliver 15% residential price cut to legacy PTB customers with guaranteed price protection through 2008 Additional price protection against rising electricity costs through December 2009 for legacy PTB customers Five-year commitment, through 2012, to invest $100 million in innovative energy efficiency and conservation approaches, including new tools for customers to manage their own electricity usage Terminate eight planned coal-fueled units Provide increased investment in alternative energy Double wind energy purchases to 1,500 MW 1 indicates completed or in progress. Status¹ |
 43 Financial Definitions Open EBITDA estimates assume generation is sold at market observed forward prices less
production costs and retail volumes are sold at market observed retail rates
and historical retail profitability percentage. Estimates exclude
all impacts of natural gas and power hedging activities, specifically the impacts of the TCEH Long-Term Hedging Program and any heat rate hedges. Additionally, this calculation includes
provisions for fuel expense and O&M based on expected power generation
output along with purchased power for sales to retail customers, and SG&A
based on the generation output and sales to retail customers. Open EBITDA
(non-GAAP) Net income (loss) from continuing operations before interest expense and related charges,
and income tax expense (benefit) plus depreciation and amortization.
EBITDA (non-GAAP) Generally accepted accounting principles. GAAP The purchase method of accounting for a business combination as prescribed by GAAP,
whereby the purchase price of a business combination is allocated to
identifiable assets and liabilities (including intangible assets) based upon
their fair values. The excess of the purchase price over the fair values of assets and liabilities is recorded as goodwill. Depreciation and amortization due to purchase accounting represents the net
increase in such noncash expenses due to recording the fair market values of
property, plant and equipment, debt and other assets and liabilities,
including intangible assets such as emission allowances, customer relationships and sales and purchase contracts with pricing favorable to market prices at the date of the Merger. Amortization is reflected in revenues, fuel, purchased power costs and delivery fees, depreciation and amortization, other
income and interest expense in the income statement. Purchase Accounting Total debt, including securitization and Commodity Collateral Posting Facility, less cash
on hand and restricted cash. Net Debt (non-GAAP) EBITDA adjusted to exclude interest income, noncash items, unusual items, interest
income, income from discontinued operations and other adjustments allowable
under the EFH Corp. Senior Notes bond indenture. Adjusted EBITDA plays
an important role in respect of certain covenants contained in the EFH Corp. Senior Notes. Adjusted EBITDA is not intended to be an alternative to GAAP results as a measure of
operating performance or an alternative to cash flows from operating activities as a measure of liquidity or an alternative to any other measure of financial performance presented in accordance with GAAP, nor is it intended to be used
as a measure of free cash flow available for EFH Corp.’s discretionary
use, as the measure excludes certain cash requirements such as interest
payments, tax payments and other debt service requirements. Because not all companies use identical calculations, Adjusted EBITDA may not be comparable to similarly titled measures of other companies. Adjusted EBITDA (non-GAAP) Definition Measure |
 44 Table 1: EFH Corp. Adjusted EBITDA Reconciliation Twelve months ended 12/31/08 and nine months ended 9/30/08 and 9/30/09 $ millions 22 - 221 - - 512 - 325 55 (22) 213 (1,053) 2,277 1,217 2,505 (462) (983) YTD 08 9 29 Losses on sale of receivables (7) - Amortization of ”day one” net loss on Sandow 5 power purchase agreement 90 8,000 Impairment of goodwill ³ 3 - EBITDA amount attributable to consolidated unrestricted subsidiaries 54 (160) Net income attributable to noncontrolling interests 5 1,221 Impairment of assets and inventory write-down 4 259 460 Purchase accounting adjustments ² (30) (27) Interest income 71 76 Amortization of nuclear fuel (713) (2,329) Unrealized net (gain) loss resulting from hedging transactions Adjustments to EBITDA (pre-tax): (1,043) (496) Oncor EBITDA 117 1,582 Oncor distributions/dividends ¹ 2,136 4,935 Interest expense and related charges 3,883 1,286 254 207 YTD 09 (9,838) Net income (loss) attributable to EFH Corp. (471) Income tax expense (benefit) 1,610 Depreciation and amortization (3,764) EBITDA 2008 Factor Note: Table and footnotes to this table continue on following page
|
 45 Table 1: EFH Corp. Adjusted EBITDA Reconciliation (continued from previous page)
Twelve months ended 12/31/08 and nine months ended 9/30/08 and 9/30/09 $ millions - - (21) Insurance settlement proceeds 9 3,819 926 2,893 100 (10) 65 22 9 9 YTD 09 3,596 807 2,789 100 32 44 38 1 24 YTD 08 3 Severance expense 6 27 Non-cash compensation expense 5 4,845 Adjusted EBITDA per Incurrence Covenant 4,578 Adjusted EBITDA per Restricted Payments Covenant 100 Expenses incurred to upgrade or expand a generation station 11 (267) Add back Oncor adjustments 64 Transaction and merger expenses 8 45 Transition and business optimization costs 7 35 Restructuring and other 10 2008 Factor 1 2008 includes $1.253 billion distribution of net proceeds from the sale of Oncor minority interests. 2 Includes amortization of the intangible net asset value of retail and wholesale power
sales agreements, environmental credits, coal purchase contracts, nuclear fuel contracts and power purchase agreements and the stepped-up value of nuclear
fuel. Also includes certain credits not recognized in net income due to purchase accounting. 3 Reflects the completion in the first quarter of 2009 of the fair value calculation supporting the goodwill impairment charge that was recorded in the
fourth quarter of 2008. 4 Includes impairment of emissions allowances. 5 Accounted for under accounting standards related to stock compensation and excludes
capitalized amounts. 6 Includes amounts incurred related to outsourcing, restructuring and other amounts deemed
to be in excess of normal recurring amounts. 7 Includes professional fees primarily for retail billing and customer care systems
enhancements. 8 Includes costs related to the Merger, the Sponsor management fee, outsourcing transition
costs, costs related to certain growth initiatives and costs related to the Oncor sale of noncontrolling interests. 9 Includes the amount received from property damage to certain mining equipment.
10 Includes a litigation accrual and a charge related to the bankruptcy of a subsidiary of
Lehman Brothers Holdings Inc. 11 Reflects noncapital outage costs. |
 46 Table 2: TCEH Adjusted EBITDA Reconciliation Twelve months ended 12/31/08 and nine months ended 9/30/08 and 9/30/09 $ millions 1 8 22 - - 221 - 502 - 290 55 (45) 1,347 827 1,756 (425) (811) YTD 08 3 10 29 - - (2,329) - 1,210 8,000 413 76 (60) (4,263) 1,092 3,918 (411) (8,862) 2008 5 Corp. depreciation, interest and income tax expense included in SG&A 9 Losses on sale of receivables (7) Amortization of ”day one” net loss on Sandow 5 power purchase agreement 9 Severance expense 5 1 Non-cash compensation expense 4 70 Impairment of goodwill ² 3 EBITDA amount attributable to consolidated unrestricted subsidiaries 2 Impairment of assets and inventory write-down ³ 224 Purchase accounting adjustments ¹ (40) Interest income 71 Amortization of nuclear fuel (713) Unrealized net (gain) loss resulting from hedging transactions Adjustments to EBITDA (pre-tax): 1,331 Interest expense and related charges 3,016 862 330 493 YTD 09 Net income (loss) Income tax expense (benefit) Depreciation and amortization EBITDA Factor Note: Table and footnotes to this table continue on following page
|
 47 Table 2: TCEH Adjusted EBITDA Reconciliation (continued from previous page)
Twelve months ended 12/31/08 and nine months ended 9/30/08 and 9/30/09 $ millions - - (21) Insurance settlement proceeds 8 2,790 8 218 2,564 100 32 1 30 YTD 08 22 33 Transition and business optimization costs 6 3 10 Transaction and merger expenses 7 21 15 Other adjustments allowed to determine Adjusted EBITDA per Maintenance Covenant 10 2,760 3,242 Adjusted EBITDA per Incurrence Covenant 2,842 3,507 Adjusted EBITDA per Maintenance Covenant 100 100 Expenses incurred to upgrade or expand a generation station 9 61 250 Expenses related to unplanned generation station outages 9 (15) YTD 09 31 Restructuring and other 2008 Factor 1 Includes amortization of the intangible net asset value of retail and wholesale power
sales agreements, environmental credits, coal purchase contracts, nuclear fuel contracts, power purchase agreements and the stepped up value of nuclear fuel. Also includes certain credits not recognized in net income due to purchase accounting. 2 Reflects the completion in the first quarter of 2009 of the fair value calculation supporting the goodwill impairment charge that was recorded in the
fourth quarter of 2008. 3 Includes impairment of emissions allowances. 4 Excludes capitalized amounts. 5 Includes amounts incurred related to outsourcing, restructuring and other amounts deemed
to be in excess of normal recurring amounts. 6 Includes professional fees primarily for retail billing and customer care systems
enhancements. 7 Includes costs related to the Merger, outsourcing transition costs and certain growth
initiatives. 8 Includes the amount received from property damage to certain mining equipment.
9 Reflects noncapital outage costs. 10 Primarily pre-operating expenses related to Oak Grove and Sandow 5 generation facilities. |
 48 Table 3: Oncor Adjusted EBITDA Reconciliation Twelve months ended 12/31/08 and nine months ended 9/30/08 and 9/30/09 $ millions - - 860 Impairment of goodwill ² 1,021 - (33) (34) 1,088 370 229 180 309 YTD 08 1,315 1 (43) (45) 542 492 316 221 (487) 2008 (30) Purchase accounting adjustments ¹ (32) Interest income 1,075 EBITDA 1,044 Adjusted EBITDA 31 Transition and business optimization costs 258 Interest expense and related charges 405 140 272 YTD 09 Net income Income tax expense Depreciation and amortization Factor 1 Purchase accounting adjustments consist of amounts related to the accretion of an adjustment (discount) to
regulatory assets resulting from purchase accounting. 2
Reflects goodwill impairment charge that was recorded in the fourth quarter of
2008. |
 49 Table 4: EFH Corp. Net Debt Reconciliation As of September 30, 2009 Pro-forma ¹ $ millions 39,849 (1,214) (417) (1,725) 43,205 41,442 326 1,437 9/30/09 178 - - - 178 178 - - Pro-forma Adjust. ¹ 40,027 Net debt (1,214) Restricted cash (1,725) Cash and cash equivalents (417) Investments posted with counterparty Less: 41,620 Long-term debt, less amounts due currently 1,437 Short-term borrowings 326 Long-term debt due currently 43,383 Total debt 9/30/09 Pro-forma Description 1 Pro-forma adjustment includes: reductions of $(214.4) million and $(143.1) million,
respectively, of EFH and TCEH legacy and LBO debt and issuances of $115.5
million and $141.1 million, respectively, of new EFH and EFIH 9.75% debt due 2019, as a result of the exchange that closed on November 16, 2009; and the effect of the November 1, 2009 EFH and TCEH PIK election accruals of approximately
$169 million and $110 million, respectively. |
 50 Table 5: TCEH Net Debt Reconciliation As of September 30, 2009 Pro-forma ¹ $ millions 28,912 (1,136) (754) 30,802 29,702 200 900 9/30/09 (33) - - (33) (33) - - Pro-forma Adjust. ¹ 28,879 Net debt (1,136) Restricted cash (754) Cash and cash equivalents Less: 29,669 Long-term debt, less amounts due currently 900 Short-term borrowings 200 Long-term debt due currently 30,769 Total debt 9/30/09 Pro-forma Description 1 Pro-forma adjustment includes a reduction of $(143.1) million of TCEH LBO debt as a
result of the exchange that closed on November 16, 2009 and the effect of the November 1, 2009 TCEH PIK election accrual of approximately $110 million.
|
 51 Table 6: Oncor Net Debt Reconciliation As of September 30, 2009 $ millions 5,573 Net debt (79) Restricted cash (22) Cash and cash equivalents Less: 5,031 Long-term debt, less amounts due currently 537 Short-term borrowings 106 Long-term debt due currently 5,674 Total debt 9/30/09 Description |