Attached files
| file | filename |
|---|---|
| 8-K - FORM 8-K - PHH CORP | y80809e8vk.htm |
Exhibit
99.1

| Friedman, Billings, Ramsey & Co. Fall Investor Conference December 1, 2009 Exhibit 99.1 |
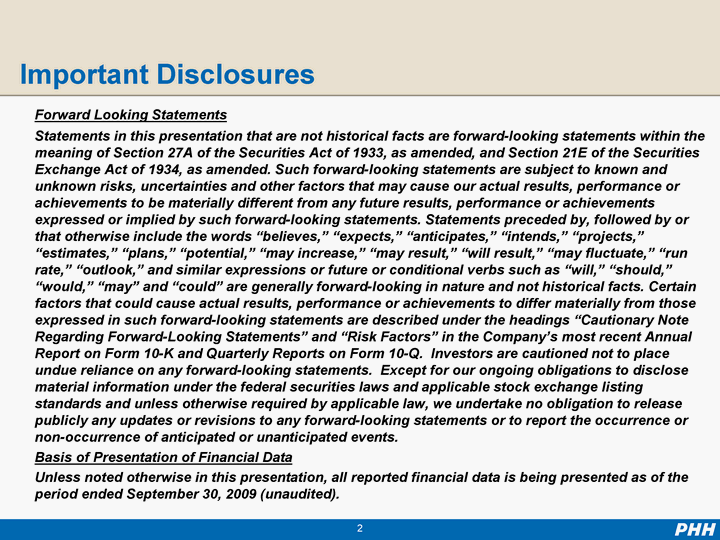
| Important Disclosures Forward Looking Statements Statements in this presentation that are not historical facts are forward-looking statements within the meaning of Section 27A of the Securities Act of 1933, as amended, and Section 21E of the Securities Exchange Act of 1934, as amended. Such forward-looking statements are subject to known and unknown risks, uncertainties and other factors that may cause our actual results, performance or achievements to be materially different from any future results, performance or achievements expressed or implied by such forward-looking statements. Statements preceded by, followed by or that otherwise include the words "believes," "expects," "anticipates," "intends," "projects," "estimates," "plans," "potential," "may increase," "may result," "will result," "may fluctuate," "run rate," "outlook," and similar expressions or future or conditional verbs such as "will," "should," "would," "may" and "could" are generally forward-looking in nature and not historical facts. Certain factors that could cause actual results, performance or achievements to differ materially from those expressed in such forward-looking statements are described under the headings "Cautionary Note Regarding Forward-Looking Statements" and "Risk Factors" in the Company's most recent Annual Report on Form 10-K and Quarterly Reports on Form 10-Q. Investors are cautioned not to place undue reliance on any forward-looking statements. Except for our ongoing obligations to disclose material information under the federal securities laws and applicable stock exchange listing standards and unless otherwise required by applicable law, we undertake no obligation to release publicly any updates or revisions to any forward-looking statements or to report the occurrence or non-occurrence of anticipated or unanticipated events. Basis of Presentation of Financial Data Unless noted otherwise in this presentation, all reported financial data is being presented as of the period ended September 30, 2009 (unaudited). |

| Presenters Jerry Selitto, President and Chief Executive Officer Sandra Bell, Executive Vice President and Chief Financial Officer |
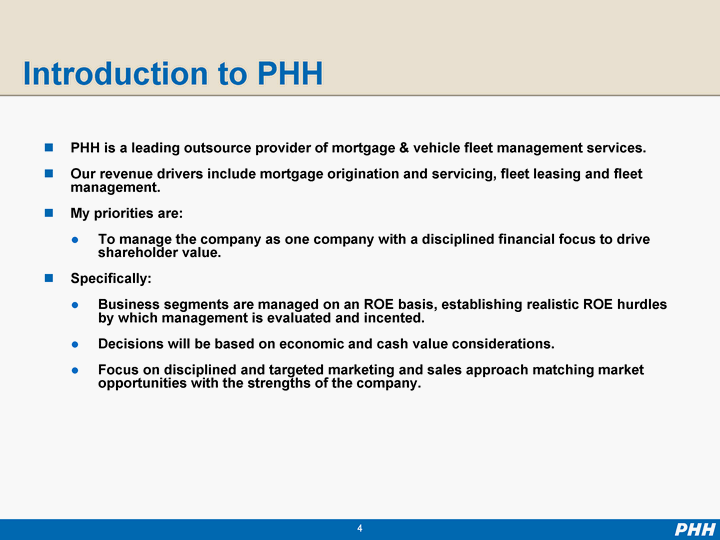
| Introduction to PHH PHH is a leading outsource provider of mortgage & vehicle fleet management services. Our revenue drivers include mortgage origination and servicing, fleet leasing and fleet management. My priorities are: To manage the company as one company with a disciplined financial focus to drive shareholder value. Specifically: Business segments are managed on an ROE basis, establishing realistic ROE hurdles by which management is evaluated and incented. Decisions will be based on economic and cash value considerations. Focus on disciplined and targeted marketing and sales approach matching market opportunities with the strengths of the company. |
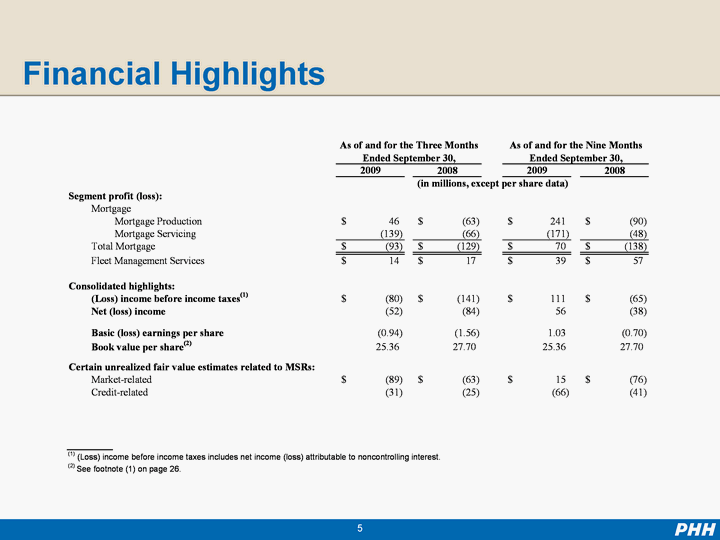
| Financial Highlights |
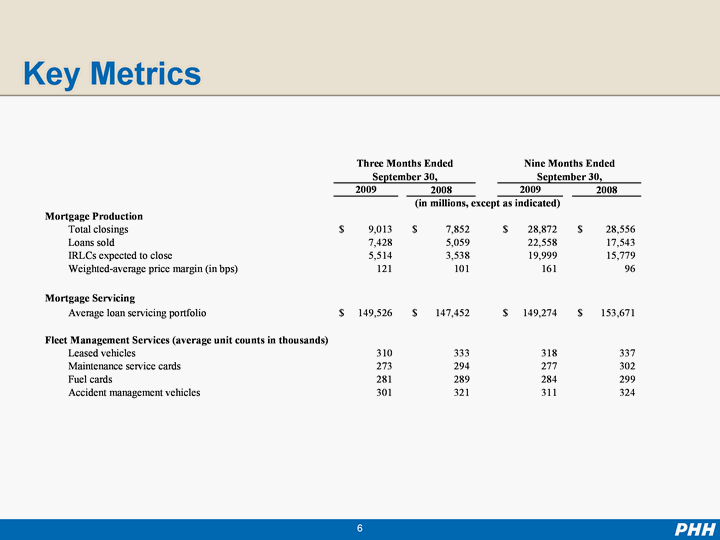
| Key Metrics |

| Mortgage Segments |

| Our Mortgage Business PHH provides private label outsource services to some of the nation's largest financial institutions for mortgage origination and servicing Top five retail mortgage originator * 10th largest servicer of mortgage loans * Our joint venture with parent of Coldwell Banker, Century 21 and other top real estate brands Provides unique access to purchase volumes v. our competitors Leverage to the housing recovery Limited credit risk v. the industry Servicing portfolio delinquencies among the lowest in the industry at only half of the industry average for prime mortgages We do not portfolio loans Credit risk limited to: Loss of servicing income due to involuntary prepayments on loans that enter into foreclosure Rep and warranty risk on loans that we originate and service Increase in reinsurance-related charges for our Atrium subsidiary A substantial portion of our mortgage assets are marked to market under fair value accounting rules * Inside Mortgage Finance, Copyright 2009 |
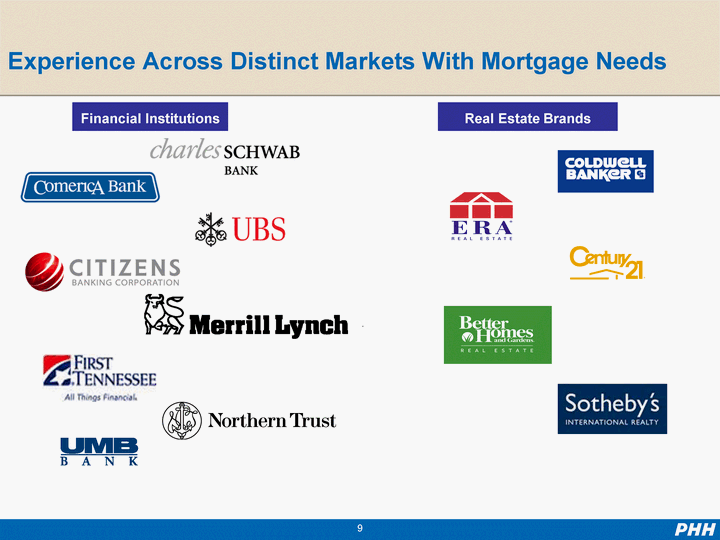
| Financial Institutions Real Estate Brands Experience Across Distinct Markets With Mortgage Needs |
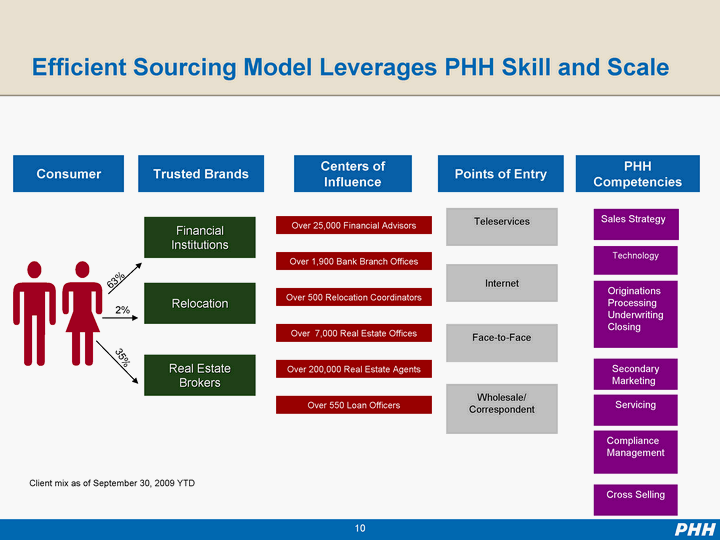
| Consumer Points of Entry PHH Competencies Relocation Real Estate Brokers Financial Institutions Face-to-Face Wholesale/ Correspondent Teleservices Trusted Brands Centers of Influence Internet Sales Strategy Originations Processing Underwriting Closing Secondary Marketing Servicing Cross Selling Technology Compliance Management Efficient Sourcing Model Leverages PHH Skill and Scale Over 25,000 Financial Advisors Over 1,900 Bank Branch Offices Over 500 Relocation Coordinators Over 7,000 Real Estate Offices Over 200,000 Real Estate Agents Over 550 Loan Officers 63% 2% 35% Client mix as of September 30, 2009 YTD |
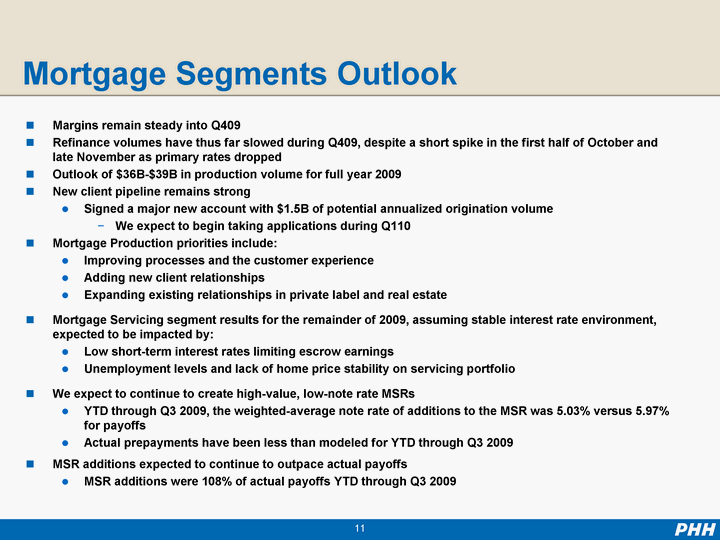
| Mortgage Segments Outlook Margins remain steady into Q409 Refinance volumes have thus far slowed during Q409, despite a short spike in the first half of October and late November as primary rates dropped Outlook of $36B-$39B in production volume for full year 2009 New client pipeline remains strong Signed a major new account with $1.5B of potential annualized origination volume We expect to begin taking applications during Q110 Mortgage Production priorities include: Improving processes and the customer experience Adding new client relationships Expanding existing relationships in private label and real estate Mortgage Servicing segment results for the remainder of 2009, assuming stable interest rate environment, expected to be impacted by: Low short-term interest rates limiting escrow earnings Unemployment levels and lack of home price stability on servicing portfolio We expect to continue to create high-value, low-note rate MSRs YTD through Q3 2009, the weighted-average note rate of additions to the MSR was 5.03% versus 5.97% for payoffs Actual prepayments have been less than modeled for YTD through Q3 2009 MSR additions expected to continue to outpace actual payoffs MSR additions were 108% of actual payoffs YTD through Q3 2009 |
| Fleet Management Services Segment |
| Fleet Management Clients include governments and major corporations in the U.S. and Canada Fleets are: Typically 75 vehicles or more used in business application and geographically dispersed Majority of 600,000 vehicles managed as of 12/31/08 are cars and light trucks Total fleet costs for our clients are often one of their top 5 indirect expenditures PHH manages entire process for our clients, including: Vehicle selection Operating life, including maintenance and accident management Resale and residual value at lease conclusion PHH manages the cost and risk of fleet expense for clients Approximately 95% of PHH's portfolio are open-end whereby clients bear substantially all the residual risk |
| Fleet Management Focused on driving earnings from fee-based revenues: Monthly management fees Fees in connection with the acquisition and disposition of vehicles Fees generated per incident for maintenance and accident management services and for fuel Both from our clients and from our supplier network Service levels, innovation, consulting and technology are keys to competitive advantage PHH is a leading service provider in the industry Limited number of large scale competitors with significant barriers to new entrants |
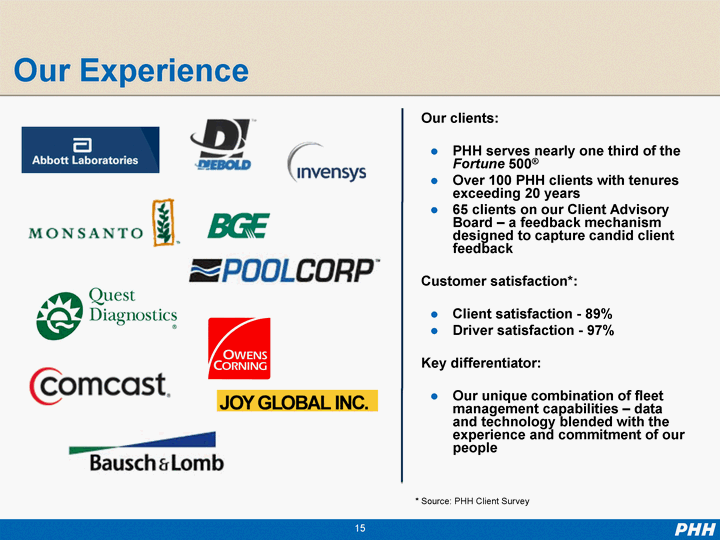
| Our clients: PHH serves nearly one third of the Fortune 500(r) Over 100 PHH clients with tenures exceeding 20 years 65 clients on our Client Advisory Board - a feedback mechanism designed to capture candid client feedback Customer satisfaction*: Client satisfaction - 89% Driver satisfaction - 97% Key differentiator: Our unique combination of fleet management capabilities - data and technology blended with the experience and commitment of our people Our Experience * Source: PHH Client Survey |
| Fleet Management Services Outlook Market Update Clients continue to right-size fleets, reflecting the economy Pent-up vehicle demand expected to positively impact 2010 Industry continues to see lease pricing more reflective of lessor's debt costs Positioned to fund our clients' expected fleet needs |

| Fleet Management Services Outlook Continue cost management initiatives Continue to focus on counterparty credit quality and cash flow Increase level of consulting to key clients Pursue opportunities for additional outsource services Sign new accounts looking to outsource Continue investments in technology Outlook for full year 2009 Fleet segment profit of $42-$45M. |
| Summary |
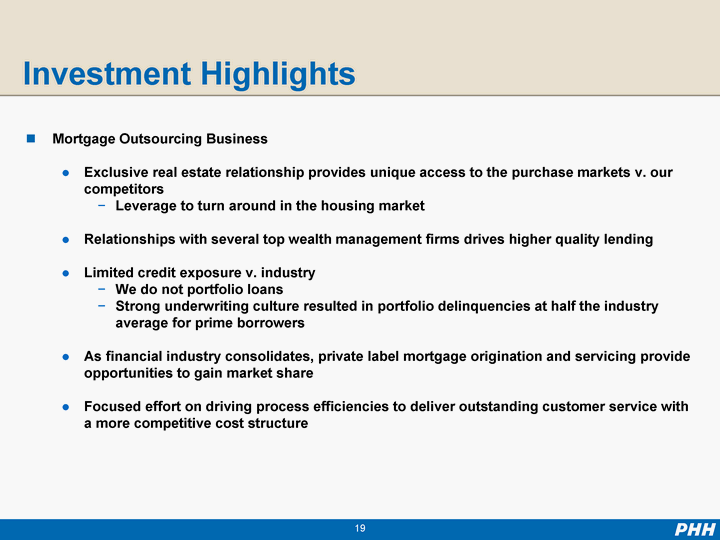
| Mortgage Outsourcing Business Exclusive real estate relationship provides unique access to the purchase markets v. our competitors Leverage to turn around in the housing market Relationships with several top wealth management firms drives higher quality lending Limited credit exposure v. industry We do not portfolio loans Strong underwriting culture resulted in portfolio delinquencies at half the industry average for prime borrowers As financial industry consolidates, private label mortgage origination and servicing provide opportunities to gain market share Focused effort on driving process efficiencies to deliver outstanding customer service with a more competitive cost structure Investment Highlights |
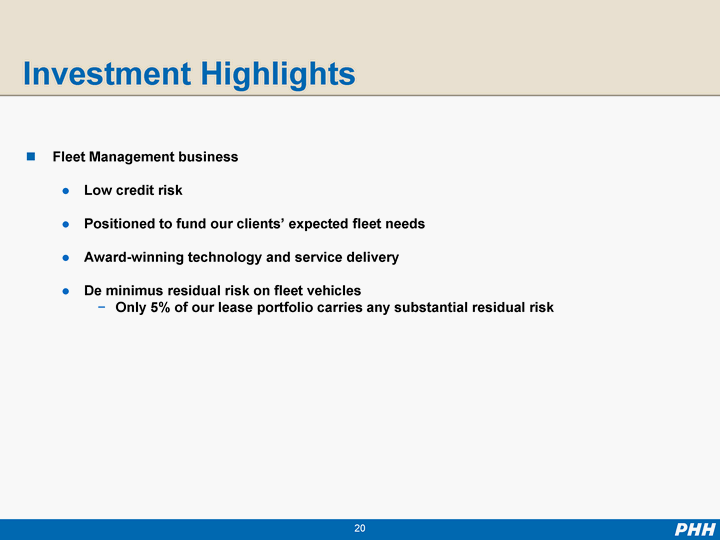
| Investment Highlights Fleet Management business Low credit risk Positioned to fund our clients' expected fleet needs Award-winning technology and service delivery De minimus residual risk on fleet vehicles Only 5% of our lease portfolio carries any substantial residual risk |

| Appendix |
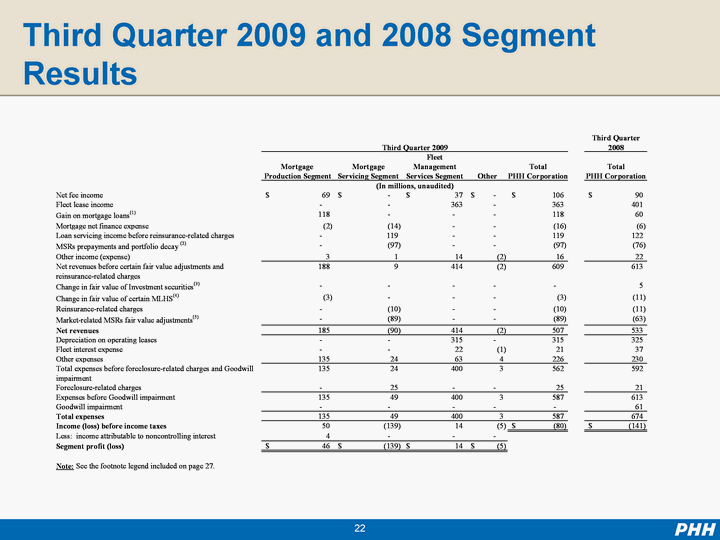
| Third Quarter 2009 and 2008 Segment Results |
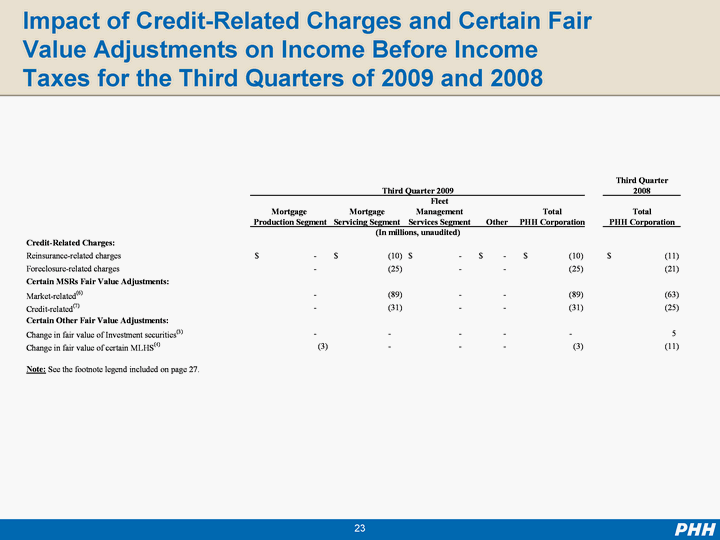
| Impact of Credit-Related Charges and Certain Fair Value Adjustments on Income Before Income Taxes for the Third Quarters of 2009 and 2008 |
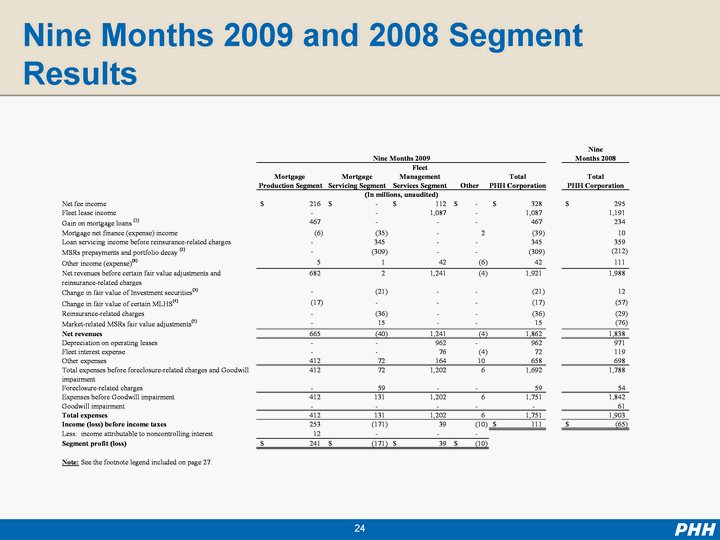
| Nine Months 2009 and 2008 Segment Results |
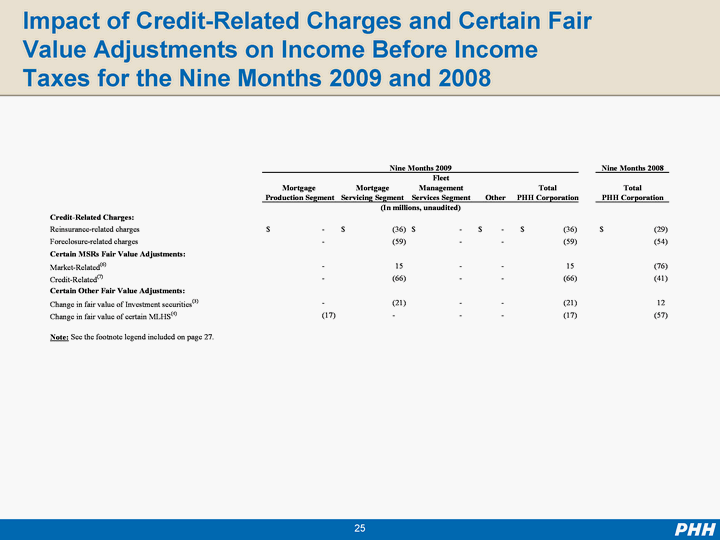
| Impact of Credit-Related Charges and Certain Fair Value Adjustments on Income Before Income Taxes for the Nine Months 2009 and 2008 |
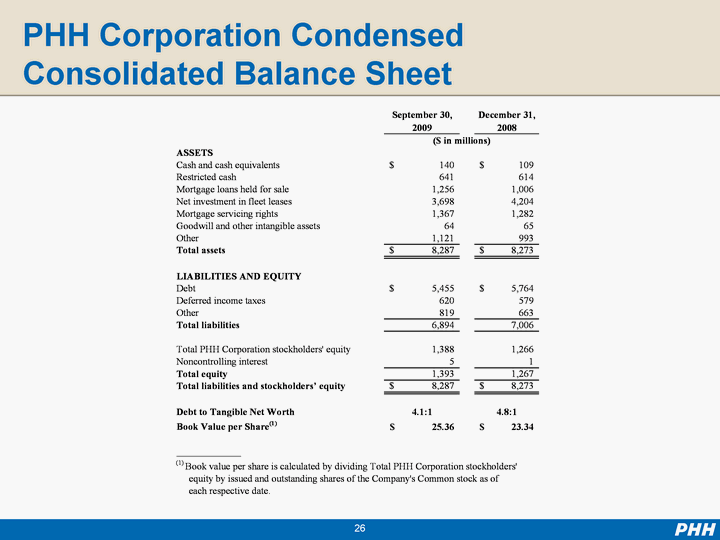
| PHH Corporation Condensed Consolidated Balance Sheet |
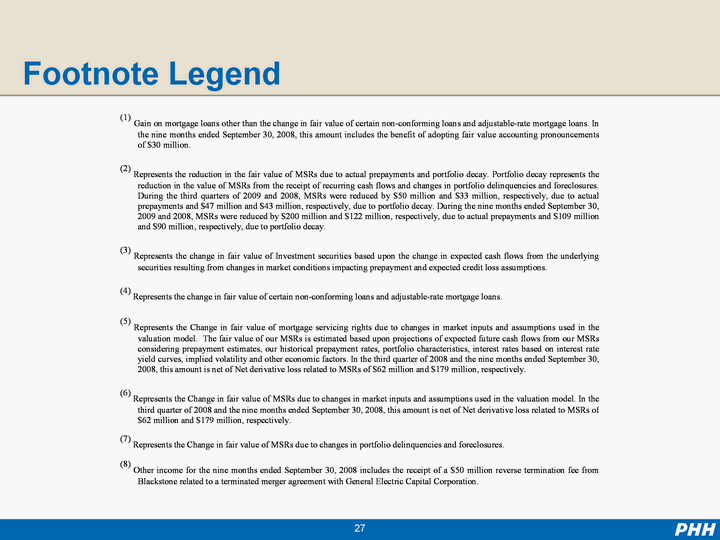
| Footnote Legend |
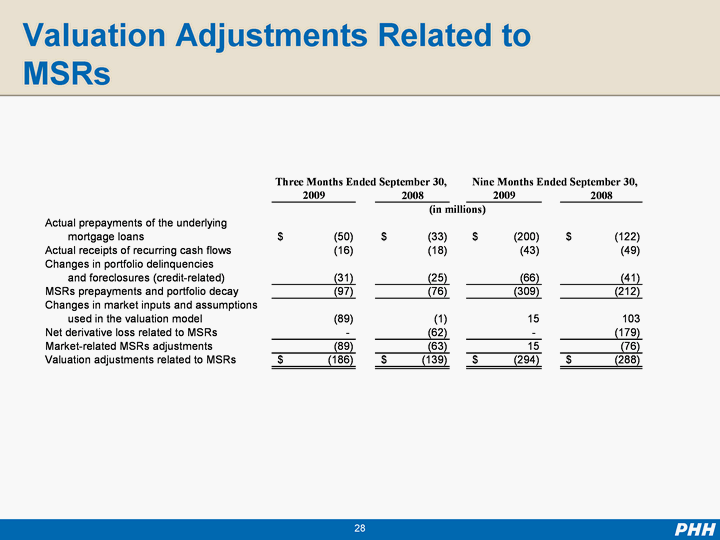
| Valuation Adjustments Related to MSRs |
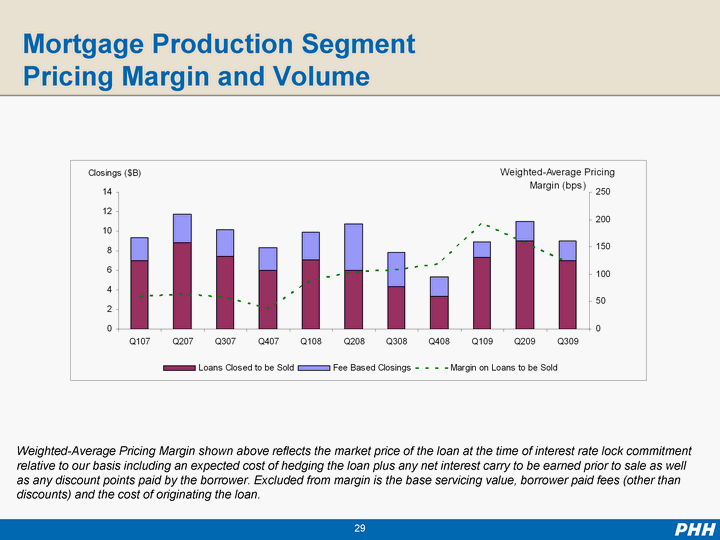
| Mortgage Production Segment Pricing Margin and Volume Weighted-Average Pricing Margin shown above reflects the market price of the loan at the time of interest rate lock commitment relative to our basis including an expected cost of hedging the loan plus any net interest carry to be earned prior to sale as well as any discount points paid by the borrower. Excluded from margin is the base servicing value, borrower paid fees (other than discounts) and the cost of originating the loan. |
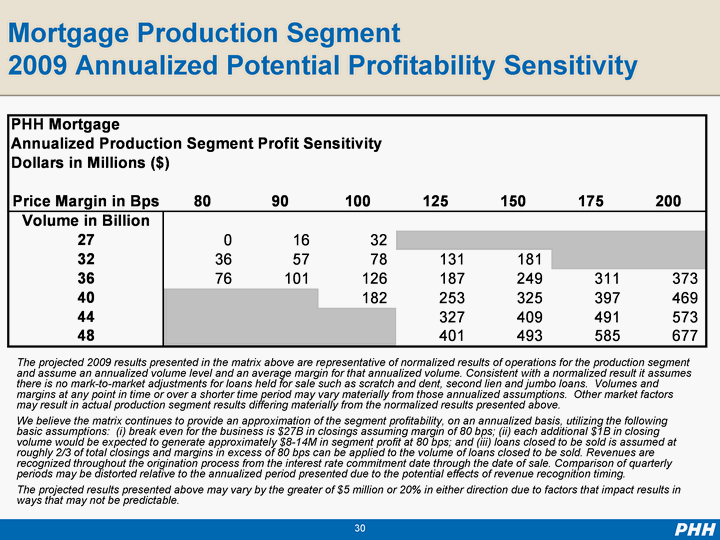
| Mortgage Production Segment 2009 Annualized Potential Profitability Sensitivity The projected 2009 results presented in the matrix above are representative of normalized results of operations for the production segment and assume an annualized volume level and an average margin for that annualized volume. Consistent with a normalized result it assumes there is no mark-to-market adjustments for loans held for sale such as scratch and dent, second lien and jumbo loans. Volumes and margins at any point in time or over a shorter time period may vary materially from those annualized assumptions. Other market factors may result in actual production segment results differing materially from the normalized results presented above. We believe the matrix continues to provide an approximation of the segment profitability, on an annualized basis, utilizing the following basic assumptions: (i) break even for the business is $27B in closings assuming margin of 80 bps; (ii) each additional $1B in closing volume would be expected to generate approximately $8-14M in segment profit at 80 bps; and (iii) loans closed to be sold is assumed at roughly 2/3 of total closings and margins in excess of 80 bps can be applied to the volume of loans closed to be sold. Revenues are recognized throughout the origination process from the interest rate commitment date through the date of sale. Comparison of quarterly periods may be distorted relative to the annualized period presented due to the potential effects of revenue recognition timing. The projected results presented above may vary by the greater of $5 million or 20% in either direction due to factors that impact results in ways that may not be predictable. |
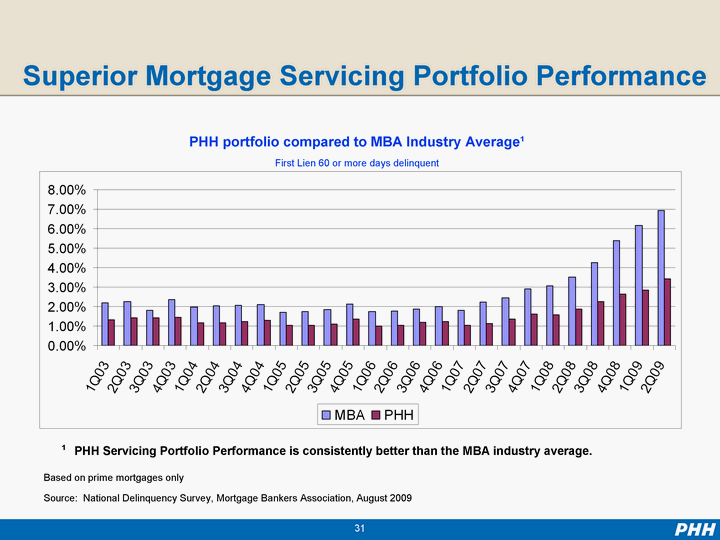
| Superior Mortgage Servicing Portfolio Performance PHH portfolio compared to MBA Industry Average1 First Lien 60 or more days delinquent Based on prime mortgages only Source: National Delinquency Survey, Mortgage Bankers Association, August 2009 1 PHH Servicing Portfolio Performance is consistently better than the MBA industry average. |
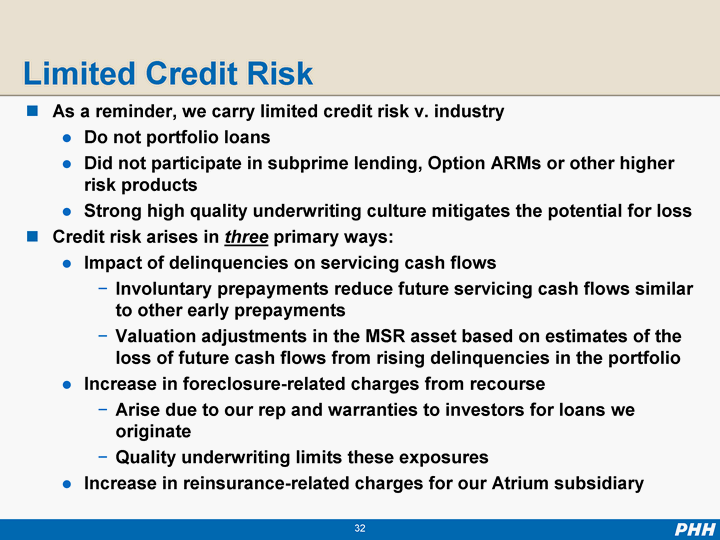
| Limited Credit Risk As a reminder, we carry limited credit risk v. industry Do not portfolio loans Did not participate in subprime lending, Option ARMs or other higher risk products Strong high quality underwriting culture mitigates the potential for loss Credit risk arises in three primary ways: Impact of delinquencies on servicing cash flows Involuntary prepayments reduce future servicing cash flows similar to other early prepayments Valuation adjustments in the MSR asset based on estimates of the loss of future cash flows from rising delinquencies in the portfolio Increase in foreclosure-related charges from recourse Arise due to our rep and warranties to investors for loans we originate Quality underwriting limits these exposures Increase in reinsurance-related charges for our Atrium subsidiary |
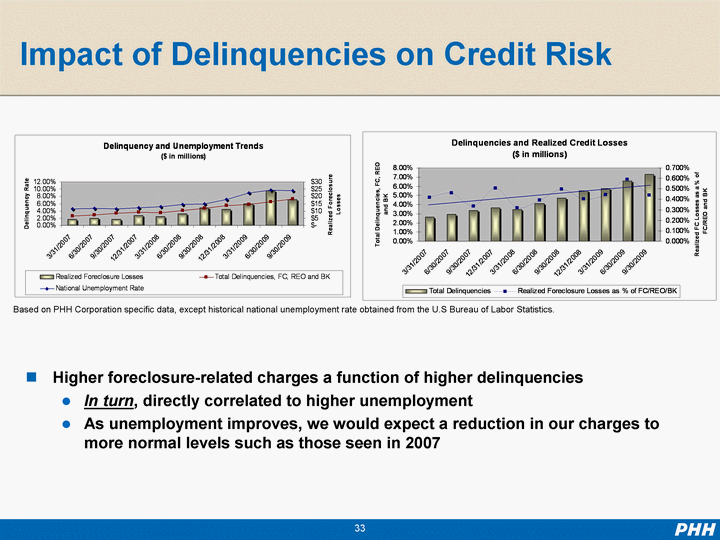
| Impact of Delinquencies on Credit Risk Higher foreclosure-related charges a function of higher delinquencies In turn, directly correlated to higher unemployment As unemployment improves, we would expect a reduction in our charges to more normal levels such as those seen in 2007 Based on PHH Corporation specific data, except historical national unemployment rate obtained from the U.S Bureau of Labor Statistics. |
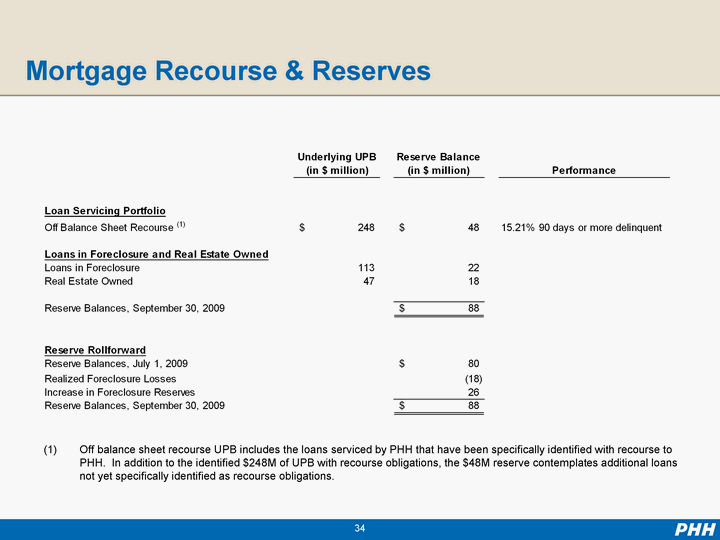
| Mortgage Recourse & Reserves Off balance sheet recourse UPB includes the loans serviced by PHH that have been specifically identified with recourse to PHH. In addition to the identified $248M of UPB with recourse obligations, the $48M reserve contemplates additional loans not yet specifically identified as recourse obligations. |
| As of 9/30/09, Atrium had $278M in restricted cash held in trust to pay claims Atrium paid reinsurance claims of $1M in Q309 Additionally, Atrium made a $4 million payment upon commutation of a reinsurance agreement Reserves established at $113M as of 9/30/09 Projections as of 9/30/09: Future premium income of $105M on loans reinsured Future paid losses of $210M, all from book years 2004 - 2009 Cash and future premiums currently expected to be more than adequate to cover expected losses Loss projections are based on a variety of assumptions, including the characteristics of the current reinsured portfolio, historical loss experiences (loss curves) based on industry data, projected home price declines, projected unemployment rates, projected prepayment levels and other factors. Atrium's only active reinsurance agreement as of 9/30/09 expected to be in runoff after 12/31/09 Atrium Reinsurance |
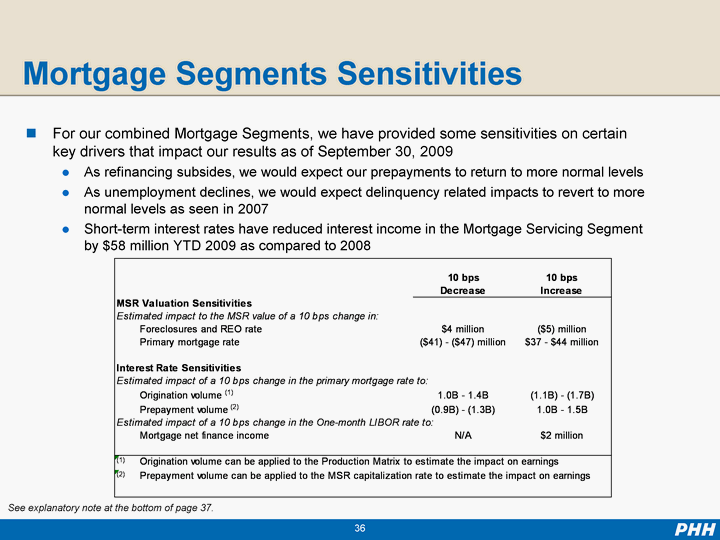
| Mortgage Segments Sensitivities For our combined Mortgage Segments, we have provided some sensitivities on certain key drivers that impact our results as of September 30, 2009 As refinancing subsides, we would expect our prepayments to return to more normal levels As unemployment declines, we would expect delinquency related impacts to revert to more normal levels as seen in 2007 Short-term interest rates have reduced interest income in the Mortgage Servicing Segment by $58 million YTD 2009 as compared to 2008 See explanatory note at the bottom of page 37. |
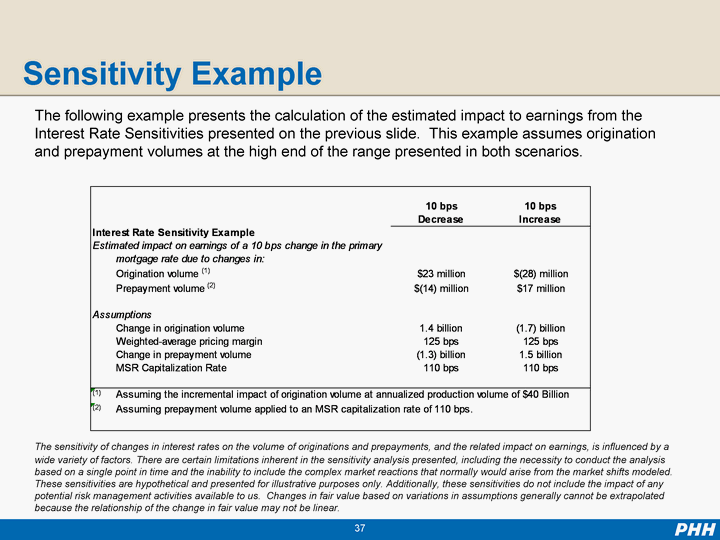
| Sensitivity Example The following example presents the calculation of the estimated impact to earnings from the Interest Rate Sensitivities presented on the previous slide. This example assumes origination and prepayment volumes at the high end of the range presented in both scenarios. The sensitivity of changes in interest rates on the volume of originations and prepayments, and the related impact on earnings, is influenced by a wide variety of factors. There are certain limitations inherent in the sensitivity analysis presented, including the necessity to conduct the analysis based on a single point in time and the inability to include the complex market reactions that normally would arise from the market shifts modeled. These sensitivities are hypothetical and presented for illustrative purposes only. Additionally, these sensitivities do not include the impact of any potential risk management activities available to us. Changes in fair value based on variations in assumptions generally cannot be extrapolated because the relationship of the change in fair value may not be linear. |
