Attached files
| file | filename |
|---|---|
| 8-K - FORM 8-K - International Coal Group, Inc. | frm8-k.htm |

UBS
Boston Coal Conference
December 1, 2009
December 1, 2009
Ben
Hatfield
President
& Chief Executive Officer

Forward-Looking
Statement
n Statements in this
press release that are not historical facts are forward-looking statements
within the “safe harbor” provision of the Private
Securities Litigation Reform Act of 1995 and may involve a number of risks and uncertainties. We have used the words “anticipate,” “believe,”
“could,” “estimate,” “expect,” “intend,” “may,” “plan,” “predict,” “project” and similar terms and phrases, including references to assumptions, to
identify forward-looking statements. These forward-looking statements are made based on expectations and beliefs concerning future events
affecting us and are subject to various risks, uncertainties and factors relating to our operations and business environment, all of which are difficult
to predict and many of which are beyond our control, that could cause our actual results to differ materially from those matters expressed in or
implied by these forward-looking statements. The following factors are among those that may cause actual results to differ materially from our
forward-looking statements: market demand for coal, electricity and steel; availability of qualified workers; future economic or capital market
conditions; weather conditions or catastrophic weather-related damage; our production capabilities; consummation of financing, acquisition or
disposition transactions and the effect thereof on our business; a significant number of conversions of our convertible senior notes prior to maturity;
our plans and objectives for future operations and expansion or consolidation; our relationships with, and other conditions affecting, our customers;
availability and costs of key supplies or commodities, such as diesel fuel, steel, explosives and tires; availability and costs of capital equipment;
prices of fuels which compete with or impact coal usage, such as oil and natural gas; timing of reductions or increases in customer coal
inventories; long-term coal supply arrangements; reductions and/or deferrals of purchases by major customers; risks in or related to coal mining
operations, including risks related to third-party suppliers and carriers operating at our mines or complexes; unexpected maintenance and
equipment failure; environmental, safety and other laws and regulations, including those directly affecting our coal mining and production, and
those affecting our customers’ coal usage; ability to obtain and maintain all necessary governmental permits and authorizations; competition
among coal and other energy producers in the United States and internationally; railroad, barge, trucking and other transportation availability,
performance and costs; employee benefit costs and labor relations issues; replacement of our reserves; our assumptions concerning economically
recoverable coal reserve estimates; availability and costs of credit, surety bonds and letters of credit; title defects or loss of leasehold interests in
our properties which could result in unanticipated costs or inability to mine these properties; future legislation and changes in regulations or
governmental policies or changes in interpretations thereof, including with respect to safety enhancements and environmental initiatives relating to
global warming; impairment of the value of our long-lived and deferred tax assets; our liquidity, including the ability to adhere to financial
covenants related to our borrowing arrangements, results of operations and financial condition; adequacy and sufficiency of our internal controls;
and legal and administrative proceedings, settlements, investigations and claims and the availability of related insurance coverage.
n You should keep in
mind that any forward-looking statement made by us in this presentation or
elsewhere speaks only as of the date on which the
statements
were made. See also the “Risk Factors” in our 2008 Annual Report on Form 10-K
and in subsequent filings on Form 10-Q, all of which
are currently available on our website at www.intlcoal.com. New risks and uncertainties arise from time to time, and it is impossible for us to predict
these events or how they may affect us or our anticipated results. We have no duty to, and do not intend to, update or revise the forward-looking
statements in this presentation , except as may be required by law. In light of these risks and uncertainties, you should keep in mind that any
forward-looking statement made in this presentation might not occur. All data presented herein is as of December 1, 2009 unless otherwise noted.
UBS Boston
Conference, December 1, 2009
2

Highlights
of ICG
n Strong operating
presence in 3 of 4 largest US coal-producing
regions - Central Appalachia, Northern Appalachia, & IL Basin
regions - Central Appalachia, Northern Appalachia, & IL Basin
n Extensive coal
reserve holdings with 63% ownership position
n Favorable contracted
sales position
n Metallurgical sales
projected to double in 2010
n Planned production
growth is primarily from permitted
underground mines with less exposure to environmental issues
underground mines with less exposure to environmental issues
n 100% union-free
workforce
n Solid balance sheet
with minimal long-term legacy liabilities
Summary
Statistics
Market
capitalization1: $700.0 million
Coal
reserves: 1.0
billion tons
Reserve
life: Approximately
58 yrs
Employees: 2,600
2009 tons
sold2: 17.3 to
17.5 million
2009 tons
produced2: 16.4 to
16.6 million
1Market capitalization
is based on 155.2 million shares outstanding and a stock price of $4.51 as of
November 25, 2009.
2Management’s estimate
as of October 28, 2009
UBS Boston
Conference, December 1, 2009
3
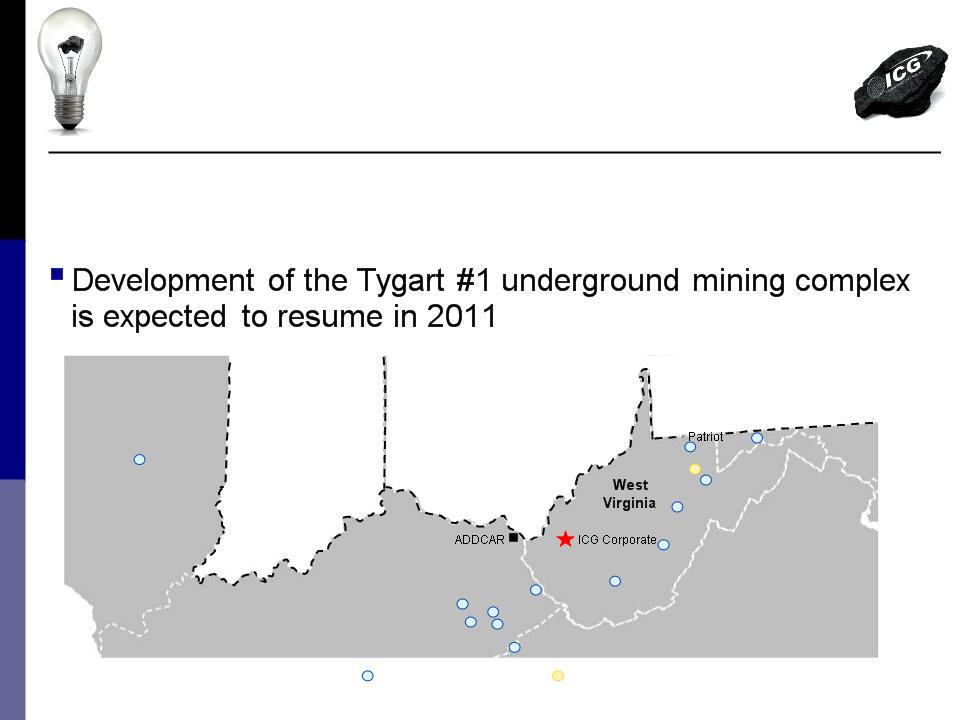
§ 13 active mining
complexes - 8 in Central Appalachia, 4 in
Northern Appalachia, and 1 in Illinois Basin
Northern Appalachia, and 1 in Illinois Basin
Operating
Strength
and Diversity
and Diversity
ICG
Illinois
Illinois
Kentucky
Beckley
Virginia
MD
East
Kentucky
Flint
Ridge
Hazard
Knott
County
Raven
Eastern
Buckhannon
Sentinel
Tygart
Valley #1
Vindex
Current
Operations
Future
Operations
Powell
Mountain
Pennsylvania
Indiana
Ohio
UBS Boston
Conference, December 1, 2009
4

High-Caliber
Reserve Base
(As of September 30, 2009)
(As of September 30, 2009)
37%
Leased
96
million tons met
273
million tons steam
63%
Owned
232
million tons met
399
million tons steam
Geographic
Distribution of
Reserves
Reserves
Reserve
Ownership
Reserves
by Method
11%
Surface
89%
Underground
37%
IL
Basin
37%
NAPP
26%
CAPP
§ ICG controls 1.0
billion tons of high-quality reserves that are
primarily high-BTU, low-sulfur steam and metallurgical coal
primarily high-BTU, low-sulfur steam and metallurgical coal
§ Largest reserve
ownership position among publicly traded peers
§ ~200 million
permitted tons; 162 million underground
UBS Boston
Conference, December 1, 2009
5
Large
Met Quality
Reserve Position*
(As of September 30, 2009)
Reserve Position*
(As of September 30, 2009)
52%
Met
Quality
328
million tons
48%
Steam
Quality
301
million tons
76%
Hi Vol
250
million tons
8%
Mid Vol
26
million tons
16%
Low Vol
52
million tons
n CAPP/NAPP reserves
of 629 million tons are 52%
metallurgical-grade quality
metallurgical-grade quality
UBS Boston
Conference, December 1, 2009
6

2009
Production Profile
(As
of September 30, 2009)
24%
NAPP
62%
CAPP
14%
ILB
Production
by State
Production
by Region
Production
by Method
53%
Surface
47%
Underground
42%
KY
40%
WV
14%
IL
4%
MD
UBS Boston
Conference, December 1, 2009
7
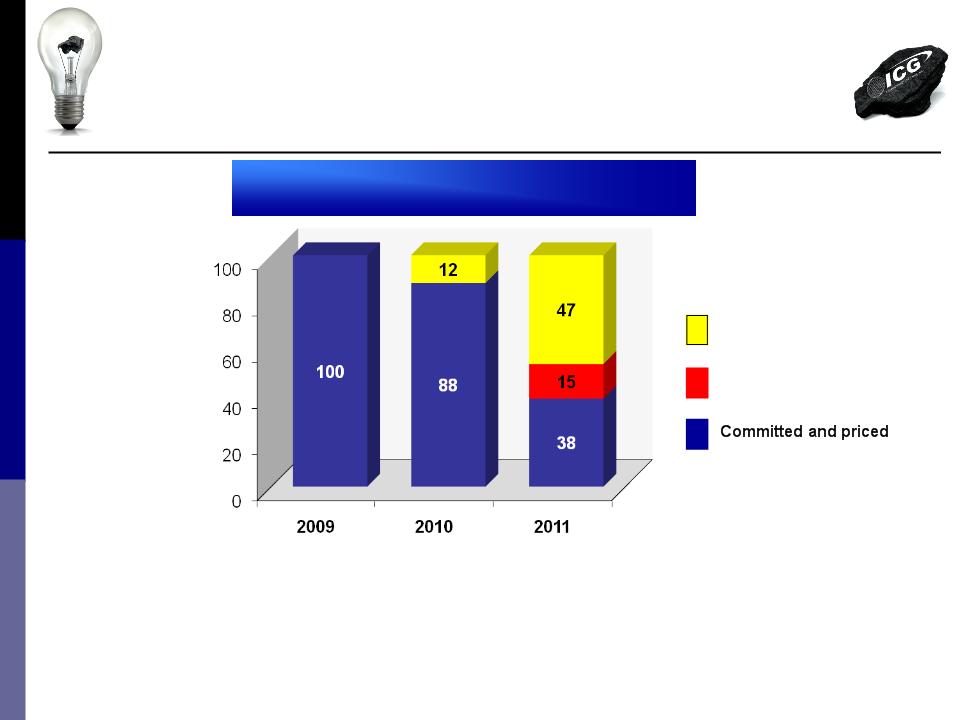
Projected
Sales 17.3
- 17.5 16.5 -
17.5 16.5 -
18.0
(tons in millions)
(tons in millions)
Projected
Price Per Ton $59.25-$59.50 $61.00-$62.50 $65.00-$70.00
Committed
Tonnage1
1 Management’s
estimate as of November 30, 2009
Favorable
Sales Position
%
of
Sales
Sales
UBS Boston
Conference, December 1, 2009
8
Uncommitted
Committed
and not priced

Projecting
Doubling of
Metallurgical Sales
Metallurgical Sales
Future
met growth opportunities
n Tygart
project
– Premium high
volatile met
– 3.5 mm TPY longwall
mine
projected at 40% met
projected at 40% met
n Vindex
Bakerstown project
– Premium low volatile
met
– 0.9 mm TPY CM deep
mine
n These
mines and other permitted
sources could increase annual
met sales to plus 5 mm tons by
2014-15
sources could increase annual
met sales to plus 5 mm tons by
2014-15
UBS Boston
Conference, December 1, 2009
Met
Sales Growth 2006-10
9

Production
Growth Is Primarily
from Underground Mines
from Underground Mines
n Nearly all ICG
growth is comprised of new or expanding
underground mining operations (versus surface mines)
underground mining operations (versus surface mines)
– Major new
development is Tygart #1 complex in Northern App
– Other deep mine
growth planned at Beckley, Illinois, & Raven
n Surface portion of
ICG production steadily decreasing
– Dropped from 65% in
2007 to 53% in 2009
– Projected to
decrease to 31% by 2015
n Although still
subject to development risks, underground
mines have become less controversial (and less likely to be
delayed by anti-mining activists) than surface mines
mines have become less controversial (and less likely to be
delayed by anti-mining activists) than surface mines
UBS Boston
Conference, December 1, 2009
10
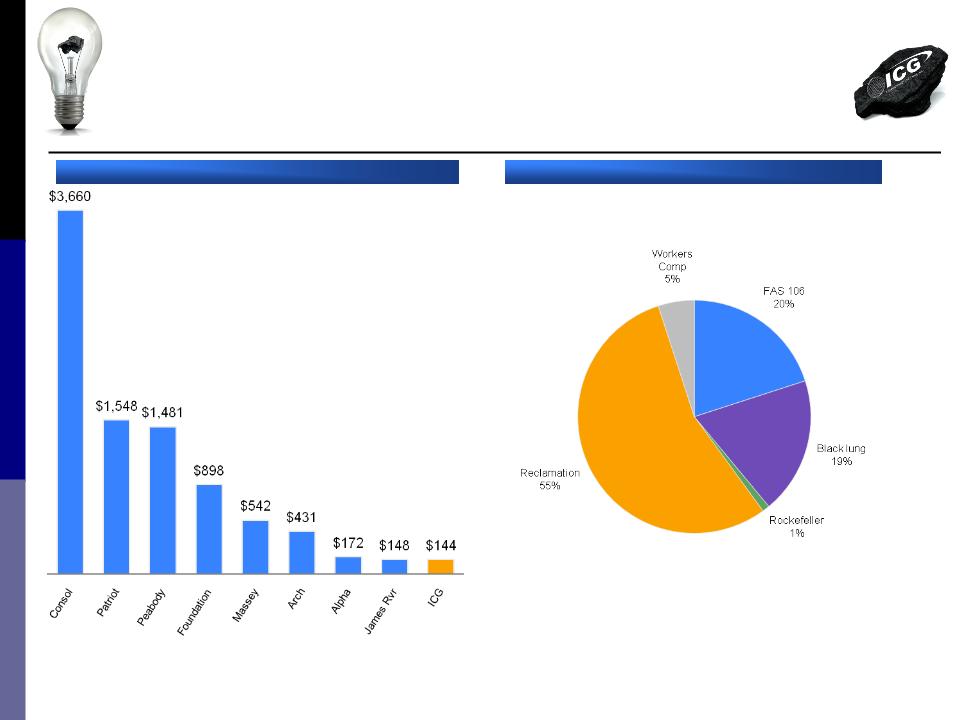
ICG
Legacy Liabilities
Total: $144
million
Total
Legacy Liabilities1
1 Source:
company Annual Reports as of December 31, 2008. Legacy
liabilities include post retirement benefits, black lung liabilities,
reclamation
liabilities, workers compensation and Coal Act liabilities
liabilities, workers compensation and Coal Act liabilities
($ in
millions)
Lowest
Legacy Liabilities
Among
Peer Group
UBS Boston
Conference, December 1, 2009
11

Coal
Market Update
UBS Boston
Conference, December 1, 2009
12

Current Market Conditions
n Market has recently
improved, but remains somewhat fragile
– Rising natural gas
prices are subject to retreat in response to mild weather
or bloated storage reports
or bloated storage reports
– Further, thermal
coal production cuts may be needed to achieve balance
n However, several
positive signals are developing
– Steel capacity
utilization has been improving each week since late April
– Coal exports are
increasing, especially for metallurgical coals
– US economic
indicators, while mixed, are generally showing improvement
n Coal output expected
to remain subdued until utility stockpiles
drop
drop
– However, shipment
execution should improve as winter demand arrives
– Expect domestic coal
inventory levels to fall sharply as dramatic production
cuts become visible in the face of winter demand and rising exports
cuts become visible in the face of winter demand and rising exports
n Overall, we believe
worst of market weakness is behind us
UBS Boston
Conference, December 1, 2009
13
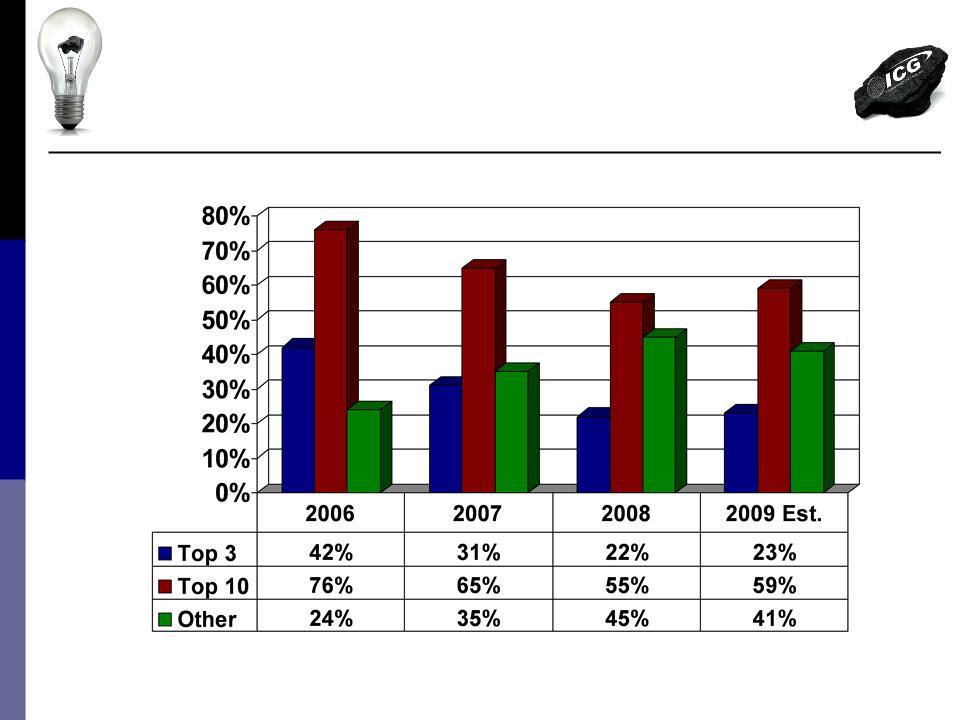
Producers
Reacted
Quickly in 2009
Quickly in 2009
UBS Boston
Conference, December 1, 2009
14

Recent
Thermal Spot Pricing Suggests
Early Signs of Recovery
Early Signs of Recovery
UBS Boston
Conference, December 1, 2009
Prompt
Month Coal Pricing Per ICAP-United, Inc.
15

Forward
Curve Predicts
Meaningful Price Opportunity
Meaningful Price Opportunity
UBS Boston
Conference, December 1, 2009
16

Favorable
Trends for
Met Coal Demand
Met Coal Demand
n Steel capacity
utilization has been recovering:
– U. S. has rebounded
to 65% from 40% in Q1 2009
– Steel sectors in
China, Eastern Europe, & India are near 100%
n Resilient economic
growth in Asia is expected to drive
increased met coal consumption
increased met coal consumption
– Projected GDP growth
in China is 8-10% for 2010 and 2011
– Infrastructure
constraints in Australia expected to position Eastern
US producers favorably to service rising global demand
US producers favorably to service rising global demand
n Recent Australian
spot sales in the $165 range represent a
28% increase from the $129 March settlements
28% increase from the $129 March settlements
n Industry consensus
suggests that met market recovery will
come sooner and stronger than the thermal market rebound
come sooner and stronger than the thermal market rebound
UBS Boston
Conference, December 1, 2009
17

Summary
UBS Boston
Conference, December 1, 2009
18

Near-Term
Strategy
n Maintain flexibility
to match production with changing
markets
markets
– ICG has idled or
reduced 4.2 million annual tons of higher-cost
production since January 2009
production since January 2009
n Capitalize on
improving metallurgical coal market
n Continue to
strengthen liquidity and maximize cash
n Protect profit
margin by managing costs
n Be cautious on
entering coal contracts beyond 2010 as
pricing environment is expected to improve beginning
mid-year
pricing environment is expected to improve beginning
mid-year
UBS Boston
Conference, December 1, 2009
19

Conclusion
n Well-positioned for
the current economic outlook
– Essentially all of
2009 coal is committed at substantially higher prices than
in prior years, solid contract base for 2010
in prior years, solid contract base for 2010
– Maturing of new
mines, lower labor turnover and reduced commodity prices
are expected to help cost performance
are expected to help cost performance
– Met production
expected to double in 2010 (versus 2009)
n Favorable operating
cash flow expected in 2009 and 2010
– Capital spending
reflects a measured and cautious outlook
– Key focus on
strengthening liquidity
n As the market
rebalances in 2010 and global stimulus
efforts take hold, increasing demand for low-cost electricity
and steel products should bode well for coal
efforts take hold, increasing demand for low-cost electricity
and steel products should bode well for coal
UBS Boston
Conference, December 1, 2009
20

Questions?
UBS Boston
Conference, December 1, 2009
21

Appendices
UBS Boston
Conference, December 1, 2009
22

Production
and Operating
Statistics
Statistics
UBS Boston
Conference, December 1, 2009
23
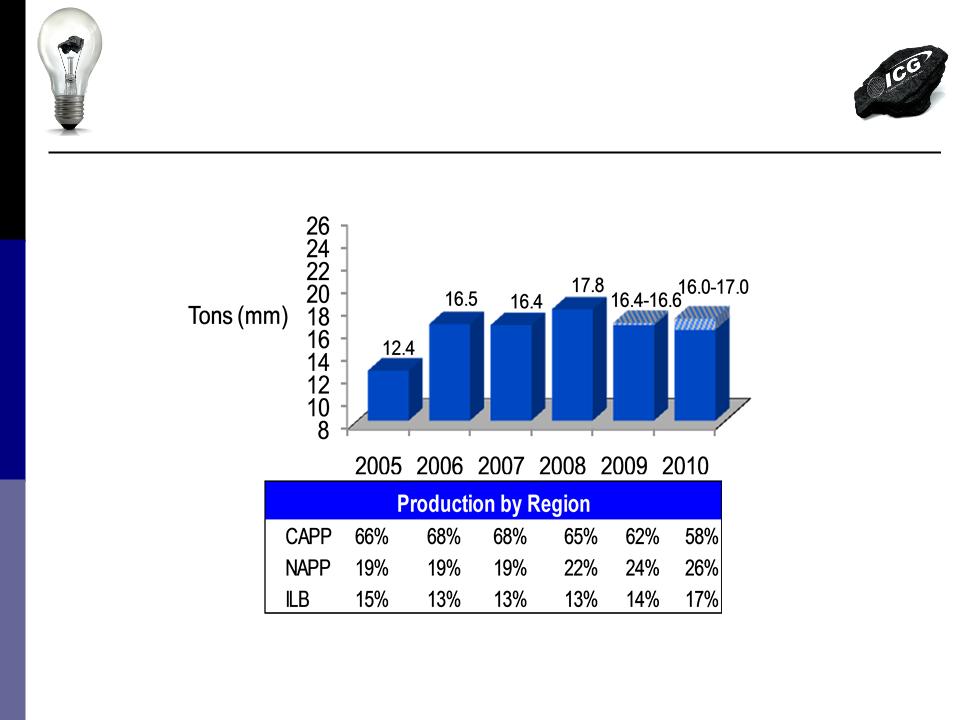
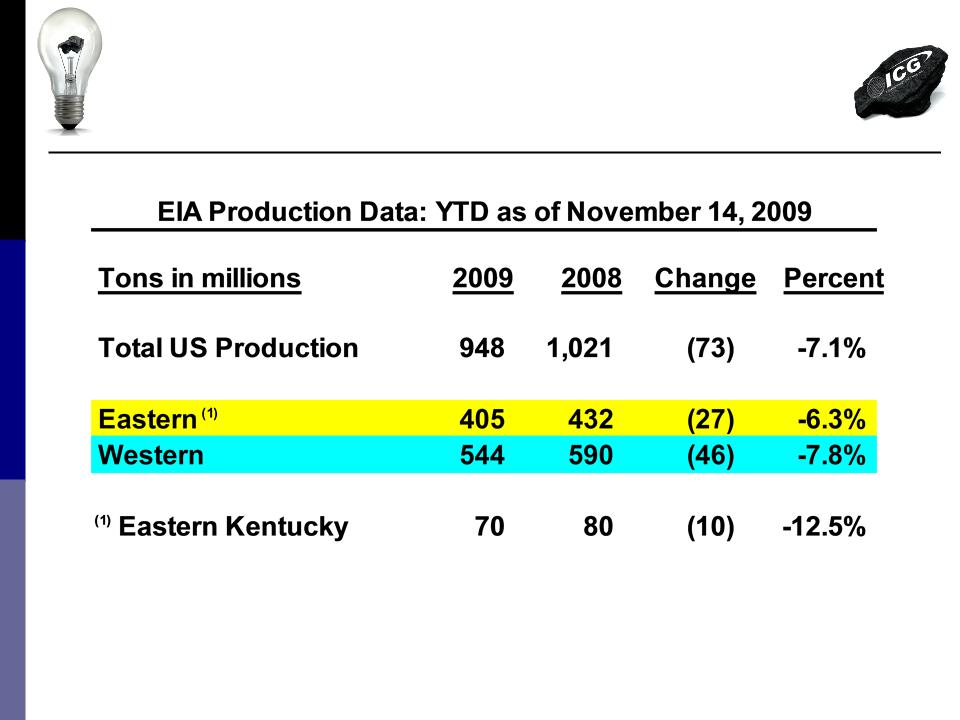
Adjusting
Production
Growth To Match Demand
Growth To Match Demand
1 Management’s estimate
as of October 28, 2009
UBS Boston
Conference, December 1, 2009
24
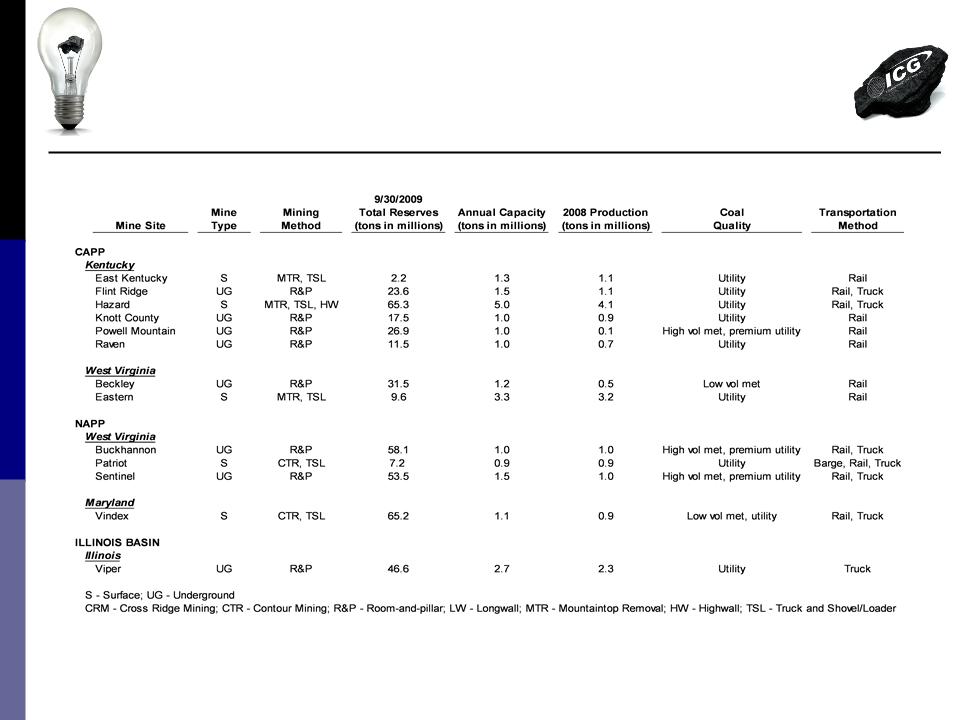
Summary
of Active
Mining Operations
Mining Operations
UBS Boston
Conference, December 1, 2009
25

Peer
Group
Cost
and Margin Comparisons
UBS Boston
Conference, December 1, 2009
26

Peer
Group Cost Per Ton
Appalachian Production (2007 - 3Q09)
Appalachian Production (2007 - 3Q09)
UBS Boston
Conference, December 1, 2009
27

Peer
Group Cost Per Ton
Illinois Basin Production (2007 - 3Q09)
Illinois Basin Production (2007 - 3Q09)
UBS Boston
Conference, December 1, 2009
28

Peer
Group Margin Comparison
Margin Per Ton in Dollars (2007 - 3Q09)
Margin Per Ton in Dollars (2007 - 3Q09)
UBS Boston
Conference, December 1, 2009
29

Recap
of ICG Capital
Investment
Strategy
2005-2009
UBS Boston
Conference, December 1, 2009
30

ICG
Capital Investment Focus
n Capital investment
strategy during 2005-2009 has focused
on two key areas:
on two key areas:
1. Development capital
for construction of new mining complexes to
boost production for targeted markets
boost production for targeted markets
2. Maintenance capital
designed to “catch up” for years of under-
investment and upgrade the aged equipment fleet inherited from
the Horizon and Anker bankruptcies
investment and upgrade the aged equipment fleet inherited from
the Horizon and Anker bankruptcies
UBS Boston
Conference, December 1, 2009
31

Substantial
Success Achieved in
Launching Expansion Projects
Launching Expansion Projects
|
Major
Expansion Projects
|
2005
|
2006
|
2007
|
2008
|
2009
Est |
|
• Flint
Ridge Complex
|
|
|
|
|
|
|
• Raven
Complex
|
|
|
|
|
|
|
• Vindex
Barton/Buffalo Expansion
|
|
|
|
|
|
|
• New
Sentinel Clarion Mine
|
|
|
|
|
|
|
• Beckley
Complex
|
|
|
|
|
|
|
• Hazard
Shovel Spread
|
|
|
|
|
|
|
• Tygart
#1 Complex (Ongoing)
|
|
|
|
|
|
|
• Other
Substantial Exp Projects
|
|
|
|
|
|
|
Total
Project Capex
(millions)
|
$35.6
|
$92.2
|
$123.3
|
$94.9
|
$8.0
|
Total
of $354.0 million invested in expansion projects during 2005-2009
UBS Boston
Conference, December 1, 2009
32

Maintenance
Capital “Catch-Up”
Spending Has Leveled Off
Spending Has Leveled Off
|
($
in millions)
|
2005
|
2006
|
2007
|
2008
|
2009
Est
|
|
Total Capital
Expenditures
|
$116.8
|
$197.0
|
$181.3
|
$171.6
|
$94.5
|
|
|
|
|
|
|
|
|
Less Project
Capex
|
$35.6
|
$92.2
|
$123.3
|
$94.9
|
$8.0
|
|
|
|
|
|
|
|
|
=
Non-Project Capital
(Basic
Maintenance Capex)
|
$81.2
|
$104.8
|
$58.0
|
$76.7
|
$86.5
|
|
|
|
|
|
|
|
|
Coal
Production (tons, millions)
|
12.4
|
16.5
|
16.4
|
17.8
|
16.5
|
|
|
|
|
|
|
|
|
Maintenance
Capex/Ton
|
$6.55
|
$6.35
|
$3.54
|
$4.31
|
$5.24(1)
|
UBS Boston
Conference, December 1, 2009
33
Note
: (1) Idled capacity due to market-driven production cuts essentially inflated
2009 maintenance capex per ton

Equipment
Fleet Now
Significantly Stronger
Significantly Stronger
UBS Boston
Conference, December 1, 2009
34

Miscellaneous
Coal Reserves
&
Sales Statistics Slides
UBS Boston
Conference, December 1, 2009
35

Substantial
Permitted Reserves
(September 30, 2009)
(September 30, 2009)
Permitted
199
million tons
Non-permitted
801
million tons
NAPP
116
million tons
CAPP
64
million tons
ILL
19
million tons
n ICG’s permitted
reserves include 162 million tons
underground and 37 million tons surface
underground and 37 million tons surface
Permitted
Reserves
Permitted
Reserves by
Geographic
Basin
UBS Boston
Conference, December 1, 2009
36
More
Diversified
Customer Base
Customer Base
UBS Boston
Conference, December 1, 2009
37