Attached files
| file | filename |
|---|---|
| 8-K - FORM 8-K - CONSOLIDATED GRAPHICS INC /TX/ | c93236e8vk.htm |
Exhibit 99.1
| Investor Update December 2009 |
| Forward Looking Statements / Non-GAAP Measures This presentation may contain "forward-looking statements" within the meaning of Section 27A of the Securities Act of 1933, as amended, and Section 21E of the Securities Exchange Act of 1934, as amended, in which the Company discusses factors it believes may affect its performance or results in the future. The accuracy of the Company's assumptions, expectations, beliefs and projections depend on events or conditions that change over time and are thus susceptible to change based on actual experience, new developments and known and unknown risks, including those created by general market conditions, competition and the possibility that events may occur beyond the Company's control, which may limit its ability to maintain or improve its operating results or financial condition or acquire additional printing businesses. The Company gives no assurance that the forward-looking statements will prove to be correct and does not undertake any duty to update them. You should refer to the cautionary statements and risks described under the heading "Risk Factors" of the Company's most recently filed Annual Report on Form 10-K/A and the risk factors and cautionary statements described in the other documents the Company files or furnishes from time to time with the Securities and Exchange Commission ("SEC"), including its Quarterly Reports on Form 10-Q and Current Reports on Form 8-K. Should one or more of the foregoing risks or uncertainties materialize, or should the Company's underlying assumptions, expectations, beliefs or projections prove incorrect, the Company's actual results may vary materially from those anticipated in its forward-looking statements, and its business, financial condition and results of operations could be materially and adversely affected. Management's presentation and discussions with investors also reference certain Non-GAAP financial measures. Management's opinion regarding the usefulness of such measures together with the reconciliation of such measures to the most directly comparable GAAP measures are included in Consolidated Graphics' report on Form 8-K filed Nov 4, 2009. |
| Provide our customers with the service and responsiveness of a local printing company... ...combined with the economic, geographic and technological advantages of a large national printer CGX Strategy Summary |
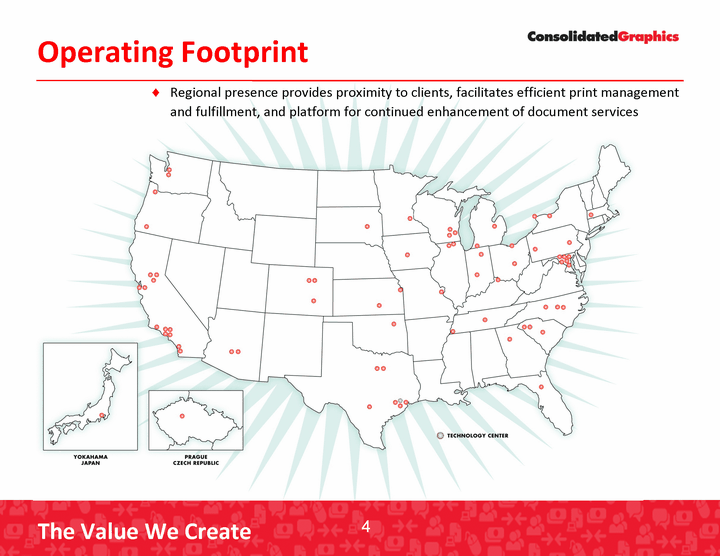
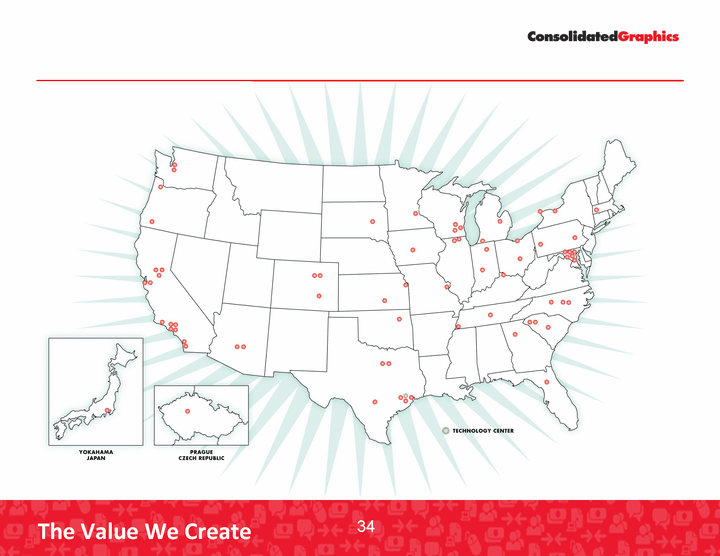
| Operating Footprint Regional presence provides proximity to clients, facilitates efficient print management and fulfillment, and platform for continued enhancement of document services |
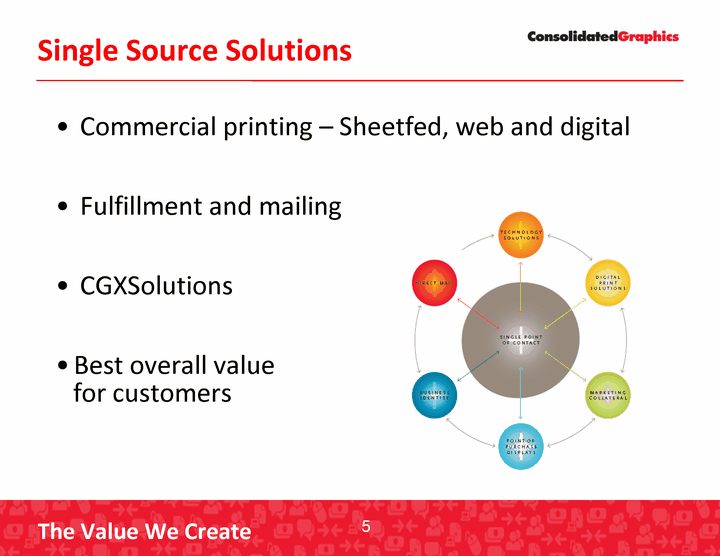
| Single Source Solutions Commercial printing - Sheetfed, web and digital Fulfillment and mailing CGXSolutions Best overall value for customers |

| Single Source Solutions Marketing Materials Product Brochures Point-of-Sale Signage Shareholder Communications Photo Products Direct Mail Online Solutions |
| Industry Characteristics Highly fragmented, $50 billion industry in North America Local service business Customers Local, regional and national businesses Customer requirements High level of service High level of quality Technology solutions |
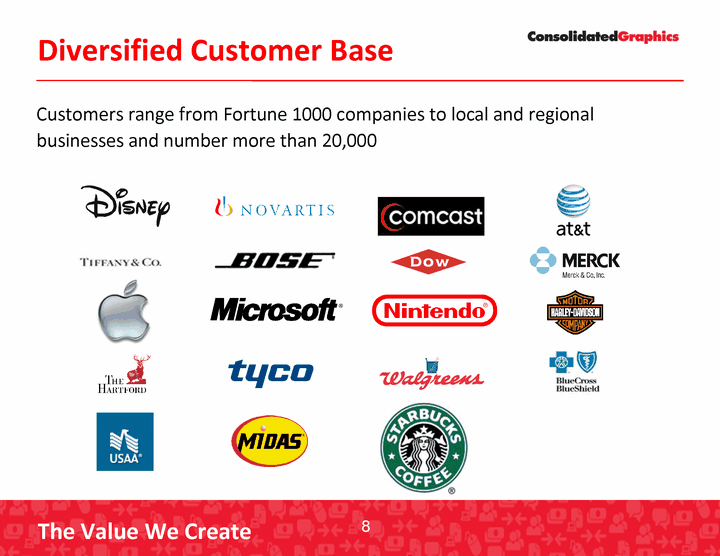
| Diversified Customer Base Customers range from Fortune 1000 companies to local and regional businesses and number more than 20,000 |
| Strategic Advantages CGX strategic advantages include Large diversified customer base World leader in digital printing Technology solutions Strategic sales group Economies of scale relative to the competition These strategic advantages are creating opportunities to capture market share: Strategic sales - national and technology related sales Hiring sales staff from failed competitors Business acquisitions that continue to be selectively evaluated |
| Operating Model Decentralized Management Structure 70 operating companies Supported by corporate headquarters Growth Drivers Strategic Sales Team Digital Print Local service and a customer focus Business Acquisitions |
| Strategic Sales Strategic Sales strategy supports local companies and customer relationships Proven track record in helping companies leverage spend and drive compliance Current economy has companies looking for new and innovative solutions to streamline processes, reduce cost and increase revenue Focus on Total Cost of Ownership and less on price per piece Single source solutions combined with industry leading technology are key to success |
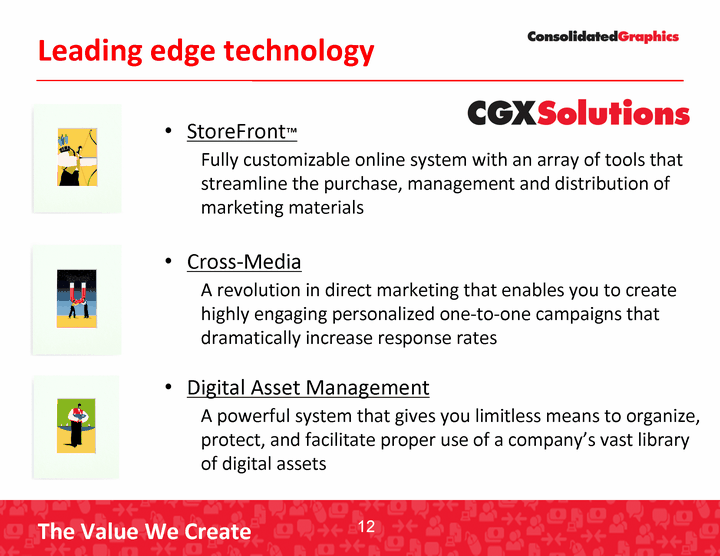
| Leading edge technology StoreFront(tm) Fully customizable online system with an array of tools that streamline the purchase, management and distribution of marketing materials Cross-Media A revolution in direct marketing that enables you to create highly engaging personalized one-to-one campaigns that dramatically increase response rates Digital Asset Management A powerful system that gives you limitless means to organize, protect, and facilitate proper use of a company's vast library of digital assets |
| World leader in digital 220 high-end digital presses World's most advanced digital footprint Fully integrated for consistency and quality High impact personalized marketing Print on demand... "Just in time" instead of "Just in case" Distribute and print to save time and money |

| Digital revenue growth through 6 months ended September 30, 2009 only down 1% Demand growing faster than overall industry Lower economic order quantities and use of variable data Cost of equipment along with complementary technology provides barrier to entry World leader in digital |

| Local Operating Companies Growth Expand sales force Increase digital sales Leverage CGX network of capabilities Strategic sales Protect operating margins during the downturn Closely monitor labor expense metrics Minimize overtime and use of temporary labor Targeted workforce reductions Efficiencies from capital expenditures Executive management attention to under-performing operations |
| Growth Through Business Acquisitions • Significant Near-Term Opportunities Acquisition pipeline in excess of $500 million annual revenues Current economic environment providing distressed business acquisition opportunities • CGX Strongly Positioned Preferred buyer Excellent reputation Execution expertise Strong Balance Sheet |
| Leadership Development Program College graduate recruiting and training program 377 associates 20 current company Presidents (29% of all Presidents) Unmatched ability to support long-term growth and succession in sales and management |
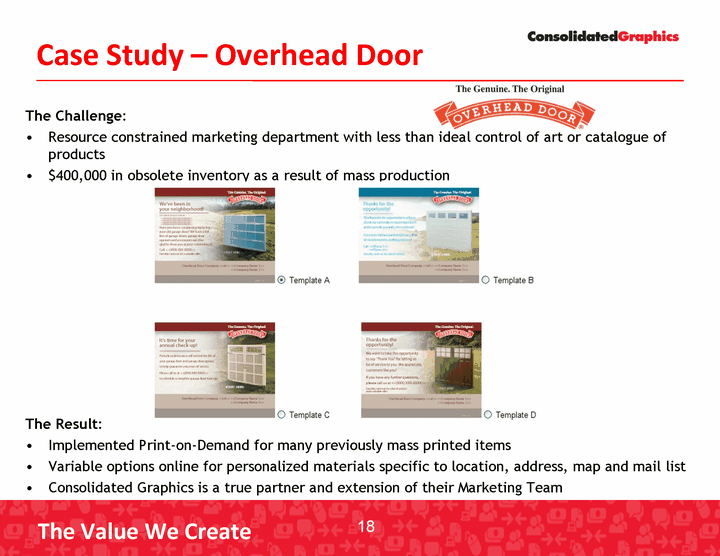
| The Challenge: Resource constrained marketing department with less than ideal control of art or catalogue of products $400,000 in obsolete inventory as a result of mass production The Result: Implemented Print-on-Demand for many previously mass printed items Variable options online for personalized materials specific to location, address, map and mail list Consolidated Graphics is a true partner and extension of their Marketing Team Case Study - Overhead Door |
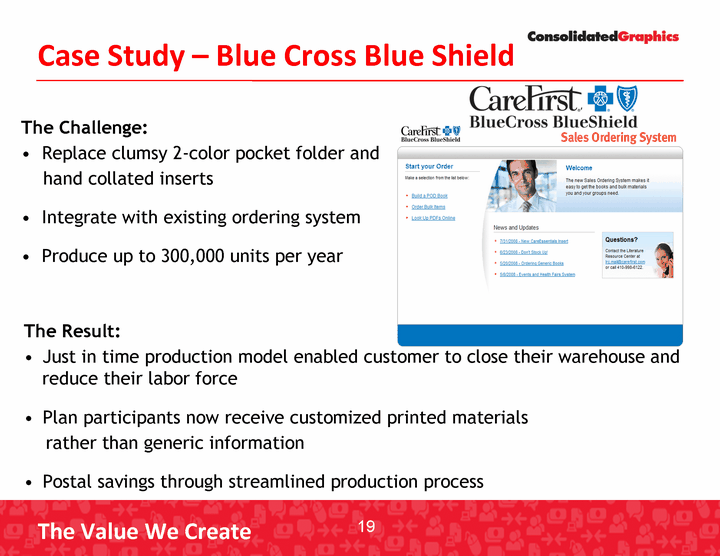
| The Result: Just in time production model enabled customer to close their warehouse and reduce their labor force Plan participants now receive customized printed materials rather than generic information Postal savings through streamlined production process The Challenge: Replace clumsy 2-color pocket folder and hand collated inserts Integrate with existing ordering system Produce up to 300,000 units per year Case Study - Blue Cross Blue Shield |
| Financial Information |
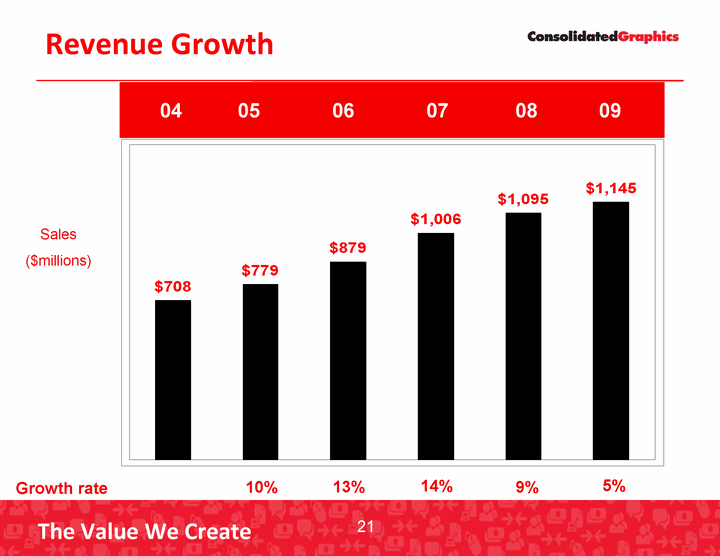
| Revenue Growth Sales ($millions) 04 05 06 07 08 09 Growth rate 13% 14% 10% 9% 5% |
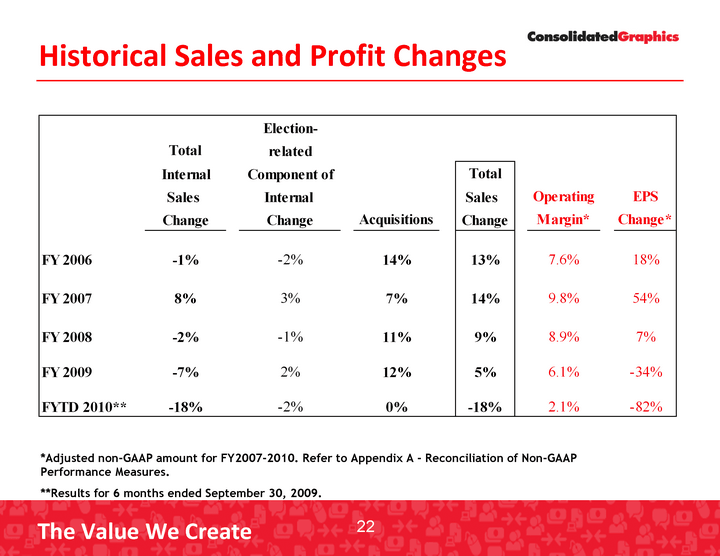
| *Adjusted non-GAAP amount for FY2007-2010. Refer to Appendix A - Reconciliation of Non-GAAP Performance Measures. **Results for 6 months ended September 30, 2009. Historical Sales and Profit Changes |
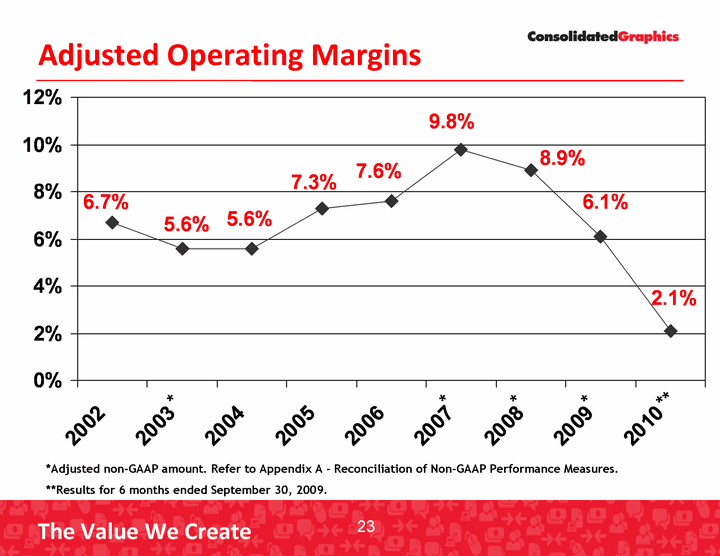
| 2002 2003 2004 2005 2006 2007 2008 2009 2010 East 0.067 0.056 0.056 0.073 0.076 0.098 0.089 0.061 0.021 * * Adjusted Operating Margins *Adjusted non-GAAP amount. Refer to Appendix A - Reconciliation of Non-GAAP Performance Measures. **Results for 6 months ended September 30, 2009. * ** * |
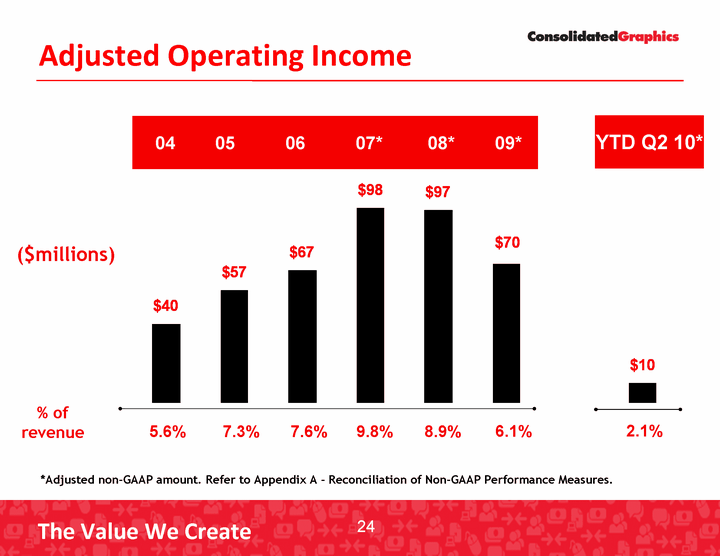
| Adjusted Operating Income Q109 % of revenue 5.6% 7.3% 7.6% 9.8% 8.9% ($millions) 2.1% YTD Q2 10* *Adjusted non-GAAP amount. Refer to Appendix A - Reconciliation of Non-GAAP Performance Measures. 04 05 06 07* 08* 09* 6.1% |

| Strong Free Cash Flows FY 2006 FY 2007 FY 2008 FY 2009 YTD Q2 FY 2010 Operating Cash Flows 79 73 110 141 96 Free Cash Flows 49 31 30 66 86 Cash Flow from Operations Free Cash Flow* ($millions) *Net cash provided by operating activities, less capital expenditures, plus proceeds from asset dispositions. YTD Q2 10* 06 07* 08* 09* |
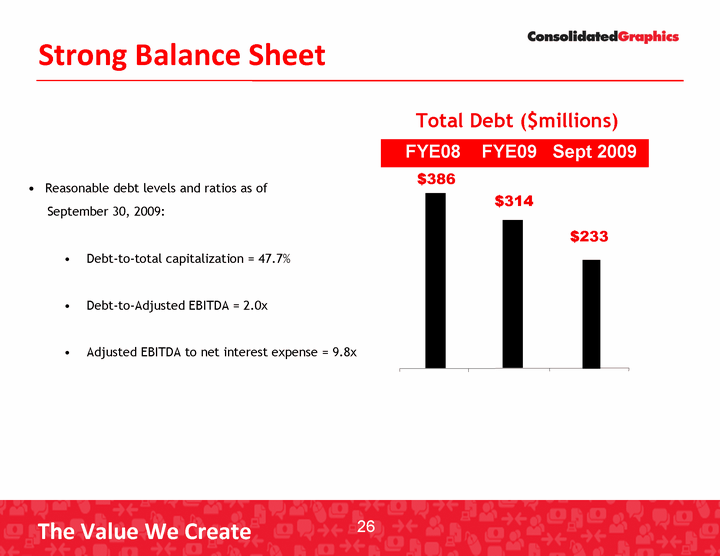
| Strong Balance Sheet Total Debt ($millions) Reasonable debt levels and ratios as of September 30, 2009: Debt-to-total capitalization = 47.7% Debt-to-Adjusted EBITDA = 2.0x Adjusted EBITDA to net interest expense = 9.8x $233 FYE08 FYE09 Sept 2009 $386 $314 |
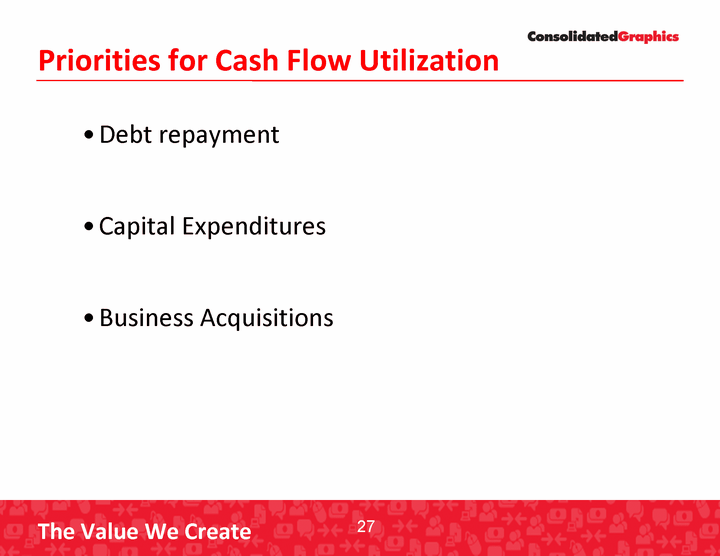
| Priorities for Cash Flow Utilization Debt repayment Capital Expenditures Business Acquisitions |
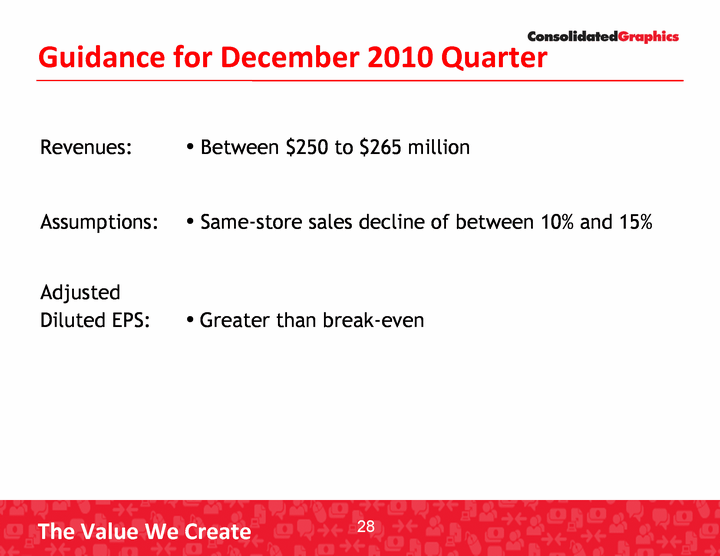
| Guidance for December 2010 Quarter |
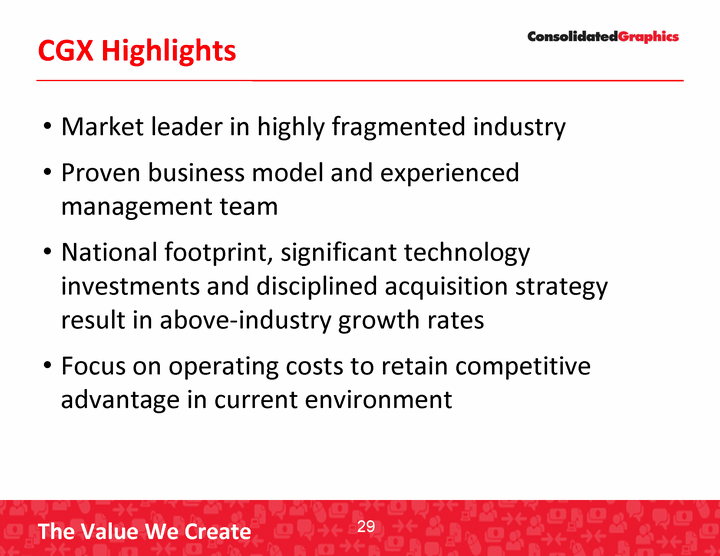
| Market leader in highly fragmented industry Proven business model and experienced management team National footprint, significant technology investments and disciplined acquisition strategy result in above-industry growth rates Focus on operating costs to retain competitive advantage in current environment CGX Highlights |
| Appendix: Reconciliation of Non-GAAP Performance Measures |
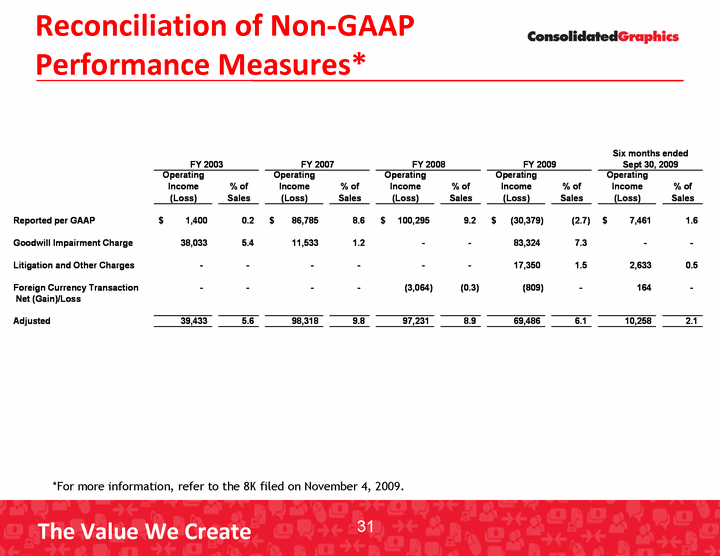
| Reconciliation of Non-GAAP Performance Measures* *For more information, refer to the 8K filed on November 4, 2009. |
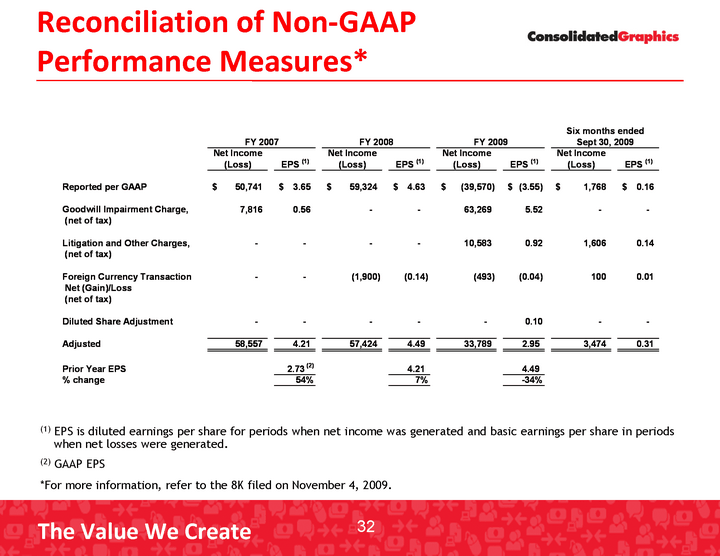
| Reconciliation of Non-GAAP Performance Measures* (1) EPS is diluted earnings per share for periods when net income was generated and basic earnings per share in periods when net losses were generated. (2) GAAP EPS *For more information, refer to the 8K filed on November 4, 2009. |
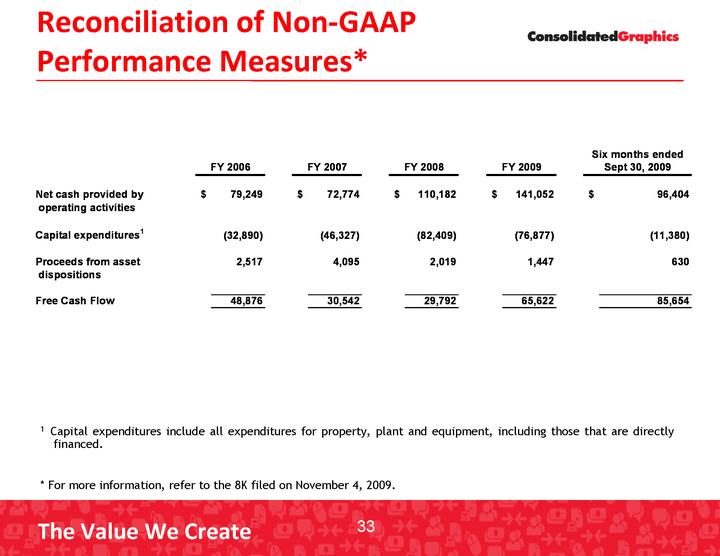
| Reconciliation of Non-GAAP Performance Measures* 1 Capital expenditures include all expenditures for property, plant and equipment, including those that are directly financed. * For more information, refer to the 8K filed on November 4, 2009. |
