Attached files
| file | filename |
|---|---|
| 8-K - FORM 8-K REG FD CITI PRESENTATION - Celanese Corp | form8kregfdciti.htm |

Celanese
Corporation
December
2009

2
Forward
Looking Statements, Reconciliation and Use of Non-
GAAP Measures to U.S. GAAP
GAAP Measures to U.S. GAAP
Forward-Looking
Statements
This
presentation may contain “forward-looking statements,” which include information
concerning the company’s plans, objectives, goals, strategies, future revenues
or performance, capital
expenditures, financing needs and other information that is not historical information. When used in this release, the words “outlook,” “forecast,” “estimates,” “expects,” “anticipates,” “projects,” “plans,” “intends,”
“believes,” and variations of such words or similar expressions are intended to identify forward-looking statements. All forward-looking statements are based upon current expectations and beliefs and various
assumptions. There can be no assurance that the company will realize these expectations or that these beliefs will prove correct. There are a number of risks and uncertainties that could cause actual results to differ
materially from the forward-looking statements contained in this release. Numerous factors, many of which are beyond the company’s control, could cause actual results to differ materially from those expressed as
forward-looking statements. Certain of these risk factors are discussed in the company’s filings with the Securities and Exchange Commission. Any forward-looking statement speaks only as of the date on which it is
made, and the company undertakes no obligation to update any forward-looking statements to reflect events or circumstances after the date on which it is made or to reflect the occurrence of anticipated or
unanticipated events or circumstances.
Reconciliation
of Non-U.S. GAAP Measures to U.S. GAAP
This
presentation reflects five performance measures, operating EBITDA, affiliate
EBITDA, adjusted earnings per share, net debt and adjusted free cash flow, as
non-U.S. GAAP measures. The
most directly comparable financial measure presented in accordance with U.S. GAAP in our consolidated financial statements for operating EBITDA is operating profit; for affiliate EBITDA is equity in net earnings of
affiliates; for adjusted earnings per share is earnings per common share-diluted; for net debt is total debt; and for adjusted free cash flow is cash flow from operations.
Use
of Non-U.S. GAAP Financial Information
►Operating
EBITDA, a measure used by management to measure performance, is defined as
operating profit from continuing operations, plus equity in net earnings from
affiliates, other income and depreciation and
amortization, and further adjusted for other charges and adjustments. We may provide guidance on operating EBITDA and are unable to reconcile forecasted operating EBITDA to a U.S.GAAP financial measure
because a forecast of Other Charges and Adjustments is not practical. Our management believes operating EBITDA is useful to investors because it is one of the primary measures our management uses for its
planning and budgeting processes and to monitor and evaluate financial and operating results. Operating EBITDA is not a recognized term under U.S. GAAP and does not purport to be an alternative to operating
profit as a measure of operating performance or to cash flows from operating activities as a measure of liquidity. Because not all companies use identical calculations, this presentation of operating EBITDA may not
be comparable to other similarly titled measures of other companies. Additionally, operating EBITDA is not intended to be a measure of free cash flow for management’s discretionary use, as it does not consider
certain cash requirements such as interest payments, tax payments and debt service requirements nor does it represent the amount used in our debt covenants.
►Affiliate
EBITDA, a measure used by management to measure performance of its equity
investments, is defined as the proportional operating profit plus the
proportional depreciation and amortization of its equity
investments. Affiliate EBITDA, including Celanese Proportional Share of affiliate information on Table 8, is not a recognized term under U.S. GAAP and is not meant to be an alternative to operating cash flow of the
equity investments. The company has determined that it does not have sufficient ownership for operating control of these investments to consider their results on a consolidated basis. The company believes that
investors should consider affiliate EBITDA when determining the equity investments’ overall value in the company.
►Adjusted
earnings per share is a measure used by management to measure performance. It is
defined as net earnings (loss) available to common shareholders plus preferred
dividends, adjusted for other charges
and adjustments, and divided by the number of basic common shares, diluted preferred shares, and options valued using the treasury method. We may provide guidance on an adjusted earnings per share basis and
are unable to reconcile forecasted adjusted earnings per share to a GAAP financial measure without unreasonable effort because a forecast of Other Items is not practical. We believe that the presentation of this
non-U.S. GAAP measure provides useful information to management and investors regarding various financial and business trends relating to our financial condition and results of operations, and that when U.S.
GAAP information is viewed in conjunction with non-U.S. GAAP information, investors are provided with a more meaningful understanding of our ongoing operating performance. This non-U.S. GAAP information is
not intended to be considered in isolation or as a substitute for U.S. GAAP financial information.
►The
tax rate used for adjusted earnings per share approximates the midpoint in a
range of forecasted tax rates for the year, excluding changes in uncertain tax
positions, discrete items and changes in
management’s assessments regarding the ability to realize deferred tax assets. We analyze this rate quarterly and adjust if there is a material change in the range of forecasted tax rates; an updated forecast would
not necessarily result in a change to our tax rate used for adjusted earnings per share. The adjusted tax rate is an estimate and may differ significantly from the tax rate used for U.S. GAAP reporting in any given
reporting period. It is not practical to reconcile our prospective adjusted tax rate to the actual U.S. GAAP tax rate in any future period.
►Net
debt is defined as total debt less cash and cash equivalents. We
believe that the presentation of this non-U.S. GAAP measure provides useful
information to management and investors regarding changes to
the company’s capital structure. Our management and credit analysts use net debt to evaluate the company's capital structure and assess credit quality. This non-U.S. GAAP information is not intended to be
considered in isolation or as a substitute for U.S. GAAP financial information.
the company’s capital structure. Our management and credit analysts use net debt to evaluate the company's capital structure and assess credit quality. This non-U.S. GAAP information is not intended to be
considered in isolation or as a substitute for U.S. GAAP financial information.
►Adjusted
free cash flow is defined as cash flow from operations less capital
expenditures, other productive asset purchases, operating cash from discontinued
operations and certain other charges and adjustments.
We believe that the presentation of this non-U.S. GAAP measure provides useful information to management and investors regarding changes to the company’s cash flow. Our management and credit analysts use
adjusted free cash flow to evaluate the company’s liquidity and assess credit quality. This non-U.S. GAAP information is not intended to be considered in isolation or as a substitute for U.S. GAAP financial
information.
Results
Unaudited
The
results presented in this presentation, together with the adjustments made to
present the results on a comparable basis, have not been audited and are based
on internal financial data furnished to management.
Quarterly results should not be taken as an indication of the results of operations to be reported for any subsequent period or for the full fiscal year.
Quarterly results should not be taken as an indication of the results of operations to be reported for any subsequent period or for the full fiscal year.

3
Celanese
($
million)
2008
Revenue: $6,823
2008
Operating EBITDA: $1,169
2009
3Q YTD Revenue: $3,694
2009
3Q YTD Op. EBITDA: $620
Consumer
Specialties
2008
Revenue: $1,155
2008
Operating EBITDA: $293
2009
3Q YTD Revenue: $817
2009
3Q YTD Op. EBITDA: $283
Advanced
Engineered
Materials
Materials
2008
Revenue: $1,061
2008
Operating EBITDA: $170
2009
3Q YTD Revenue: $569
2009
3Q YTD Op. EBITDA: $84
Industrial
Specialties
2008
Revenue: $1,406
2008
Operating EBITDA: $117
2009
3Q YTD Revenue: $745
2009
3Q YTD Op. EBITDA: $90
Acetyl
Intermediates
2008
Revenue: $3,201
2008
Operating EBITDA: $676
2009
3Q YTD Revenue: $1,860
2009
3Q YTD Op. EBITDA: $229
Strong
financial performance in a challenging year
Celanese
diversified portfolio delivers
shareholder value through leading franchises
shareholder value through leading franchises

4
|
|
Portfolio
Characteristics
|
Financial
Impact
|
|
Advanced
Engineered
Materials (Engineered
Thermoplastics and
Polymers) |
► Industry-leading
technology
► Strong product
pipeline
|
► Higher
growth
► Margin
expansion
|
|
Consumer
Specialties
(Acetate
Flake and Tow, High
Intensity Food Sweetener) |
► Stable cash
generation
► Industry-leading
partnerships in
Asia |
► Cash
flow
► Stable
|
|
Acetyl
Intermediates
(Acetic
Acid, Vinyl Acetate
Monomer, Acetyl Derivatives) |
► A global
leader
► Advantaged
technology
► Superior cost
position
|
► Capital
efficient
► More stable
EBITDA
|
|
Industrial
Specialties
(Vinyl
Emulsions and Polymers)
|
► Upstream
integration
► Emerging
economy opportunities
► Growth through
innovation
|
► Asia
growth
► Increased
demand for low VOC
|
Balanced
portfolio creates a unique hybrid business model
Portfolio
well-positioned to deliver and
execute
execute
5
► Balanced footprint
in key
regions
regions
► Recovering
conditions in key
end-use industries
end-use industries
► Attractive balance
sheet with
strong cash generation
strong cash generation
Geographic
Demand
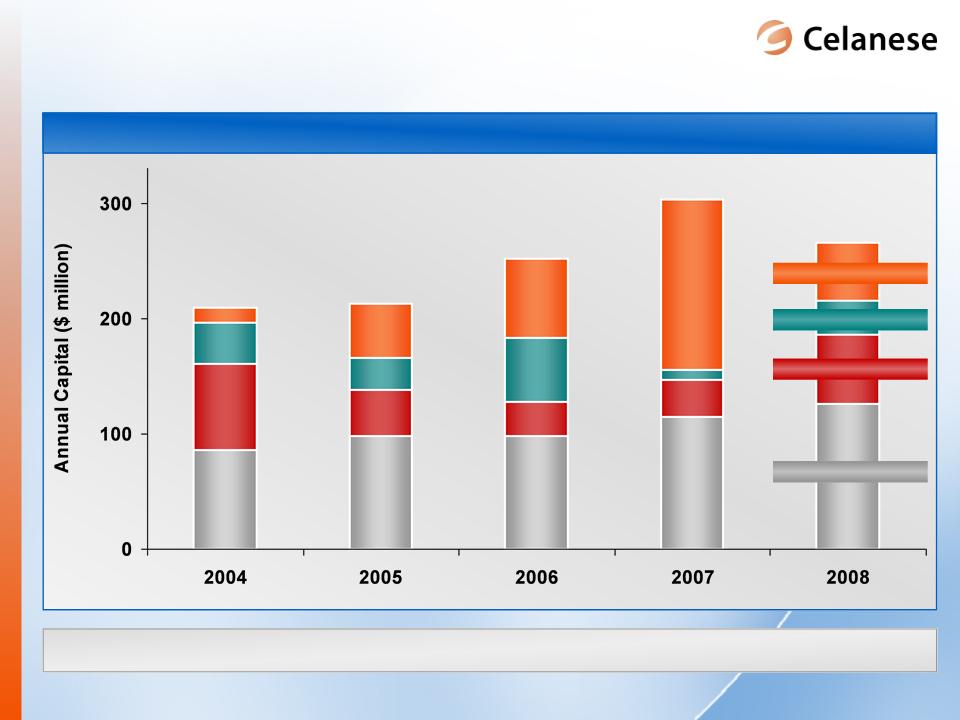
Capital
Structure
► Sustainable fixed
spending
reductions
reductions
► Efficient and
scalable capital
► Global macro trends
driving
customer growth
customer growth
Operating
Innovation
Celanese
Advantages Celanese
Levers of Value
Increasing
the earnings power of the business through multiple
levers
levers
Why
Celanese? Why
Celanese Now?

6
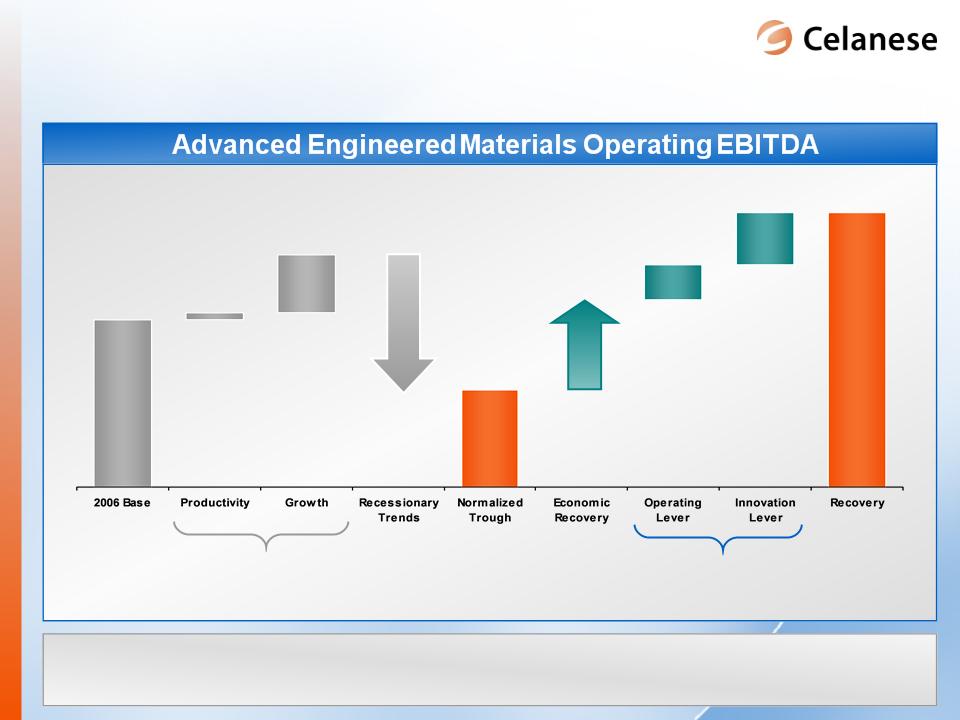
Operating
EBITDA
2006
- 2010 Strategic Objectives
$350-400
million
~$1,100
million
$1,600-1,800
million
2009
to “Recovery” Strategic Objectives
$250-350
million
$800-1,000
million
Increased
earnings power drives significant
shareholder value
shareholder value
7
2006
- 2010 Strategic Objectives
>$100
million
2009
to “Recovery” Strategic Objectives
$70-90
million
Earnings
power improvement substantial with initiatives - innovation
will play a key role
will play a key role
$400-450
million
$140-160
million
New
initiatives increase earnings
8
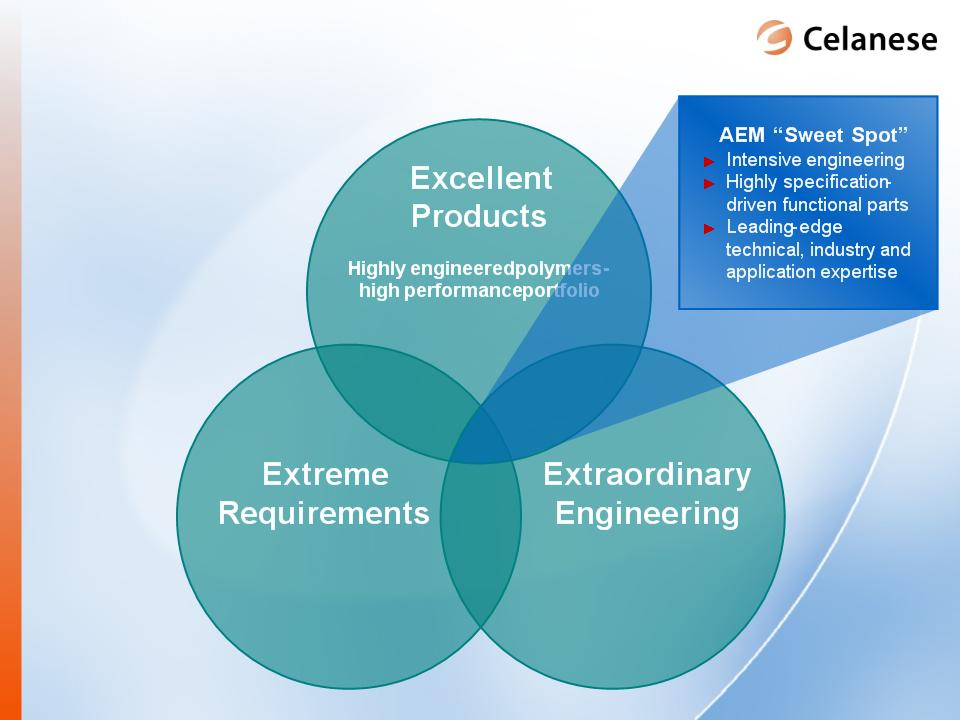
Precise
applications
in complex
environments
in complex
environments
Collaborative
engineering
right people - right place -
right time
right people - right place -
right time
Providing
valuable solutions to extreme
requirements
requirements
9
95%
5%
Standard
Polymers
High-Performance
Polymers (HPP)
Engineering
Thermoplastics (ETP)
ABS,
SAN, ASA = 3%
PE
= 28%
PP
= 19%
PET
= 7%
PU
= 6%
PVC
= 14%
PS,
EPS = 8%
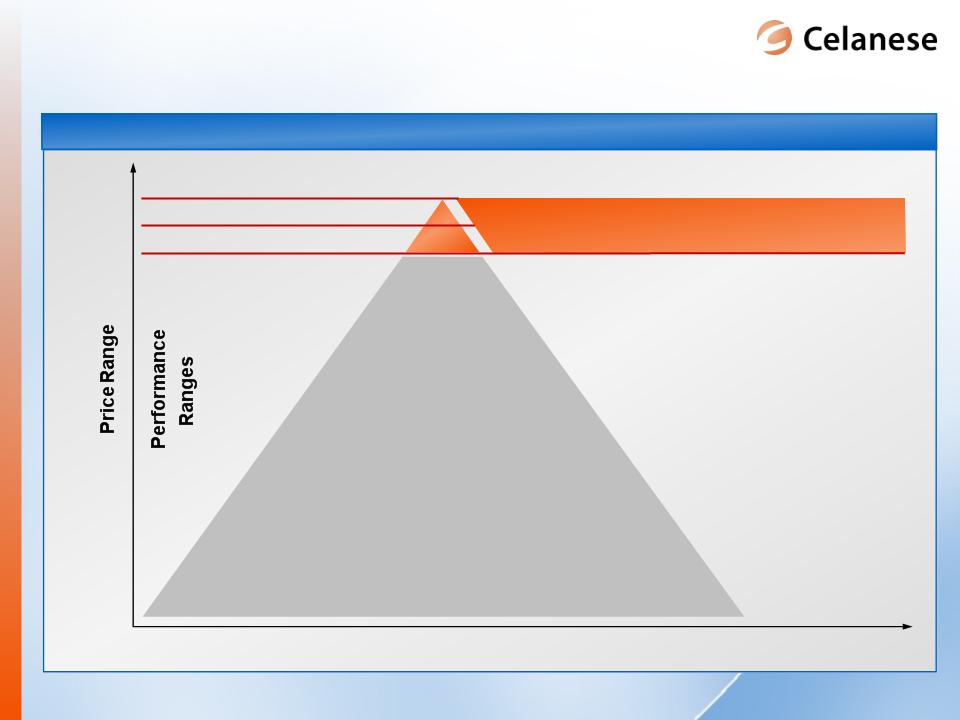
Range
of Products
$1/kg
$100/kg
$10/kg
$3/kg
Price
for Performance
PA
= 5%
PC
= 5%
Value
of technology and performance is
differentiated
differentiated

10
|
Key
Products
|
Ticona
|
DuPont
|
DSM
|
Sabic
|
Solvay
|
BASF
|
Major
End Uses
|
|
Hostaform®
Polyacetal
Copolymer (POM) |
+++
|
+++
|
--
|
--
|
--
|
++
|
|
|
Vectra®
Liquid
Crystal
Polymer (LCP) |
+++
|
++
|
--
|
--
|
++
|
--
|
|
|
GUR®
Ultra-high
molecular
weight polyethylene (UHMW-PE) |
++++
|
--
|
++
|
+
|
--
|
--
|
|
|
Fortron®
Polyphenylensulfide
(PPS)
|
++++
|
++
|
+++
|
++
|
++
|
+
|
Tech
Fibers
Connectors
Battery
Membranes
Filtration
Joint
Replacements
Auto
Appliances
Fuel
AEM
clear leader in key high performance polymers
Product
portfolio unmatched in the industry
11
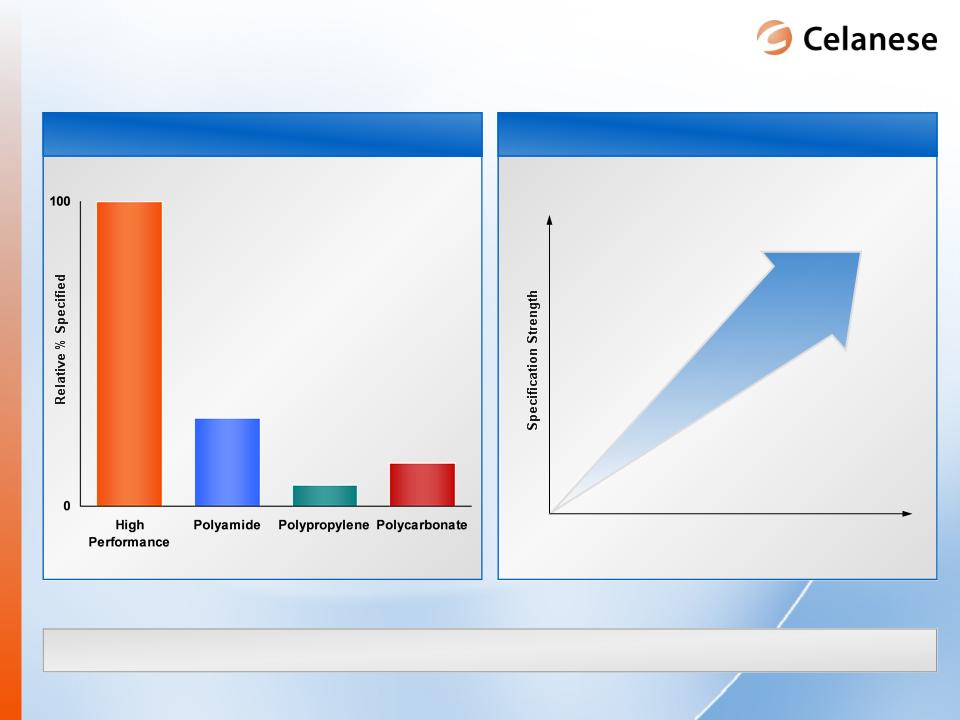
Value
of Specification
Value
Delivered
LANXESS
AEM
DuPont
SABIC/PC
BASF
DSM
Solvay
DOW
SABIC/Core
Specification
drives sustainable value for high performance polymers
Average
Specification by Material Type
Source:
Celanese internal estimates
Specification
position demonstrates strength
of the franchise
of the franchise
12
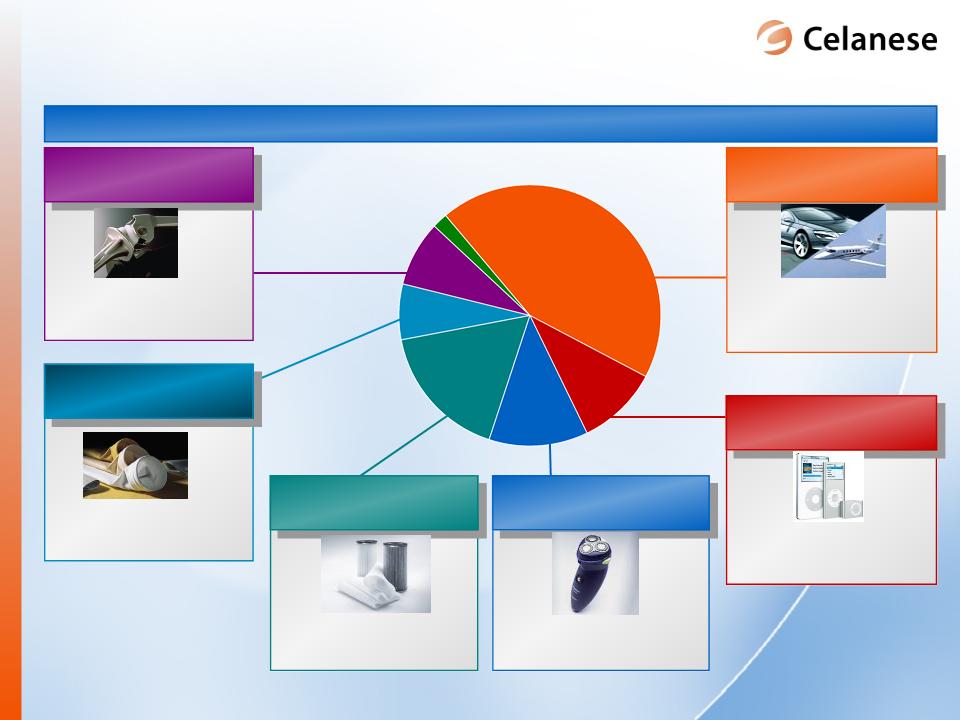
Other
2%
2008
Revenue ~ $1.1 billion
Alternate
Fabrication
7%
Transportation
44%
44%
► Fuel
systems
► Safety
systems
► Mechanical
components
Electrical
& Electronics
10%
10%
► Consumer
electronics
► LED
lighting
►
Connectors
Consumer
& Appliance
12%
12%
► Water
purification
► Durable household
goods
Industrial
17%
17%
► Fluid
handling
►
Gearing
► Drug delivery
systems
► Medical
implants
Medical
8%
8%
► Emissions
filtration
►
Textiles
Broad
range of end-use applications to
targeted value-added niches
targeted value-added niches

13
Project
Pipeline Development
► Continued
increases in new
project opportunities with
focus on:
project opportunities with
focus on:
• High-growth
end-segments
• Regional
penetration
► Pipeline
drivers continue to
be:
be:
• Regulatory
trends
• Consumer
preferences
• Geographic shift to
adopt
Western standards
Western standards
• Productivity
emphasis
Innovation
remains a key element to growth trajectory
Robust
and balanced pipeline continues to
grow with emphasis on automotive programs
grow with emphasis on automotive programs
14
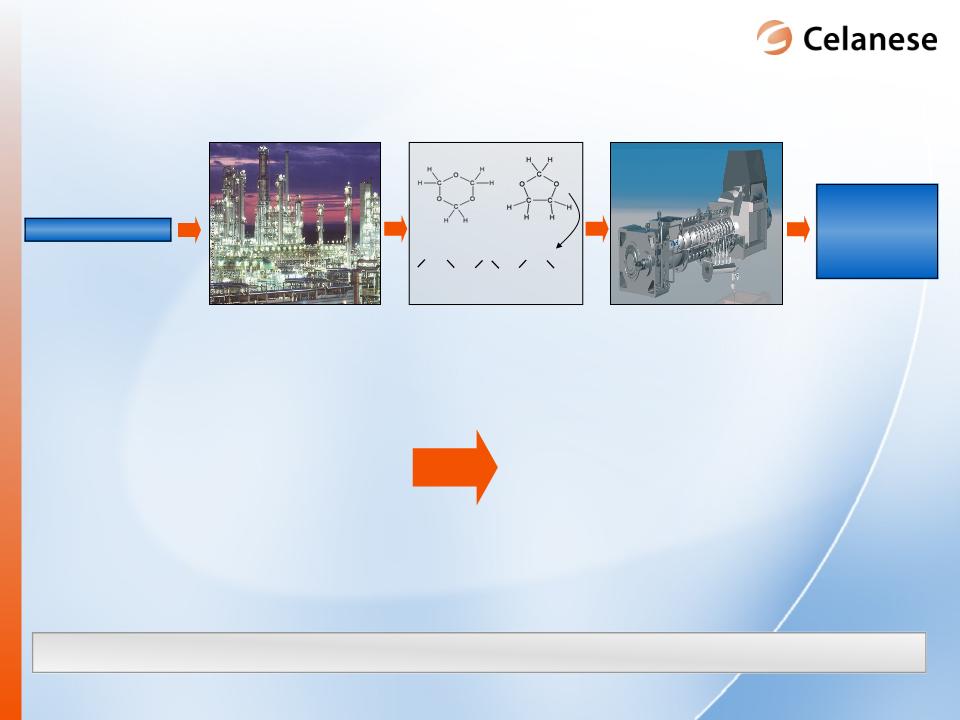
Unique
Properties:
• Inherent
lubricity
• Chemical
resistance
• Long-term fatigue
strength
Primary
Applications:
• Automotive fuel
systems
• Consumer
appliances
• Medical delivery
devices
• Fluid
handling
Estimated
global POM market size is ~$2 Billion*
* At 90%
industrial utilization rate
Methanol
POM
Monomer
Formation
Polymer
Production
Polymer
Reaction
+
R
CH2
CH2
O
CH2
CH2
O
CH3
Source:
Celanese internal estimates
Polyacetal
(POM) - key engineered polymer
provides technology platform for continued
growth
provides technology platform for continued
growth
15
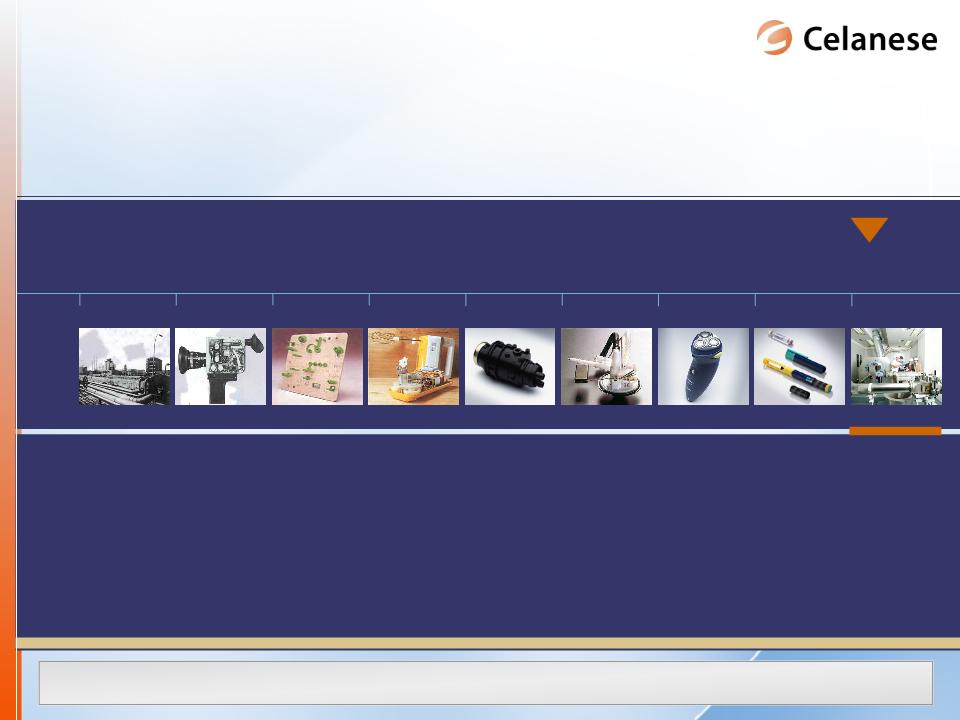
48
years of innovative development
1961
1968
1976
1982
1993
1997
1999
2001
2005
Over
48 years of Hostaform® POM production
- innovation through product and application
development
- innovation through product and application
development
2005
Technology
breakthrough drives further innovation…

16
► Filed
more than 100 patents for intellectual property protection
Reactive
end
groups
groups
R
OCH3
CH2
O
CH2
Standard POM
Chain
Non-reactive
end group
end group
R
CH2
O
CH2
R
Significant
innovation in POM chemistry
Breakthrough
in reactive end group formation
IM POM
Chain
Methanol
Monomer
Formation
Polymer
Production
Polymer
Reaction
+
R
CH2
CH2
O
CH2
CH2
O
CH3
Impact
Modified
POM
Innovative
backbone modification results in
breakthrough new POM product
breakthrough new POM product
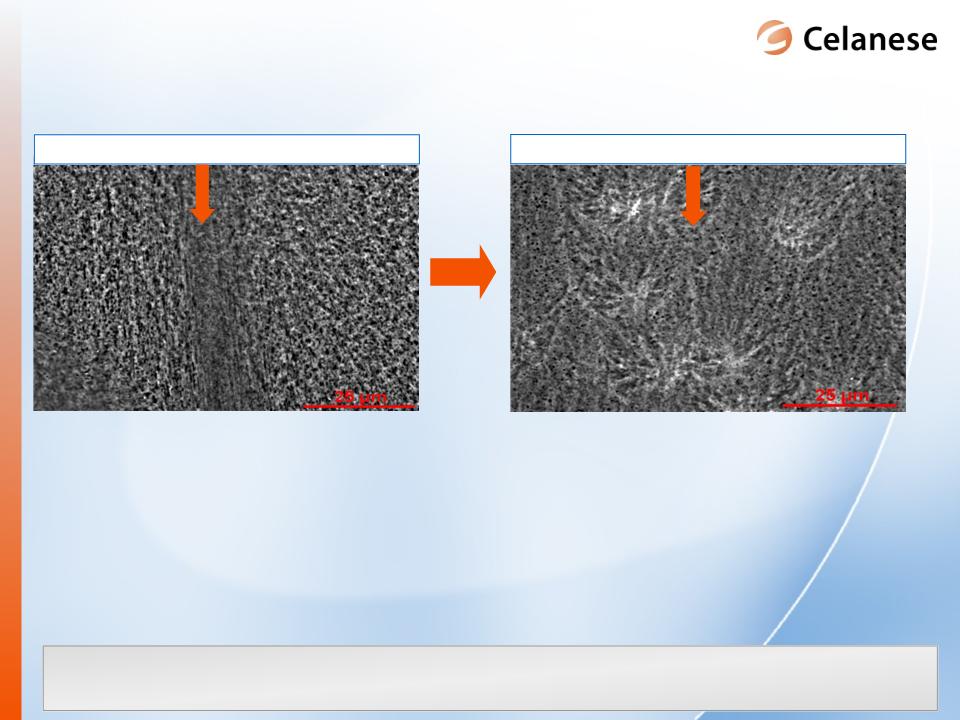
17
► Improved
impact strength by 75%
► Best
in class weldline performance by
300%
300%
► Higher
stiffness (modulus) - Up to 25%
► Reduce
cooling times for molded parts
by 30%
by 30%
► Elevated
heat deflection temperature
Conventional Impact
Modified POM
Visible
weld
line
line
NEW
Impact Modified POM
No
weld line
Significant
improvement in polymer performance in end applications
and part manufacturability
and part manufacturability
Innovative
technology drives improved impact
performance & weld line strength
performance & weld line strength
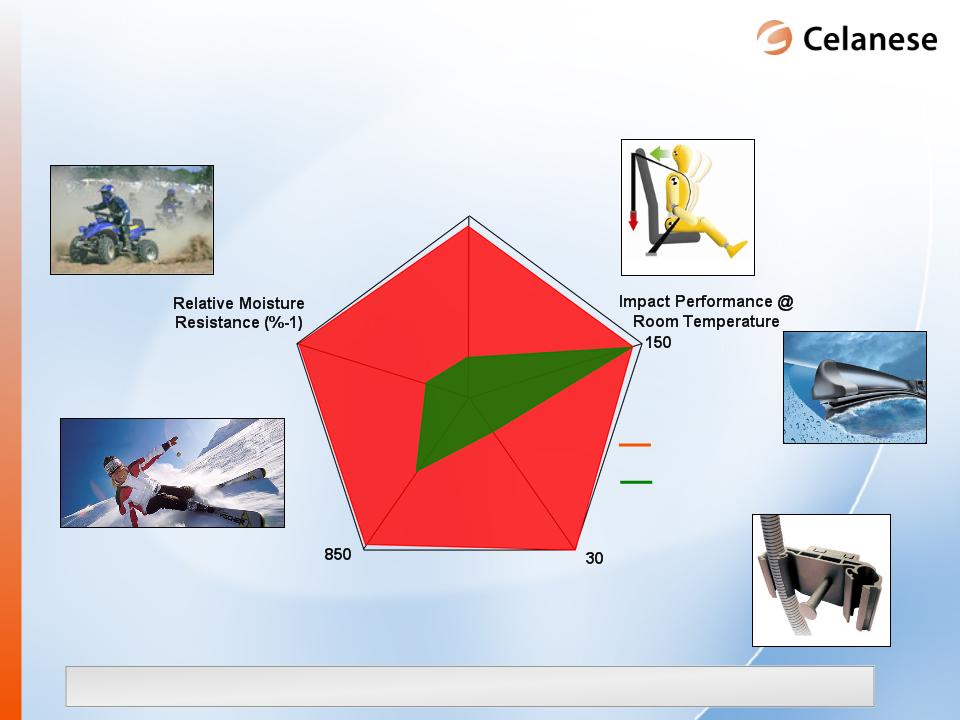
18
NEW
POM
IM
Nylon
Stiffness
(Mpa)
Elongation
@
Break (%)
Break (%)
330
Impact
Performance
@ Cold
Temperature
@ Cold
Temperature
4
Versatility
and reliability to meet all the requirements
New
POM product family offers design
freedoms and access to new growth
opportunities
freedoms and access to new growth
opportunities
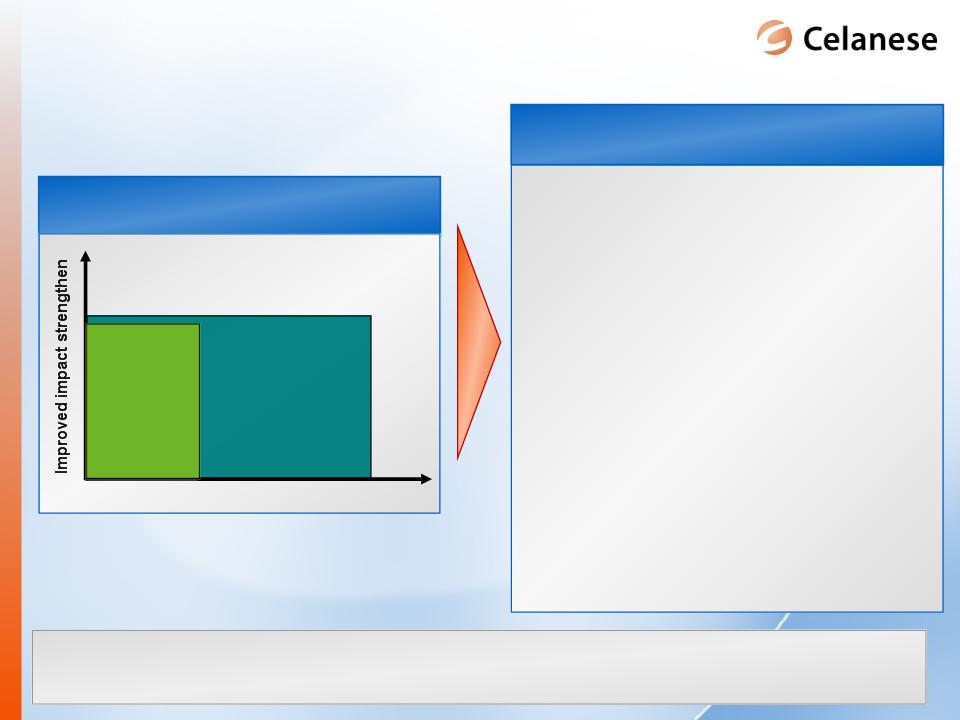
19
Improvement
in POM Technical
Performance
Performance
New
Ticona
POM Space
POM Space
Existing
POM
Space
Increase
weldline strain @ break %
Technology
enables additional estimated
$500
million application
space opportunity
space opportunity
Automotive
Applications
► Chemical
resistance
► Superior impact
& weldline strength
► Elevated heat
deflection temperature
Industrial
Applications
► Higher stiffness
(Modulus)
► Improved slip &
wear performance
► Less mold
deposit
Consumer
Applications
► Design
freedom
► Superior impact and
weldline strength
Incremental
$500 Million
Application Opportunity
Application Opportunity
Ticona:
Growing application space through
innovation
innovation

20
|
|
Global
Automotive Trends
|
|||||
|
|
Regulatory
|
Consumer
|
Manufacturing
|
|||
|
|
Emissions
|
Fuel
Efficiency |
Adoption
of
Western Standards |
“Green”
Initiatives |
Global
Platforms |
Productivity
|
|
North
America |
ü
|
ü
|
|
ü
|
ü
|
ü
|
|
Europe
|
ü
|
ü
|
|
ü
|
ü
|
ü
|
|
Asia
|
ü
|
|
ü
|
ü
|
|
ü
|
Indifferent
to producer, model or manufacturing location…
AEM delivers solutions globally
AEM delivers solutions globally
Changing
automotive environment favors
high performance plastics
high performance plastics
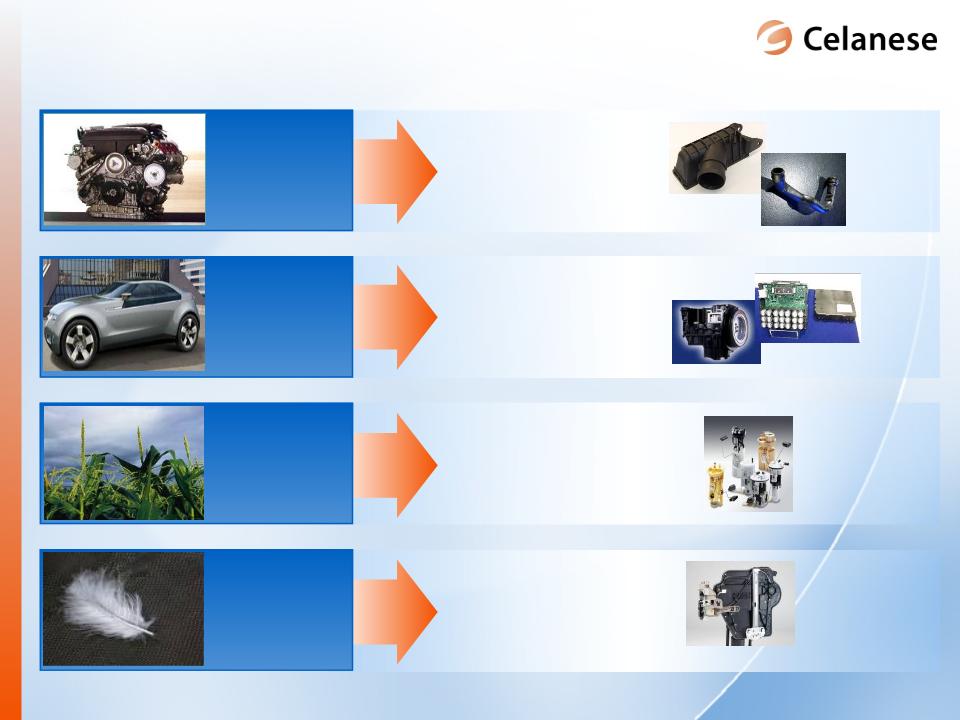
21
Efficient
engines
engines
Hybrid-
engine
systems
engine
systems
Alternative
fuels
fuels
Metal
replacement
replacement
ü
Ticona
high
temperature polymers
for turbo-charged
engines
temperature polymers
for turbo-charged
engines
Ticona
polymers in
hybrid vehicle
systems
hybrid vehicle
systems
New
Hostaform®
POM
products meet more
aggressive conditions in
fuel delivery systems
products meet more
aggressive conditions in
fuel delivery systems
Ticona
portfolio for
components in door
module
components in door
module
ü
ü
ü
Ticona
is well-positioned to capitalize
on growth opportunities
on growth opportunities
22
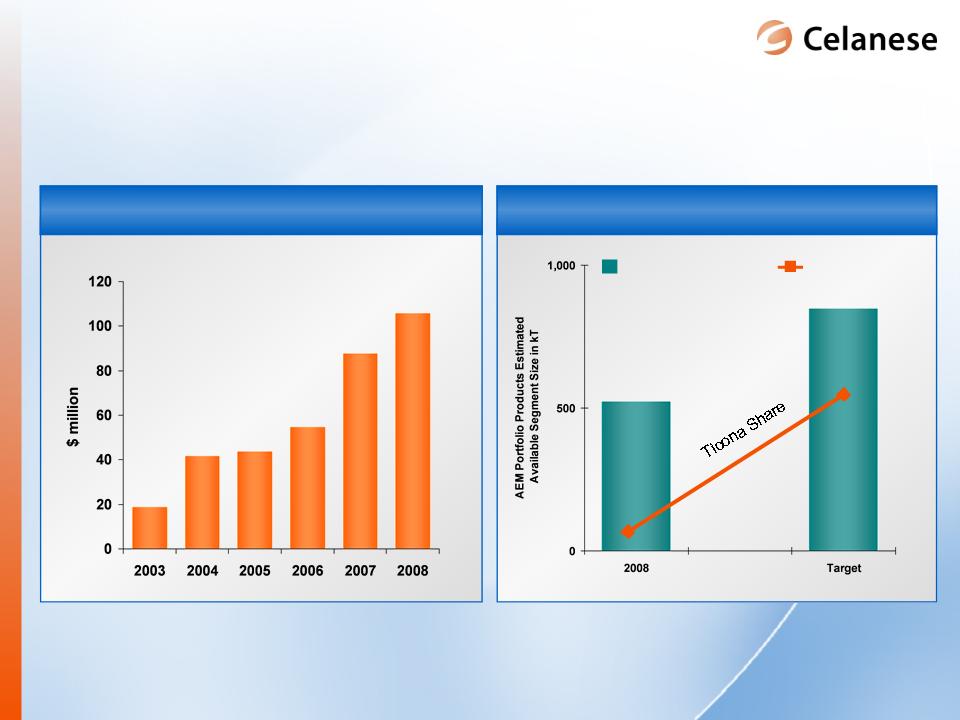
Asia
Sales for Ticona Global Portfolio
Ticona
Key Products - Asia Trajectory
Asia
segment size (est.)
CE
share (est.)
Source:
Form 10-K, Celanese internal estimates
We
are making progress in Asia… and the
platform is in place to capture growth
platform is in place to capture growth
23
Automotive
Opportunity
► Current
“best-in-class”
translation to all models
yields translation
opportunity
translation to all models
yields translation
opportunity
► Westernization
of current
China production drives
China opportunity
China production drives
China opportunity
► Successful
commercialization of
application R&D creates
pipeline opportunity
commercialization of
application R&D creates
pipeline opportunity
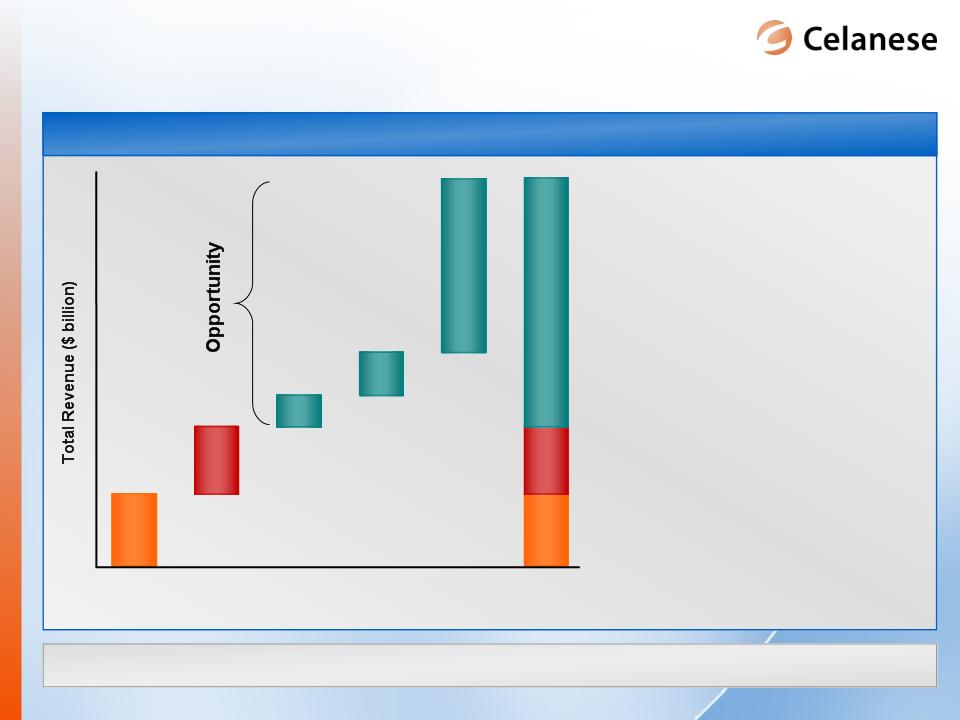
3.0
Total
AEM
Today
Total
Competitors
Today
Translation
China
Pipeline
Total
Opportunity
Opportunity
Significant
opportunities exist in ~$3 billion industry space
AEM: Application
development creates
current - and future - opportunities
current - and future - opportunities

24
kT
kT
Source:
Celanese internal estimates
Well-positioned
for growth in China with the right partner
China
ROW
Chinese
Imports
Chinese
Domestic
Production
Production
Worldwide
Tow Demand
Tow
Demand Growth
Acetate
Tow demand in China will drive
worldwide growth
worldwide growth
25
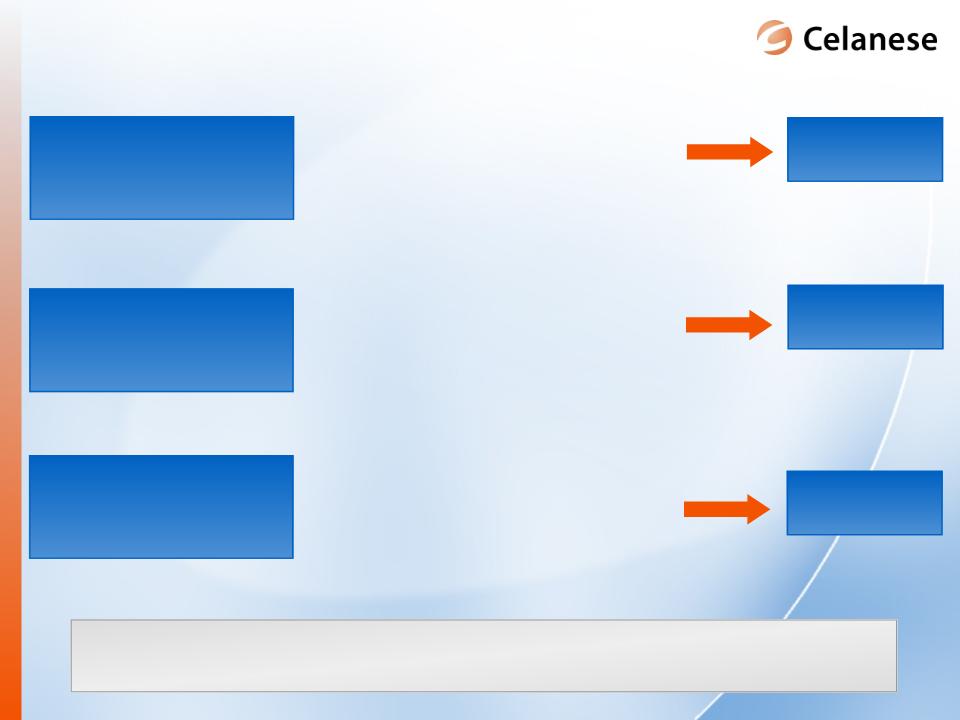
Productivity
Driven
Tax
Rate
Represents
approximately $1.00 per share in
2010
earnings improvement
2010
Earnings Improvement
► AEM: Destocking
complete
► CS: Sustain
performance
► AI: Technology,
2009 FIFO effect
► IS: Asia
growth focus
► Pardies &
Cangrejera closures
► Other manufacturing
realignment
► SG&A
realignment
► Sustain lower tax
rate
► Benefits of
manufacturing and
administrative
restructuring
► Cash taxes rate
expected
to be
similar
Volume
Driven
$80
- $100
At
least $100
Low
20% range
vs. 29%
vs. 29%
$
in millions

26
Why
Celanese? Why
Celanese Now?
Significant
value upside over current share price
Geographic
Demand
Capital
Structure
Operating
Innovation
Track
record
of execution
of execution
High
return
opportunities
opportunities
► $1.6-1.8 billion
recovery
earnings
earnings
► Rapid earnings
growth of
the current base -
$1.00/share growth in
2010
the current base -
$1.00/share growth in
2010
► Over $2 billion of
cash
generation through 2014
generation through 2014
► Returns continue
to
exceed weighted
average cost of capital
exceed weighted
average cost of capital
► More stable
earnings
profile
profile
Levers
of Value Shareholder
Value

Celanese
Corporation
December
2009
28
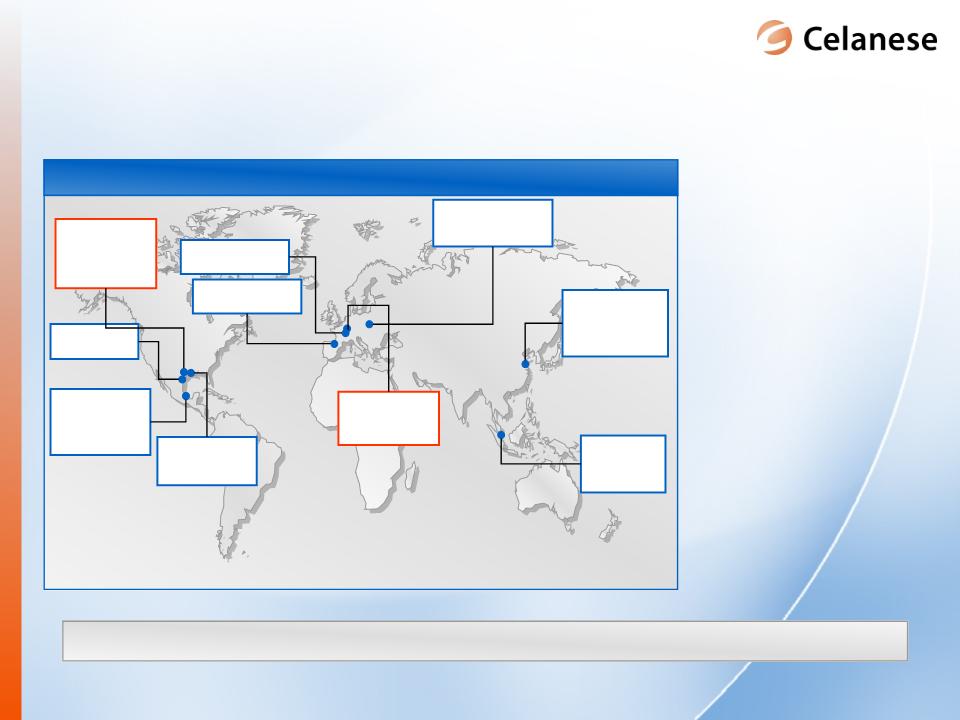
Celanese
Global Manufacturing Locations
All
values shown in kT per year
Singapore
Acid =
600
VAM =
210
Esters =
130
Frankfurt,
Germany
VAM =
285
Esters =
40
Tarragona,
Spain
VAM =
200
Bay
City, TX
VAM =
300
Clear
Lake, TX
Acid =
1,200
VAM = 310
Cangrejera,
Mexico
Mexico
Anhydride = 90
Esters =
105
VAM =
115
Pardies,
France
(announced
closure)
Acid =
440
VAM =
150
Nanjing,
China
Acid =
1,200
(expansion)
VAM = 300
(expansion)
VAM = 300
Anhydride =
100
► Utilization of
all
global Celanese
acetic acid and
downstream sites to
meet global customer
needs
global Celanese
acetic acid and
downstream sites to
meet global customer
needs
► Ensure all
Celanese
sites have a leading
cost structure
sites have a leading
cost structure
► Strategy to
remove
high cost facilities
high cost facilities
Roussillon,
France
Anhydride =
30
Celanese
well-positioned globally to meet changing
demand landscape
Pampa,
TX
(site
closed)
Acid =
290
Anhydride =
145
Esters =
60
Leading
global footprint positioned to meet
customer demand
customer demand
29
|
Company
|
Capacity
|
2007
|
2008
|
2009
|
2010
|
2011
|
|
BP
/ Sinopec
|
550
kt
|
|
|
|
|
|
|
Sipchem
|
430
kt
|
|
|
|
|
|
|
Sopo
(expansion)
|
600
kt
|
|
|
|
||
|
Wujing
(expansion)
|
500
kt
|
|
|
|
|
|
|
Yangkuang
Cathay
|
350
kt
|
|
|
|
|
|
|
Henan
Shunda
|
200
kt
|
|
|
|
|
HC
|
|
Tianjin
Bohei
|
200
kt
|
|
|
|
HC
|
|
|
Hualu
Hensheng
|
200
kt
|
|
|
|
|
HC
|
|
Henan
Yima
|
200
kt
|
|
|
|
||
|
Yunan
Yunwei
|
200
kt
|
|
|
|
|
|
|
Kingboard
|
400
kt
|
|
|
|
|
|
A
A
A
A
A
A
A
A
X
X
X
X
X
X
X
X
X
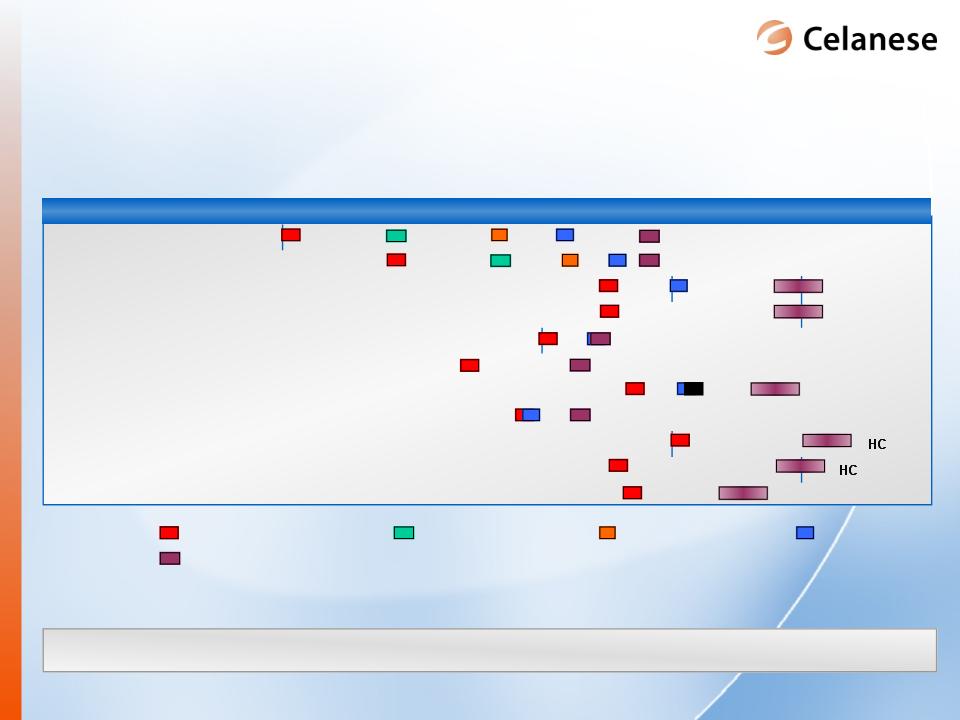
Company
Announced Startup
Current
Update
A
CE 2005
Update
SU
=
Actual plant startup
X
CE 2006
Update
HC
= Highest Cost
X
CE 2007
Update
X
X
X
X
X
X
X
SU
X
SU
Viability
of many higher cost projects is in question
1Celanese internal analysis
and opinion
?
A
SU
X
A
A
?
Timing
in question
Timing
in question
Forecast
Capacity Expansions1
Delays
in project startups likely to continue
30
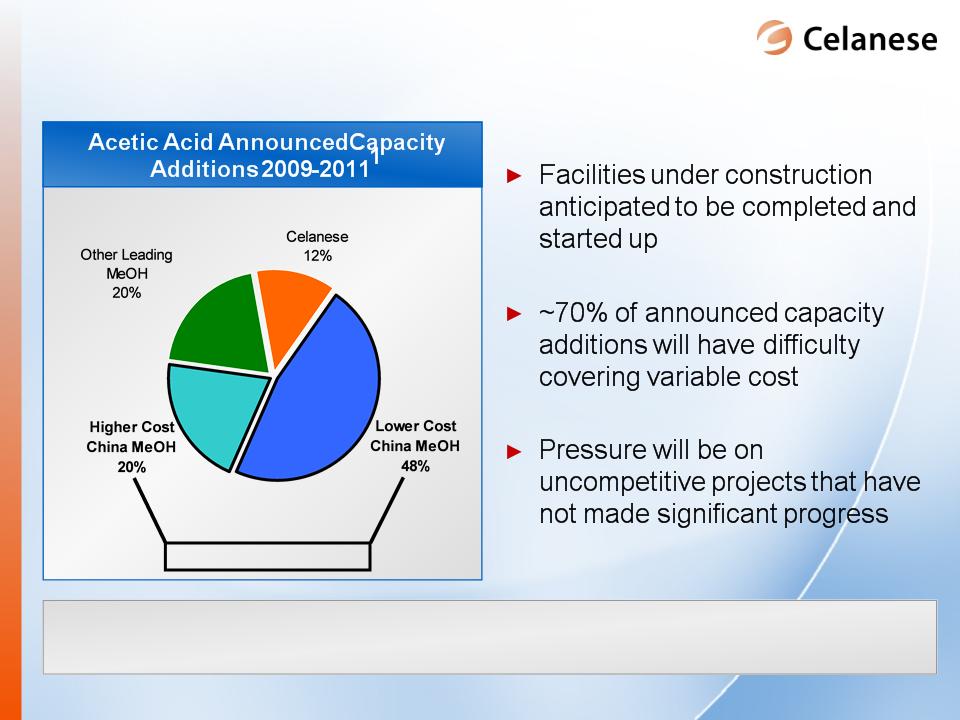
► Majority of
planned
capacity additions and
expansions may be
disadvantaged
capacity additions and
expansions may be
disadvantaged
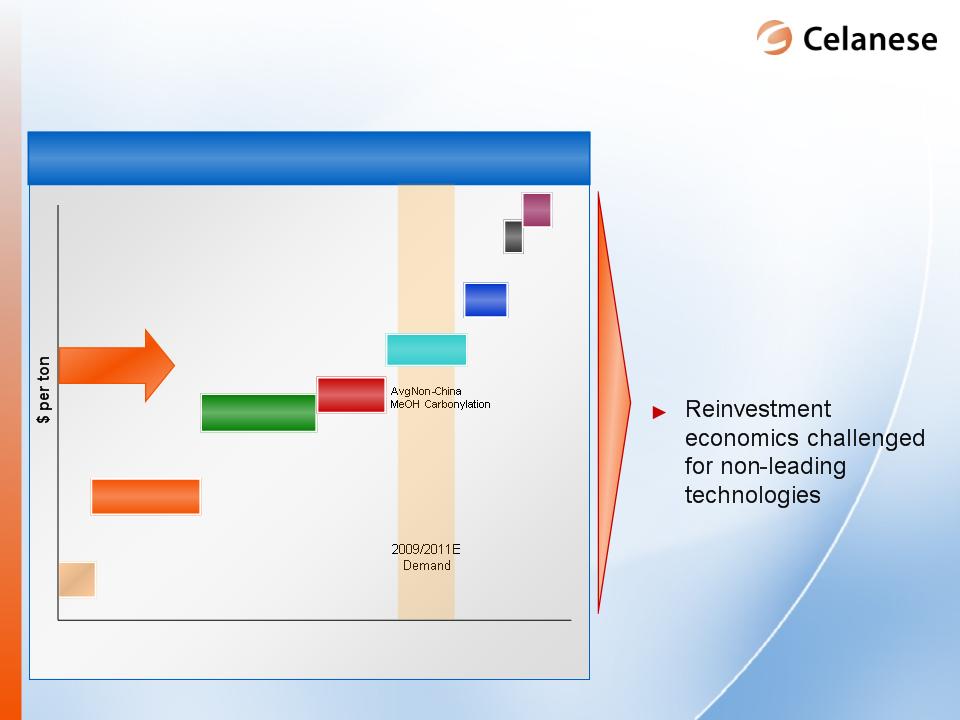
2009/2011E
Acetic Acid Cost Curve (kT)
By
Prod
Avg
Other Leading
Technology
Effective
Industry Utilization Rates
Ethylene
Highest
Cost
China MeOH
China MeOH
Ethanol
Average
Celanese
Lower
Cost
China MeOH
China MeOH
Source:
Celanese internal estimates
Pricing
for CE to
earn
>15% EBITDA
AI: New
capacity not expected to impact
Celanese’s advantaged position
on the cost curve
Celanese’s advantaged position
on the cost curve
31
0%
5%
10%
15%
20%
25%
30%
35%
40%
45%
50%
Return
on Invested Capital
Source:
Celanese internal estimates; available public data
AI: Celanese
is able to achieve >15% ROIC
when others are not able to profitably reinvest
when others are not able to profitably reinvest
Recent
Peak Pricing $600-700
Current
Pricing $350-400
Return
on Invested Capital vs. Acetic Acid Margin
32
Majority
of announced capacity additions challenged in today’s
pricing environment
pricing environment
1Source: Celanese internal
estimates, Tecnon 2008. Based on
nameplate capacity
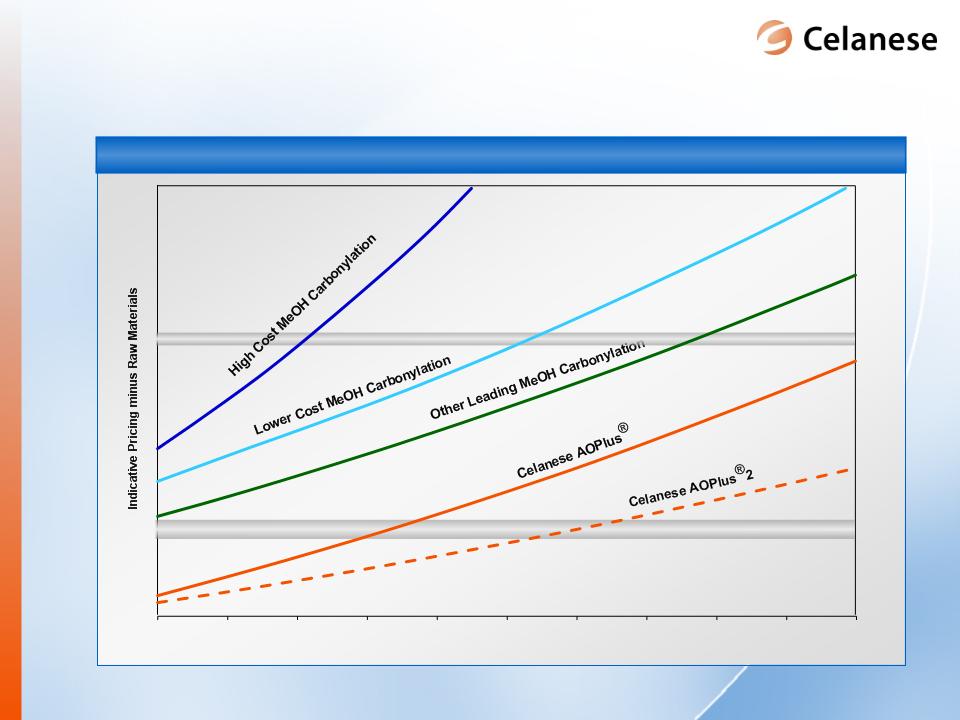
Disadvantaged
technology
Significant
differentiation in technology of
announced expansions
announced expansions

33
|
Available
Cash
|
|
|
Cash
(as
of 9/30/2009)
|
$1,293
|
|
Kelsterbach
Spending
|
~($300)
|
|
Operating
Cash
|
~($300)
|
|
Cash
Available for
Strategic Purposes |
~$700
|
► Ticona
Kelsterbach relocation
cash flow neutral through end of
2010
cash flow neutral through end of
2010
► Expect
to continue to generate
positive free cash flow
positive free cash flow
Significant
cash available after anticipated cash commitments
$
million
Positive
cash generation and portfolio
improvements enhance our cash position
improvements enhance our cash position
34
Balance
for “high return” productivity and capital efficient growth
Note:
Not including Kelsterbach plant relocation
Maintain
Plant
Other
Growth
Nanjing
Productivity
Capital
Spending by Category
Efficient
use of cash
35
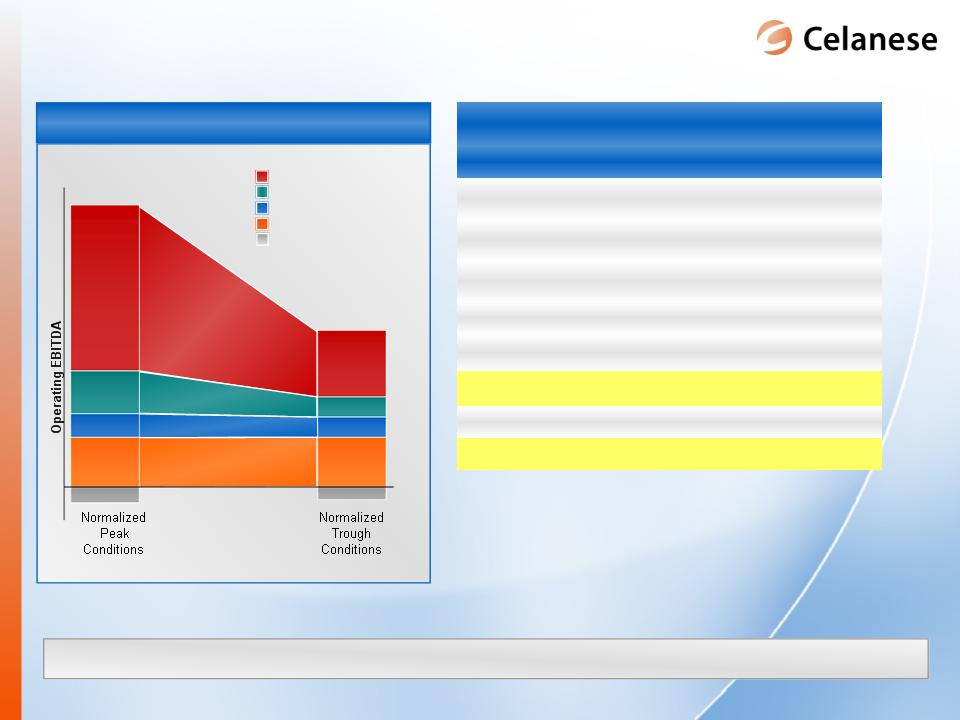
*Starting from an Operating
EBITDA base
Positive
cash generation even in normalized trough
Normalized
Trough
18
- 20%
18
- 20%
8
- 10%
8
- 10%
22
- 25%
22
- 25%
18
- 20%
18
- 20%
21
- 23%
21
- 23%
10
- 12%
10
- 12%
13
- 15%
13
- 15%
20
- 22%
20
- 22%
Industrial
Specialties
Acetyl
Intermediates
Advanced
Engineered Materials
Consumer
Specialties
Other
Activities
$800-1,000
million
million
|
2009E
Cash Flow Guidance
|
|
|
$
in
millions
|
2009E2
|
|
Cash
Taxes
|
$40
- $50
|
|
Capital
Expenditures
|
$165
- $175
|
|
Reserve/Other
|
$80
- $90
|
|
Net
Interest
|
$200
- $210
|
|
Pension
|
$40
- $50
|
|
Adjusted
Free Cash Outflows
|
$525
- $575
|
|
Dividends /
Debt Service
|
$75
- $100
|
|
Total
Cash Outflows
|
$600
- $675
|
Hybrid
portfolio well positioned in peak or
trough conditions
trough conditions
36
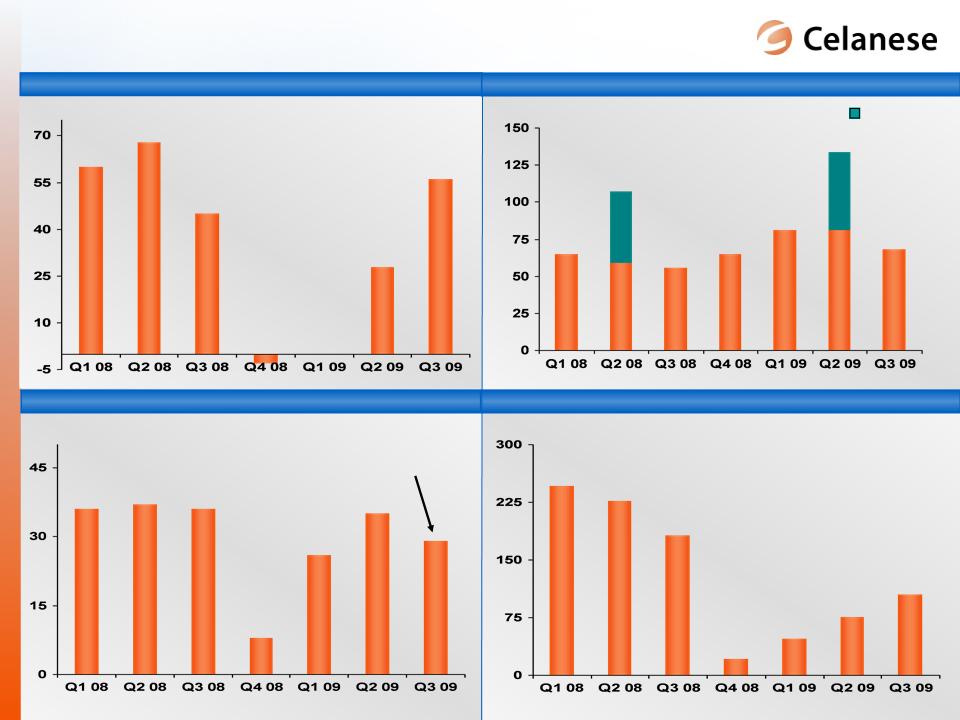
Acetyl
Intermediates
Industrial
Specialties
Advanced
Engineered Materials
Consumer
Specialties
JVs
Dividends
PVOH
Divesture
3Q
2009
Segment
Operating EBITDA Recovery
37
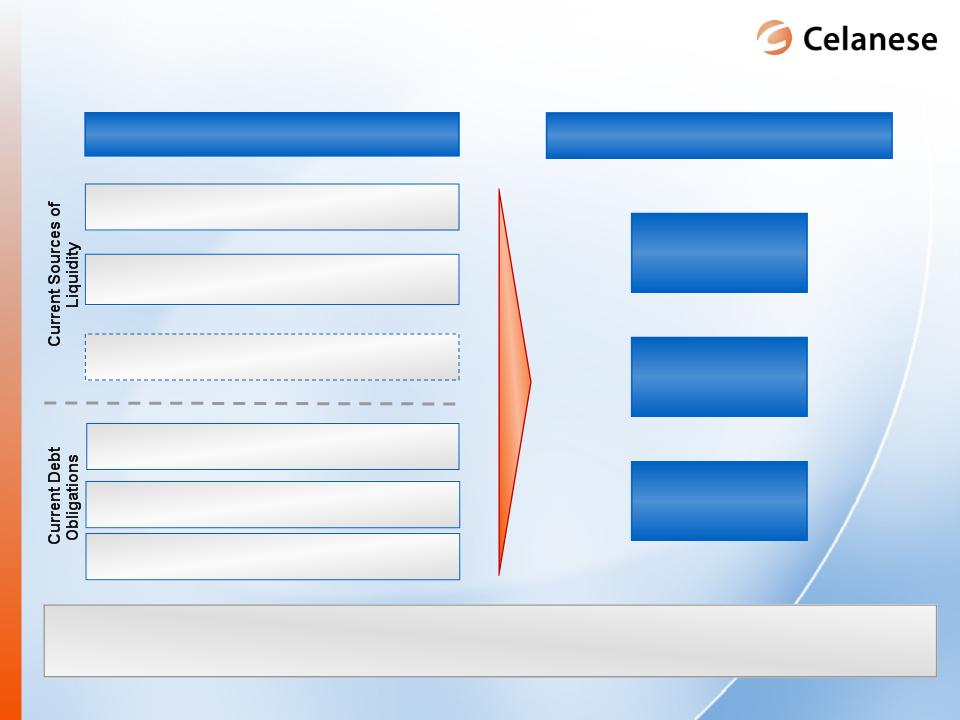
Term
Loan - $2.8 billion
Other
Debt Obligations - $775 million
Cash
- $1.3 billion
Net
Debt - $2.3 billion
Revolver
- $600 million
Cost
Stability
Flexibility
Structure
Characteristics
Primary
Components
Solid
liquidity position and covenant-lite term loan create
advantaged capital structure
advantaged capital structure
Credit
Linked Facility - $136 million
Celanese
capital structure
38
39
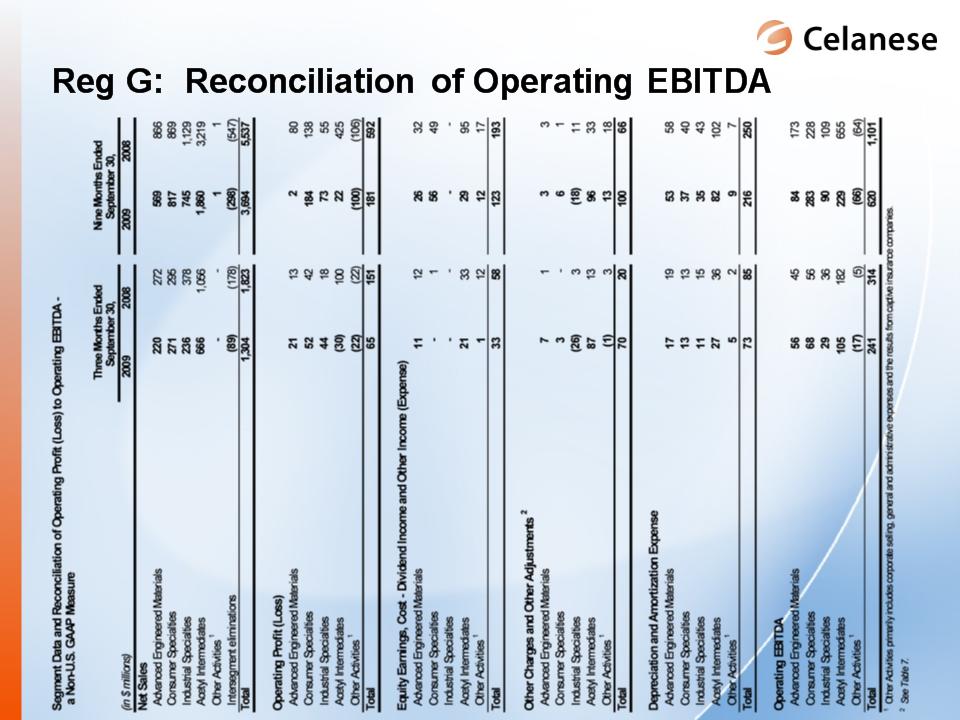
Reg
G: Reconciliation
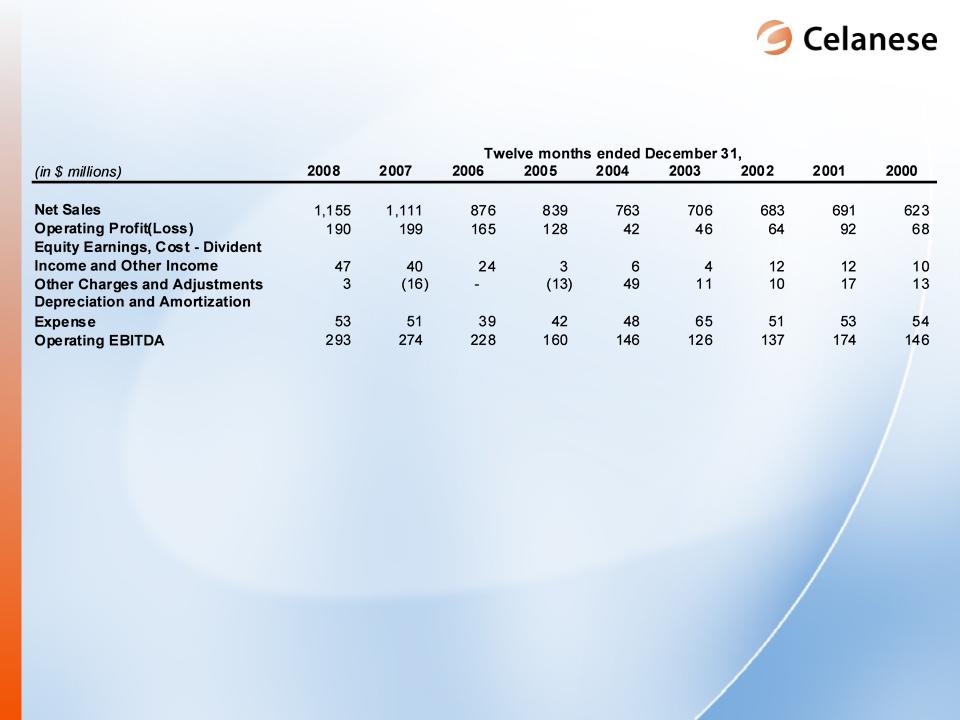
of Consumer
Specialties Operating EBITDA: 2000-2008
Specialties Operating EBITDA: 2000-2008

40
Reg
G: Reconciliation
of Celanese Operating
EBITDA: 2001
EBITDA: 2001