Attached files
| file | filename |
|---|---|
| 8-K - FORM 8-K - NTELOS HOLDINGS CORP. | d8k.htm |
 Investor Presentation 3rd Quarter 2009 Update Exhibit 99.1 |
 1 Use of Non-GAAP Financial Measures Included in this presentation are certain non-GAAP financial measures that are not determined in accordance with US generally accepted accounting principles. These financial performance measures are not indicative of cash provided or used by operating activities and exclude the effects of certain operating, capital and financing costs and may differ from comparable information provided by other companies, and they should not be considered in isolation, as an alternative to, or more meaningful than measures of financial performance determined in accordance with US generally accepted accounting principles. These financial performance measures are commonly used in the industry and are presented because NTELOS believes they provide relevant and useful information to investors. NTELOS utilizes these financial performance measures to assess its ability to meet future capital expenditure and working capital requirements, to incur indebtedness if necessary, and to fund continued growth. NTELOS also uses these financial performance measures to evaluate the performance of its business, for budget planning purposes and as factors in its employee compensation programs. |
 2 Special Note Regarding Forward-Looking Statements Any statements contained in this presentation that are not statements of historical fact, including statements about our beliefs and expectations, are forward-looking statements and should be evaluated as such. The words "anticipates," "believes," "expects," "intends," "plans,"
"estimates," "targets," "projects," "should,"
"may," "will" and similar words and expressions are intended to identify
forward-looking statements. Such forward-looking statements reflect, among other
things, our current expectations, plans and strategies, and anticipated financial
results, all of which are subject to known and unknown risks, uncertainties and factors
that may cause our actual results to differ materially from those expressed or implied
by these forward-looking statements. Many of these risks are beyond our ability to
control or predict. Because of these risks, uncertainties and assumptions, you should
not place undue reliance on these forward-looking statements. Furthermore,
forward- looking statements speak only as of the date they are made. We do not
undertake any obligation to update or review any forward-looking information, whether as a result of new information, future events or otherwise. Important factors with respect to any such forward-looking statements, including certain risks and uncertainties that could cause actual results to differ from those contained in the forward-looking statements, include, but are not limited to: rapid development and intense competition in the telecommunications industry; adverse economic conditions; operating and financial restrictions imposed by our senior credit facilities and other indebtedness; our cash and capital requirements;
declining prices for our services; |
 3 Special Note Regarding Forward-Looking Statements (cont.) the potential to experience a high rate of customer turnover; our dependence on our affiliation with Sprint Nextel ("Sprint"); a potential increase in our roaming
rates and wireless handset subsidy costs; the potential for Sprint to build networks in our markets; federal and state regulatory fees, requirements and developments; loss of our cell sites; the rates of penetration in the wireless telecommunications industry; our reliance on certain suppliers and vendors and the transition of our prepay billing services to a new vendor; and other unforeseen difficulties that may occur. These risks and uncertainties are not intended to represent a complete list of all risks and uncertainties inherent in our business, and should be read in conjunction with the more detailed cautionary statements and risk factors included in our SEC filings, including our Annual Reports filed on Forms 10-K. |
 Company Overview |
 5 Company Overview • Leading provider of wireless and wireline communications services in Virginia and West Virginia • Strategies • Facilities based • Retail & Wholesale • Multiple products • Leverage brand • Leverage common cost • Wireless revenue 5-year CAGR of 15% • Exclusive strategic wholesale Sprint agreement through July 2015 • Wireline business includes CLECs with double digit strategic high-speed broadband product
revenue growth and RLECs with strong Adjusted EBITDA margins • Continued revenue growth fueled by investments in cell sites, fiber network upgrades and
acquisitions and new enhanced Prepay subscriber functionality • Strong growth in Free Cash Flows |
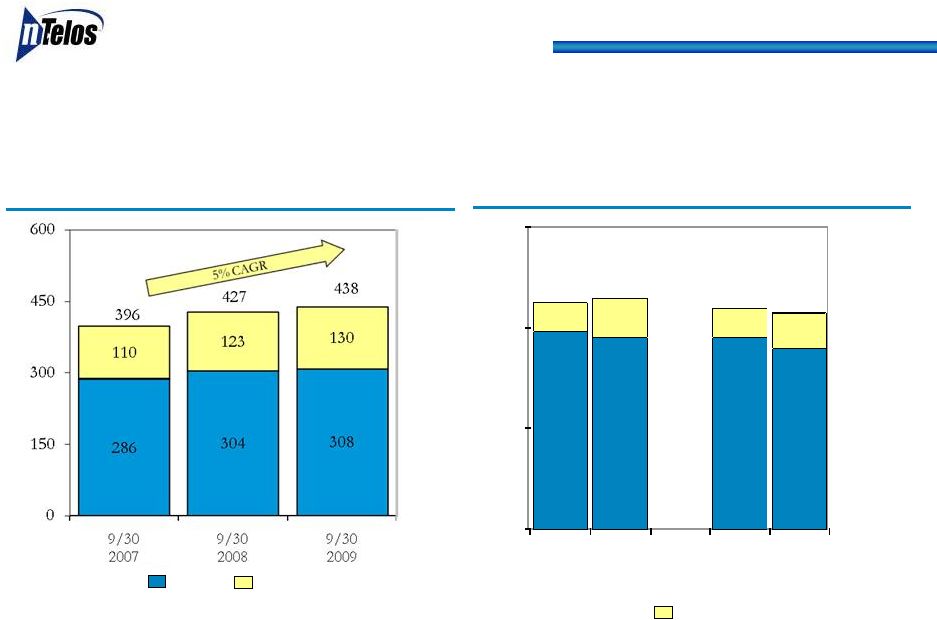
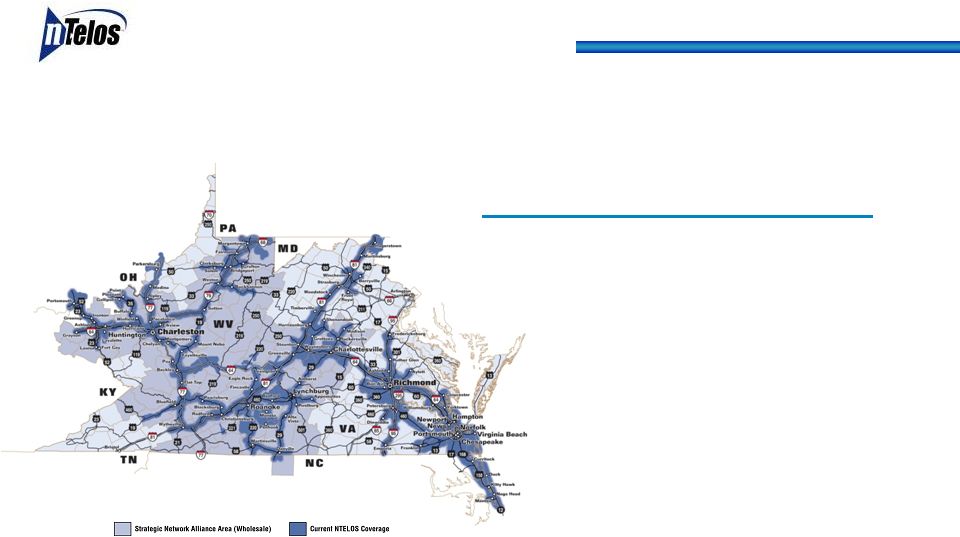 6 Regionally-Focused Service Provider ($ in millions) (1) As of September 30, 2009 or for the twelve months ended September 30, 2009 (2) Throughout this presentation, year over year (YOY) comparisons are calculated using the twelve month periods ending on September 30, 2008 and September 30, 2009 (3) Refer to Form 10-Q for the period ended September 30, 2009 for explanation and impact of change from gross to net reporting of handset insurance revenues and costs effective April 1, 2008 • Average of 23.0 MHz of spectrum • 5.5 million covered POPs • 438K (1) retail subscribers (YoY increase of 3%) • 7% YoY Revenue growth (3) • Retail revenues increased 2% YoY to $308 million • Data ARPU growth driven by EV-DO upgrade and expanded prepay data offerings • Wholesale revenues (primarily Sprint Nextel agreement) increased 19% YoY to $120 million • 5% YoY Adjusted EBITDA growth • 39% YTD Adjusted EBITDA margin Wireless ($428 Revenue / $164 Adj. EBITDA) (1) (2) |
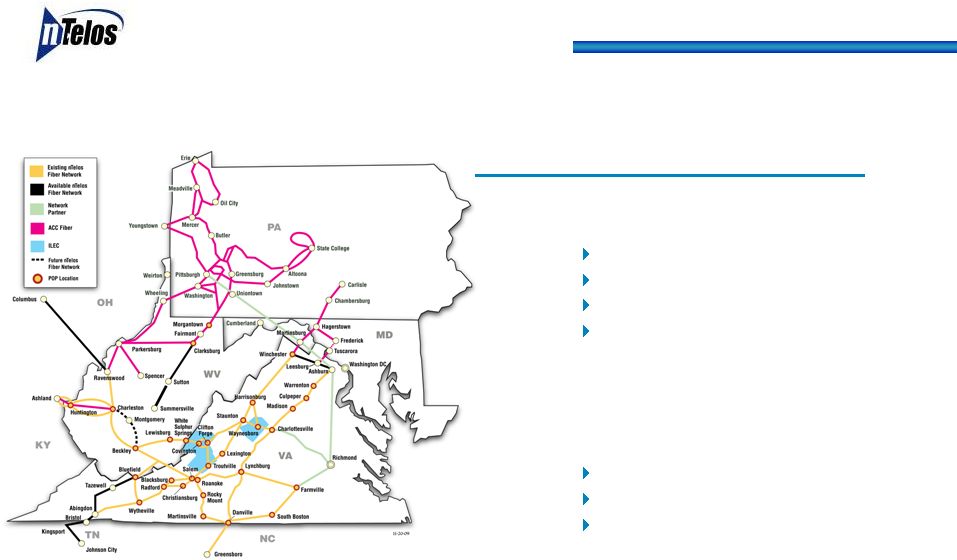 7 Wireline: Repositioning as High Speed Data Provider (1) ($ in millions) (1) Assumes closing on acquisition of assets from Allegheny Energy, Inc. on or about year-end; closing remains subject to regulatory approval and customary closing terms and conditions; see press release dated October 6, 2009 available on the Company’s website (2) As of September 30, 2009 or for the twelve months ended September 30, 2009 (3) Throughout this presentation, year over year (YOY) comparisons are calculated using the last twelve month periods ending on September 30, 2008 and September 30, 2009 • Competitive Segment • Commercial or Institutional Healthcare Government Education Regional Banking • 15% YoY growth in strategic broadband and video services • 42% YTD Adjusted EBITDA margin • Acquisition of 2,200 fiber route mile assets of Allegheny Energy, Inc. with nearly double the network (1) 25 new markets 50% more colleges and universities 25% larger population than existing markets • RLEC - Growth in Data and Video • 98% DSL coverage with 6 MB speed • 20% IPTV penetration of homes passed with fiber; 32% penetration of homes passed in vintage neighborhoods Wireline ($125 Revenue / $71 Adj. EBITDA) (2) (3) |
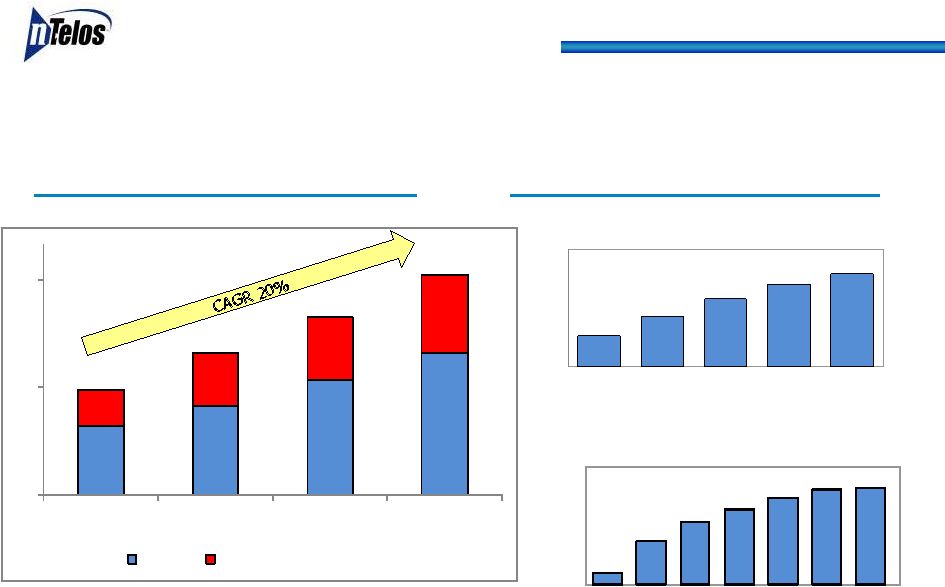
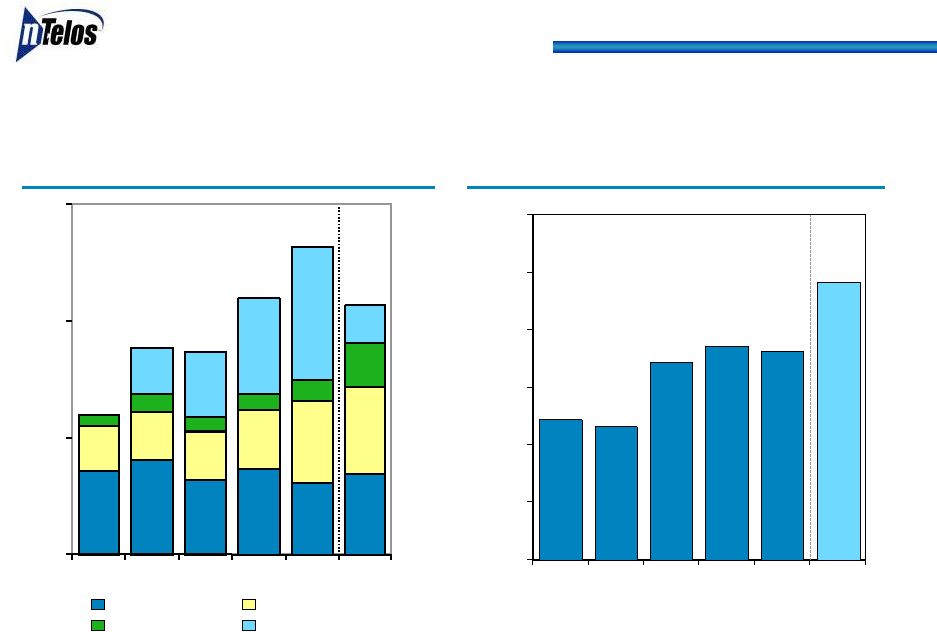
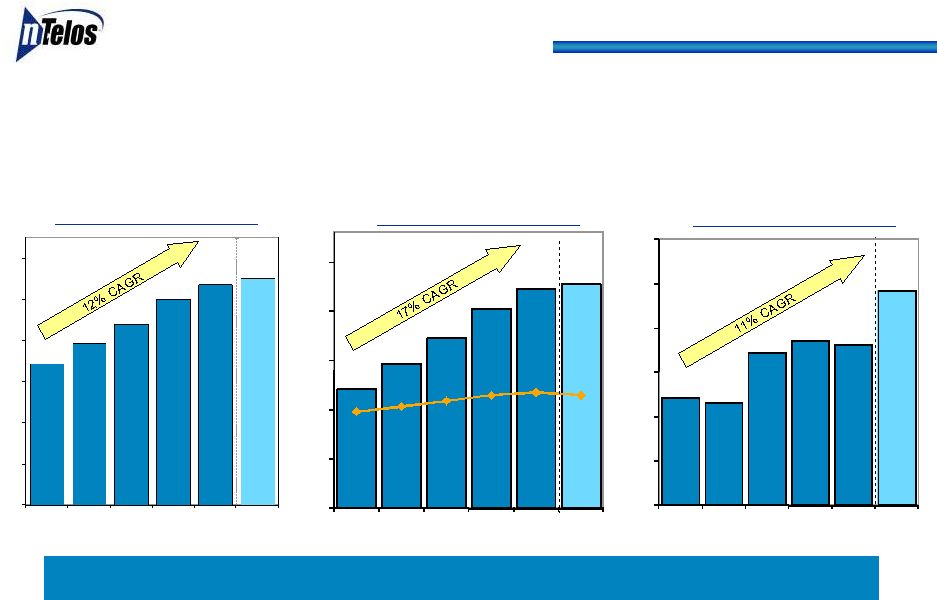 $343 $392 $440 $500 $536 $551 0 100 200 300 400 500 $600 2004 2005 2006 2007 2008 2009G 8 Focused on Growth Opportunities ($ in millions) Total Revenue Total Adj. EBITDA/ Margin % Strong financial performance (2) (1) Throughout this presentation, Free Cash Flow is defined as Consolidated Adjusted EBITDA less CAPEX
(2) Based on Midpoint of guidance range of $549 million to $553 million (3) Based on Midpoint of guidance range of $227 million to $230 million (4) Based on Midpoint of guidance range of Adjusted EBITDA and CAPEX range of $107 million to $108 million Note: Throughout this presentation, Compound Annual Growth Rates (CAGR) presented are calculated over the period of 2004 to 2008. Free Cash Flow (1) (3) (4) $121 $147 $172 $203 $223 $228 35% 37% 39% 41 % 42 % 41 % 0 50 100 150 200 $250 2004 2005 2006 2007 2008 2009G $61 $58 $86 $93 $91 $121 0 25 50 75 100 125 $150 2004 2005 2006 2007 2008 2009G |
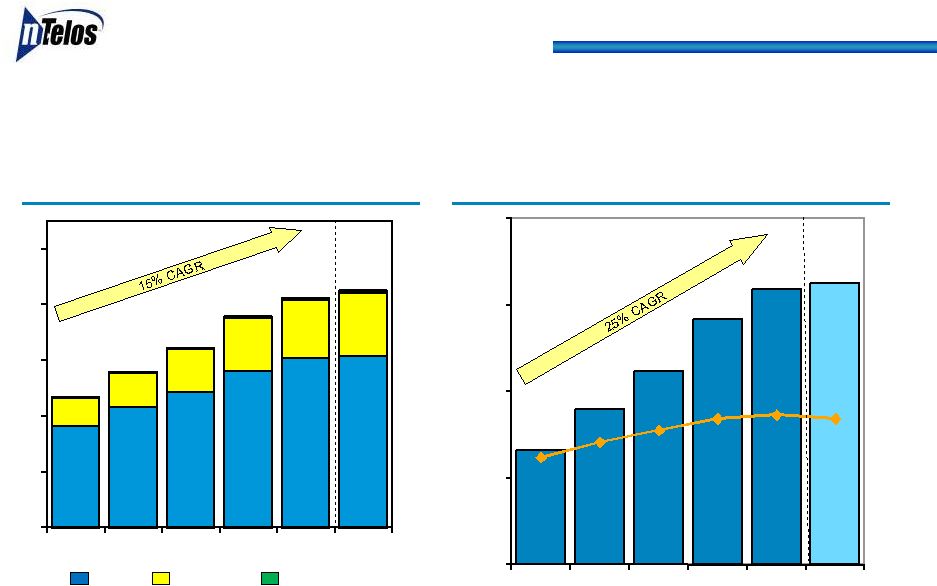 $66 $90 $112 $142 $159 $163 28% 32% 35% 38% 39% 38% 0 50 100 150 $200 2004 2005 2006 2007 2008 2009G 9 (2) Revenue (1) Network Upgrade and Data Drives Wireless Growth ($ in millions) Adjusted EBITDA/Margin % (3) (1) Refer to Form 10-Q for the period ended September 30, 2009 for explanation and impact of change
from gross to net reporting of handset insurance revenues and costs effective April 1,
2008 (2) Based on Midpoint of guidance range of $425 million to $427 million for total wireless revenue and
$116 million to $118 million for combined wholesale and roaming revenues (3) Based on Midpoint of guidance range of $162 million to $164 million Retail Wholesale Roaming $183 $217 $244 $282 $305 $309 $51 $62 $77 $95 $104 $113 $3 $ 235 0 100 200 300 400 $500 2004 2005 2006 2007 2008 2009G $426 $235 $280 $322 $412 $378 $ 4 |
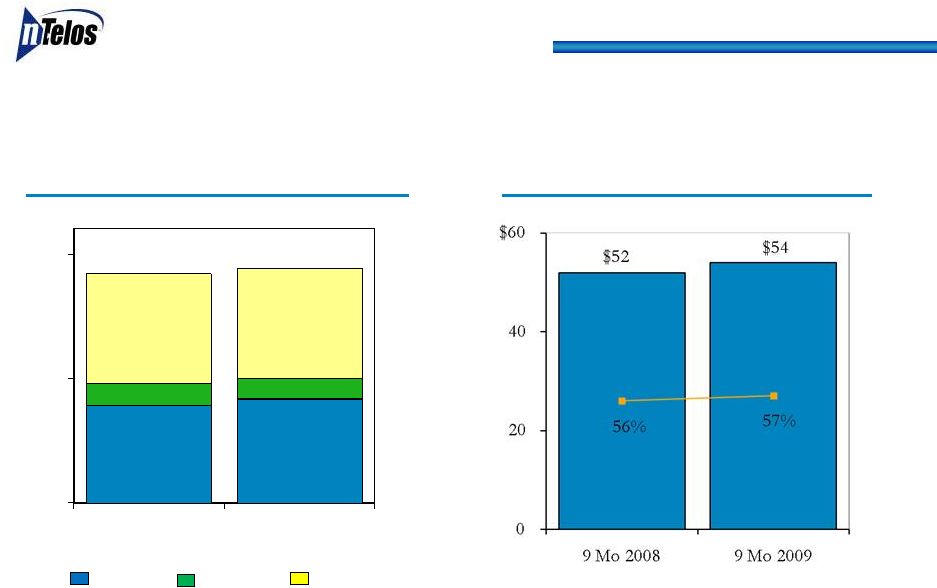
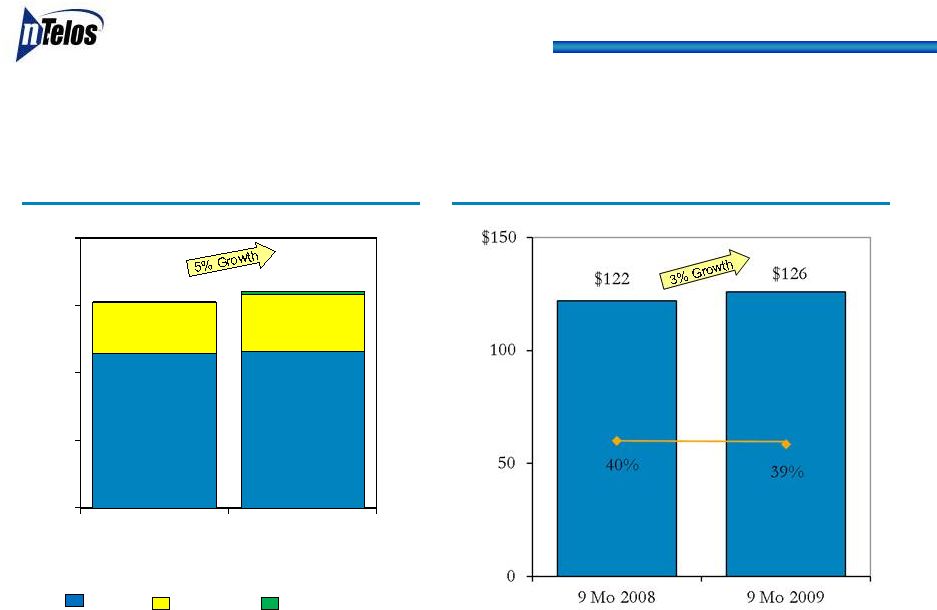 $229 $232 $75 $86 $2 $4 0 100 200 300 $400 9 Mo 2008 9 Mo 2009 $306 $322 10 Revenue (1) YTD 2009 over YTD 2008 Wireless Operations ($ in millions) Adjusted EBITDA/Margin % (1) Refer to Form 10-Q for the period ended September 30, 2009 for explanation and impact of change
from gross to net reporting of handset insurance revenues and costs effective April 1,
2008 Retail Wholesale Roaming |
 11 Catalysts for Sales Growth • NTELOS brand positioned as the “Best Value in Wireless” • Leveraging extensive retail presence – 80% of sales through direct channels • The most complete nationwide coverage with no roaming • EV-DO network upgrade: All of scheduled sites completed at 6/30/09 • Emphasis on Postpay plans Expansion of data products and services Enhanced handset lineup • FRAWG Unlimited prepay in VA East urban markets Gross adds exceeding expectations 84% of gross adds at the two highest price tiers of $40 and $50 Postpay Prepay Gross Adds Churn 9 Mo 2008 9 Mo 2009 Postpay 1.9%
2.2% Total
2.8% 3.2% 81 85 88 96 0 50 100 150 200 LTM 9/30/08 LTM 9/30/09 181 169 |
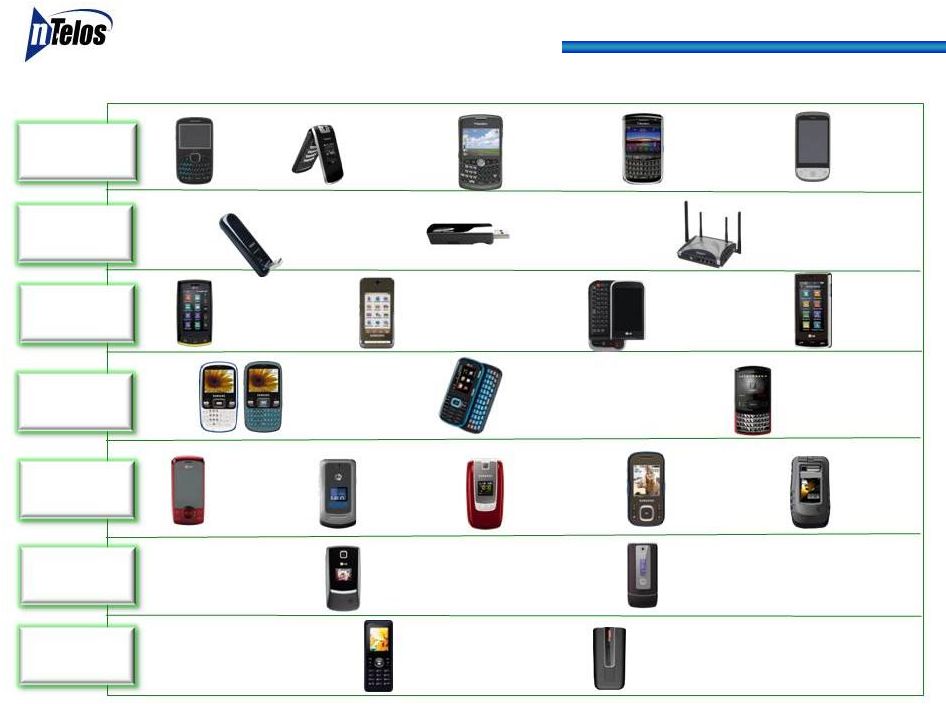 Planned
Device Line-up 4Q09 Planned Device Line-up 4Q09 Motorola Hint QA30 $207 BlackBerry Curve 8330 $399 LG 300 $95 Motorola W385 $116 Nokia 1606 $89 Motorola VE465 $158 Samsung SCH-r810 Finesse $348 BlackBerry Flip 8230 $349 Samsung SCH-r350 Freeform $145 LG 265 Script $148 LG 840 Spyder II $339 LG 700 Volt Nov $222 Samsung SCH-r600 $160 LG 370 Force $159 HTC Snap Dec $299 Franklin Wireless U210 Nov $99 Novatel MC760 $127 Axesstel MV440 $310 Kyocera S1300 Melo $65 HTC Hero Android Nov $399 Samsung SCH-r520 Trill Nov $180 LG 9600 Dec $365 Motorola W845 Quantico Dec $238 BlackBerry Tour 9630 Dec $449 Smartphone Data Card Touch QWERTY Feature EV-DO Feature 1X Value |
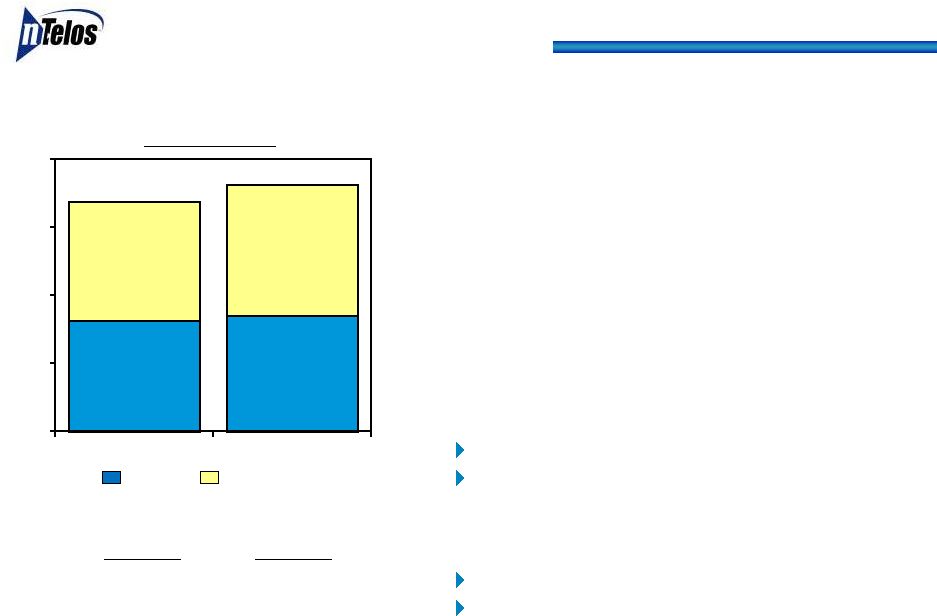
 $49 .06 $47 .40 $47.52 $44 .74 $7.18 $9.83 $7.26 $9.02 $56.24 $57 .23 $54.78 $53 .76 0 25 50 $75 9 Mo 2008 Post 9 Mo 2009 Post 9 Mo 2008 Total 9 Mo 2009 Total 13 Successful Growth in Subscribers and ARPU Retail ARPU (1) NTELOS Branded Subscribers (000s) (1) Refer to Form 10-Q for the period ended September 30, 2009 for explanation of change in
reporting of data services and data ARPU (2) Pro forma; refer to Form 10-Q for the period ended September 30, 2009 for explanation and impact
of change from gross to net reporting of handset insurance revenues and costs effective April 1, 2008; see Appendix for presentation of actual ARPU Data (2) Postpay Prepay (2) |
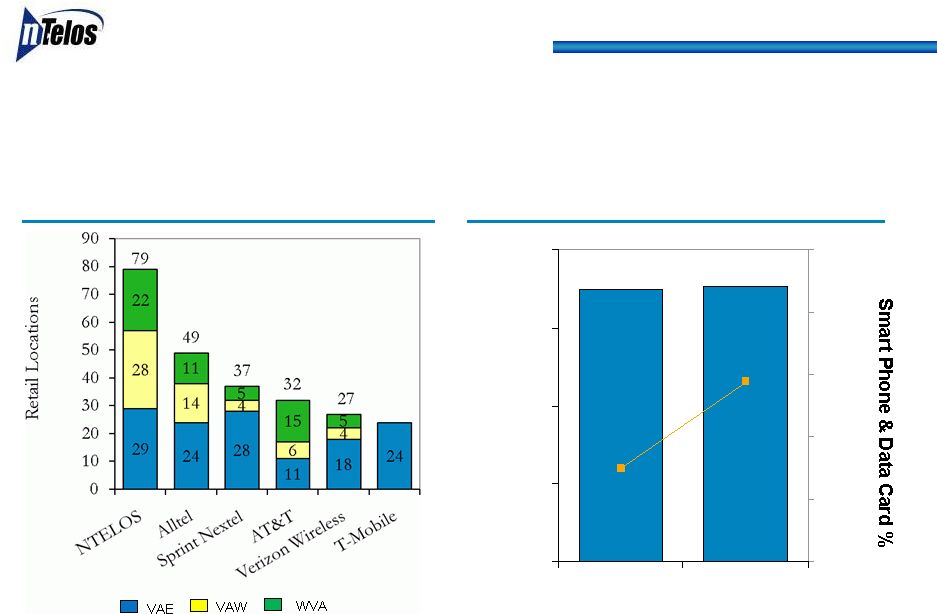 $349 $353 15.0% 29.0% 0 10 20 30 40 50% 0 100 200 300 $400 9 Mo 2008 9 Mo 2009 14 Direct Distribution Model Improves Customer Satisfaction Extensive Retail Presence (1) CPGA ($)/Smart Phone & Data Card % (2) -YTD (1) As of December 31, 2008 for all competitors; as of September 30, 2009 for NTELOS (2) Represents Smart Phone & Data Card sales as a % of Postpay Gross Adds |
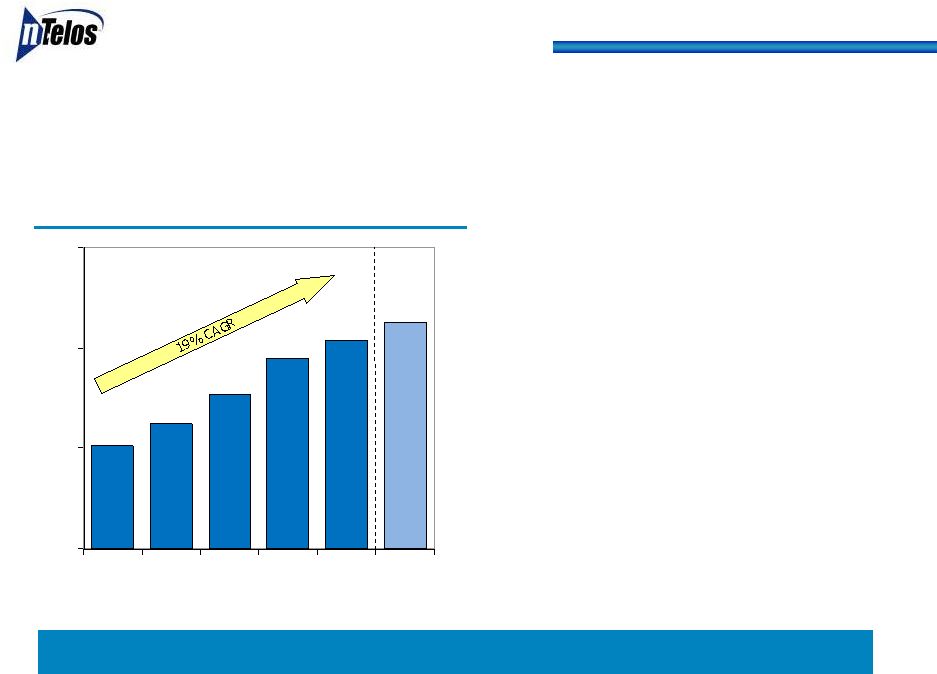 $51 $62 $77 $95 $104 $113 0 50 100 $150 2004 2005 2006 2007 2008 2009G 15 Wireless Wholesale Revenue (1) Strategic Network Alliance Leverages NTELOS’ Network • Sprint Nextel Strategic Network Alliance through at least July 2015 • $9 million monthly minimum revenue guarantee • Attractive contribution margin • Growing Data usage • 529% growth in travel data usage since EV-DO launched • 825% growth in home data usage since EV-DO launched ($ in millions) High Growth, Attractive Margin Revenue Stream (1) Excludes roaming |
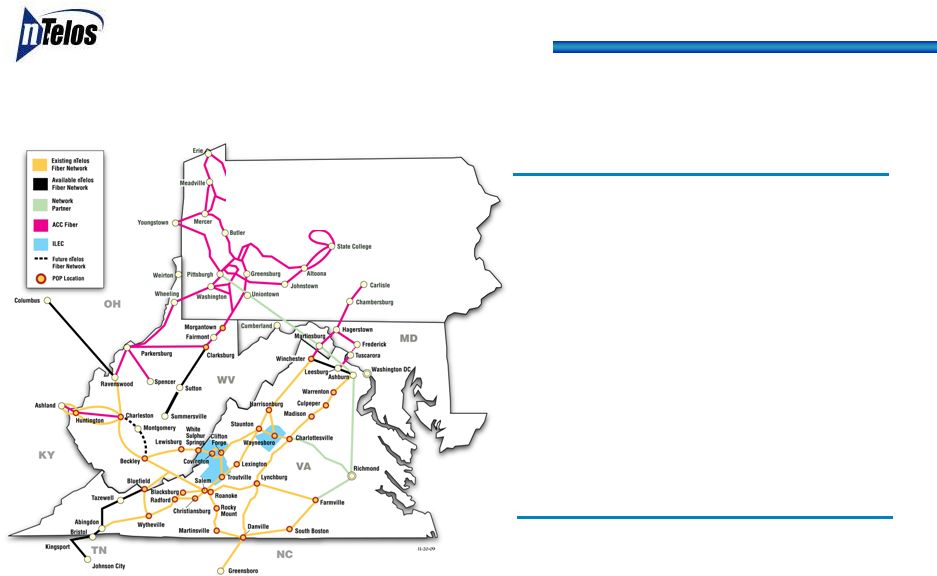 16 Greensboro, NC (1) Assumes closing on acquisition of assets from Allegheny Energy, Inc. on or about year-end; closing remains subject to regulatory approval and customary closing terms and conditions; see press release dated October 6, 2009 available on the Company’s website (2) As of September 30, 2009 or for the twelve months ended September 30, 2009 ($ in millions) Data Driving Wireline Growth (1) RLEC ($59 Revenue / $44 Adj. EBITDA) (2) Competitive ($67 Revenues / $27 Adj. EBITDA) (2) • Revenue growth of 5% YoY • Adjusted EBITDA growth of 12% YoY • 42% YTD Adjusted EBITDA margin • Strategic Broadband and Video revenue growth of 18% YOY to $36 million • 2,500 mile existing fiber network; 2,200 mile Allegheny fiber network being acquired (1) • New fiber route from Charlottesville to Ashburn, VA: Connectivity to internet hub and adds 3 new key markets • Fiber swap: Winchester to Ashburn, VA and segments from Beckley to Clarksburg, WV • Repositioning assets (data/video) • Adjusted EBITDA growth YoY • Broadband customer penetration at 50% • IPTV Launched in Q307 • Continued strong Adjusted EBITDA margin |
 $33 $37 $41 $46 $52 $18 $17 $15 $15 $11 $56 $57 $61 $61 $60 0 50 100 $150 2004 2005 2006 2007 2008 2009G $125 $107 $111 $117 $123 $122 17 Adjusted EBITDA/Margin% Revenue Wireline Provides Strong, Stable Cash Flow ($ in millions) (1) (1) Based on Midpoint of guidance range of $124 million to $126 million (2) Based on Midpoint of guidance range of $71 million to $72 million Note: Competitive - Strategic includes voice and broadband data services, IPTV video, high-capacity network access
and transport services. Competitive - Strategic Competitive - Other RLEC Competitive RLEC |
 18 Penetration Transport/Data/IP Revenue Competitive Growth Drivers ($ in millions) Video – Neighborhoods open in Q1-08 Broadband – Customer Penetration (1) Revenue before intercompany eliminations (1) $ $14.7 $19.8 $24.8 $30.8 17.2% 28.0% 37.6% 45.8% 51.6% 2005 2006 2007 2008 3Q09 0 15 30 2005 2006 2007 2008 Data/IP Transport/Wireless Transport 3.5% 14.4% 20.7% 25.0% 28.9% 31.8% 32.4% 1Q08 2Q08 3Q08 4Q08 1Q09 2Q09 3Q09 |
 $39 $42 $9 $8 $44 $44 0 50 $100 9 Mo 2008 9 Mo 2009 $92 $94 19 Adjusted EBITDA/Margin% Revenue YTD 2009 over YTD 2008 Strong, Stable Cash Flow ($ in millions) Competitive - Strategic Competitive - Other RLEC |
 Financial Overview |
 Wireless
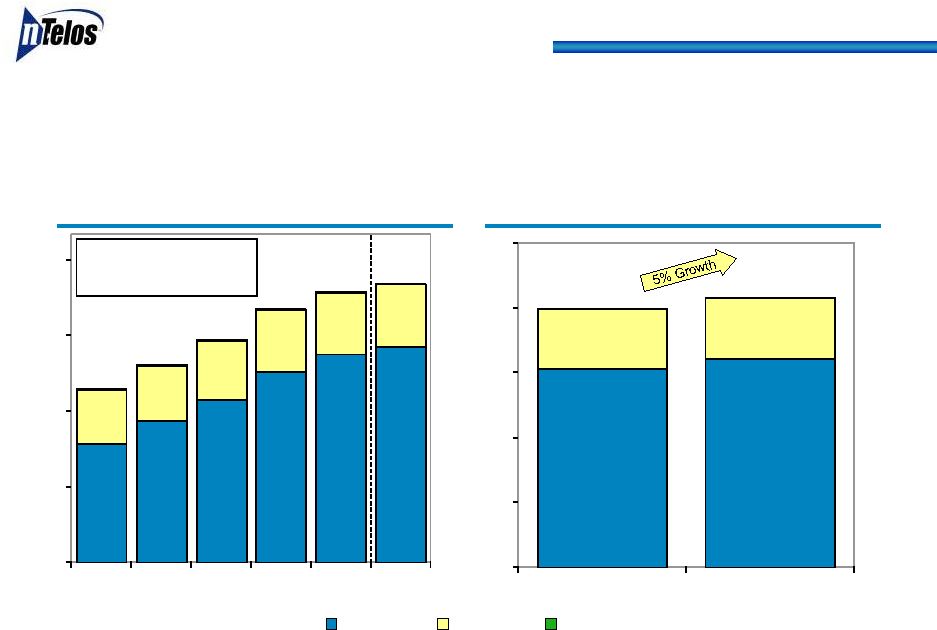
Wireline Other 21 Wireless Drives Revenue Growth Total Revenue (1) ($ in millions) YTD Revenue (1) (1) Refer to Form 10-Q for the period ended September 30, 2008 for explanation and impact of change
from gross to net reporting of handset insurance revenues and costs effective April 1,
2008 (2) Based on Midpoint of guidance range for Consolidated Revenue of $549 million to $553
million (2) $306 $322 $92 $ 94 0 100 200 300 400 $500 9 Mo 2008 9 Mo 2009 $398 $416 $235 $280 $322 $ 378 $ 412 $426 $ 107 $111 $117 $122 $123 $125 0 150 300 450 $600 2004 2005 2006 2007 2008 2009 G Wireless CAGR = 15% Wireline CAGR = 4% $500 $440 $392 $343 $536 $551 |
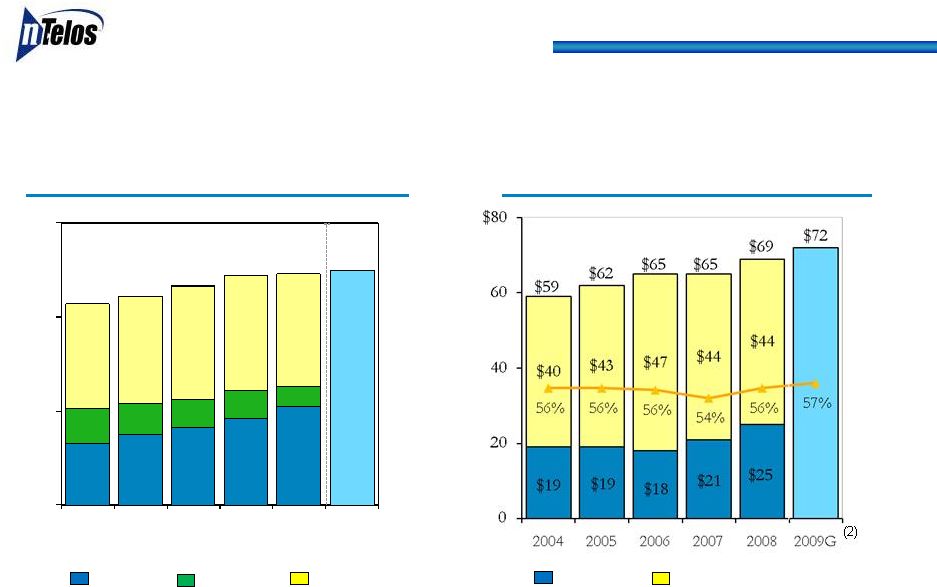
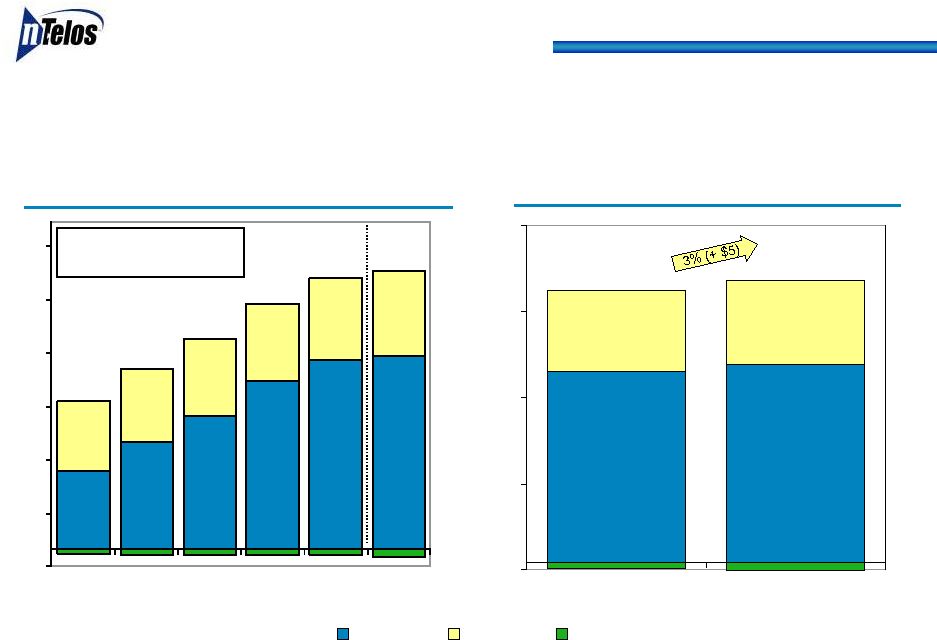 $122 $126 $52 $54 $170 $175 (5) 50 105 160 $215 9 Mo 2008 9 Mo 2009 Wireless Wireline Other 22 YTD Adjusted EBITDA Wireless Growth Enhances Adjusted EBITDA Total Adjusted EBITDA ($ in millions) (1) Based on Midpoint of guidance range for Consolidated Adjusted EBITDA of $227 million to $230 million (1) $66 $90 $112 $142 $159 $162 $59 $62 $65 $65 $69 $72 $121 $147 $172 $203 (15) 30 75 120 165 210 $255 2004 2005 2006 2007 2008 2009G Wireless CAGR = 25% Wireline CAGR = 4% $228 $223 |
 $61 $58 $86 $93 $91 $121 0 25 50 75 100 125 $150 2004 2005 2006 2007 2008 2009G 23 Accelerating Consolidated Free Cash Flow Free Cash Flow Consolidated CapEx ($ in millions) (1) (2) (1) Based on midpoint of guidance ranges (2) Included in 2009G for Other CAPEX is an expected investment of between $10 million and $12 million
for a new wireless prepay billing platform and a web portal (1) Wireless Wireline Other Discretionary, Incremental EVDO Investment & Strategic Fiber Builds $36 $41 $32 $37 $31 $35 $19 $20 $21 $25 $35 $37 $5 $8 $6 $7 $9 $19 $20 $28 $41 $57 $16 0 50 100 $150 2004 2005 2006 2007 2008 2009G $89 $60 $107 $87 $110 $132 |
 24 Cash Flows Guidance ($ in millions) 2009G (1) Adjusted EBITDA $ 228 Less CAPEX 107 Free Cash Flow $ 121 Less: Cash Interest, net of interest income 30 Cash Taxes 10 Cash Flows, net before dividends and debt payments $ 81 Less: Cash Dividends ($0.26 per share per qtr) 44 Scheduled 2009 Debt Payments 5 Allegheny Purchase (2) 27 Add: Refinancing Proceeds (3) 4 Cash Flows, net (4) (5) $ 9 Cash on Hand at December 31, 2008 $ 66 (1) Based on midpoint of guidance ranges (2) Assumes acquisition closes by 12/31/09 (3) Refinancing net of debt issuance and closing costs, swap termination and origination
issue discount (4) Before adjustments for changes in working capital (5) Before use of cash for stock repurchase in 2009 of up to $40 million and purchase of
fiber network |
 25 Capitalization ($ in millions) (1) Based on midpoint of guidance ranges (2) Before adjustments for changes in working capital and use of cash for stock repurchase in 2009 of up
to $40 million 2009 Guidance (1) Adjusted EBITDA $ 203.0 $ 223.1 $ 228.5 Cash $ 53.5 $ 65.7 $ 75.0 (2) 1st lien senior secured credit facility $ 612.9 $ 606.5 $ 634.4 Capital leases 1.3 1.4 1.5 Total Debt $ 614.2 $ 607.9 $ 635.9 Total Debt Leverage Ratio 3.03x 2.72x 2.78x Net Debt (total debt less cash) $ 560.7 $ 542.2 $ 560.9 (2) Net Debt Leverage Ratio 2.76x 2.43x 2.45x (2) 2007A 2008A |
 26 Summary • Consistently Strong Financial Performance • Numerous Catalysts for Sustainable Growth • Focused on Long-term Net Income and Free Cash Flow Growth • Diversified Business Model • Network Upgrade Drives Wireless Growth • Data Revenue Growth • High-Margin Wholesale Revenue • Strong Performing and Growing Regional Wireline Business Focused on Data Provision • Scalable Systems for Continued Expansion • Experienced Management Team |
 Appendix |
 28 Adjusted EBITDA Reconciliation ($ in millions) 2004 2005 2006 2007 2008 2008 2009 Consolidated Operating Income $55 $53 $61 $100 $115 $87 $102 Depreciation and Amortization 65 83 85 97 103 79 69 Capital and Operational Restructuring Charges 1 15 - - - - - Accretion of Asset Retirement Obligations - 1 1 1 1 1 1 Advisory Termination Fees - - 13 - - - - Gain on Sale of Assets - (9) - - - - - Secondary Offering Costs - - - 1 - - - Non-cash Compensation Charge - 4 13 4 3 2 3 Voluntary Early Retirement Plan Charge - - - - 1 1 - Adjusted EBITDA $121 $147 $172 $203 $223 $170 $175 9 months ended |
 29 Adjusted EBITDA Reconciliation ($ in millions) 2004 2005 2006 2007 2008 2008 2009 Wireless Operating Income $21 $32 $53 $71 $85 $63 $77 Depreciation and Amortization 44 57 58 70 73 58 48 Accretion of Asset Retirement Obligations 1 1 1 1 1 1 1 Adjusted EBITDA $66 $90 $112 $142 $159 $122 $126 Wireline Operating Income $39 $36 $39 $38 $41 $31 $33 Depreciation and Amortization 20 25 26 27 27 20 21 Voluntary Early Retirement Plan Charge - - - - 1 1 - Adjusted EBITDA $59 $61 $65 $65 $69 $51 $54 9 months ended |
 30 ARPU (1) Reconciliation ($ in thousands, except for subscribers and ARPU data) Nine Months Ended: 9/30/2008 9/30/2009 (1) Refer to Form 10-Q for the quarter ended September 30, 2009 for explanation and impact of change
from gross to net reporting of handset insurance revenues and costs effective April 1,
2008 Three Months Ended: 9/30/2008 9/30/2009 Operating Revenues 135,074 $
135,686 $
398,128 $ 416,351 $ Less: Wireline and other operating revenue (31,180) (31,460) (92,371) (94,061) Wireless communications revenue 103,894 104,226 305,757 322,290 Less: Equipment revenue from sales to new customers (1,665) (1,525) (9,196) (4,408) Less: Equipment revenue from sales to existing customers (4,131) (4,788) (8,710) (14,537) Less: Wholesale revenue (27,307) (28,507) (76,674) (89,870) Less: Other revenues, eliminations and adjustments (290) 856 (452) 51 Wireless gross subscriber revenue 70,501 $
70,262 $
210,725 $ 213,526 $ Less: Paid in advance subscriber revenue (18,526) (15,535) (58,867) (51,784) Plus: adjustments 313 (1,121) 174 (870) Wireless gross postpay subscriber revenue 52,288 $
53,606 $
152,032 $ 160,872 $ Average subscribers 426,552 440,052 421,637 441,287 Total ARPU 55.09 $
53.22 $
55.53 $
53.76 $ Average postpay subscribers 301,264 310,601 296,359 312,348 Postpay ARPU 57.85 $
57.53 $
57.00 $
57.23 $ Wireless gross subscriber revenue 70,501 $
70,262 $
210,725 $ 213,526 $ Less: Wireless voice and other feature revenue (60,871) (57,942) (183,179) (177,686) Wireless data revenue 9,630 $
12,320 $
27,546 $ 35,840 $ Average subscribers 426,552 440,052 421,637 441,287 Total Data ARPU 7.53 $
9.33 $
7.26 $
9.02 $
Wireless gross postpay subscriber revenue 52,288 $
53,606 $
152,032 $ 160,872 $ Less: Wireless postpay voice and other feature revenue (45,119) (44,047) (132,868) (133,228) Wireless postpay data revenue 7,169 $
9,559 $
19,164 $ 27,644 $ Average postpay subscribers 301,264 310,601 296,359 312,348 Postpay data ARPU 7.93 $
10.26 $
7.18 $
9.83 $
|
 31 Summary of Operating Results ($ in thousands) Nine Months Ended: Three Months Ended: September 30, 2008 September 30, 2009 September 30, 2008 September 30, 2009 Operating Revenues Wireless PCS Operations 103,894 $
104,226 $
305,757 $
322,290 $
Wireline Operations RLEC 15,078 14,395 44,435 43,543 Competitive Wireline 15,979 16,944 47,515 50,154 Wireline Total 31,057 31,339 91,950 93,697 Other 123 121 421 364 135,074 $
135,686 $
398,128 $
416,351 $
Operating Expenses Wireless PCS Operations 63,285 $
65,106 $
183,992 $
196,363 $
Wireline Operations RLEC 4,009 3,326 11,743 10,792 Competitive Wireline 9,920 9,446 28,627 29,129 Wireline Total 13,929 12,772 40,370 39,921 Other 1,470 1,170 4,243 5,041 78,684 $
79,048 $
228,605 $
241,325 $
Adjusted EBITDA (a non-GAAP Measure) Wireless PCS Operations 40,609 $
39,120 $
121,765 $
125,927 $
Wireline Operations RLEC 11,069 11,069 32,692 32,751 Competitive Wireline 6,059 7,498 18,888 21,025 Wireline Total 17,128 18,567 51,580 53,776 Other (1,347) (1,049) (3,822) (4,677) 56,390 $
56,638 $
169,523 $
175,026 $
Capital Expenditures Wireless PCS Operations 31,334 $
7,759 $
61,703 $
42,381 $
Wireline Operations RLEC 3,918 3,636 11,519 10,498 Competitive Wireline 5,200 5,914 17,613 21,270 Wireline Total 9,118 9,550 29,132 31,768 Other 974 4,161 7,321 16,863 41,426 $
21,470 $
98,156 $
91,012 $
Adjusted EBITDA less Capital Expenditures (a non-GAAP measure) Wireless PCS Operations 9,275 $
31,361 $
60,062 $
83,546 $
Wireline Operations RLEC 7,151 7,433 21,173 22,253 Competitive Wireline 859 1,584 1,275 (245) Wireline Total 8,010 9,017 22,448 22,008 Other (2,321) (5,210) (11,143) (21,540) 14,964 $
35,168 $
71,367 $
84,014 $
(before depreciation & amortization, asset impairment charges, accretion of asset retirement obligations, non-cash compensation and voluntary early retirement program charges, a non-GAAP Measure of operating expenses)
|