Attached files
Table of Contents
UNITED STATES
SECURITIES AND EXCHANGE COMMISSION
Washington, D.C. 20549
FORM 10-K
| x | ANNUAL REPORT PURSUANT TO SECTION 13 OR 15(d) OF THE SECURITIES EXCHANGE ACT OF 1934 |
For the fiscal year ended September 30, 2009
OR
| ¨ | TRANSITION REPORT PURSUANT TO SECTION 13 OR 15(d) OF THE SECURITIES EXCHANGE ACT OF 1934 |
For the Transition Period From to .
Commission file number 1-10570
BJ SERVICES COMPANY
(Exact name of registrant as specified in its charter)
| Delaware | 63-0084140 | |
| (State or other jurisdiction of incorporation or organization) |
(I.R.S. Employer Identification No.) |
4601 Westway Park Blvd, Houston, Texas 77041
(Address of principal executive offices)
Registrant’s telephone number, including area code: (713) 462-4239
Securities registered pursuant to Section 12(b) of the Act:
| Title of each class |
Name of each exchange on which registered | |
| Common Stock $.10 par value per share Preferred Share Purchase Rights |
New York Stock Exchange New York Stock Exchange |
Securities Registered Pursuant to Section 12(g) of the Act: None
Indicate by check mark if the registrant is a well-known seasoned issuer, as defined in Rule 405 of the Securities Act. YES x NO ¨
Indicate by check mark if the registrant is not required to file reports pursuant to Section 13 or Section 15(d) of the Act. YES ¨ NO x
Indicate by check mark whether the registrant (1) has filed all reports required to be filed by Section 13 or 15(d) of the Securities Exchange Act of 1934 during the preceding 12 months (or for such shorter period that the registrant was required to file such reports), and (2) has been subject to such filing requirements for the past 90 days. YES x NO ¨
Indicate by check mark whether the registrant has submitted electronically and posted on its corporate Web site, if any, every Interactive Data File required to be submitted and posted pursuant to Rule 405 of Regulation S-T (§232.405 of this chapter) during the preceding 12 months (or for such shorter period that the registrant was required to submit and post such files). YES x NO ¨
Indicate by check mark if disclosure of delinquent filers pursuant to Item 405 of Regulation S-K (§229.405 of this chapter) is not contained herein, and will not be contained, to the best of registrant’s knowledge, in definitive proxy or information statements incorporated by reference in Part III of this Form 10-K or any amendment to this Form 10-K. x
Indicate by check mark whether the registrant is a large accelerated filer, an accelerated filer, a non-accelerated filer, or a smaller reporting company. See the definitions of “large accelerated filer,” “accelerated filer” and “smaller reporting company” in Rule 12b-2 of the Exchange Act. (Check one):
| Large accelerated filer | x | Accelerated filer | ¨ | |||
| Non-accelerated filer | ¨ | Smaller reporting company | ¨ | |||
Indicate by check mark whether the registrant is a shell company (as defined in Rule 12b-2 of the Act). YES ¨ NO x
At November 17, 2009, the registrant had outstanding 293,492,308 shares of Common Stock, $.10 par value per share. The aggregate market value of the Common Stock on March 31, 2009 (based on the closing prices in the daily composite list for transactions on the New York Stock Exchange) held by nonaffiliates of the registrant was approximately $2.9 billion.
DOCUMENTS INCORPORATED BY REFERENCE:
Portions of the registrant’s Proxy Statement for the 2010 Annual Meeting of Stockholders, which will be filed by the registrant on or prior to 120 days following the end of the registrant’s fiscal year ended September 30, 2009, are incorporated by reference into Part III of this Form 10-K, or Part III will be provided by amendment.
Table of Contents
2
Table of Contents
| ITEM 1. | Business |
General
BJ Services Company (the “Company”), whose operations trace back to the Byron Jackson Company (founded in 1872), was organized in 1990 under the corporate laws of the state of Delaware. We are a leading worldwide provider of pressure pumping and oilfield services for the petroleum industry. Pressure pumping services consist of cementing and stimulation services used in the completion of new oil and natural gas wells and in remedial work on existing wells, both onshore and offshore. Oilfield services include casing and tubular services; precommissioning, maintenance, turnaround and pipeline inspection services in the process and pipeline services business; chemical services; completion tools; and completion fluids.
A summary of the proportional contributions from our primary business lines and geographic markets follows:
| Year Ended September 30, | |||||||||
| 2009 | 2008 | 2007 | |||||||
| Pressure pumping services |
79 | % | 82 | % | 83 | % | |||
| Oilfield services group |
21 | % | 18 | % | 17 | % | |||
| Total |
100 | % | 100 | % | 100 | % | |||
| United States |
51 | % | 58 | % | 61 | % | |||
| Canada |
10 | % | 10 | % | 9 | % | |||
| Other international |
39 | % | 32 | % | 30 | % | |||
| Total |
100 | % | 100 | % | 100 | % | |||
For further discussion of operating and geographic segment information for the three-year period ended September 30, 2009, see Note 9 of the Notes to Consolidated Financial Statements.
Baker Hughes Merger Agreement
On August 30, 2009, the Company and Baker Hughes Incorporated (“Baker Hughes”) entered into an Agreement and Plan of Merger (the “Merger Agreement”), pursuant to which the Company will merge with and into a wholly-owned subsidiary of Baker Hughes, and each share of Company common stock will be converted into the right to receive 0.40035 shares of Baker Hughes common stock and $2.69 in cash (the “Merger”). Completion of the Merger is subject to customary closing conditions, including (i) approval of the Merger by the stockholders of the Company, (ii) approval by the stockholders of Baker Hughes of the issuance of Baker Hughes common stock to execute the Merger, (iii) applicable regulatory approvals, including the termination or expiration of the applicable waiting period under the U.S. Hart-Scott-Rodino Antitrust Improvements Act of 1976, as amended, (iv) the effectiveness of a registration statement on Form S-4 relating to the Baker Hughes common stock to be issued in the Merger, and (v) other customary closing conditions.
Under the Merger Agreement, the Company agreed to conduct its business in the ordinary course while the Merger is pending, and to generally refrain from acquiring new businesses, incurring new indebtedness, repurchasing treasury shares, issuing new common stock or equity awards, or entering into new material contracts or commitments outside the normal course of business, without the consent of Baker Hughes. Under certain circumstances, the Company or Baker Hughes may be required to pay a termination fee of $175 million to the other party if the Merger is not completed. When and if the Merger is approved or completed, certain contractual obligations of the Company will or may be triggered or accelerated under the “change of control” provisions of such contractual arrangements. Examples of such arrangements include stock-based compensation awards, severance and retirement plan agreements applicable to executive officers, directors and certain employees, and the equipment partnership described in Note 11 of the Notes to Consolidated Financial Statements.
Baker Hughes and the Company are working to comply with the U.S. Department of Justice’s second request for additional information and documentary material issued October 14, 2009, and to complete the Merger as quickly as practicable, and they currently expect the Merger to be completed during the Company’s second fiscal quarter of fiscal 2010. However, the Company cannot predict with certainty when the Merger will be completed, because completion of the Merger is subject to conditions both within and beyond the Company’s control.
3
Table of Contents
Business Segments
We conduct our operations through four principal segments:
| • | U.S./Mexico Pressure Pumping Services. This segment includes pressure pumping services derived from our activities in the United States and Mexico. |
| • | Canada Pressure Pumping Services. This segment includes pressure pumping services derived from our activities in Canada. |
| • | International Pressure Pumping Services. This segment includes pressure pumping services derived from our activities outside of the United States, Mexico and Canada. |
| • | Oilfield Services Group. This segment includes the following oilfield service divisions: casing and tubular services, process and pipeline services, chemical services, completion tools and completion fluids. |
Pressure Pumping Services
Our pressure pumping services consist of cementing services and stimulation services, and accounted for 79% of our total revenue in fiscal 2009 and 82% of our total revenue in fiscal 2008. Stimulation services include a variety of production enhancement services, such as fracturing, acidizing, sand control, nitrogen services and coiled tubing services. We provide pressure pumping services to major and independent oil and natural gas producing companies, as well as national oil companies. Pressure pumping services are used to complete new oil and natural gas wells, maintain existing oil and natural gas wells, and enhance the production of oil and natural gas from producing formations in reservoirs. These services are provided both on land and offshore on a 24-hour, on-call basis through regional and district facilities in approximately 200 locations worldwide.
Cementing Services
Our cementing services, which accounted for approximately 31% of total pressure pumping revenue during fiscal 2009, consist of blending high-grade cement and water with various solid and liquid additives to create a “cement slurry” that is pumped into a well between the casing and the wellbore. The cement slurry is designed to achieve the proper cement set-up time, compressive strength and fluid loss control. The slurry can be modified to address different well depths, downhole temperatures and pressures, and formation characteristics.
We provide central, regional and district laboratory testing services to evaluate cement slurry properties, which can vary by cement supplier and local water sources. Our field engineers develop job design recommendations to achieve desired compressive strength and bonding characteristics.
The principal application for cementing services used in oilfield operations is primary cementing, or cementing between the casing string and the wellbore during the drilling and completion phase of a well. Primary cementing is performed to (i) isolate fluids behind the casing between productive formations and other formations that would damage the productivity of hydrocarbon-producing zones or damage the quality of freshwater aquifers, (ii) seal the casing from corrosive formation fluids, and (iii) provide structural support for the casing string. Cementing services are also utilized when recompleting wells from one producing zone to another and when plugging and abandoning wells.
Stimulation Services
Our stimulation services, which accounted for approximately 69% of total pressure pumping revenue during fiscal 2009, consist of fracturing, acidizing, sand control, nitrogen services and coiled tubing services, all of which are designed to enhance oil and gas production from completed or producing wells. Stimulation services are provided both onshore and offshore. Offshore services are provided through the use of skid-mounted pumping units and the operation of several stimulation vessels.
4
Table of Contents
Demand for fracturing and other stimulation services increased significantly between 2005 and 2008, as oil and natural gas production declined in key producing fields in the United States and certain international regions and as the development of unconventional hydrocarbon reservoirs increased during that period. Fracturing is a critical element involved in the successful completion of unconventional reservoirs including “tight” or low-permeability sandstones, coalbed methane and gas-bearing shale formations. Consequently, we have increased our stimulation services capabilities in the United States and internationally over the past several years. The global credit crisis and economic recession that occurred during fiscal 2009 resulted in lower demand for oil and natural gas and a sharp reduction in drilling and production activity, particularly in North America.
Our stimulation and other production enhancement service offerings are described below.
Fracturing. Fracturing services are performed to enhance the production of oil and natural gas from formations where natural flow is restricted due to low permeability. The fracturing process consists of pumping a fluid (“fracturing fluid”) into a cased well at sufficient pressure to fracture the producing formation. Sand, bauxite or synthetic proppants are suspended in the fracturing fluid and are pumped into the fracture to prop the fracture open. In some cases, fracturing is performed using an acid solution pumped under pressure without a proppant or with small amounts of proppant. The main components in the equipment used in the fracturing process are a blender, which blends the proppant and chemicals into the fracturing fluid; multiple pumping units capable of pumping significant volumes at high pressures; and a monitoring van equipped with real-time monitoring equipment and computers used to control the fracturing process. Our fracturing units are capable of pumping at pressures of up to 20,000 pounds per square inch.
An important element of fracturing services is the design of the fracturing treatment, which includes determining the proper fracturing fluid, proppants and injection program to maximize results. Our field engineering staff provides technical evaluation and job design recommendations for the customer as an integral element of the fracturing service. Technological developments in the industry over the past several years have focused on proppant concentration control (i.e., proppant density), liquid gel concentrate capabilities, computer design and monitoring of jobs, and cleanup properties for fracturing fluids. We have introduced equipment and products to respond to these technological advances.
In 1998, we embarked on a program to replace our aging U.S. fracturing equipment fleet with new, more efficient and higher-horsepower pressure pumping equipment. We later expanded the U.S. fleet recapitalization initiative to include additional equipment, such as cementing, nitrogen and acidizing equipment. We have made significant progress in adding new equipment in recent years. The market downturn in fiscal 2009 and the corresponding reduction in demand for our services have allowed us to retire older assets and complete the fleet recapitalization initiative.
The proliferation of activity in areas of gas-bearing shale formation production in Texas, Arkansas, Oklahoma, North Louisiana, Pennsylvania, West Virginia and British Columbia has created increased demand for fracturing assets. Gas shale formations require as much as 30,000 horsepower, nearly three times the horsepower requirement of the average North American fracturing treatment. Much of the equipment that has been added to our North American fleet in recent years is in response to the development of these new gas shale formations. While activity in many of these formations has slowed considerably during fiscal 2009, we believe the development of these formations will increase once again when natural gas supply and demand in North America are more in balance.
Acidizing. Acidizing enhances the flow rate of oil and natural gas from wells that experience reduced flow caused by formation damage from drilling or completion fluids or the gradual build-up of materials that restrict the flow of hydrocarbons in the formation. Acidizing entails pumping large volumes of specially formulated acids into reservoirs to dissolve barriers and enlarge crevices in the formation, thereby eliminating obstacles to the flow of oil and natural gas. We maintain a fleet of mobile acid transport and pumping units to provide acidizing services for the onshore market and maintain acid storage and pumping equipment on most of our offshore stimulation vessels.
Sand Control. Sand control services involve the application of technology and methods used in loosely consolidated formations to exclude the production of formation sand while producing oil and natural gas. Sand control techniques are used to either bind the formation sand or filter it, such that the oil and natural gas can move freely into the wellbore. Sand control services include gravel pack tools, well screens, chemical consolidation treatments, gravel packs and frac packs. These services are performed primarily in unconsolidated sandstone reservoirs, mostly in the Gulf of Mexico, the North Sea, Venezuela, Brazil, Trinidad, Ecuador, West Africa, China, Indonesia, India, Saudi Arabia and Malaysia. Our completion tools and completion fluids, as described later, are often utilized in conjunction with sand control services.
5
Table of Contents
Nitrogen. Nitrogen services involve the use of nitrogen, an inert gas, in various pressure pumping operations. When provided as a stand-alone service, the use of nitrogen is effective in displacing fluids in various oilfield applications. However, nitrogen is principally used in applications supporting our coiled tubing and stimulation services.
Coiled Tubing. Coiled tubing services involve injecting coiled tubing into wells to perform various well-servicing operations. Coiled tubing is a flexible steel pipe with a diameter of typically less than 2 7/8 inches and manufactured in continuous lengths of thousands of feet. It is wound or coiled on a truck-mounted reel for onshore applications or a skid-mounted reel for offshore applications. Due to its small diameter, coiled tubing can be inserted into existing production tubing and used to perform a variety of services to enhance the flow of oil or natural gas without using a larger, more costly workover rig. The principal advantages of employing coiled tubing in a workover include (i) not ceasing production from the well, thus reducing the risk of formation damage to the well, (ii) being able to move continuous coiled tubing in and out of a well significantly faster than conventional pipe, which must be jointed and unjointed, (iii) having the ability to direct fluids into a wellbore with more precision, allowing for improved stimulation fluid placement, (iv) providing a source of energy to power a downhole motor or manipulate downhole tools and (v) enhancing access to remote or offshore fields due to the smaller size and mobility of a coiled tubing unit. We have developed a line of specialty downhole tools that may be attached to coiled tubing, such as rotary jetting equipment, multi-zone fracturing tools and wellbore cleanout systems.
Oilfield Services Group
Our oilfield services group accounted for approximately 21% of our total revenue in fiscal 2009 and 18% of our total revenue in fiscal 2008. This segment consists of casing and tubular services, process and pipeline services, chemical services, completion tools and completion fluids services in the United States and select markets internationally.
Casing and Tubular Services
Casing and tubular services comprise installing or “running” casing and production tubing into a wellbore. Casing is run, primarily during the drilling and completion phases of a well, to protect the structural integrity of a wellbore and to isolate various zones in a well. Production tubing is run inside the casing during the completion and workover phases of a well, and oil and natural gas production flows out of the wellbore to the surface through the tubing. Our casing and tubular services business also provides pipe driving hammer services. Hydraulic and diesel powered hammers are used in a variety of offshore well construction projects.
Process and Pipeline Services
We provide a wide range of services to the power industry and to the process industry, which includes oil and natural gas production, refineries, and gas and petrochemical plants. These services, which include testing, cleaning, drying and inerting pipework and pipelines, are primarily used in the precommissioning of new plants and in performing maintenance to existing plants. Nitrogen/helium leak testing is used to locate and quantify small leaks on hydrocarbon systems. Leak testing is used on both new and existing facilities to minimize the risk of hydrocarbon leaks, improving safety and minimizing greenhouse gas emissions. Systems can be cleaned by flushing, jetting, pigging or chemical treatments to ensure debris is removed from the system prior to start-up, thus minimizing damage to expensive process equipment.
Due to regulatory requirements or safety concerns, new pipelines are often tested prior to their initial use. Pipeline testing typically involves filling the pipeline with water under operating pressures, and then drying the pipelines using dry air, nitrogen, or a vacuum. Many pipelines require cleaning while “on line” to help ensure the integrity of the pipeline and to maximize product throughput. We offer several techniques for pipeline cleaning, including gel cleaning, which is used to carry large amounts of debris out of the pipeline, and various solvent treatments to remove debris.
Our pipeline inspection business uses “intelligent pigs” to assist pipeline operators in assessing the integrity of their pipelines. Pigs are electromagnetic devices that are propelled through a pipeline, recording information about the pipeline. We have developed two principal sets of pipeline inspection tools: one set uses electromagnetic-based instruments to monitor metal loss from the interior pipe wall caused by either corrosion or mechanical
6
Table of Contents
damage. A second set of tools monitors pipeline geometry (dents, buckles and wrinkles) and position (latitude, longitude and height) using an inertial guidance system that allows the generation of as-built maps of the pipeline, as well as the calculation of critical strains due to pipeline movement. Using the information collected by these tools, pipeline operators are able to prepare a structural analysis to determine if the pipeline is fit for its purpose.
Chemical Services
Chemical services are provided to customers in the upstream and downstream oil and natural gas businesses. These services involve the design of treatments and the sale of products to optimize production, unload wellbore fluids, and reduce the negative effects of corrosion, scale, paraffin, bacteria, and other contaminants in the production and processing of oil and natural gas. Our chemical services business also provides the equipment and services associated with installation of capillary tubing in oil and gas wells. Capillary tubing is normally steel or other alloy pipe, manufactured in continuous sections of less than one inch diameter. The tubing is installed into a producing wellbore and is used to convey production chemicals to predetermined depth locations in the wellbore. Positioning the injection point of chemicals within a wellbore optimizes the effectiveness of the chemical treatment. These services are carried out with purpose-built equipment and are most often utilized in low-pressure gas wells for foamer injection associated with de-liquefaction. Customers engaged in crude oil production, natural gas processing, raw and finished oil and natural gas product transportation, refinery operations and petrochemical manufacturing use these products and services.
Production chemical and injection service operations address four principal priorities our customers have: (1) the protection of the customer’s capital investment in metal goods, such as downhole casing and tubing, pipelines and process vessels, (2) de-liquefaction of wellbore fluids providing steady flow and enhanced production, (3) the treatment of fluids to allow customers to meet the specifications of the particular operation, such as production transferred to a pipeline or fuel sold at a marketing terminal, and (4) the injection of production chemicals directly to the desired producing zone through the use of small diameter capillary strings.
Completion Tools
We design, manufacture, assemble and install downhole completion tools that use gravel and sand control screens to control the migration of reservoir sand into the well and direct the flow of oil and natural gas into the production tubing. Our specialty tool and well screen manufacturing plant in Houston, Texas manufactures well screens and many of the components required in the completion tools; some components are manufactured by third parties. In addition, spare parts for completion tools and production packers are sold to customers that have purchased tools in the past.
Our completion tools are sold as complete systems, which are engineered based on each well’s particular mechanical and reservoir characteristics, such as downhole pressure, wellbore size and formation type. Many wells produce from more than one productive zone simultaneously. Depending on the customer’s preference, we have the ability to install tools that can either isolate one producing zone from another or integrate the production from multiple producing zones. Our field specialists, working with the rig crews, deploy completion tools in the well during the completion process. To further enhance reservoir optimization, we have developed tools that provide the operator with “intelligent completion” capabilities. These tools allow the operator to selectively control flow from multiple productive zones in the same wellbore from a remote surface site. From time to time, we may outsource the equipment necessary to monitor downhole parameters such as temperature, pressure and reservoir flow.
In addition to tools that are designed to control sand migration, we also provide completion tools that are generally used in conventional completions for reservoirs that do not require sand control. These tools include production packers, surface-controlled subsurface safety valves and other tools.
Well screens are sections of perforated pipe wrapped with wire that are placed in production tubing and are designed to prevent the flow of gravel into the producing wellbore. Well screens are critical to the success of wells in unconsolidated sandstone reservoirs, the majority of which are located in the Gulf of Mexico, the North Sea, Venezuela, Brazil, Trinidad, Ecuador, West Africa, China, Indonesia, India, Saudi Arabia and Malaysia.
As a result of the acquisition of Innicor Subsurface Technologies Inc. in May of 2008, we enhanced our tool services product line and began offering shaped charges and perforating guns. Tool services include a broad array of downhole equipment and services related to the drilling, completion and production enhancement operations in oil and gas wells. The equipment includes open-hole packers, retrievable completion packers, sealbore packers, service tools, tubing anchors, liner hanger equipment, flow control equipment, bridge plugs and retainers. Tool services can be provided on a stand-alone basis or combined with elements of a pressure pumping services operation.
7
Table of Contents
Tool services are normally contracted by an oil and gas company to provide equipment during the drilling or completion operations. Once the equipment is delivered to a well site, our tool specialist remains on location as the equipment is installed in the well. The equipment includes saleable items that are permanently installed in oil and gas wells, as well as rental equipment that is run into a wellbore on a temporary basis and then retrieved at the conclusion of an operation. These rental items are then “redressed” and prepared for application in other wells. We have a specialty manufacturing plant in Calgary that produces components required for the equipment. In addition, outside machine shops are used for some component manufacturing and assembly.
Innicor Perforating Systems, a wholly-owned subsidiary, is a provider of shaped charges and perforating guns for use by service companies involved in either wireline or tubing-conveyed perforating operations. Perforating is a process in which explosive charges are used to create holes in a cased wellbore. These holes are the primary method of communicating the reservoir gas and/or fluids from the formation into the wellbore. This operation can either be conducted during the initial completion of a well or as part of a workover operation.
We have an explosive charge manufacturing plant in Standard, Alberta, Canada, where the shaped charges are produced. The perforating guns, which are used to transport shaped charges into a wellbore, are manufactured in Calgary.
Completion Fluids
We sell and reclaim clear completion fluids and perform related fluid maintenance activities, such as filtration and reclamation. Completion fluids are used to control well pressure and facilitate other completion activities while minimizing reservoir damage. We provide basic completion fluids as well as a broad line of specially formulated and customized fluids for critical completion applications.
Completion fluids are available either as pure salt solutions or in combination with other materials. These fluids are solids-free, and therefore, should not restrict the flow of oil and natural gas from the formation. In contrast, drilling mud, the fluid typically used during drilling and in some well completions, contains solids to achieve densities greater than water. These solids can restrict the reservoir, causing reservoir damage and restricting the flow of oil and natural gas into the well. When completion fluids are placed into a well, they typically become contaminated with solids that remain in the well after drilling mud is displaced. To remove these contaminants, we deploy filtering equipment and technicians that work in conjunction with our on-site fluid engineers to maintain the solids-free condition of the completion fluids throughout the project. We provide a wide range of completion fluids and the necessary support services to properly apply completion fluids in the field, including filtration, on-site engineering, additives and rental equipment. In addition, we offer a comprehensive line of downhole tools with chemical systems to remove drilling fluid debris from a well during completion operations. We also provide a unique system for delivery of lost circulation materials used in conjunction with completion operations.
We also provide drilling fluids and related technical services to drilling projects in limited geographic markets.
Raw Materials and Equipment
Principal materials used in pressure pumping include cement, fracturing proppants, acid, polymers, nitrogen and other specialty chemical additives. We purchase our principal materials from several suppliers and produce certain materials at our own blending facilities in Germany, Singapore, Canada and the United States. Sufficient material inventories are generally maintained to allow us to provide on-call services to our pressure pumping customers. In fiscal 2008 and earlier years, we experienced intermittent tightness in supply for certain types of fracturing proppants but were generally able to use alternatives with customer acceptance. To limit these occurrences, we entered into agreements with a number of suppliers to ensure that certain levels of materials are maintained in the United States and Canada. Demand for proppants has declined significantly during the economic downturn in fiscal 2009, and the Company has undertaken several initiatives, including renegotiating its supplier contracts, to prevent or limit excess amounts of inventory of certain types of proppants.
Pressure pumping services use complex truck or skid-mounted equipment designed and constructed for the particular pressure pumping service furnished. After equipment is transported to a well location, it is configured with appropriate connections to perform the services required. The mobility of this equipment allows us to provide
8
Table of Contents
pressure pumping services to wellsites in virtually all geographic areas around the world. Most units are equipped with computerized systems that allow for real-time monitoring and control of the cementing and stimulation processes. We believe our pressure pumping equipment is adequate to service both current and projected levels of market activity in the near term.
Repair parts and maintenance items for pressure pumping equipment are held in inventory at levels that we believe will allow continued operations without significant downtime. Historically, we have occasionally experienced intermittent tightness in supply or extended lead times in obtaining necessary supplies of these materials or repair parts. We have encountered no significant supply constraints during fiscal 2009. We do not depend on any single source of supply for any of these parts and materials; however, loss of one or more of our suppliers could temporarily disrupt operations.
We believe that coiled tubing, capillary tubing and other materials used in performing coiled tubing services and capillary services are and will continue to be widely available. Although there are only two principal manufacturers of coiled tubing, we have not experienced any difficulty in obtaining coiled tubing in the past and do not anticipate difficulty in the foreseeable future.
We use a variety of chemicals and other materials in our pressure pumping, chemical services and completion fluids businesses. In addition, nitrogen is one of the principal materials used in our process and pipeline services division and our pressure pumping services operations. We purchase these chemicals and nitrogen from several suppliers, and they are generally widely available. We have experienced only intermittent tightness in supply or extended lead times in obtaining these chemicals and nitrogen and do not expect any chronic shortages in the foreseeable future.
Raw steel, specialty alloys and other metals are commonly utilized in our completion tools business to machine components for well screens and other specialty downhole tools. Numerous suppliers exist for these materials and we do not anticipate any difficulty in sourcing these materials in the foreseeable future.
Engineering Support
Our engineering support efforts are divided into the following areas: Equipment Software, Instrumentation Engineering, Mechanical Engineering, Coiled Tubing Engineering and Completion Tools Engineering.
Equipment Software: Our equipment software group develops and supports a wide range of proprietary software used to monitor both cementing and stimulation job parameters. This software, combined with our internally developed monitoring hardware, allows for real-time job control and post-job analysis.
Instrumentation Engineering: We use an array of monitoring and control instrumentation, which is an integral element of providing cementing and stimulation services. Our monitoring and control instrumentation, developed by our instrumentation engineering group, complements our products and equipment and provides customers with real-time monitoring of critical applications.
Mechanical Engineering: Our mechanical engineering group is responsible for the design of virtually all of our primary pumping and blending equipment. Though similarities exist among the major pressure pumping competitors in the general design of pumping equipment, the actual engine/transmission configurations and the mixing and blending systems differ significantly. Additionally, different approaches to the integrated control systems result in equipment designs that are usually distinct in performance characteristics for each competitor.
Coiled Tubing Engineering: The coiled tubing engineering group provides most of the support and research and development activities for our coiled tubing services. This group is also actively involved in the ongoing development and manufacturing of specialized downhole tools that may be attached to the end of coiled tubing.
Completion Tools Engineering: The completion tools engineering group specializes in the design, manufacture and testing of completion tools. Since completion tools are often installed miles below the earth’s surface, it is critical that potential design flaws be diagnosed and prevented prior to installation. Optimal tool configuration is determined by considering a variety of factors, including raw materials, operating conditions and design specifications.
Tool Services Engineering: The tool services engineering group provides design, manufacture and testing of service tools, permanent packers, liner hanger products, plugs and perforating systems.
9
Table of Contents
Manufacturing
We own two primary manufacturing and assembly facilities in the Houston, Texas area. Our technology center in Tomball, Texas houses our main equipment manufacturing and assembly facility, primarily serving our pressure pumping services operations. Our other facility in the Houston, Texas area produces certain components and spare parts required for the assembly of downhole completion tools, service tools and well screens. We employ outside vendors for manufacturing various units and for engine and transmission rebuilding and certain fabrication work, but we are not dependent on any one vendor for these services.
In addition to the manufacturing facilities mentioned above, we also maintain the following:
| • | Manufacturing facility in Calgary, Alberta, that produces equipment for our tools services and Innicor Perforating Systems operations within the completion tools business; |
| • | Shaped charge manufacturing plant in Standard, Alberta, that produces shaped charge explosives for our perforating guns within the completion tools business; |
| • | Facility in Lafayette, Louisiana, that assembles downhole completion tools for our completion tools business; |
| • | Calcium chloride manufacturing plant in Geismer, Louisiana, that creates liquid calcium chloride for use in our completion fluids business; |
| • | Chemical blending facility in Hobbs, New Mexico, that produces chemicals for use in our chemical services and pressure pumping services businesses. |
Competition
Pressure Pumping Services
The two primary companies with which we compete in pressure pumping services on a global basis are Halliburton Company, and Schlumberger Ltd. These companies have operations in most areas in which we operate and are larger in terms of overall pressure pumping revenue and financial resources. We also compete with Weatherford International Ltd. and numerous smaller companies including Calfrac Well Services Ltd., Trican Well Service Ltd., San Antonio, Superior Well Services and Frac Tech Services Ltd. in certain markets. Since 2007, we have experienced increased competition in the U.S. and Canadian markets from these and other new competitors. Competitive factors impacting our pressure pumping business are price, technology, service record and reputation in the industry.
Oilfield Services Group
We believe that we are one of the largest suppliers of casing and tubular services in the North Sea. We have expanded these services into other international markets in the past several years. The largest worldwide provider of casing and tubular services is Weatherford International Ltd. In addition, we compete with Frank’s International Inc. in the Gulf of Mexico and certain international markets.
We believe we are one of the largest providers of precommissioning and leak detection services and one of the largest providers of pipeline inspection services. Our principal competitors in pipeline inspection are Pipeline Integrity International Ltd. (a division of General Electric), Tuboscope (a subsidiary of National Oilwell Varco) and H. Rosen Engineering GmbH.
There are several competitors significantly larger than us in the chemical services business, including Baker PetroLite (a division of Baker Hughes Incorporated), Champion Technologies, Nalco Energy Services and Clariant.
Our principal competitors in completion tools are Halliburton Company, Schlumberger Ltd, Baker Hughes Incorporated and Weatherford International Ltd. Competitive factors impacting this business are price, technology, service record and reputation in the industry.
Our principal competitors in the completion fluids business are Halliburton’s Baroid Corporation; M-I SWACO, a joint venture of Smith International, Inc. and Schlumberger Ltd; and Tetra Technologies, Inc.
10
Table of Contents
Seasonality
With the exception of the Canadian spring break-up, our business is not significantly impacted by seasonality. Spring break-up is the period during which snow and ice begin to melt and heavy equipment is not permitted on the roads, restricting access to well sites and, therefore, resulting in lower drilling activity. The spring break-up period typically begins in late February or March and extends through May, significantly impacting our business in Canada during the third fiscal quarter.
To a lesser extent, our process and pipeline services business has a seasonal aspect to it, in that maintenance on existing refineries and petrochemical and power plants is typically scheduled by our customers to be performed during the warmer months of the year, which generally correspond to our fiscal third and fourth quarters.
Other weather patterns, such as hurricanes in the Gulf of Mexico, severe rains or flooding in Asia Pacific, or harsh winters in the North Sea or elsewhere, can temporarily disrupt our operations or inhibit or delay our ability to perform services. Such disruptions are generally relatively short in duration and isolated in occurrence.
Markets and Customers
Demand for our services and products depends primarily upon the number of oil and natural gas wells being drilled (“rig count”), the depth and drilling conditions of such wells, the number of well completions and the level of workover activity worldwide. Our principal customers consist of major and independent oil and natural gas producing companies, as well as national oil companies. During fiscal 2009, we provided services to several thousand customers, none of which accounted for more than 5% of consolidated revenue. While the loss of any of our largest customers could have a material adverse effect on our revenue and operating results in the near term, we believe we would be able to obtain other customers for our services in the event of such a loss.
United States
The United States is the largest single pressure pumping market in the world. We provide pressure pumping services to our U.S. customers through a network of more than 50 locations throughout the United States, a majority of which offer both cementing and stimulation services. Demand for our pressure pumping services in the United States is primarily driven by oil and natural gas drilling activity, which tends to be extremely volatile depending on the current and anticipated prices of oil and natural gas. During the last 11 years, the lowest U.S. rig count averaged 601 in fiscal 1999 and the highest U.S. rig count averaged 1,851 in fiscal 2008. The U.S. rig count averaged 1,283 rigs in fiscal 2009, a 31% decrease from the fiscal 2008 average. In fiscal 2008, the average U.S. rig count was 6% higher than the fiscal 2007 U.S. rig count average of 1,749.
Canada
The Canadian market is similar to the United States in that demand for our pressure pumping services is primarily driven by oil and natural gas drilling activity, which tends to be extremely volatile depending on the current and anticipated prices of oil and natural gas. During the last 11 years, the lowest Canadian rig count averaged 212 in fiscal 1999 and the highest Canadian rig count averaged 502 in fiscal 2006. In fiscal 2009, the Canadian rig count averaged 254 rigs, a 31% decrease from the fiscal 2008 average of 366. The fiscal 2008 average Canadian rig count was slightly higher than the fiscal 2007 rig count average.
Our Canadian operations are subject to currency exchange rate fluctuations. The Canadian dollar is the functional currency for this segment. The risk of currency exchange rate fluctuations and their impact on net income are mitigated by using natural hedges in which we invoice for work performed in both U.S. dollars and Canadian dollars. We attempt to match the amounts invoiced in Canadian dollars with the amount of expenses denominated in Canadian dollars. As such, currency exchange rate fluctuations may have a significant impact on our revenues, but we attempt to minimize the impact on operating income by utilizing natural economic hedges.
International
We operate in approximately 50 countries which encompass most of the major international oil and natural gas producing areas of Latin America, Europe, Africa, the Middle East and Asia Pacific. We completed our contractual obligations and shut down our pressure pumping operations in Russia during fiscal 2009; consequently, the historical results of our Russia pressure pumping operations are classified as discontinued operations for all periods presented. We generally provide services to international customers through wholly-owned foreign subsidiaries. Additionally, we hold controlling interests in several joint venture companies through which we conduct a portion of our international operations.
11
Table of Contents
Many countries where we operate are subject to political, social and economic risks which may cause volatility within any given country. However, our international revenue in total is less volatile because we operate in approximately 50 countries, which helps to offset exposure to any one country. Due to the significant investment and complexity of international projects, we believe drilling decisions relating to such projects tend to be evaluated and monitored with a longer-term perspective with regard to oil and natural gas pricing. Additionally, the international market is dominated by major international oil companies and national oil companies, which tend to have different objectives and more operating stability than the typical independent producer in North America. During the last 11 years, the lowest international rig count, excluding Canada and including Mexico, averaged 616 in fiscal 1999 and the highest international rig count averaged 1,061 in fiscal 2008, a 7% increase over the fiscal 2007 average international rig count of 989. In fiscal 2009, the average international rig count was 1,017 rigs, or 4% lower than the fiscal 2008 average.
We operate in most of the major oil and natural gas producing regions of the world. International operations are subject to risks that can materially affect our sales and profits, including currency exchange rate fluctuations, inflation, governmental expropriation, currency controls, political instability and other risks. The risk of currency exchange rate fluctuations and their impact on net income are mitigated by using natural hedges in which we invoice for work performed in certain countries in both U.S. dollars and local currency. We attempt to match the amounts invoiced in local currency with the amount of expenses denominated in local currency.
Research and Development
Our research and development activities are focused on improving existing products and services and developing new technologies designed to meet industry and customer needs. We currently hold numerous patents both inside and outside the United States. Although such patents, in the aggregate, are important to maintaining our competitive position, no single patent is considered to be of a critical or essential nature to our ongoing operations. We also use technologies owned by third parties under various license arrangements, generally ranging from 10 to 20 years in duration, relating to certain products or methods for performing services. None of these license arrangements is material to our overall operations.
We intend to continue to devote significant resources to research and development efforts. For information regarding the amounts of research and development expenses for each of the last three fiscal years, see Note 13 of the Notes to Consolidated Financial Statements.
Some of our key patented and patent-pending technologies include:
| (1) | Fracturing fluids, such as our high-performance SPECTRAFRAC® G and QUADRAFRAC™ systems, and low-polymer loading VISTAR® and LIGHTNING™ fluid systems; |
| (2) | LITEPROP® low-density proppants, capable of producing greater propped fracture length and conductivity than that produced by conventional proppants. These low-density proppants can also be transported to the formations with lower polymer concentration gels than is required by conventional proppants; |
| (3) | AQUACON™ relative water permeability modifier technology and other water control systems for reducing undesirable water production, while increasing oil or natural gas production; |
| (4) | Well cleanout systems, including the TORNADO® and SAND-VAC® systems, effective at removing sand and other fill material from wells at much greater efficiencies than previously obtainable; |
| (5) | FLOWSAFE™ surface-controlled sub-surface safety valves, available in wireline-retrievable and tubing-retrievable options; |
| (6) | INJECTSAFE™ chemical injection system, which provides the functionality of a wireline-retrievable safety valve with an integral capillary tubing flow path to allow continuous chemical treatment up to 22,000 feet (6,700 meters) below the safety valve without interruption or risk to the safety valve; |
| (7) | Polymer-specific enzyme fluid breakers and the EZ CLEAN® polymer-specific enzyme treatment designed to remediate reservoirs that have been damaged by previous fracturing efforts; |
| (8) | Production chemical systems like ICE-CHEK™ inhibitors, which inhibit gas hydrates in extremely cold conditions, and our family of SORB™ products (PARASORB™, ASPHALTSORB™, BIOSORB™, and SCALESORB™ fluids), which are designed to time-release chemicals within a proppant pack; |
| (9) | TEKTOTE® delivery system for the safe and efficient transportation and handling of our TEKPLUG® cross-linked fluid loss systems; |
| (10) | FLEXSAND™ deformable additives to control proppant flowback, while maintaining fracture conductivity; |
12
Table of Contents
| (11) | COMPLETE™ MST (multi-zone, single-trip) completion system, which eliminates several operational steps compared to traditional multi-zone frac-pack/gravel-pack completions, resulting in reduced cost and less nonproduction time; |
| (12) | DIRECT STIM™ completion service, capable of allowing multi-stage fracturing, resulting in reduced cost and less nonproduction time; |
| (13) | TELECOIL™ coiled tubing service, which allows real-time monitoring of downhole pressure, temperature and well-depth verification during a coiled tubing intervention, providing the ability to modify treatment design during job execution resulting in reduced cost and more effective treatment; and |
| (14) | ECOWAVE™ well treatment service, an environmentally friendly method of breaking down undesirable organic deposits in oil and gas wells by use of specially designed radio and microwaves, resulting in increased production. |
Employees
At September 30, 2009, we employed approximately 14,400 personnel around the world. Approximately 63% of our employees are employed outside the United States. In the normal course of business, we use contract personnel to supplement our employee base to meet customer requirements. We believe that our employee relations are generally satisfactory.
Governmental and Environmental Regulation
Our business is affected both directly and indirectly by governmental regulations on a worldwide basis relating to the oil and natural gas industry in general, as well as environmental and safety regulations that have specific application to our business.
Through the routine course of providing services, we handle and store bulk quantities of hazardous materials. If leaks or spills of hazardous materials that are handled, transported or stored by us occur, we may be responsible under applicable environmental laws for costs of remediating any damage to the surface or sub-surface systems (including aquifers). Accordingly, we have implemented and continue to implement various procedures for the handling and disposal of hazardous materials. Such procedures are designed to minimize the occurrence of spills or leaks of these materials. In addition, leak detection services, provided through our process and pipeline services division, involve the inspection and testing of facilities owned by third parties for leaks of hazardous or volatile substances.
We have implemented and continue to implement various procedures to further ensure our compliance with environmental regulations. Such procedures generally pertain to the disposal of empty chemical drums, improvement to acid and wastewater handling facilities, and cleaning certain areas at our facilities located both domestically and internationally. We also have procedures for the operation of underground storage tanks in the United States. In addition, we maintain insurance for certain environmental liabilities.
In the United States, the Comprehensive Environmental Response, Compensation and Liability Act (“CERCLA”), also known as “Superfund,” imposes liability without regard to fault or the legality of the original conduct, on certain classes of persons who contributed to the release of a “hazardous substance” into the environment. Certain disposal facilities owned by third parties but used by us or our predecessors have been investigated under state and federal Superfund statutes, and we are currently named as a potentially responsible party for cleanup at five such sites. Although our level of involvement varies at each site, we are one of numerous parties named and will be obligated to pay an allocated share of the cleanup costs. While it is not feasible to predict the outcome of these matters with certainty, we believe that the ultimate resolutions should not have a materially adverse effect on our results of operations or financial position.
Available Information
Information regarding the Company, including corporate governance policies, ethics policies and charters for the committees of the board of directors can be found on our Internet website at http://www.bjservices.com, and copies of these documents are available to stockholders, without charge, upon request to Investor Relations, BJ Services Company, P.O. Box 4442, Houston, Texas 77210-4442. In addition, our annual reports on Form 10-K, quarterly reports on Form 10-Q, current reports on Form 8-K and amendments to those reports filed or furnished pursuant to Section 13(a) or 15(d) of the Securities Exchange Act of 1934 are made available free of charge on our Internet website on the same day that we electronically file such material with, or furnish it to, the Securities and Exchange Commission (the “SEC”). Information filed with the SEC may be read or copied at the SEC’s Public
13
Table of Contents
Reference Room at 100 F Street, N.E., Washington, D.C. 20549. Information on operation of the Public Reference Room may be obtained by calling the SEC at 1-800-SEC-0330. These filings are also available to the public from commercial document retrieval services and at the Internet website maintained by the SEC at http://www.sec.gov that contains reports, proxy and information statements, and other information regarding issuers that file electronically with the SEC.
| ITEM 1A. | Risk Factors |
This document, our other filings with the SEC, and other materials released to the public contain “forward-looking statements,” within the meaning of the Private Securities Litigation Reform Act of 1995 and Section 21E of the Securities Exchange Act of 1934 concerning, among other things, our prospects, expected revenue, expenses and profits, developments and business strategies for our operations and other subjects, including conditions in the oilfield service and oil and natural gas industries and in the United States and international economy in general.
Our forward-looking statements are based on assumptions that we believe to be reasonable but that may not prove to be accurate. All of our forward-looking information is, therefore, subject to risks and uncertainties that could cause actual results to differ materially from the results expected. Although it is not possible to identify all factors, these risks and uncertainties include the risk factors discussed below.
Business Risks
Our results of operations could be adversely affected if our business assumptions do not prove to be accurate or if adverse changes occur in our business environment, including the following areas:
| • | general global economic and business conditions, which affect demand for oil and natural gas and, in turn, our business, |
| • | our ability to manage risks related to our business and operations, |
| • | our ability to expand our products and services (including those we acquire) into new geographic markets, |
| • | our ability to compete against companies that provide more services and products than we do, including “integrated service companies”, |
| • | our ability to compete against low-cost providers, particularly in the North America pressure pumping market, |
| • | our ability to grow businesses we have acquired such that our investment can be fully realized, |
| • | our ability to generate technological advances and compete on the basis of advanced technology in markets where that is required, |
| • | our ability to attract and retain skilled, trained personnel to provide technical services and support for our business, |
| • | our ability to procure sufficient supplies of materials essential to our business, such as cement, proppants (including sand), certain chemicals, and specialty metals in periods of high demand, and to reduce our commitments for such materials in periods of low demand, |
| • | competition in our business, including competition from service subsidiaries of national oil companies in some international markets, |
| • | consolidation by our customers, which could result in loss of a customer, and |
| • | changes in laws or regulations, including laws relating to the environment or to the oil and gas industry in general, and other factors, many of which are beyond our control. |
Risks related to the Worldwide Oil and Natural Gas Industry
Conditions in the oil and natural gas industry are subject to factors beyond our control. Demand for our products and services is dependent upon the level of oil and natural gas exploration and development activity in market sectors worldwide. The level of worldwide oil and natural gas development activity is primarily influenced by the price of crude oil and natural gas, as well as expectations about future crude oil and natural gas prices. The availability of quality drilling prospects, exploration success, relative production costs, the stage of reservoir development, and political and regulatory environments can also affect the demand for our services. Worldwide military, political and economic events, including uncertainty or instability resulting from escalation or outbreaks of armed hostilities and acts of terrorism have contributed to oil and natural gas price volatility and are likely to do so in the future. Prolonged periods of historically lower drilling activity could have a materially adverse impact on our financial condition, results of operations and cash flows.
14
Table of Contents
Risks from the Economic Downturn and Lower Oil and Natural Gas Prices
Recent economic data indicate that the economic downturn in the United States and worldwide may continue for some time. Prolonged periods of economic decline or little or no economic growth will likely decrease demand for oil and natural gas, which could result in lower prices for crude oil and natural gas and therefore lower demand and lower pricing for our products and services. The extent of the impact of these factors on our results of operations and cash flows depends on the severity and length of the decreased demand for our services and lower pricing. Crude oil and natural gas prices have declined significantly from their historic highs in July 2008, and if they continue, such price declines can be expected to further reduce drilling activity and demand for our services. In addition, most of our customers are involved in the energy industry, and if a significant number of them experience a prolonged business decline or disruption as a result of economic slowdown or lower crude oil and natural gas prices, we may incur increased exposure to credit risk and bad debts. A prolonged economic downturn could have a materially adverse impact on our financial condition, results of operations and cash flows.
Risks related to Global Credit Crisis
Changes in the global credit markets during fiscal 2009 have significantly impacted the availability of credit and financing costs for many of our customers. Many of our customers finance their drilling and production programs through third-party lenders. The reduced availability and increased costs of borrowing have been a factor in our customers reducing their spending on drilling programs, thereby reducing demand and contributing to lower pricing for our products and services. An adverse credit and economic environment over a period of time could significantly impact the financial condition of some customers, leading to business disruptions and restricting their ability to pay for services performed, which could negatively impact our results of operations and cash flows.
In addition, some financial institutions and insurance companies have reported significant deterioration in their financial condition during fiscal 2009. Our forward-looking statements assume that our lenders, insurers and other financial institutions will be able to fulfill their obligations under our various credit agreements, insurance policies and contracts. If any of our significant financial institutions were unable to perform under such agreements, and if we were unable to find suitable replacements at a reasonable cost, our results of operations, liquidity and cash flows could be adversely impacted.
Risks from Changing Competitive Conditions
Beginning in 2006, in response to market demand, a number of new competitors began entering the North American pressure pumping market, competing with our pressure pumping services business, particularly in fracturing services. These competitors often offered low-cost services without the advanced technology and associated support services offered by us and our larger competitors. In addition, as a result of increased market activity through mid-2008, we and our competitors added pressure pumping equipment capacity into North America. Now that market conditions have declined, this additional capacity has contributed to the competitive environment for our services and products. The market for our fracturing services and many of our other oilfield services and products in North America is currently extremely competitive. As long as these conditions persist, our results of operations will depend on our ability to compete effectively in this market and adjust our operating cost structure to the level of market activity.
In some international markets, our larger competitors that offer more product and service lines than we do often use “bundling” of their services to compete with us. Bundling involves offering a discounted price if the customer uses more of the competitor’s products or services. Also, some international projects require “integrated service” bids, in which bids include all work required by the customer on the particular project. In these cases, we often bid jointly with other companies who offer services we do not provide. If the practice of bundling of services and integrated service projects become more prevalent, our business could be at a competitive disadvantage. Our ability to successfully compete for integrated services projects will largely depend on our success in finding suitable bid partners or in adding additional product or service offerings and successfully integrating them into our international operations.
In addition, in a few countries, the national oil companies have formed subsidiaries to provide oilfield services for them, competing with services provided by us. To the extent this practice expands, our business could be adversely impacted.
15
Table of Contents
Risks from Operating Hazards
Our operations are subject to hazards present in the oil and natural gas industry, such as fire, explosion, blowouts, oil spills, and leaks or spills of hazardous materials. These incidents as well as accidents or problems in normal operations can cause personal injury or death and damage to property or the environment. The customer’s operations can also be interrupted. From time to time, customers seek recovery from us for damage to their equipment or property that occurred while we were performing services. Damage to the customer’s property could be extensive if a major problem occurred. For example, operating hazards could arise:
| • | in the pressure pumping, completion fluids, completion tools, and casing and tubular services businesses, during work performed on oil and natural gas wells, |
| • | in the chemical services business, as a result of use of our products in oil and natural gas wells and refineries, and |
| • | in the process and pipeline business, as a result of work performed by us at petrochemical plants and on pipelines. |
Risks from Litigation
We have insurance coverage against some operating hazards. This insurance has deductibles or self-insured retentions and contains certain coverage exclusions. Our insurance premiums may increase or decrease, and some forms of insurance may become unavailable altogether, based on market conditions and our claims history under our insurance policies. The insurance does not cover damages from breach of contract by us or based on alleged fraud or deceptive trade practices. Whenever possible, we obtain agreements from customers that limit our liability. Insurance and customer agreements do not provide complete protection against losses and risks, and our results of operations could be adversely affected by claims not covered by insurance.
Risks from Ongoing Investigations
The U.S. Department of Justice (“DOJ”), the SEC and other authorities have a broad range of civil and criminal sanctions under the U.S. Foreign Corrupt Practices Act (the “FCPA”) and other laws, which they may seek to impose in appropriate circumstances. Recent civil and criminal settlements with a number of public corporations and individuals have included multimillion-dollar fines, disgorgement, injunctive relief, guilty pleas, deferred prosecution agreements and other sanctions, including requirements that corporations retain a monitor to oversee compliance with the FCPA. We have voluntarily disclosed information found in our internal investigations to the DOJ and the SEC and have engaged in discussions with these authorities in connection with our review of possible illegal payments. We cannot currently predict the outcome of our investigations, when any of these matters will be resolved, or what, if any, actions may be taken by the DOJ, the SEC or other authorities or the effect the actions may have on our business or consolidated financial statements. For further information regarding our investigations, see Note 11 of the Notes to Consolidated Financial Statements.
Risks from International Operations
Our international operations are subject to special risks that can materially affect our sales and profits. These risks include:
| • | limits on access to international markets, |
| • | unsettled political conditions, war, civil unrest and hostilities in some petroleum-producing and consuming countries and regions where we operate or seek to operate, |
| • | declines in, or suspension of, activity by our customers in our areas of operations due to adverse local or regional economic, political and other conditions that reduce drilling operations, |
| • | fluctuations and changes in currency exchange rates, |
| • | the impact of inflation, |
| • | the risk that our ultimate tax liability may be significantly different than expected due to different interpretations of local tax laws and tax treaties, estimates and assumptions made regarding the scope of and timing of income earned and changes in tax laws, |
16
Table of Contents
| • | governmental action such as expropriation of assets, and changes in general legislative and regulatory environments, currency controls, global trade policies such as trade restrictions and embargoes imposed and international business, political and economic conditions, |
| • | terrorist attacks and threats of attacks, which have increased the political and economic instability in some of the countries in which we operate, and |
| • | the risk that events or actions taken by us or others as a result of our currently ongoing investigations (see “Management’s Discussion and Analysis – Investigations Regarding Misappropriation and Possible Illegal Payments”) adversely affect our operations and our competitive position in the affected countries. |
Risks Related to Weather
Our performance is significantly impacted by the demand for natural gas in North America. Warmer than normal winters in North America, among other factors, may adversely impact demand for natural gas and, therefore, demand for our services. In addition, our U.S. operations could be materially affected by severe weather in the Gulf of Mexico. Severe weather, such as hurricanes, may cause:
| • | evacuation of personnel and curtailment of services, |
| • | damage to offshore drilling rigs, resulting in suspension of operations, and |
| • | loss of or damage to our equipment, inventory and facilities. |
If material, damage from any such adverse weather conditions could adversely affect our financial condition, results of operations and cash flows.
Risks from Lower Credit Rating
If our credit rating is downgraded below investment grade, this could increase our costs of obtaining, or make it more difficult to obtain or issue, new debt financing. If our credit rating is downgraded, we could be required to, among other things, pay additional interest under our credit agreements, or provide additional guarantees, collateral, letters of credit or cash for credit support obligations.
Risks from Government Regulation or Changes in Law
A variety of regulatory developments, proposals or requirements have been introduced in the domestic and international regions in which we operate that are focused on restricting the emission of carbon dioxide, methane and other greenhouse gases. Among these developments are the United Nations Framework Convention on Climate Change, also known as the “Kyoto Protocol” (an internationally applied protocol, which has been ratified in Canada, one of our reporting segments), the Regional Greenhouse Gas Initiative or “RGGI” in the Northeastern United States, and the Western Regional Climate Action Initiative in the Western United States. Also, in 2007, the U.S. Supreme Court held in Massachusetts, et al. v. EPA that greenhouse gases are an “air pollutant” under the federal Clean Air Act and thus subject to future regulation.
On June 26, 2009, the U.S. House of Representatives approved adoption of the “American Clean Energy and Security Act of 2009,” also known as the “Waxman-Markey Cap-and-Trade legislation,” or “ACESA.” The purpose of ACESA is to control and reduce emissions of greenhouse gases in the United States. The U.S. Senate has begun work on its own legislation for controlling and reducing emissions of greenhouse gases in the United States. For legislation to become law, both chambers of congress would be required to approve identical legislation. It is not possible at the time to predict whether or when the Senate may act on climate change legislation, how any bill approved by the Senate would be reconciled with ACESA, or how federal legislation may be reconciled with state and regional requirements.
Recently, the Environmental Protection Agency (the “EPA”) issued the Final Mandatory Reporting of Greenhouse Gases Rule. This rule will be effective December 29, 2009 and will require the collection of information beginning in January 2010 with annual reporting to begin in 2011 for covered facilities. The rule requires reporting of greenhouse gas emissions from large sources ad suppliers in the United States and the EPA has stated that it will use the information to guide development of the policies and programs to reduce emissions.
These regulatory developments may curtail production and demand for fossil fuels such as oil and gas in areas of the world where our customers operate and thus adversely affect future demand for our products and services, which may in turn adversely affect our future results of operations.
17
Table of Contents
In June 2009, legislation was introduced in the U.S. Congress that would authorize the EPA to regulate hydraulic fracturing under the Clean Water Act. Such regulations, if enacted, could greatly reduce or eliminate demand for a substantial portion of our pressure pumping services in the United States, and we could suffer a significant adverse impact on our future results of operations. We are unable to predict whether this proposed legislation or any other proposals will ultimately be enacted and, if so, the impact on our business.
Other Risks
Other risk factors could cause actual results to be different from the results we expect. The market price for our common stock, as well as other companies in the oil and natural gas industry, has been historically volatile, which could restrict our access to capital markets in the future. Other risks and uncertainties may be detailed from time to time in our filings with the SEC.
Many of these risks are beyond our control. In addition, future trends for pricing, margins, revenue and profitability remain difficult to predict in the industries we serve and under current market, economic and political conditions. Forward-looking statements speak only as of the date they are made and except as required by applicable law, we do not assume any responsibility to update or revise any of our forward-looking statements.
| ITEM 1B. | Unresolved Staff Comments |
None.
| ITEM 2. | Properties |
We own our corporate office in Houston, Texas. Other properties are either owned or leased and typically serve all of our business lines. These properties are located near major oil and natural gas fields to optimally address our customers’ needs. Administrative offices and facilities have been built on these properties to support our business through regional and district facilities in approximately 200 locations worldwide, none of which are individually significant due to the mobility of the equipment, as discussed in “Business - Raw Materials and Equipment.”
In addition, we own or lease the following manufacturing facilities:
| Location |
Owned/Leased |
Description | ||
| Tomball, Texas |
Owned | Research and technology center housing our main equipment and instrumentation manufacturing operation, primarily serving pressure pumping services | ||
| Houston, Texas |
Owned | Produces certain components and spare parts required for the assembly of downhole completion tools, service tools and well screens | ||
| Lafayette, Louisiana |
Owned | Assembly of downhole completion tools and administrative offices related to completion tools | ||
| Calgary, Alberta |
Leased | Manufacture and assembly of downhole service tools for our completion tools business | ||
| Standard, Alberta |
Owned | Manufactures shaped charges included in our downhole tools product offering | ||
| Geismer, Louisiana |
Owned | Creates liquid calcium chloride through a reaction process for use in our completion fluids business | ||
| Hobbs, New Mexico |
Owned | Produces chemicals for use in chemical services and pressure pumping services | ||
Our equipment consists primarily of pressure pumping and blending units and related support equipment such as bulk storage and transport units. Although a portion of our U.S. pressure pumping and blending fleet is being utilized through a servicing agreement with an outside party (see Lease and Other Long-Term Commitments in Note 11 of the Notes to Consolidated Financial Statements), most of our worldwide fleet is owned and unencumbered. Our tractor fleet, most of which is owned, is used to transport the pumping and blending units. The majority of our light duty truck fleet, both in the U.S. and international operations, is also owned.
18
Table of Contents
We believe our facilities and equipment are adequate for our current operations, although future growth of our business in certain areas may require facility expansion or new facilities. For additional information with respect to our lease commitments, see Note 11 of the Notes to Consolidated Financial Statements.
| ITEM 3. | Legal Proceedings |
The information regarding litigation and environmental matters described in Note 11 of the Notes to Consolidated Financial Statements included elsewhere in this Annual Report on Form 10-K is incorporated herein by reference.
| ITEM 4. | Submission of Matters to a Vote of Security Holders |
No matters were submitted for a vote of stockholders during the fourth quarter of the fiscal year ended September 30, 2009.
19
Table of Contents
| ITEM 5. | Market for Registrant’s Common Equity, Related Stockholder Matters and Issuer Purchases of Equity Securities |
Our common stock began trading on the New York Stock Exchange (“NYSE”) in July 1990 under the symbol “BJS.” At November 17, 2009, there were approximately 1,228 holders of record of our common stock.
The table below sets forth for the periods indicated the high and low sales prices per share of our common stock reported on the NYSE composite tape.
| Common Stock Price Range | ||||||
| High | Low | |||||
| Fiscal 2009 |
||||||
| 1st Quarter |
$ | 18.91 | $ | 8.34 | ||
| 2nd Quarter |
13.44 | 8.72 | ||||
| 3rd Quarter |
17.00 | 9.45 | ||||
| 4th Quarter |
20.06 | 12.00 | ||||
| Fiscal 2008 |
||||||
| 1st Quarter |
$ | 28.79 | $ | 23.12 | ||
| 2nd Quarter |
29.00 | 19.30 | ||||
| 3rd Quarter |
33.66 | 26.93 | ||||
| 4th Quarter |
34.94 | 18.12 | ||||
At September 30, 2009, there were 347,510,648 shares of common stock issued and 292,155,129 shares outstanding. Our authorized number of shares of common stock is 910,000,000 shares. The closing sale price per share of our common stock on November 17, 2009 was $19.73.
Stock Repurchases
In 1997, our Board of Directors initiated a stock repurchase program, which through a series of increases, authorizes the repurchase of up to $2.2 billion of Company stock. Repurchases are made at the discretion of management and the program will remain in effect until terminated by our Board of Directors. During the first quarter of fiscal 2009, we purchased a total of 3,466,500 shares at a cost of $44.2 million. We had no treasury stock purchases during the fourth quarter of fiscal 2009. During fiscal 2008, we purchased a total of 101,400 shares at a cost of $2.1 million. We purchased 86,638,339 shares at a cost of $1,805.3 million through fiscal 2007. We currently have remaining authorization to purchase up to an additional $348.4 million in common stock under the repurchase program. However, under the Merger Agreement, we have agreed not to repurchase any common stock without the approval of Baker Hughes, and we do not expect to repurchase any more shares under this repurchase program while the Merger is pending.
Dividend Program
We have paid cash dividends in the amount of $0.05 per common share each quarter since the fourth quarter of fiscal 2005. We anticipate paying cash dividends in the amount of $0.05 per common share on a quarterly basis in fiscal 2010, until such time as the Merger with Baker Hughes is completed. Dividends declared but not yet paid prior to the closing date of the Merger will be paid upon the closing of the Merger. Dividends are subject to approval by our Board of Directors each quarter, and the Board has the ability to change the dividend policy at any time.
20
Table of Contents
Performance Graph – Total Stockholder Return
The following is a line graph comparing cumulative, five-year total shareholder return with a general market index (the S&P 500) and a group of peers in the same line of business or industry selected by the Company. The peer group is comprised of the following companies: Baker Hughes Incorporated, Halliburton Company, Schlumberger N.V., Smith International, Inc. and Weatherford International Ltd.
The graph shall not be deemed incorporated by reference by any general statement incorporating by reference this Form 10-K into any filing under the Securities Act of 1933, as amended, or the Securities Exchange Act of 1934, as amended, except to the extent that the Company specifically incorporates this information by reference, and shall not otherwise be deemed filed under such Acts.
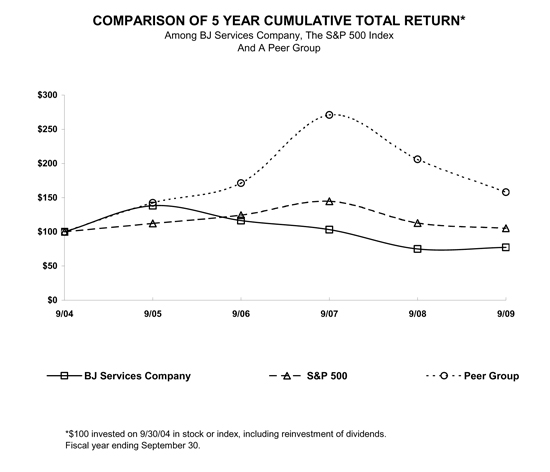
21
Table of Contents
| ITEM 6. | Selected Financial Data |
The following table sets forth certain selected historical financial data and should be read in conjunction with “Management’s Discussion and Analysis of Financial Condition and Results of Operations” and the Consolidated Financial Statements and Notes thereto which are included elsewhere herein. The selected operating and financial position data as of and for each of the five years in the period ended September 30, 2009 have been derived from our audited consolidated financial statements, some of which appear elsewhere in this Annual Report on Form 10-K. Our historical results are not necessarily indicative of results to be expected in future periods.
We completed our contractual obligations and shut down our pressure pumping operations in Russia during fiscal 2009; consequently, the historical results of our Russia pressure pumping operations are classified as discontinued operations for all periods presented. See Note 3 of the Notes to Consolidated Financial Statements.
| As of and for the Year Ended September 30, | ||||||||||||||||||||
| 2009 | 2008 | 2007 | 2006 | 2005 | ||||||||||||||||
| (in thousands, except per share amounts) | ||||||||||||||||||||
| Operating Data: |
||||||||||||||||||||
| Revenue |
$ | 4,121,897 | $ | 5,359,077 | $ | 4,730,493 | $ | 4,291,879 | $ | 3,170,741 | ||||||||||
| Operating expenses(1) |
(3,892,623 | ) | (4,445,783 | ) | (3,577,895 | ) | (3,119,035 | ) | (2,536,932 | ) | ||||||||||
| Operating income |
229,274 | 913,294 | 1,152,598 | 1,172,844 | 633,809 | |||||||||||||||
| Interest income (expense), net |
(26,024 | ) | (26,195 | ) | (31,117 | ) | 356 | 330 | ||||||||||||
| Other income (expense), net(2) |
(9,083 | ) | (8,579 | ) | (7,600 | ) | (1,297 | ) | 15,947 | |||||||||||
| Income tax expense |
(28,196 | ) | (258,034 | ) | (360,073 | ) | (367,414 | ) | (200,185 | ) | ||||||||||
| Income from continuing operations |
$ | 165,971 | $ | 620,486 | $ | 753,808 | $ | 804,489 | $ | 449,901 | ||||||||||
| Net income |
$ | 149,943 | $ | 609,365 | $ | 753,640 | $ | 804,610 | $ | 453,042 | ||||||||||
| Depreciation and amortization |
$ | 296,165 | $ | 263,970 | $ | 206,609 | $ | 162,602 | $ | 132,415 | ||||||||||
| Capital expenditures(3) |
394,192 | 605,584 | 741,795 | 456,087 | 318,764 | |||||||||||||||
| Per Share Data(4): |
||||||||||||||||||||
| Income from continuing operations: |
||||||||||||||||||||
| Basic |
$ | 0.57 | $ | 2.11 | $ | 2.57 | $ | 2.55 | $ | 1.39 | ||||||||||
| Diluted |
0.57 | 2.10 | 2.55 | 2.52 | 1.37 | |||||||||||||||
| Net income: |
||||||||||||||||||||
| Basic |
0.51 | 2.08 | 2.57 | 2.55 | 1.40 | |||||||||||||||
| Diluted |
0.51 | 2.06 | 2.55 | 2.52 | 1.38 | |||||||||||||||
| Cash dividends declared |
0.20 | 0.20 | 0.20 | 0.20 | 0.17 | |||||||||||||||
| Financial Position Data (at end of period): |
||||||||||||||||||||
| Property, net |
$ | 2,374,323 | $ | 2,280,348 | $ | 1,931,267 | $ | 1,366,664 | $ | 1,057,339 | ||||||||||
| Total assets |
5,146,923 | 5,321,908 | 4,715,212 | 3,862,288 | 3,409,642 | |||||||||||||||
| Long-term debt and capital leases, excluding current maturities |
502,167 | 506,220 | 252,709 | 500,140 | 455 | |||||||||||||||
| Stockholders’ equity |
3,519,917 | 3,441,807 | 2,851,398 | 2,146,940 | 2,492,041 | |||||||||||||||
| (1) | Fiscal 2009 includes a $21.7 million pension settlement charge. See Note 10 of the Notes to Consolidated Financial Statements. |
| (2) | Fiscal 2005 includes $9.0 million in misappropriated funds from the Asia Pacific region repaid to us and $9.5 million for the reversal of excess accrued liabilities in the Asia Pacific region. See Note 11 of the Notes to Consolidated Financial Statements. |
| (3) | Excluding acquisitions of businesses. Includes $47.8 million in fiscal 2007 to purchase assets from an equipment financing partnership. See Note 11 of the Notes to Consolidated Financial Statements. |
| (4) | Per share amounts have been restated to reflect the increased number of common shares outstanding resulting from the 2-for-1 stock split effective September 1, 2005. |
22
Table of Contents
| ITEM 7. | Management’s Discussion and Analysis of Financial Condition and Results of Operations |
Business
We are engaged in providing pressure pumping services and other oilfield services to the oil and natural gas industry worldwide. Services are provided through four business segments: U.S./Mexico Pressure Pumping, Canada Pressure Pumping, International Pressure Pumping and the Oilfield Services Group.
The U.S./Mexico, Canada and International Pressure Pumping segments provide stimulation and cementing services to the petroleum industry throughout the world. Stimulation services are designed to improve the flow of oil and natural gas from producing formations. Cementing services consists of pumping a cement slurry into a well between the casing and the wellbore to isolate fluids that might otherwise damage the casing and/or affect productivity, or that could migrate to different zones, primarily during the drilling and completion phases of a well. See “Business” included elsewhere in this Annual Report on Form 10-K for more information on these operations.
The Oilfield Services Group consists of casing and tubular services, process and pipeline services, chemical services, completion tools and completion fluids services in the United States and in select markets internationally.
Baker Hughes Merger Agreement
On August 30, 2009, we and Baker Hughes Incorporated (“Baker Hughes”) entered into an Agreement and Plan of Merger (the “Merger Agreement”), pursuant to which we will merge with and into a wholly-owned subsidiary of Baker Hughes, and each share of our common stock will be converted into the right to receive 0.40035 shares of Baker Hughes common stock and $2.69 in cash (the “Merger”). Completion of the Merger is subject to customary closing conditions, including (i) approval of the Merger by our stockholders, (ii) approval by the stockholders of Baker Hughes of the issuance of Baker Hughes common stock to execute the Merger, (iii) applicable regulatory approvals, including the termination or expiration of the applicable waiting period under the Hart-Scott-Rodino Antitrust Improvements Act of 1976, as amended, (iv) the effectiveness of a registration statement on Form S-4 relating to the Baker Hughes common stock to be issued in the Merger, and (v) other customary closing conditions.
Under the Merger Agreement, we agreed to conduct our business in the ordinary course while the Merger is pending, and to generally refrain from acquiring new businesses, incurring new indebtedness, repurchasing treasury shares, issuing new common stock or equity awards, or entering into new material contracts or commitments outside the normal course of business, without the consent of Baker Hughes. Under certain circumstances, we or Baker Hughes may be required to pay a termination fee of $175 million to the other party if the Merger is not completed. When and if the Merger is approved or completed, certain contractual obligations of the Company will or may be triggered or accelerated under the “change of control” provisions of such contractual arrangements. Examples of such arrangements include stock-based compensation awards, severance and retirement plan agreements applicable to executive officers, directors and certain employees, and the equipment partnership described in Note 11 of the Notes to Consolidated Financial Statements.
We and Baker Hughes are working to comply with the Department of Justice’s second request for additional information and documentary material issued October 14, 2009, and to complete the Merger as quickly as practicable, and we currently expect the Merger to be completed during our second fiscal quarter of fiscal 2010. However, we cannot predict with certainty when the Merger will be completed, because completion of the Merger is subject to conditions both within and beyond our control.
Market Conditions
Our worldwide operations are primarily driven by the number of oil and natural gas wells being drilled, the depth and drilling conditions of such wells, the number of well completions and the level of workover activity. Drilling and workover activity, in turn, is largely dependent on the price of crude oil and natural gas and the volatility and expectations of future oil and natural gas prices. Our results of operations also depend heavily on the pricing we receive from our customers, which depends on activity levels, availability of equipment and other resources, and competitive pressures. These market factors often lead to volatility in our revenue and profitability, especially in the United States and Canada, where we have historically generated in excess of 50% of our revenue.
23
Table of Contents
Historical market conditions are reflected in the table below for our fiscal years ended September 30:
| 2009 | % Change | 2008 | % Change | 2007 | |||||||||||
| Rig Count(1): |
|||||||||||||||
| U.S. |
1,283 | -31 | % | 1,851 | 6 | % | 1,749 | ||||||||
| Canada |
254 | -31 | % | 366 | 0 | % | 365 | ||||||||
| International(2) |
1,017 | -4 | % | 1,061 | 7 | % | 989 | ||||||||
| Commodity Prices (average): |
|||||||||||||||
| Crude Oil (West Texas Intermediate) |
$ | 57.28 | -47 | % | $ | 107.64 | 67 | % | $ | 64.62 | |||||
| Natural Gas (Henry Hub) |
$ | 4.47 | -50 | % | $ | 9.00 | 30 | % | $ | 6.90 | |||||
| (1) | Estimate of drilling activity as measured by average active drilling rigs based on Baker Hughes Inc. rig count information. |
| (2) | Excludes Canada, and includes Mexico rig count of 124, 100 and 90 for the fiscal years ended September 30, 2009, 2008 and 2007 respectively. |
U.S. Rig Count
Demand for our pressure pumping services in the United States is primarily driven by oil and natural gas drilling activity, which tends to be extremely volatile, depending on the current and anticipated prices of crude oil and natural gas. During the last 11 years, the lowest annual U.S. rig count averaged 601 in fiscal 1999 and the highest annual U.S. rig count averaged 1,851 in fiscal 2008.
With the retraction of oil and natural gas prices since their peak in July 2008, tightening and uncertainty in the credit markets, and the global economic slowdown, drilling activity in the United States has rapidly declined from peak levels of 2,031 rigs at September 12, 2008 to a recent low of 876 rigs at June 12, 2009 before gradually improving during our fiscal fourth quarter. U.S. rig count was 1,024 rigs at October 2, 2009. The near-term and longer range outlook for U.S. drilling activity is uncertain, and will ultimately be influenced by a number of factors, including commodity prices, global demand for oil and natural gas, production and depletion rates of oil and natural gas reserves, and government policy with respect to the financial credit crisis, energy and environmental issues, and other issues impacting our business.
Canadian Rig Count
The demand for our pressure pumping services in Canada is primarily driven by oil and natural gas drilling activity and, similar to the United States, tends to be extremely volatile. During the last 11 years, the lowest annual rig count averaged 212 in fiscal 1999 and the highest annual rig count averaged 502 in fiscal 2006. Similar to activity in the United States, drilling rig activity in Canada has declined significantly since late September 2008. Rig count in Canada typically encounters significant seasonal fluctuations, decreasing during the spring break-up period when snow and ice begin to melt and heavy equipment is not permitted on the roads, restricting access to well sites and, therefore, resulting in lower drilling activity. The spring break-up period typically begins in late February or March and extends through May. Drilling activity in Canada was generally slow to resume after spring break-up in fiscal 2009 due to adverse market conditions. At October 2, 2009, the Canadian drilling rig count was 238 rigs.
International Rig Count
Many countries in which we operate are subject to political, social and economic risks which may cause volatility within any given country. However, our international revenue in total is less volatile because we operate in approximately 50 countries, which helps to offset exposure to any one country. Due to the significant investment and complexity of international projects, we believe drilling decisions relating to such projects tend to be evaluated and monitored with a longer-term perspective with regard to oil and natural gas pricing. Additionally, the international market is dominated by major oil companies and national oil companies which tend to have different objectives and more operating stability than the typical independent producer in North America. During the last 11 years, the lowest annual international rig count, excluding Canada and including Mexico, averaged 616 in fiscal 1999 and the highest annual international rig count averaged 1,061 in fiscal 2008. International rig count declined during fiscal 2009 compared to fiscal 2008, but at a much lower rate than North America.
In response to prevailing market conditions, we have implemented a number of cost reduction measures in the United States, Canada and certain markets outside of North America. Such measures include reducing personnel levels, managing our supply chain to reduce material costs, reducing capital spending and controlling our investment in working capital.
24
Table of Contents
Results of Operations
Consolidated
(dollars in millions)
| 2009 | % Change | 2008 | % Change | 2007 | ||||||||||||||
| Revenue |
$ | 4,121.9 | -23 | % | $ | 5,359.1 | 13 | % | $ | 4,730.5 | ||||||||
| Operating income |
229.3 | -75 | % | 913.3 | -21 | % | 1,152.6 | |||||||||||
| Operating income margin |
5.6 | % | 17.0 | % | 24.4 | % | ||||||||||||
| Worldwide rig count(1) |
2,554 | -22 | % | 3,278 | 6 | % | 3,103 | |||||||||||
| (1) | Estimate of drilling activity as measured by average active drilling rigs based on Baker Hughes Inc. rig count information. |
Results for fiscal 2009 compared to fiscal 2008
In fiscal 2009, the impact of the global economic downturn and decreased demand for oil and natural gas, combined with intense price competition in North America negatively affected each of our reporting segments compared to the prior year. Consolidated revenue for fiscal 2009 decreased 23% compared to fiscal 2008, and consolidated operating income decreased 75%, primarily as a result of decreased demand and intense price competition for our products and services, most notably in the United States and Canada. Results for fiscal 2009 included unusual charges, including a non-cash charge of $21.7 million related to the settlement of a U.S. defined benefit pension plan, employee severance costs of $11.1 million, $15.4 million in non-cash charges related to excess or idle fixed assets, $10.0 million of non-cash inventory write-downs, and $5.3 million of costs related to the pending Merger with Baker Hughes. These unusual charges during fiscal 2009 represented 1.5% of consolidated revenue. For fiscal 2009, consolidated operating income margin decreased to 6% from 17% in fiscal 2008.
Results for fiscal 2008 compared to fiscal 2007
Consolidated revenue for fiscal 2008 increased 13% compared to fiscal 2007, with all of our reportable segments showing sequential revenue growth. Revenue from U.S./Mexico Pressure Pumping Services increased 8% from fiscal 2007 as a result of higher activity levels largely offset by lower pricing for our products and services. Revenue from our Canada and International Pressure Pumping Services increased 14% and 18%, respectively. The Canadian increase was primarily attributable to favorable exchange rates and the International increase was the result of increased activity in the Middle East, Asia Pacific and Latin America. During 2008, our Oilfield Services Group’s revenue increased 22%, largely as a result of increased international activity and, to a lesser extent, the acquisition of Innicor Subsurface Technologies Inc. in May 2008.
Despite improved revenue from all of our reportable segments, consolidated operating income margin declined from 24% in fiscal 2007 to 17% in fiscal 2008. Declining prices for our products and services in the North American market as well as increased material and fuel costs led to the overall decline in operating income margin.
See discussion below on individual reporting segments for further revenue and operating income variance details.
U.S./Mexico Pressure Pumping Segment
(dollars in millions)
| 2009 | % Change | 2008 | % Change | 2007 | ||||||||||||||
| Revenue |
$ | 1,853.8 | -32 | % | $ | 2,743.4 | 8 | % | $ | 2,534.6 | ||||||||
| Operating income |
104.1 | -83 | % | 597.8 | -32 | % | 874.8 | |||||||||||
| Operating income margin |
5.6 | % | 21.8 | % | 34.5 | % | ||||||||||||
| U.S. rig count(1) |
1,283 | -31 | % | 1,851 | 6 | % | 1,749 | |||||||||||
| Mexico rig count(1) |
124 | 24 | % | 100 | 11 | % | 90 | |||||||||||
| Total U.S. / Mexico rig count |
1,407 | -28 | % | 1,951 | 6 | % | 1,839 | |||||||||||
| (1) | Estimate of drilling activity as measured by average active drilling rigs based on Baker Hughes Inc. rig count information. |
25
Table of Contents
Results for fiscal 2009 compared to fiscal 2008
Fiscal 2009 revenue for our U.S./Mexico Pressure Pumping segment decreased 32% with average active drilling rigs for the U.S. and Mexico decreasing 28% when compared to fiscal 2008. This revenue decrease was primarily the result of lower pricing and decreased demand for our products and services within the U.S. market, partially offset by increased activity in Mexico.
U.S./Mexico Pressure Pumping operating income margin decreased from 22% in fiscal 2008 to 6% for fiscal 2009 as increased competition in the United States resulted in lower pricing for our products and services. The results for fiscal 2009 also include $13.9 million of non-cash charges related to excess or idle fixed assets, $4.7 million in inventory charges and $5.1 in employee severance costs.
Results for fiscal 2008 compared to fiscal 2007
Fiscal 2008 revenue for our U.S./Mexico Pressure Pumping segment increased 8% compared to fiscal 2007, with average active drilling rigs increasing 6%. All of the operating regions within our U.S./Mexico Pressure Pumping segment, except the Gulf Coast, showed improved revenue from fiscal 2007. While U.S. activity increased for fiscal 2008 compared to fiscal 2007, the prices we received for our products and services declined.
U.S./Mexico Pressure Pumping operating income margin decreased from 35% in fiscal 2007 to 22% for fiscal 2008. A decline in prices coupled with increased material, maintenance and fuel costs caused the fiscal 2008 operating income margin decline.
Canada Pressure Pumping Segment
(dollars in millions)
| 2009 | % Change | 2008 | % Change | 2007 | ||||||||||||||
| Revenue |
$ | 309.4 | -30 | % | $ | 442.5 | 14 | % | $ | 386.5 | ||||||||
| Operating income |
17.6 | -49 | % | 34.3 | 6 | % | 32.5 | |||||||||||
| Operating income margin |
5.7 | % | 7.8 | % | 8.4 | % | ||||||||||||
| Canada rig count(1) |
254 | -31 | % | 366 | 0 | % | 365 | |||||||||||
| (1) | Estimate of drilling activity as measured by average active drilling rigs based on Baker Hughes Inc. rig count information. |
Results for fiscal 2009 compared to fiscal 2008
Canadian Pressure Pumping revenue decreased $133.1 million, or 30%, for fiscal 2009 compared to fiscal 2008. Average drilling rig count in Canada was down 31% for the comparable periods. The weaker Canadian dollar compared to the U.S. dollar during the comparable periods accounts for approximately $57.8 million of the revenue decrease. In addition, decreased demand and lower pricing during the second half of fiscal 2009 negatively impacted revenue for the comparable periods. Relative to the U.S. dollar, the average Canadian dollar exchange rate decreased 17% in fiscal 2009 compared to fiscal 2008, thereby decreasing the U.S. dollar equivalent of revenues earned in Canada.
Operating income margin for fiscal 2009 declined to 6% compared to 8% for fiscal 2008. Decreased drilling activity and increased pricing pressures in fiscal 2009 contributed to the operating margin decline.
Results for fiscal 2008 compared to fiscal 2007
The 14% increase in revenue for Canada Pressure Pumping for fiscal 2008 was almost entirely due to the strengthening of the Canadian dollar. Relative to the U.S. dollar, the average Canadian dollar exchange rate increased 9% in fiscal 2008 compared to fiscal 2007, thereby increasing the U.S. dollar equivalent of revenues earned in Canada. Activity levels had little impact on the revenue increase, as the Canadian average active drilling rigs for fiscal 2008 remained unchanged from the prior year.
Operating income margin for fiscal 2008 was 8%, consistent with fiscal 2007. Despite improved revenues, the region operating income margin was negatively impacted by increased pricing pressures and cost increases in fiscal 2008.
26
Table of Contents
International Pressure Pumping Segment
(dollars in millions)
| 2009 | % Change | 2008 | % Change | 2007 | ||||||||||||||
| Revenue |
$ | 1,098.5 | -7 | % | $ | 1,185.4 | 18 | % | $ | 1,002.8 | ||||||||
| Operating income |
121.5 | -32 | % | 178.7 | 15 | % | 154.8 | |||||||||||
| Operating income margin |
11.1 | % | 15.1 | % | 15.4 | % | ||||||||||||
| International rig count(1) |
893 | -7 | % | 961 | 7 | % | 899 | |||||||||||
| (1) | Estimate of drilling activity as measured by average active drilling rigs based on Baker Hughes Inc. rig count information, excluding Canada and Mexico. |
Our International Pressure Pumping segment has four operating segments. Our Europe segment includes the North Sea, continental Europe, Nigeria and the West Africa coastal area north of Nigeria. Our Middle East segment includes the Arab countries, India, Central Asia and North Africa, including Algeria, Libya and Egypt. Our Latin America segment includes South America, Central America, and West Africa countries south of Nigeria, including Angola and Gabon. We completed our contractual obligations and shut down our pressure pumping operation in Russia during fiscal 2009; consequently, our Russia pressure pumping operations are now classified as discontinued operations.
Results for fiscal 2009 compared to fiscal 2008
The following table summarizes the percentage change in revenue for each of the operating segments within the International Pressure Pumping reportable segment, comparing fiscal 2009 to fiscal 2008:
| % change in Revenue |
|||
| Europe |
-14 | % | |
| Middle East |
-11 | % | |
| Asia Pacific |
2 | % | |
| Latin America |
-6 | % |
International Pressure Pumping revenue of $1.1 billion in fiscal 2009 decreased 7% compared to fiscal 2008, consistent with the 7% decline in average international drilling rig activity. The increased revenue in Asia Pacific is largely attributable to increased activity in Malaysia and Thailand, offset by lower activity in China and New Zealand. The decline in Latin America revenue was largely the result of industry-wide labor strikes in Argentina during much of the second half of fiscal 2009, partially offset by activity-related increases in Brazil. In the Middle East, the favorable impact of increased activity and new service contracts in North Africa was more than offset by lower rig activity in Saudi Arabia, India and Kazakhstan. Revenues in Europe decreased in fiscal 2009 largely as a result of unfavorable exchange rates primarily in early fiscal 2009, which caused local currency billings to translate into fewer U.S. dollars, combined with lower activity and lower pricing in the North Sea.
Operating income margin from our International Pressure Pumping operations decreased from 15% in fiscal 2008 to 11% in fiscal 2009, primarily as a result of lower volume of activity and lower pricing in certain countries within the Middle East and Latin America regions. Fiscal 2009 results in the International Pressure Pumping segment included severance costs totaling $2.4 million associated with our initiative to align our workforce with current market conditions, a $4.2 million charge related to a denied value added tax refund claim in the Asia Pacific, charges of $4.5 million for unfavorable outcomes of a tax court ruling and a customer dispute, and $1.5 million of fixed asset impairment charges.
Results for fiscal 2008 compared to fiscal 2007
The following table summarizes the percentage change in revenue for each of the operating segments within the International Pressure Pumping reportable segment, comparing fiscal 2008 to fiscal 2007:
| % change in Revenue |
|||
| Europe |
-11 | % | |
| Middle East |
27 | % | |
| Asia Pacific |
15 | % | |
| Latin America |
28 | % |
27
Table of Contents
International Pressure Pumping revenue increased 18% for fiscal 2008 compared to fiscal 2007. Increased activity in our Middle East and Latin American operations primarily accounted for the overall revenue increase. Our Middle East operations benefited from the introduction of two stimulation vessels into the India market as well as improved revenues from Algeria and activity increases in Saudi Arabia, Kazakhstan and Azerbaijan. Our Latin American operations experienced significant growth in Brazil, Argentina, Venezuela and in Gabon when comparing fiscal 2008 revenue to fiscal 2007, primarily as a result of increased drilling and completion activity in those countries. Average active drilling rigs in the region increased 6% when compared to the prior year. In Asia Pacific, revenue increased 15% with average active drilling rigs in the region increasing 11%. Most major markets within the region experienced revenue growth. Declines in revenue from our offshore stimulation vessel in the North Sea due to its relocation to India, as well as a revenue decline from our Northern West Africa operations caused the 11% decrease in revenue for Europe for fiscal 2008 compared to fiscal 2007.
Operating income margin remained consistent with fiscal 2007 at 15%, with declines in revenue from our Asia Pacific operations offsetting positive contribution to operating income from our other operating regions.
Oilfield Services Group
(dollars in millions)
| 2009 | % Change | 2008 | % Change | 2007 | ||||||||||||||
| Revenue |
$ | 860.1 | -13 | % | $ | 987.8 | 22 | % | $ | 806.5 | ||||||||
| Operating income |
102.9 | -46 | % | 191.7 | 13 | % | 170.4 | |||||||||||
| Operating income margin |
12.0 | % | 19.4 | % | 21.1 | % | ||||||||||||
Results for fiscal 2009 compared to fiscal 2008
The following table summarizes the percentage change in revenue for each of the operating segments within the Oilfield Services Group, comparing fiscal 2009 to fiscal 2008:
| % Change in Revenue |
|||
| Tubular Services |
-18 | % | |
| Process & Pipeline Services |
-16 | % | |
| Chemical Services |
-6 | % | |
| Completion Tools |
-9 | % | |
| Completion Fluids |
-11 | % |
Revenues from our Oilfield Services Group decreased 13% to $860.1 million in fiscal 2009 compared to fiscal 2008, while worldwide average drilling rig count declined 22%. Tubular Services declined primarily as a result of lower service activity in the U.S. Gulf of Mexico and Asia Pacific. Process & Pipeline Services revenue declined as a result of decreased activity in North America and the conclusion of several large international projects in fiscal 2008. Chemical Services revenue declined at a lower rate than other Oilfield Services businesses, as increased capillary work in the United States and internationally substantially offset the revenue impact of lower drilling and completion activity in North America. Completion Tools revenue declined as a result of lower activity in the U.S. Gulf of Mexico and lower international sales, the impact of which was somewhat offset by the inclusion of a full year contribution from the Innicor Subsurface Technologies business, which was acquired in May 2008. Completion Fluids revenue decreased primarily as a result of lower activity in the U.S. Gulf of Mexico, partially offset by new contract work in Mexico.
Operating income margin for the Oilfield Services Group in fiscal 2009 declined to 12% from 19% in the prior year, primarily as a result of lower activity and, to a lesser extent, lower pricing and an unfavorable product/service mix.
28
Table of Contents
Results for fiscal 2008 compared to fiscal 2007
The following table summarizes the percentage change in revenue for each of the operating segments within the Oilfield Services Group, comparing fiscal 2008 to fiscal 2007:
| % Change in Revenue |
|||
| Tubular Services |
11 | % | |
| Process & Pipeline Services |
37 | % | |
| Chemical Services |
31 | % | |
| Completion Tools |
38 | % | |
| Completion Fluids |
-18 | % |
All of the operating segments within our Oilfield Services Group except Completion Fluids, which was negatively impacted by a decline in offshore deepwater activity in the Gulf of Mexico, showed improved revenues for fiscal 2008 compared to fiscal 2007. Process & Pipeline Services benefited from increased international and U.S. activity, while Chemical Services benefited primarily from increased revenue from capillary services and increased U.S. activity levels.
In May 2008, we acquired Innicor Subsurface Technologies Inc. This acquisition along with increased project-oriented sales in international markets accounted for our Completion Tools revenue improvement. Excluding the effect of the Innicor acquisition, Completion Tools revenue improved 27%. Tubular Services also showed improved revenue as a result of increased activity in international markets.
Operating income margin for the Oilfield Services Group in fiscal 2008 declined to 19% from 21% in fiscal 2007. Positive contributions from our Process & Pipeline Services, Chemical Services and Tubular Services groups were offset by declining operating income margins from our Completion Tools and Completion Fluids operating segments within the Oilfield Services Group.
Other Operating Expenses
The following table sets forth our other operating expenses (dollars in millions):
| 2009 | % of Revenue |
2008 | % of Revenue |
2007 | % of Revenue |
|||||||||||||
| Research and engineering |
$ | 66.3 | 1.6 | % | $ | 72.0 | 1.3 | % | $ | 67.5 | 1.4 | % | ||||||
| Marketing |
108.2 | 2.6 | % | 120.7 | 2.3 | % | 107.1 | 2.2 | % | |||||||||
| General and administrative |
159.1 | 3.9 | % | 159.0 | 3.0 | % | 142.1 | 3.0 | % | |||||||||
| Loss on disposal of assets, net |
13.5 | 0.3 | % | 2.9 | 0.1 | % | 0.0 | 0.0 | % | |||||||||
| Pension settlement |
21.7 | 0.5 | % | — | — | — | — | |||||||||||
Research and engineering: Research and engineering expense decreased $5.7 million, or 8%, in fiscal 2009 compared to fiscal 2008, primarily as a result of cost reductions implemented during 2009 in response to prevailing market conditions. As a percentage of revenue, research and engineering expense increased slightly to 1.6% in fiscal 2009 compared to 1.3% in fiscal 2008, primarily as a result of the lower revenue base in fiscal 2009.
In fiscal 2008, research and engineering expense increased $4.5 million, or 7%, from fiscal 2007, primarily due to increased personnel costs. As a percentage of revenue, research and engineering expense decreased to 1.3% in fiscal 2008 compared to 1.4% in fiscal 2007.
Marketing: Marketing expense decreased $12.5 million, or 10%, in fiscal 2009 compared to fiscal 2008, primarily as a result of cost reductions implemented during 2009 in response to prevailing market conditions. As a percentage of revenue, marketing expense increased to 2.6% in fiscal 2009 compared to 2.3% in fiscal 2008, primarily as a result of the lower revenue base in fiscal 2009.
An increase in personnel costs was the main contributor to the $13.5 million, or 13%, increase in marketing expense from fiscal 2007 to fiscal 2008. As a percentage of revenue, fiscal 2008 marketing expense increased slightly to 2.3% compared to 2.2% in fiscal 2007.
29
Table of Contents
General and administrative: General and administrative expense remained flat at $159.1 million in fiscal 2009 compared to fiscal 2008, reflecting the impact of cost reduction measures introduced in 2009 offset by costs related to the pending Baker Hughes Merger, increased stock-based compensation expense and other expenses incurred in 2009. We incurred $5.3 million of costs related to the Merger in our Corporate segment in fiscal 2009, primarily including investment banking fees and outside legal fees associated with the merger agreement, the regulatory approval process, and the stockholder litigation discussed in Note 11 of the Notes to Consolidated Financial Statements. As a percentage of revenue, general and administrative expense was 3.9% in fiscal 2009, compared to 3.0% in fiscal 2008, primarily as a result of the lower revenue base in fiscal 2009.
In fiscal 2008, general and administrative expense increased $16.8 million, or 12%, compared to fiscal 2007, primarily as a result of increased personnel costs and depreciation expense. As a percentage of revenue, general and administrative expense was 3.0 % in fiscal 2008, consistent with fiscal 2007.
Loss on disposal of assets, net: Loss on disposal of assets, net of gains, increased significantly in fiscal 2009 compared to fiscal 2008, primarily as a result of non-cash fixed asset impairment charges totaling $7.2 million recorded in the third quarter of 2009. These charges related to certain cementing and stimulation equipment that was not economical to repair or maintain in the current market environment.
Pension settlement: In September 2006, we entered into an agreement with an insurance company to settle our obligation with respect to the U.S. defined benefit pension plan. Plan assets of approximately $72 million were used to purchase an insurance contract to fund the benefits and settle the plan. In December 2008, we received approval from the Pension Benefit Guaranty Corporation and the Internal Revenue Service and were relieved of primary responsibility for the pension benefit obligation. Consequently, we recorded a non-cash pre-tax charge of $21.7 million in connection with the settlement in the first quarter of fiscal 2009 in our Corporate segment.
Interest Expense and Interest Income: The following table shows a comparison of interest expense and interest income (in millions):
| 2009 | 2008 | 2007 | ||||||||||
| Interest expense |
$ | (27.2 | ) | $ | (28.1 | ) | $ | (32.7 | ) | |||
| Interest income |
1.2 | 1.9 | 1.6 | |||||||||
| Net interest expense |
$ | (26.0 | ) | $ | (26.2 | ) | $ | (31.1 | ) | |||
Interest expense decreased $0.9 million in fiscal 2009 compared to fiscal 2008, and decreased $4.6 million in fiscal 2008 compared to fiscal 2007. These decreases in interest expense are primarily attributable to lower average outstanding borrowings when comparing the respective periods. Outstanding debt balances decreased from $671.0 million at September 30, 2007 to $556.3 million at September 30, 2008 and to $506.1 million at September 30, 2009.
Interest income decreased $0.7 million for fiscal 2009 compared to fiscal 2008 as a result of lower prevailing interest rates in invested cash balances, despite significantly higher average cash and cash equivalents balance throughout fiscal 2009. Fiscal 2008 interest income increased slightly compared to fiscal 2007, primarily as a result of higher average invested cash balances.
Other Expense, net: Other expense, net of other income, for the fiscal years ended September 30 is summarized as follows (in millions):
| 2009 | 2008 | 2007 | ||||||||||
| Minority interest |
$ | (13.8 | ) | $ | (11.9 | ) | $ | (11.3 | ) | |||
| Non-operating net foreign exchange gain (loss) |
0.7 | (0.3 | ) | 0.1 | ||||||||
| (Loss) gain from sale of equity method investments |
— | (2.9 | ) | 0.5 | ||||||||
| Legal settlements |
3.6 | 4.0 | — | |||||||||
| Other, net |
0.4 | 2.5 | 3.1 | |||||||||
| Other expense, net |
$ | (9.1 | ) | $ | (8.6 | ) | $ | (7.6 | ) | |||
The increase in other expense, net for fiscal 2009 compared to fiscal 2008 relates to increased minority interest as a result of improved operating results from our international joint venture operations, partially offset by a fiscal 2008 loss on the sale of our Hungarian joint venture not repeating in fiscal 2009. In fiscal 2008, we recorded a $2.9 million loss on the sale of our interest in a Hungarian joint venture operation, and we received a $4.0 million cash settlement in a litigation matter. For additional information, see Note 13 of the Notes to Consolidated Financial Statements.
30
Table of Contents
Income Tax Expense
Primarily as a result of lower profit in our North American operations, and the resulting change in the geographic mix of our pre-tax income in fiscal 2009, our effective tax rate for fiscal 2009 decreased to 14.5% of pre-tax income from continuing operations in fiscal 2009, compared to 29.4% in fiscal 2008. We earned profits in relatively low tax jurisdictions outside of North America, and recorded significant pre-tax losses in the relatively high tax jurisdictions of the United States and Canada. The U.S. losses can be carried back to offset taxes paid in previous years.
Our effective tax rate decreased from 32.3% in fiscal 2007 to 29.4% in fiscal 2008, primarily due to the effect of a statutory tax rate decrease in Canada, a greater percentage of income earned in international tax jurisdictions, and an increase in the domestic production activity deduction (Section 199 of the U.S. Internal Revenue Code) in fiscal 2008.
Discontinued Operations
We completed work on our final pressure pumping contract in Russia in July 2009. Consequently, we classified the Russia pressure pumping unit, an operating segment within the International Pumping Services segment, as a discontinued operation. Accordingly, the assets and liabilities of this business, along with its historical results of operations, have been reclassified for all periods presented. As soon as our contractual obligations were fulfilled, we began the process of redeployment and liquidation of the assets associated with this business and other exit activities. We recorded charges totaling $6.6 million in connection with these exit activities, including employee separation costs, fixed asset and inventory impairment charges. We expect to incur additional exit costs during fiscal 2010 in the range of $3–4 million as we complete the exit activities associated with our Russia pressure pumping business.
Summarized operating results from discontinued operations are as follows:
| Year Ended September 30, | ||||||||||||
| 2009 | 2008 | 2007 | ||||||||||
| (in millions) | ||||||||||||
| Revenue |
$ | 30.0 | $ | 67.2 | $ | 71.9 | ||||||
| Loss before income taxes |
(16.2 | ) | (10.4 | ) | (1.0 | ) | ||||||
| Income tax expense (benefit) |
(0.2 | ) | 0.7 | (0.8 | ) | |||||||
| Loss from discontinued operations |
$ | (16.0 | ) | $ | (11.1 | ) | $ | (0.2 | ) | |||
Loss from discontinued operations increased in fiscal 2009 compared to fiscal 2008, primarily as a result of the completion of our contractual service obligations, and subsequent exit activities related to our Russia pressure pumping operations. Fiscal 2009 results included $2.7 million of inventory impairment, $2.8 million of fixed asset impairment and $1.1 million of employee termination costs. Fiscal 2008 included a $6.1 million goodwill impairment charge related to our Russia pressure pumping operations. We recognized this goodwill impairment charge when our analysis indicated that all goodwill associated with that business would not likely be recoverable, as a result of competitive pressure in the areas in which we operate, cost inflation, currency risks and concerns over future activity reductions.
Income tax expense related to discontinued operations was minimal for the three year period ending September 30, 3009, due to accumulated operating losses in Russia for which no benefit was realizable.
31
Table of Contents
Liquidity and Capital Resources
Historical Cash Flow
The following table sets forth the historical cash flows for the years ended September 30 (in millions):
| 2009 | 2008 | 2007 | ||||||||||
| Cash provided by operations |
$ | 654.1 | $ | 898.8 | $ | 840.7 | ||||||
| Cash used in investing |
(386.3 | ) | (648.1 | ) | (777.9 | ) | ||||||
| Cash used in financing |
(139.1 | ) | (153.8 | ) | (98.0 | ) | ||||||
| Effect of exchange rate changes on cash |
3.7 | (4.8 | ) | 1.0 | ||||||||
| Change in cash and cash equivalents |
$ | 132.4 | $ | 92.1 | $ | (34.2 | ) | |||||
Fiscal 2009
Cash flow from operating activities of $654.1 million in fiscal 2009 decreased $244.7 million, or 27%, compared to the $898.8 million of cash provided from operations in fiscal 2008. Net income from continuing operations of $166.0 million in fiscal 2009 was $454.5 million lower than in fiscal 2008 and $587.8 million lower than fiscal 2007, primarily as a result of the market downturn and corresponding lower demand for our services and products. Non-cash items included in net income, primarily including depreciation and amortization, stock-based compensation expense, pension settlement, net loss on disposal or impairment of assets, bad debt reserves and deferred income taxes, totaled $438.6 million in fiscal 2009, compared to $379.7 million in fiscal 2008 and $276.7 million in fiscal 2007. Changes in working capital and other operating accounts generated cash of $27.2 million in fiscal 2009, compared to using cash of $99.6 million in fiscal 2008 and $195.2 million in fiscal 2007, primarily as a result of the decline in market activity which led to reductions in working capital.
Cash used in investing decreased $261.8 million, or 40%, in fiscal 2009 compared to fiscal 2008, reflecting a decrease in capital expenditures, primarily as a result of lower expansion capital needed due to lower demand for our products and services.
Cash used in financing activities decreased $14.7 million, or 10%, in fiscal 2009 compared to fiscal 2008, primarily as a result of higher debt repayments during fiscal 2008 compared to fiscal 2009, partially offset by a treasury stock purchase of $44.2 million in fiscal 2009. In addition to the treasury stock purchase, financing activities in fiscal 2009 primarily consisted of $50.4 million, net, in payments of short term borrowings and $58.5 million in dividend payments. We also received net proceeds in the amount of $16.7 million from employee stock purchases and stock option exercises during fiscal 2009.
Fiscal 2008
Cash flow from operations of $898.8 million in fiscal 2008 increased $58.1 million, or 7%, compared to the $840.7 million of cash provided from operations in fiscal 2007, primarily as a result of lower investment in inventories between the two periods. Net cash flows before changes in operating accounts were $1,000.2 million in fiscal 2008 compared to $1,030.5 million in fiscal 2007, with the decrease primarily attributable to lower U.S./Mexico pressure pumping operating income. Changes in operating accounts accounted for $99.6 million of cash usage in fiscal 2008, compared to $195.2 million usage in fiscal 2007. This improvement was primarily attributable to the stable inventory levels, compared to significant increases in inventory in fiscal 2007. Increased receivables accounted for a $124.1 million use of cash, primarily as a result of increased revenues, particularly internationally.
The cash flow used in investing during the fiscal 2008 was almost entirely due to $605.6 million of purchases of property, plant, and equipment and $57.2 million for the acquisition of businesses, principally Innicor Subsurface Technologies Inc. in May 2008.
Cash flows used in financing consisted of $113.7 million, net, in payments of short term borrowings and $58.6 million in dividend payments during fiscal 2008. We also received net proceeds in the amount of $14.2 million from employee stock purchases and stock option exercises during fiscal 2008. Further investing activities during the period included the issuance of 6% Senior Notes due 2018 for $246.9 million in net proceeds in May 2008 and the repayment of $250.0 million of Senior Notes in June 2008.
32
Table of Contents
Fiscal 2007
Cash flow from operations in fiscal 2007 was $840.7 million. Significant uses of cash in fiscal 2007 included increased inventory in anticipation of increases in activity, increased accounts receivable as a result of increased revenue and days sales outstanding, and increased prepaid expenses primarily related to tax payments. Increased accounts payable also contributed to cash flow from operations, mostly from increased activity levels.
The cash flow used in investing during fiscal 2007 was almost entirely due to $741.8 million of purchases of property, plant, and equipment, including $47.8 million paid to buy-out an equipment partnership established in 1997. We also paid $57.9 million, net of cash, for acquisitions.
Cash flows used in financing consisted of $11.0 million, net, in proceeds from short term borrowings, $74.6 million in repurchases of our common stock and $58.6 million of dividend payments during fiscal 2007. We also received proceeds in the amount of $22.4 million from employee stock purchases and stock option exercises during fiscal 2007.
Liquidity and Capital Resources
Our cash and cash equivalents balance of $282.6 million at September 30, 2009 and cash flows from operations are expected to be our primary source of liquidity in fiscal 2010. Our sources of liquidity also include the available financing facilities listed below (in millions):
| Financing Facility |
Expiration |
Borrowings at September 30, 2009 |
Available at September 30, 2009 | |||||
| Revolving Credit Facility |
August 2012 | $ | — | $ | 400.0 | |||
| Discretionary |
Various times within the next 12 months | 7.2 | 24.3 | |||||
On May 19, 2008, we completed a public offering of $250.0 million of 6% Senior Notes due 2018. The net proceeds from the offering of approximately $246.9 million, after deducting underwriting discounts and commissions and expenses, were used to retire $250.0 million in outstanding floating rate Senior Notes, which matured June 1, 2008. As of September 30, 2009, the Company had $249.9 million of the 5.75% Senior Notes due 2011 and $249.0 million of the 6% Senior Notes due 2018 issued and outstanding, net of discount.
Our amended and restated revolving credit facility (the “Revolving Credit Facility”) permits borrowings of up to $400 million in principal amount. The Revolving Credit Facility includes a $50 million sublimit for the issuance of standby letters of credit and a $20 million sublimit for swingline loans. Swingline loans have short-term maturities and the remaining amounts outstanding under the Revolving Credit Facility become due and payable in August 2012. In addition, we have the right to request up to an additional $200 million over the permitted borrowings of $400 million, subject to the approval of our lenders at the time of the request. Depending on the amount of borrowings outstanding under this facility, the interest rate applicable to borrowings generally ranges from 30-40 basis points above LIBOR. We are charged various fees in connection with the Revolving Credit Facility, including a commitment fee based on the average daily unused portion of the commitment, totaling $0.3 million, $0.2 million and $0.3 million in fiscal 2009, 2008 and 2007, respectively. In addition, the Revolving Credit Facility charges a utilization fee on all outstanding loans and letters of credit when usage of the Revolving Credit Facility exceeds 62.5%; there were no material utilization fees incurred in fiscal 2009, 2008 or 2007. There were no borrowings under the Revolving Credit Facility at September 30, 2009 or 2008, and pursuant to the Merger Agreement, their must be no borrowings outstanding under the Revolving Credit Facility on the completion date of the Merger.
In May 2008, we entered into a Committed Credit Facility with a commercial bank to finance our acquisition of Innicor Subsurface Technologies Inc. There were no commitment fees required by this facility, and the interest rate was based on market rates on the dates that amounts are borrowed. This facility expired in May 2009 and was repaid with cash on hand.
In addition to the Revolving Credit Facility, we had available $24.3 million of unsecured discretionary lines of credit at September 30, 2009, which expire at the bank’s discretion. There are no requirements for commitment fees or compensating balances in connection with these lines of credit, and interest is at prevailing market rates. There was $7.2 million, $7.6 million and $24.3 million in outstanding borrowings under these lines of credit at September 30, 2009, 2008 and 2007, respectively. The weighted average interest rates on short-term borrowings outstanding as of September 30, 2009, 2008 and 2007 were 4.50%, 5.23% and 5.40%, respectively.
33
Table of Contents
Management believes that cash flows from operations combined with cash and cash equivalents, the Revolving Credit Facility and other discretionary credit facilities provide us with sufficient capital resources and liquidity to manage our routine operations, meet debt service obligations, fund projected capital expenditures, pay a regular quarterly dividend and support the development of our short-term and long-term operating strategies. If the discretionary lines of credit are not renewed, or if borrowings under these lines of credit otherwise become unavailable, we expect to refinance this debt by arranging additional committed bank facilities or through other long-term borrowing alternatives.
The Senior Notes and the Revolving Credit Facility include various customary covenants and other provisions, including the maintenance of certain profitability and solvency ratios, none of which materially restrict our activities. We are currently in compliance with all covenants imposed.
Cash Requirements
We anticipate capital expenditures to be approximately $170-200 million in fiscal 2010, compared to $394.2 million in fiscal 2009. The actual amount of fiscal 2010 capital expenditures will depend primarily on maintenance capital requirements, expansion opportunities and our ability to execute our budgeted capital expenditures.
In fiscal 2010, our minimum pension and postretirement funding requirements are anticipated to be approximately $15.0 million. We funded $13.4 million to our pension and postretirement plans during fiscal 2009.
We paid cash dividends in the amount of $0.05 per common share on a quarterly basis in fiscal 2009, totaling $58.5 million. We anticipate paying a quarterly dividend in fiscal 2010 until the Merger is completed; however, dividends are subject to approval of our Board of Directors each quarter and the Board has the ability to change the dividend policy at any time.
As of September 30, 2009, the Company had $249.9 million of 5.75% Senior Notes due 2011 and $249.0 million of 6% Senior Notes due 2018 issued and outstanding, net of discount. We expect cash paid for interest expense to be approximately $30 million in fiscal 2010.
Contractual Obligations and Off Balance Sheet Transactions
The following table summarizes our contractual obligations and other commercial commitments as of September 30, 2009 (in millions):
| Contractual Obligations |
Total | Less than 1 year |
1-3 Years |
3-5 Years |
After 5 Years | ||||||||||
| Long-term and short-term debt |
$ | 507.2 | $ | 7.2 | $ | 250.0 | $ | — | $ | 250.0 | |||||
| Interest on long-term debt and capital leases |
163.8 | 29.4 | 44.4 | 30.0 | 60.0 | ||||||||||
| Capital lease obligations |
3.3 | 1.7 | 1.6 | — | — | ||||||||||
| Operating leases |
176.1 | 54.4 | 76.5 | 25.8 | 19.4 | ||||||||||
| Equipment financing arrangement(1) |
45.9 | 42.1 | 3.8 | — | — | ||||||||||
| Purchase obligations(2) |
99.6 | 99.6 | — | — | — | ||||||||||
| Purchase commitments(3) |
180.6 | 79.4 | 70.7 | 30.5 | — | ||||||||||
| Other long-term liabilities(4) |
26.1 | 19.2 | 0.2 | 0.2 | 6.5 | ||||||||||
| Total contractual cash obligations |
$ | 1,202.6 | $ | 333.0 | $ | 447.2 | $ | 86.5 | $ | 335.9 | |||||
| (1) | As discussed below, we have notified the partner of our intent to exercise our option to purchase the pumping service equipment in this partnership for approximately $46 million in 2010. We have, therefore, included the option payment in the table above. |
| (2) | Includes agreements to purchase goods or services that have been approved and that specify all significant terms (pricing, quantity and timing). |
| (3) | We have entered into agreements with certain suppliers to ensure that certain levels of fracturing materials are maintained in the United States and Canada. |
| (4) | Includes expected cash payments for long-term liabilities reflected in the consolidated balance sheet where the amounts and timing of the payment are known. Amounts include: Asset retirement obligations, known pension funding requirements, post-retirement benefit obligation, environmental accruals and other miscellaneous long-term obligations. Amounts exclude: Pension obligations in which funding requirements are uncertain and long-term contingent liabilities. |
34
Table of Contents
On October 1, 2007, we adopted the guidance under Financial Accounting Standards Board (“FASB”) Accounting Standard Codification (“ASC”) 740, Income Taxes, addressing the determination of whether tax benefits claimed or expected to be claimed on a tax return should be recorded in the financial statements. However, the timing of future cash flows associated with ASC 740 is uncertain and we are unable to make reasonably reliable estimates of the period of cash settlement with the respective taxing authority. Therefore, we excluded $50.4 million of unrecognized tax benefits from our contractual obligations table.
We expect that cash and cash equivalents and cash flows from operations will generate sufficient cash flows to fund all of the cash requirements described above.
In 1999, we contributed certain pumping service equipment to a limited partnership, in which we own a 1% interest. The equipment is used to provide services to our customers for which we pay a service fee over a period of at least six years, but not more than 13 years, at approximately $12 million annually. This is accounted for as an operating lease. We assessed the terms of this agreement and determined it was a variable interest entity. However, we were not deemed to be the primary beneficiary, and therefore, consolidation was not required. The transaction resulted in a gain that is being deferred and amortized over the partnership term. The partnership agreement permits substitution of equipment within the partnership as long as the implied fair value of the new property transferred in at the date of substitution equals or exceeds the implied fair value, as defined, of the current property in the partnership that is being replaced. Substitution activity during the partnership term has reduced the balance of the deferred gain to zero at September 30, 2009, compared to $4.2 million at September 30, 2008. In 2010, we have the option to purchase the pumping service equipment for approximately $46 million, and we have notified the partner of our intent to do so.
We routinely issue Parent Company Guarantees (“PCGs”) in connection with service contracts or performance obligations entered into by our subsidiaries. The issuance of these PCGs is frequently a condition of the bidding process imposed by our customers for work in countries outside of North America. The PCGs typically provide that we guarantee the performance of the services by our local subsidiary. The term of these PCGs varies with the length of the service contract. To date, the parent company has not been called upon to perform under any of these PCGs.
We arrange for the issuance of a variety of bank guarantees, performance bonds and standby letters of credit. The vast majority of these are issued in connection with contracts we or our subsidiaries have entered into with customers. The customer has the right to call on the bank guarantee, performance bond or standby letter of credit in the event that we, or our subsidiaries, default in the performance of services. These instruments are required as a condition to being awarded the contract, and are typically released upon completion of the contract. We have also issued standby letters of credit in connection with a variety of our financial obligations, such as in support of fronted insurance programs, claims administration funding, certain employee benefit plans and temporary importation bonds. The following table summarizes our other commercial commitments as of September 30, 2009 (in millions):
| Other Commercial Commitments |
Amount of commitment expiration per period | ||||||||||||||
| Total Amounts Committed |
Less than 1 Year |
1–3 Years |
3–5 Years |
Over 5 Years | |||||||||||
| Standby letters of credit |
$ | 35.0 | $ | 34.8 | $ | 0.2 | $ | — | $ | — | |||||
| Guarantees |
291.0 | 156.0 | 77.2 | 48.9 | 8.9 | ||||||||||
| Total other commercial commitments |
$ | 326.0 | $ | 190.8 | $ | 77.4 | $ | 48.9 | $ | 8.9 | |||||
Investigations Regarding Misappropriation and Possible Illegal Payments
We have had discussions with the DOJ and the SEC regarding our internal investigation and certain other matters described in Note 11 of the Notes to Consolidated Financial Statements. It is not possible to accurately predict at this time when any of these matters will be resolved. Based on current information, we cannot predict the outcome of such investigations, whether we will reach resolution through such discussions or what, if any, actions may be taken by the DOJ, the SEC or other authorities or the effect the foregoing may have on our consolidated financial statements.
35
Table of Contents
Critical Accounting Policies
For an accounting policy to be deemed critical, the accounting policy must (i) have a potentially material impact on the presentation of our financial condition or results of operations and (ii) require us to make estimates based on historical experience or assumptions about matters that are highly uncertain at the time the accounting estimate is made. Estimates and assumptions about future events and their effects cannot be perceived with certainty. We base our estimates on historical experience and on other assumptions that are believed to be reasonable under the circumstances, the results of which form the basis for making judgments. These estimates may change as new events occur, as more experience is acquired, as additional information is obtained and as our operating environment changes. Materially different results can occur as circumstances change and additional information becomes known, including estimates not deemed “critical”.
We believe the following are the most critical accounting policies used in the preparation of our consolidated financial statements and the significant judgments and uncertainties affecting the application of these policies. The selection of accounting estimates, including those deemed “critical,” and the associated disclosures in this discussion have been discussed by management with the Audit Committee of the Board of Directors. The critical accounting policies should be read in conjunction with the disclosures elsewhere in the Notes to Consolidated Financial Statements. Significant accounting policies are discussed in Note 2 of the Notes to Consolidated Financial Statements.
Goodwill: We account for goodwill in accordance with ASC 350, Intangibles – Goodwill and Other. ASC 350 requires goodwill to be reviewed for possible impairment using fair value measurement techniques on an annual basis, or if circumstances indicate that impairment may exist. Specifically, goodwill impairment is determined using a two-step process. The first step of the goodwill impairment test compares the fair value of a reporting unit to its net book value, including goodwill. If the fair value of the reporting unit exceeds the net book value, no impairment is required and the second step is unnecessary. If the fair value of the reporting unit is less than the net book value, the second step is performed to determine the amount of the impairment, if any. Fair value measures include quoted market price, present value technique (estimate of future cash flows), and a valuation technique based on multiples of earnings or revenue. The second step compares the implied fair value of reporting unit goodwill with the carrying amount of that goodwill. If the carrying amount of reporting unit goodwill exceeds the implied fair value of that goodwill, an impairment loss shall be recognized in the amount equal to that excess. The implied fair value is determined in the same manner as the amount of goodwill recognized in a business combination. That is, the fair value of the reporting unit is allocated to all the assets and liabilities as if the reporting unit had just been acquired in a business combination and the fair value of the reporting unit was the purchase price paid to acquire the reporting unit.
Determining fair value and the implied fair value of a reporting unit is judgmental and often involves the use of significant estimates and assumptions. These estimates and assumptions could have a significant impact on whether or not an impairment charge is recognized and also the magnitude of the impairment charge. Our estimate of fair value is primarily determined using discounted cash flows. This approach uses significant assumptions such as a discount rate, growth rate, terminal value multiples, and future rig count and pricing trends.
During fiscal 2008 we recognized a goodwill impairment charge of $6.1 million related to our Russia operations. With the competitive pressure in the areas in which we operate in Russia, cost inflation, currency risks and concerns over future activity reductions, our analysis indicated that our goodwill associated with Russia would not likely be recoverable. During fiscal 2009, we reviewed our goodwill balance for possible impairment and determined that no impairment existed. See Note 12 of the Notes to Consolidated Financial Statements for more information on goodwill.
Pension and Postretirement Benefit Plans: Pension expense and postretirement benefit obligation are determined in accordance with the provisions of ASC 715, Compensation – Retirement Benefits. We determine the annual net periodic pension expense and pension plan liabilities on an annual basis. In determining the annual estimate of net periodic pension cost, we are required to make an evaluation of critical assumptions such as discount rate, expected long-term rate of return on plan assets and expected increase in compensation levels. These assumptions may have an effect on the amount and timing of future contributions. Discount rates are based on high quality corporate fixed income investments. A 50 basis point decrease in the discount rate we used in fiscal 2009 would have resulted in the recognition of approximately $1.4 million in additional expense.
Long-term rate of return assumptions are based on actuarial review of our asset allocation and average annual returns being earned by similar investments. A 50 basis point reduction in the expected rate of return on assets of our plans would have resulted in the recognition of approximately $0.7 million in additional expense in fiscal 2009.
36
Table of Contents
The rate of increase in compensation levels is reviewed with the actuaries based upon our historical salary experience. The effects of actual results differing from our assumptions are accumulated and amortized over future periods, and, therefore, generally affect our recognized expense in future periods.
Our postretirement medical benefit plan provides credits based on years of service that can be used to purchase coverage under the retiree plan. This plan effectively caps our health care inflation rate at a 4% increase per year. Increasing the assumed health care cost trend rates by one percentage point would not have a material impact on the accumulated postretirement benefit obligation or the net periodic postretirement benefit cost because these benefits are capped pursuant to the terms of the plan.
In accordance with ASC 715, any changes in our assumptions or differences between estimated and actual return on plan assets and compensation levels result in unrecognized gain/loss which is recorded as a component of stockholders’ equity in accumulated other comprehensive income. Amounts recorded to accumulated other comprehensive income are amortized and recognized in net periodic pension expense in future periods.
In fiscal 2010, we will have a pension and postretirement funding requirement of approximately $15.0 million. We expect to fund this amount with cash flows from operating activities. See Note 10 of the Notes to Consolidated Financial Statements for more information on our pension plans.
Income Taxes: The effective income tax rates applicable to continuing operations were 14.5%, 29.4% and 32.3% for the years ended September 30, 2009, 2008 and 2007, respectively. These rates vary primarily due to fluctuations in taxes from the mix of domestic versus foreign income. Deferred tax assets and liabilities are recognized for differences between the book basis and tax basis of the net assets of the Company. In providing for deferred taxes, we consider current tax laws, estimates of future taxable income and available tax planning strategies. This process also involves making forecasts of current and future years’ U.S. taxable income. Unforeseen events and industry conditions may impact these forecasts which in turn can affect the carrying value of deferred tax assets and liabilities and impact our future reported earnings. Our tax filings for various periods are subjected to audit by tax authorities in the jurisdictions where we conduct business. These audits may result in assessments of additional taxes that are resolved with the authorities or potentially through the courts. Resolution of these situations inevitably includes some degree of uncertainty; accordingly, we provide taxes only for the amounts we believe will ultimately result from these proceedings. In addition to the aforementioned assessments that have been received from various taxing authorities, we provide for taxes in certain situations where assessments have not been received. In those situations, we accrue income taxes where we consider it probable that the taxes ultimately payable will exceed those amounts reflected in filed tax returns; accordingly, taxes are provided in those situations under the guidance in ASC 740.
Self-Insurance Accruals and Loss Contingencies: We are self-insured for certain losses relating to workers’ compensation, general liability, property damage and employee medical benefits for claims filed and claims incurred but not reported. We review the liability on a quarterly basis. The liability is based primarily on an actuarial undiscounted basis using individual case-based valuations and statistical analysis and is based upon judgment and historical experience; however, the final cost of many of these claims may not be known for five years or longer. This estimate is subject to trends, such as loss development factors, historical average claim volume, average cost for settled claims and current trends in claim costs. Significant and unanticipated changes in these trends or future actual payouts could result in additional increases or decreases to the recorded accruals. We have purchased stop-loss coverage to limit, to the extent feasible, our aggregate exposure to certain claims. There is no assurance that such coverage will adequately protect us against liability from all potential consequences.
As discussed in Note 11 of the Notes to Consolidated Financial Statements, legal proceedings covering a wide range of matters are pending or threatened against the Company. It is not possible to predict the outcome of the litigation pending against the Company and litigation is subject to many uncertainties. It is possible that there could be adverse developments in these cases. We record provisions in the consolidated financial statements for pending litigation when we determine that an unfavorable outcome is probable and the amount of the loss can be reasonably estimated. While we believe that our accruals for these matters are adequate, if the actual loss from a loss contingency is significantly different than the estimated loss, our results of operations may be positively or negatively impacted.
37
Table of Contents
Accounting Pronouncements
In June 2009, the FASB issued guidance contained in ASC 105, Generally Accepted Accounting Principles, establishing an authoritative United States GAAP superseding all pre-existing accounting standards and literature. This guidance is effective for financial statements issued for interim and annual periods after September 15, 2009. Consequently, we have changed the accounting literature references contained in this report, but other than that, this new standard had no significant impact on our consolidated financial statements.
In June 2009, the FASB issued ASC 810, Consolidation – Variable Interest Entities, which addresses the addition of qualified special purpose entities into previous guidance as the concept of these entities was eliminated by guidance under ASC 860. This guidance also modifies the analysis by which a controlling interest of a variable interest entity is determined thereby requiring the controlling interest to consolidate the variable interest entity. A controlling interest exists if a party to a variable interest entity has both (i) the power to direct the activities of a variable interest entity that most significantly impact the entity’s economic performance and (ii) the obligation to absorb losses of or receive benefits from the entity that could be potentially significant to the variable interest entity. This statement could impact the way we account for our limited partnership discussed in Note 11 of the Notes to Consolidated Financial Statements under Lease and Other Long-Term Commitments. ASC 810 becomes effective as of the beginning of the first annual reporting period beginning after November 15, 2009 and should be applied prospectively for interim and annual periods during that period going forward. We will adopt the guidance under ASC 810 on October 1, 2010, and have not yet determined the impact, if any, on our consolidated financial statements.
In June 2009, the FASB issued guidance under ASC 860, Transfers and Servicing, which eliminates the concept of a qualified special purpose entity and enhances guidance related to derecognition of transferred assets. ASC 860 becomes effective as of the beginning of the first annual reporting period beginning after November 15, 2009 and should be applied prospectively for interim and annual periods during that period going forward. We will adopt the guidance under ASC 860 on October 1, 2010, and have not yet determined the impact, if any, on our consolidated financial statements.
On June 30, 2009, we adopted guidance under ASC 825, Financial Instruments – Overall, requiring publicly-traded companies to disclose the fair value of financial instruments in their interim financial statements. See Note 7 of the Notes to Consolidated Financial Statements for such disclosure.
In May 2009, the FASB issued guidance in ASC 855, Subsequent Events, to establish general standards of accounting for and disclosures of events that occur after the balance sheet date but before financial statements are issued or are available to be issued. We adopted this guidance beginning with our June 30, 2009 condensed consolidated financial statements.
In December 2008, the FASB issued guidance under ASC 715, Compensation – Retirement Benefits – Defined Benefit Plans, requiring the disclosure of major categories of plan assets, investment policies and strategies, fair value measurement of plan assets and significant concentration of credit risks related to defined benefit pension or other postretirement plans. This guidance is effective for fiscal years ending after December 15, 2009 and, accordingly, we will adopt it in fiscal 2010.
In April 2008, the FASB issued guidance contained in ASC 350, Intangibles – Goodwill and Others – General Intangibles Other than Goodwill, amending the factors that should be considered in developing renewal or extension assumptions used to determine the useful life of a recognized intangible asset under previously existing literature. The objective of this guidance is to improve the consistency between the useful life of a recognized intangible asset under ASC 350 and the period of expected cash flows used to measure the fair value of the asset under ASC 805, Business Combinations. ASC 350 is effective for the Company beginning October 1, 2009, and is not expected to have a significant impact on our consolidated financial statements.
In March 2008, the FASB issued guidance under ASC 815, Derivatives and Hedging, changing the disclosure requirements for derivative instruments and hedging activities. Entities are required to provide enhanced disclosures about (1) how and why an entity uses derivative instruments, (2) how derivative instruments and related hedged items are accounted for under ASC 815, and its related interpretations, and (3) how derivative instruments and related hedged items affect an entity’s financial position, financial performance and cash flows. We adopted this guidance in the second quarter of fiscal 2009. We currently have no derivative financial instruments subject to accounting or disclosure under ASC 815; therefore, the guidance under ASC 815 had no effect on our consolidated statements of financial position, results of operations or cash flows.
38
Table of Contents
In December 2007, the FASB issued guidance under ASC 805, Business Combinations, that retains fundamental requirements requiring the acquisition method of accounting be used for all business combinations and for an acquirer to be identified for each business combination. ASC 805 defines the acquirer as the entity that obtains control of one or more businesses in the business combination and establishes the acquisition date as the date that the acquirer achieves control. ASC 805 establishes principles and requirements for how the acquirer:
| a. | Recognizes and measures in its financial statements the identifiable assets acquired, the liabilities assumed, and any noncontrolling interest in the acquiree. |
| b. | Recognizes and measures the goodwill acquired in the business combination or a gain from a bargain purchase. |
| c. | Determines what information to disclose to enable users of the financial statements to evaluate the nature and financial effects of the business combination. |
This guidance is effective for business combinations occurring on or after the beginning of the first annual reporting period beginning after December 15, 2008. Consequently, we will adopt this guidance on October 1, 2009.
In December 2007, the FASB issued guidance under ASC 810, Consolidation – Overall – Transition, amending previous guidance to establish accounting and reporting standards for the noncontrolling interest in a subsidiary and for the deconsolidation of a subsidiary. ASC 810 requires consolidated net income to be reported at amounts that include the amounts attributable to both the parent and the noncontrolling interest. It also requires disclosure, on the face of the consolidated statement of income, of the amounts of consolidated net income attributable to the parent and to the noncontrolling interest and requires that a parent recognize a gain or loss in net income when a subsidiary is deconsolidated. ASC 810 requires expanded disclosures in the consolidated financial statements that identify and distinguish between the interests of the parent’s owners and the interests of the noncontrolling owners of a subsidiary and shall be applied prospectively as of the beginning of the fiscal year in which initially applied, except for the presentation and disclosure requirements. The presentation and disclosure requirements shall be applied retrospectively for all periods presented. This guidance is effective for fiscal years beginning after December 15, 2008 (our fiscal year beginning October 1, 2009). We do not have significant noncontrolling interests in consolidated subsidiaries, and therefore, adoption of this guidance is not expected to have a significant impact on our consolidated financial statements.
In February 2007, the FASB issued guidance under ASC 825, Financial Instruments, providing companies with an option to report selected financial assets and liabilities at fair value. Under ASC 825, companies that elect the fair value option will report unrealized gains and losses in earnings at each subsequent reporting date. In addition, the guidance establishes presentation and disclosure requirements designed to facilitate comparisons between companies that choose different measurement attributes for similar types of assets and liabilities. The fair value option election is irrevocable, unless a new election date occurs. ASC 825 is effective the beginning of an entity’s first fiscal year beginning after November 15, 2007 and is to be applied prospectively, unless the entity elects early adoption. Consequently, we adopted ASC 825 effective October 1, 2008 and elected not to apply the fair value option.
In September 2006, the FASB issued guidance under ASC 820, Fair Value Measurements and Disclosures, defining fair value, outlining a fair value hierarchy (requiring market-based assumptions be used, if available) and setting disclosure requirements of assets and liabilities measured at fair value based on their level in the hierarchy. On October 1, 2008, we adopted, without material impact on our consolidated financial statements, the provisions of ASC 820 related to financial assets and liabilities. We will adopt the provisions of ASC 820 related to non-financial assets and liabilities on October 1, 2009, and we do not expect the adoption of these provisions to materially impact our consolidated financial statements.
Forward Looking Statements
This document contains forward-looking statements within the meaning of the Private Securities Litigation Reform Act of 1995 and Section 21E of the Securities Exchange Act of 1934 concerning, among other things, our prospects, expected revenue, expenses and profits, developments and business strategies for our operations, all of which are subject to certain risks, uncertainties and assumptions. These forward-looking statements include all statements other than historical fact, including those identified as “Outlook” and by their use of terms and phrases such as “expect,” “estimate,” “project,” “forecast,” “believe,” “achievable,” “anticipate,” “should” and similar terms and phrases that convey the uncertainty of future events and outcomes. These statements are based on certain
39
Table of Contents
assumptions and analyses made by us in light of our experience and our perception of historical trends, current conditions, expected future developments and other factors we believe are appropriate under the circumstances but that may not prove to be accurate.
Such statements are subject to risks and uncertainties, including, but not limited to, general economic and business conditions; global economic activity; oil and natural gas market conditions; political and economic uncertainty; and other risks and uncertainties described elsewhere in this Report, including under “Item 1A. Risk Factors.” If one or more of these risks or uncertainties materialize, or if underlying assumptions prove incorrect, actual results may vary materially from those expected, estimated or projected. Forward-looking statements speak only as of the date they are made and, other than as required under securities laws, we do not assume a duty to update or revise these forward-looking statements.
| ITEM 7A. | Quantitative and Qualitative Disclosures About Market Risk |
The table below provides information about our market sensitive financial instruments and constitutes a “forward-looking statement.” Our major market risk exposure is to foreign currency fluctuations internationally and changing interest rates, primarily in the United States, Canada and Europe. Our policy is to manage interest rates through use of a combination of fixed and floating rate debt. If the floating rates were to increase by 10% from September 30, 2009, our combined interest expense to third parties would increase by a total of $3 thousand each month in which such increase continued. At September 30, 2009 and 2008, we had fixed-rate debt outstanding of $498.9 million and $498.7 million, net of discount, respectively. These instruments are fixed-rate and, therefore, do not expose us to the risk of loss in earnings due to changes in market interest rates. However, the fair value of these instruments would increase by approximately $11.3 million if interest rates were to decline by 10% from their rates at September 30, 2009.
Periodically, we borrow funds which are denominated in foreign currencies, which exposes us to market risk associated with exchange rate movements. There were $7.2 million and $7.6 million borrowings denominated in foreign currencies at September 30, 2009 and 2008, respectively. When management believes prudent, we enter into forward foreign exchange contracts to hedge the impact of foreign currency fluctuations. There were no such forward foreign exchange contracts at September 30, 2009 or 2008. The expected maturity dates and fair value of our market risk sensitive instruments are stated below (in millions of U.S. dollars):
| Expected Maturity Dates | Fair Value 9/30/09 | |||||||||||||||||||||||
| 2010 | 2011 | 2012 | 2013 | 2014 | Thereafter | Total | ||||||||||||||||||
| SHORT-TERM BORROWINGS: |
||||||||||||||||||||||||
| Bank borrowings; denominated in foreign currencies – average rate 4.5% |
$ | 7.2 | $ | — | $ | — | $ | — | $ | — | $ | — | $ | 7.2 | $ | 7.2 | ||||||||
| LONG-TERM BORROWINGS: |
||||||||||||||||||||||||
| 5.75% Senior Notes due 2011 |
— | 250.0 | — | — | — | — | 250.0 | 260.0 | ||||||||||||||||
| 6% Senior Notes due 2018 |
— | — | — | — | — | 250.0 | 250.0 | 251.5 | ||||||||||||||||
| Total |
$ | 7.2 | $ | 250.0 | $ | — | $ | — | $ | — | $ | 250.0 | $ | 507.2 | $ | 519.7 | ||||||||
40
Table of Contents
| ITEM 8. | Financial Statements and Supplementary Data |
MANAGEMENT’S REPORT ON INTERNAL CONTROL OVER FINANCIAL REPORTING
We are responsible for establishing and maintaining adequate internal control over financial reporting as such term is defined by the Securities and Exchange Act of 1934 Rule 13a-15(f). Our internal controls are designed to provide reasonable assurance as to the reliability of our financial statements for external purposes in accordance with accounting principles generally accepted in the United States of America.
Internal control over financial reporting has inherent limitations and may not prevent or detect misstatements. Therefore, even those systems determined to be effective can provide only reasonable assurance, not absolute, assurance with respect to the financial statement preparation and presentation. Further, because of changes in conditions, the effectiveness of internal control over financial reporting may vary over time.
Under the supervision and with the participation of our Chief Executive Officer and Chief Financial Officer, we have evaluated the effectiveness of our internal control over financial reporting as of September 30, 2009 as required by the Securities and Exchange Act of 1934 Rule 13a-15(c). In making our assessment, we have utilized the criteria set forth by the Committee of Sponsoring Organizations of the Treadway Commission in Internal Control – Integrated Framework. We concluded that based on our evaluation, our internal control over financial reporting was effective as of September 30, 2009.
The effectiveness of our internal control over financial reporting as of September 30, 2009 has been audited by Deloitte & Touche LLP, an independent registered public accounting firm, as stated in their report which is included herein.
| /S/ J.W. STEWART | /S/ JEFFREY E. SMITH | |||
| J.W. Stewart | Jeffrey E. Smith | |||
| President and Chief Executive Officer | Executive Vice President and Chief Financial Officer | |||
41
Table of Contents
REPORT OF INDEPENDENT REGISTERED PUBLIC ACCOUNTING FIRM
To the Board of Directors and Stockholders of
BJ Services Company:
Houston, Texas
We have audited the internal control over financial reporting of BJ Services Company and subsidiaries (the “Company”) as of September 30, 2009, based on criteria established in Internal Control – Integrated Framework issued by the Committee of Sponsoring Organizations of the Treadway Commission. The Company’s management is responsible for maintaining effective internal control over financial reporting and for its assessment of the effectiveness of internal control over financial reporting, included in the accompanying Management’s Report on Internal Control Over Financial Reporting. Our responsibility is to express an opinion on the Company’s internal control over financial reporting based on our audit.
We conducted our audit in accordance with the standards of the Public Company Accounting Oversight Board (United States). Those standards require that we plan and perform the audit to obtain reasonable assurance about whether effective internal control over financial reporting was maintained in all material respects. Our audit included obtaining an understanding of internal control over financial reporting, assessing the risk that a material weakness exists, testing and evaluating the design and operating effectiveness of internal control based on the assessed risk, and performing such other procedures as we considered necessary in the circumstances. We believe that our audit provides a reasonable basis for our opinion.
A company’s internal control over financial reporting is a process designed by, or under the supervision of, the company’s principal executive and principal financial officers, or persons performing similar functions, and effected by the company’s board of directors, management, and other personnel to provide reasonable assurance regarding the reliability of financial reporting and the preparation of financial statements for external purposes in accordance with generally accepted accounting principles. A company’s internal control over financial reporting includes those policies and procedures that (1) pertain to the maintenance of records that, in reasonable detail, accurately and fairly reflect the transactions and dispositions of the assets of the company; (2) provide reasonable assurance that transactions are recorded as necessary to permit preparation of financial statements in accordance with generally accepted accounting principles, and that receipts and expenditures of the company are being made only in accordance with authorizations of management and directors of the company; and (3) provide reasonable assurance regarding prevention or timely detection of unauthorized acquisition, use, or disposition of the company’s assets that could have a material effect on the financial statements.
Because of the inherent limitations of internal control over financial reporting, including the possibility of collusion or improper management override of controls, material misstatements due to error or fraud may not be prevented or detected on a timely basis. Also, projections of any evaluation of the effectiveness of the internal control over financial reporting to future periods are subject to the risk that the controls may become inadequate because of changes in conditions, or that the degree of compliance with the policies or procedures may deteriorate.
In our opinion, the Company maintained, in all material respects, effective internal control over financial reporting as of September 30, 2009, based on the criteria established in Internal Control – Integrated Framework issued by the Committee of Sponsoring Organizations of the Treadway Commission.
We have also audited, in accordance with the standards of the Public Company Accounting Oversight Board (United States), the consolidated financial statements as of and for the year ended September 30, 2009 of the Company and our report dated November 23, 2009 expressed an unqualified opinion on those consolidated financial statements.
| /s/ DELOITTE & TOUCHE LLP |
| Houston, Texas |
| November 23, 2009 |
42
Table of Contents
REPORT OF INDEPENDENT REGISTERED PUBLIC ACCOUNTING FIRM
To the Board of Directors and Stockholders of
BJ Services Company:
Houston, Texas
We have audited the accompanying consolidated statements of financial position of BJ Services Company and subsidiaries (the “Company”) as of September 30, 2009 and 2008, and the related consolidated statements of operations, stockholders’ equity and other comprehensive income, and cash flows for each of the three years in the period ended September 30, 2009. These financial statements are the responsibility of the Company’s management. Our responsibility is to express an opinion on these financial statements based on our audits.
We conducted our audits in accordance with the standards of the Public Company Accounting Oversight Board (United States). Those standards require that we plan and perform the audit to obtain reasonable assurance about whether the financial statements are free of material misstatement. An audit includes examining, on a test basis, evidence supporting the amounts and disclosures in the financial statements. An audit also includes assessing the accounting principles used and significant estimates made by management, as well as evaluating the overall financial statement presentation. We believe that our audits provide a reasonable basis for our opinion.
In our opinion, such consolidated financial statements present fairly, in all material respects, the financial position of BJ Services Company and subsidiaries at September 30, 2009 and 2008, and the results of their operations and their cash flows for each of the three years in the period ended September 30, 2009, in conformity with accounting principles generally accepted in the United States of America.
We have also audited, in accordance with the standards of the Public Company Accounting Oversight Board (United States), the Company’s internal control over financial reporting as of September 30, 2009, based on the criteria established in Internal Control – Integrated Framework issued by the Committee of Sponsoring Organizations of the Treadway Commission and our report dated November 23, 2009 expressed an unqualified opinion on the Company’s internal control over financial reporting.
| /s/ DELOITTE & TOUCHE LLP |
| Houston, Texas |
| November 23, 2009 |
43
Table of Contents
CONSOLIDATED STATEMENT OF OPERATIONS
| Year Ended September 30, | ||||||||||||
| 2009 | 2008 | 2007 | ||||||||||
| (in thousands, except per share amounts) | ||||||||||||
| Revenue |
$ | 4,121,897 | $ | 5,359,077 | $ | 4,730,493 | ||||||
| Operating expenses: |
||||||||||||
| Cost of sales and services |
3,523,838 | 4,091,262 | 3,261,032 | |||||||||
| Research and engineering |
66,270 | 71,997 | 67,536 | |||||||||
| Marketing |
108,186 | 120,655 | 107,113 | |||||||||
| General and administrative |
159,094 | 158,975 | 142,145 | |||||||||
| Loss on disposal of assets, net |
13,540 | 2,894 | 69 | |||||||||
| Pension settlement |
21,695 | — | — | |||||||||
| Total operating expenses |
3,892,623 | 4,445,783 | 3,577,895 | |||||||||
| Operating income |
229,274 | 913,294 | 1,152,598 | |||||||||
| Interest expense |
(27,248 | ) | (28,107 | ) | (32,741 | ) | ||||||
| Interest income |
1,224 | 1,912 | 1,624 | |||||||||
| Other expense, net |
(9,083 | ) | (8,579 | ) | (7,600 | ) | ||||||
| Income from continuing operations before income taxes |
194,167 | 878,520 | 1,113,881 | |||||||||
| Income tax expense |
28,196 | 258,034 | 360,073 | |||||||||
| Income from continuing operations |
165,971 | 620,486 | 753,808 | |||||||||
| Loss from discontinued operations, net of income tax benefit (expense) of $203, $(747) and $865, respectively |
(16,028 | ) | (11,121 | ) | (168 | ) | ||||||
| Net income |
$ | 149,943 | $ | 609,365 | $ | 753,640 | ||||||
| Basic earnings per share: |
||||||||||||
| Income from continuing operations |
$ | 0.57 | $ | 2.11 | $ | 2.57 | ||||||
| Loss from discontinued operations, net |
(0.06 | ) | (0.03 | ) | — | |||||||
| Net income per share |
$ | 0.51 | $ | 2.08 | $ | 2.57 | ||||||
| Diluted earnings per share: |
||||||||||||
| Income from continuing operations |
$ | 0.57 | $ | 2.10 | $ | 2.55 | ||||||
| Loss from discontinued operations, net |
(0.06 | ) | (0.04 | ) | — | |||||||
| Net income per share |
$ | 0.51 | $ | 2.06 | $ | 2.55 | ||||||
| Weighted average shares outstanding: |
||||||||||||
| Basic |
292,239 | 293,479 | 292,757 | |||||||||
| Diluted |
293,393 | 295,766 | 295,916 | |||||||||
| Dividends paid per share |
$ | 0.20 | $ | 0.20 | $ | 0.20 | ||||||
The accompanying notes are an integral part of these consolidated financial statements
44
Table of Contents
CONSOLIDATED STATEMENT OF FINANCIAL POSITION
ASSETS
| As of September 30, | ||||||
| 2009 | 2008 | |||||
| (in thousands) | ||||||
| Current assets: |
||||||
| Cash and cash equivalents |
$ | 282,636 | $ | 149,802 | ||
| Receivables, less allowance for doubtful accounts: $25,621 and $22,472, respectively |
786,063 | 1,134,733 | ||||
| Inventories: |
||||||
| Products |
248,251 | 283,157 | ||||
| Work-in-progress |
11,786 | 22,418 | ||||
| Parts |
183,496 | 185,952 | ||||
| Total inventories |
443,533 | 491,527 | ||||
| Deferred income taxes |
32,924 | 28,097 | ||||
| Prepaid expenses |
129,662 | 81,808 | ||||
| Current assets of discontinued operations |
7,618 | 34,560 | ||||
| Other current assets |
36,003 | 40,623 | ||||
| Total current assets |
1,718,439 | 1,961,150 | ||||
| Property: |
||||||
| Land |
47,699 | 44,121 | ||||
| Buildings and other |
431,459 | 404,348 | ||||
| Machinery and equipment |
3,715,354 | 3,395,908 | ||||
| Total property |
4,194,512 | 3,844,377 | ||||
| Less accumulated depreciation |
1,820,189 | 1,564,029 | ||||
| Property, net |
2,374,323 | 2,280,348 | ||||
| Goodwill |
977,941 | 975,451 | ||||
| Deferred income taxes |
22,039 | 20,859 | ||||
| Noncurrent assets of discontinued operations |
— | 32,601 | ||||
| Investments and other assets |
54,181 | 51,499 | ||||
| Total assets |
$ | 5,146,923 | $ | 5,321,908 | ||
The accompanying notes are an integral part of these consolidated financial statements
45
Table of Contents
BJ SERVICES COMPANY
CONSOLIDATED STATEMENT OF FINANCIAL POSITION
LIABILITIES AND STOCKHOLDERS’ EQUITY
| As of September 30, | ||||||||
| 2009 | 2008 | |||||||
| (in thousands, except shares) | ||||||||
| Current liabilities: |
||||||||
| Accounts payable, trade |
$ | 340,735 | $ | 550,330 | ||||
| Short-term borrowings |
7,202 | 57,610 | ||||||
| Accrued employee compensation and benefits |
123,944 | 148,181 | ||||||
| Income taxes |
24,189 | 43,126 | ||||||
| Taxes other than income |
38,349 | 43,700 | ||||||
| Current liabilities of discontinued operations |
1,121 | 4,667 | ||||||
| Other accrued liabilities |
183,372 | 172,606 | ||||||
| Total current liabilities |
718,912 | 1,020,220 | ||||||
| Long-term debt |
498,910 | 498,730 | ||||||
| Deferred income taxes |
204,502 | 153,713 | ||||||
| Accrued pension and postretirement benefits |
126,771 | 127,065 | ||||||
| Noncurrent liabilities of discontinued operations |
— | 210 | ||||||
| Other long-term liabilities |
77,911 | 80,163 | ||||||
| Commitments and contingencies |
||||||||
| Stockholders’ equity: |
||||||||
| Preferred stock (authorized 5,000,000 shares, none issued) |
||||||||
| Common stock, $0.10 par value (authorized 910,000,000 shares; 347,510,648 shares issued and 292,155,129 outstanding in 2009; 347,510,648 shares issued and 294,231,626 outstanding in 2008) |
34,752 | 34,752 | ||||||
| Capital in excess of par |
1,130,646 | 1,100,977 | ||||||
| Retained earnings |
3,743,791 | 3,677,258 | ||||||
| Accumulated other comprehensive income |
23,814 | 40,559 | ||||||
| Treasury stock, at cost (55,355,519 and 53,279,022 shares, respectively) |
(1,413,086 | ) | (1,411,739 | ) | ||||
| Total stockholders’ equity |
3,519,917 | 3,441,807 | ||||||
| Total liabilities and stockholders’ equity |
$ | 5,146,923 | $ | 5,321,908 | ||||
The accompanying notes are an integral part of these consolidated financial statements
46
Table of Contents
CONSOLIDATED STATEMENT OF STOCKHOLDERS’ EQUITY AND OTHER COMPREHENSIVE INCOME
(in thousands)
| Common Stock Shares |
Common Stock |
Capital In Excess of Par |
Treasury Stock |
Retained Earnings |
Accumulated Other Comprehensive Income |
Total | ||||||||||||||||||||
| Balance, October 1, 2006 |
293,194 | $ | 34,752 | $ | 1,028,813 | $ | (1,433,808 | ) | $ | 2,494,350 | $ | 22,833 | $ | 2,146,940 | ||||||||||||
| Comprehensive income: |
||||||||||||||||||||||||||
| Net income |
— | — | — | — | 753,640 | — | ||||||||||||||||||||
| Other comprehensive income, net of tax: |
||||||||||||||||||||||||||
| Cumulative translation adjustments |
— | — | — | — | — | 40,551 | ||||||||||||||||||||
| Minimum pension liability adjustment |
— | — | — | — | — | 3,272 | ||||||||||||||||||||
| Comprehensive income |
797,463 | |||||||||||||||||||||||||
| Adoption of new accounting principle on pensions, net of tax |
— | — | — | — | — | (15,012 | ) | (15,012 | ) | |||||||||||||||||
| Dividends declared |
— | — | — | — | (57,362 | ) | — | (57,362 | ) | |||||||||||||||||
| Treasury stock purchase |
(2,565 | ) | — | — | (74,597 | ) | — | — | (74,597 | ) | ||||||||||||||||
| Re-issuance of treasury stock for: |
||||||||||||||||||||||||||
| Stock options |
528 | — | — | 14,019 | (6,300 | ) | — | 7,719 | ||||||||||||||||||
| Stock purchase plan |
488 | — | — | 12,916 | (406 | ) | — | 12,510 | ||||||||||||||||||
| Other stock awards |
91 | — | (2,435 | ) | 2,435 | — | — | — | ||||||||||||||||||
| Stock-based compensation |
— | — | 31,625 | — | — | — | 31,625 | |||||||||||||||||||
| Tax benefit from exercise of options |
— | — | 2,112 | — | — | — | 2,112 | |||||||||||||||||||
| Balance, September 30, 2007 |
291,736 | $ | 34,752 | $ | 1,060,115 | $ | (1,479,035 | ) | $ | 3,183,922 | $ | 51,644 | $ | 2,851,398 | ||||||||||||
| Adoption of new accounting principle on income taxes |
— | — | — | — | (8,115 | ) | — | (8,115 | ) | |||||||||||||||||
| Comprehensive income: |
||||||||||||||||||||||||||
| Net income |
— | — | — | — | 609,365 | — | ||||||||||||||||||||
| Other comprehensive income, net of tax: |
||||||||||||||||||||||||||
| Cumulative translation adjustments |
— | — | — | — | — | (16,387 | ) | |||||||||||||||||||
| Changes in defined benefit and other postretirement plans |
— | — | — | — | — | 5,302 | ||||||||||||||||||||
| Comprehensive income |
598,280 | |||||||||||||||||||||||||
| Dividends declared |
— | — | — | — | (58,741 | ) | — | (58,741 | ) | |||||||||||||||||
| Treasury stock purchase |
(101 | ) | — | — | (2,089 | ) | — | — | (2,089 | ) | ||||||||||||||||
| Re-issuance of treasury stock for: |
||||||||||||||||||||||||||
| Stock options |
1,803 | — | — | 48,304 | (46,608 | ) | — | 1,696 | ||||||||||||||||||
| Stock purchase plan |
648 | — | — | 17,202 | (2,565 | ) | — | 14,637 | ||||||||||||||||||
| Other stock awards |
146 | — | (3,879 | ) | 3,879 | — | — | — | ||||||||||||||||||
| Stock-based compensation |
— | — | 30,237 | — | — | — | 30,237 | |||||||||||||||||||
| Tax benefit from exercise of options |
— | — | 14,504 | — | — | — | 14,504 | |||||||||||||||||||
| Balance, September 30, 2008 |
294,232 | $ | 34,752 | $ | 1,100,977 | $ | (1,411,739 | ) | $ | 3,677,258 | $ | 40,559 | $ | 3,441,807 | ||||||||||||
| Comprehensive income: |
||||||||||||||||||||||||||
| Net income |
— | — | — | — | 149,943 | — | ||||||||||||||||||||
| Other comprehensive income, net of tax: |
||||||||||||||||||||||||||
| Cumulative translation adjustments |
— | — | — | — | — | (24,853 | ) | |||||||||||||||||||
| Pension settlement |
— | — | — | — | — | 10,083 | ||||||||||||||||||||
| Changes in defined benefit and other postretirement plans |
— | — | — | — | — | (1,975 | ) | |||||||||||||||||||
| Comprehensive income |
133,198 | |||||||||||||||||||||||||
| Dividends declared |
— | — | — | — | (58,416 | ) | — | (58,416 | ) | |||||||||||||||||
| Treasury stock purchase |
(3,467 | ) | — | — | (44,190 | ) | — | — | (44,190 | ) | ||||||||||||||||
| Re-issuance of treasury stock for: |
||||||||||||||||||||||||||
| Stock options |
446 | — | — | 18,758 | (17,520 | ) | — | 1,238 | ||||||||||||||||||
| Stock purchase plan |
769 | — | — | 19,630 | (7,474 | ) | — | 12,156 | ||||||||||||||||||
| Other stock awards |
175 | — | (4,455 | ) | 4,455 | — | — | — | ||||||||||||||||||
| Stock-based compensation |
— | — | 33,866 | — | — | — | 33,866 | |||||||||||||||||||
| Tax benefit from exercise of options |
— | — | 258 | — | — | — | 258 | |||||||||||||||||||
| Balance, September 30, 2009 |
292,155 | $ | 34,752 | $ | 1,130,646 | $ | (1,413,086 | ) | $ | 3,743,791 | $ | 23,814 | $ | 3,519,917 | ||||||||||||
The accompanying notes are an integral part of these consolidated financial statements
47
Table of Contents
CONSOLIDATED STATEMENT OF CASH FLOWS
| Year Ended September 30, | ||||||||||||
| 2009 | 2008 | 2007 | ||||||||||
| (in thousands) | ||||||||||||
| Cash flows from operating activities: |
||||||||||||
| Income from continuing operations |
$ | 165,971 | $ | 620,486 | $ | 753,808 | ||||||
| Adjustments to reconcile income from continuing operations to cash provided by operating activities: |
||||||||||||
| Pension settlement |
21,695 | — | — | |||||||||
| Depreciation and amortization |
296,165 | 263,970 | 206,609 | |||||||||
| Minority interest expense |
13,765 | 11,903 | 11,315 | |||||||||
| Loss on disposal/impairment of assets, net |
13,540 | 2,895 | 69 | |||||||||
| Provision for bad debt |
8,750 | 9,606 | 6,541 | |||||||||
| Loss on sale of joint venture |
— | 2,947 | — | |||||||||
| Reserve for obsolescence and excess inventory |
14,950 | 12,816 | 5,891 | |||||||||
| Stock-based compensation expense |
41,759 | 30,989 | 30,626 | |||||||||
| Excess tax benefits from stock-based compensation |
(1,042 | ) | (14,699 | ) | (1,812 | ) | ||||||
| Deferred income tax expense |
29,054 | 59,320 | 17,425 | |||||||||
| Changes in: |
||||||||||||
| Receivables |
342,716 | (124,092 | ) | (107,494 | ) | |||||||
| Inventories |
37,364 | (10,240 | ) | (135,357 | ) | |||||||
| Prepaid expenses and other current assets |
(45,417 | ) | (3,969 | ) | (34,693 | ) | ||||||
| Accounts payable, trade |
(214,042 | ) | 12,392 | 101,305 | ||||||||
| Current income taxes |
(18,707 | ) | (9,444 | ) | (7,705 | ) | ||||||
| Other current liabilities |
(43,466 | ) | 50,377 | 15,304 | ||||||||
| Other, net |
(31,325 | ) | (14,612 | ) | (26,595 | ) | ||||||
| Net cash provided by operating activities from discontinued operations |
22,345 | (1,851 | ) | 5,420 | ||||||||
| Net cash provided by operating activities |
654,075 | 898,794 | 840,657 | |||||||||
| Cash flows from investing activities: |
||||||||||||
| Property additions |
(394,192 | ) | (605,584 | ) | (741,795 | ) | ||||||
| Proceeds from disposal of assets |
5,903 | 13,813 | 29,298 | |||||||||
| Acquisitions of businesses, net of cash received |
— | (57,174 | ) | (57,920 | ) | |||||||
| Net cash provided by (used in) investing activities from discontinued operations |
1,972 | 835 | (7,473 | ) | ||||||||
| Net cash used in investing activities |
(386,317 | ) | (648,110 | ) | (777,890 | ) | ||||||
| Cash flows from financing activities: |
||||||||||||
| Net proceeds from exercise of stock options and stock purchase plan |
16,676 | 14,207 | 22,388 | |||||||||
| Purchase of treasury stock |
(44,190 | ) | (2,089 | ) | (74,597 | ) | ||||||
| Proceeds from issuance of long-term debt |
— | 248,858 | — | |||||||||
| Repayment of long-term debt |
— | (250,000 | ) | — | ||||||||
| (Repayment) borrowing under Committed Credit Facility |
(50,000 | ) | 50,000 | — | ||||||||
| (Repayments) proceeds of short-term borrowings, net |
(408 | ) | (163,658 | ) | 10,994 | |||||||
| Dividends paid to stockholders |
(58,520 | ) | (58,617 | ) | (58,630 | ) | ||||||
| Excess tax benefits from stock-based compensation |
1,042 | 14,699 | 1,812 | |||||||||
| Distributions to minority interest partners |
(3,746 | ) | (5,231 | ) | — | |||||||
| Debt issuance costs |
— | (1,976 | ) | — | ||||||||
| Net cash used in financing activities |
(139,146 | ) | (153,807 | ) | (98,033 | ) | ||||||
| Effect of exchange rate changes on cash |
3,770 | (4,822 | ) | 1,020 | ||||||||
| Increase (decrease) in cash and cash equivalents |
132,382 | 92,055 | (34,246 | ) | ||||||||
| Cash and cash equivalents at beginning of year including, including $452, $1,466 and $3,566 related to discontinued operations |
150,254 | 58,199 | 92,445 | |||||||||
| Cash and cash equivalents at end of year, including $-, $452 and $1,466 related to discontinued operations |
$ | 282,636 | $ | 150,254 | $ | 58,199 | ||||||
The accompanying notes are an integral part of these consolidated financial statements
48
Table of Contents
NOTES TO CONSOLIDATED FINANCIAL STATEMENTS
1. Business, Basis of Presentation and Baker Hughes Merger Agreement
BJ Services Company (the “Company”), whose operations trace back to the Byron Jackson Company founded in 1872, was organized in 1990 under the corporate laws of the state of Delaware. We are a leading worldwide provider of pressure pumping and other oilfield services for the petroleum industry. Our pressure pumping services consist of cementing and stimulation services used in the completion of new oil and natural gas wells and in remedial work on existing wells, both onshore and offshore. The Oilfield Services Group includes casing and tubular services, process and pipeline services, chemical services, completion tools and completion fluids services.
We consolidate all investments in which we own greater than 50%. Intercompany balances and transactions are eliminated in consolidation. Investments in companies in which our ownership interest ranges from 20% to 50%, and we exercise significant influence over operating and financial policies, are accounted for using the equity method. Other investments are accounted for using the cost method.
The preparation of financial statements in conformity with accounting principles generally accepted in the United States of America requires us to make estimates and assumptions that affect the reported amounts of assets and liabilities and the disclosure of contingent assets and liabilities at the date of the financial statements and the reported amounts of revenue and expenses during the reporting periods. Actual results could differ from these estimates.
We have evaluated subsequent events through November 23, 2009, the date of issuance of the consolidated financial statements.
Baker Hughes Merger Agreement: On August 30, 2009, the Company and Baker Hughes Incorporated (“Baker Hughes”) entered into an Agreement and Plan of Merger (the “Merger Agreement”), pursuant to which the Company will merge with and into a wholly-owned subsidiary of Baker Hughes, and each share of Company common stock will be converted into the right to receive 0.40035 shares of Baker Hughes common stock and $2.69 in cash (the “Merger”). Completion of the Merger is subject to customary closing conditions, including (i) approval of the Merger by the stockholders of the Company, (ii) approval by the stockholders of Baker Hughes of the issuance of Baker Hughes common stock to execute the merger, (iii) applicable regulatory approvals, including the termination or expiration of the applicable waiting period under the U.S. Hart-Scott-Rodino Antitrust Improvements Act of 1976, as amended, (iv) the effectiveness of a registration statement on Form S-4 relating to the Baker Hughes common stock to be issued in the Merger, and (v) other customary closing conditions.
Under the Merger Agreement, the Company agreed to conduct its business in the ordinary course while the Merger is pending, and to generally refrain from acquiring new businesses, incurring new indebtedness, repurchasing treasury shares, issuing new common stock or equity awards, or entering into new material contracts or commitments outside the normal course of business, without the consent of Baker Hughes. The Company has incurred $5.3 million of costs related to the merger during fiscal 2009, which are included in general and administrative expense in the Corporate segment. Under certain circumstances, the Company or Baker Hughes may be required to pay a termination fee of $175 million to the other party if the Merger is not completed. When and if the Merger is approved or completed, certain contractual obligations of the Company will or may be triggered or accelerated under the “change of control” provisions of such contractual arrangements. Examples of such arrangements include stock-based compensation awards, severance and retirement plan agreements applicable to executive officers, directors and certain employees, and the equipment partnership described in Note 11.
Baker Hughes and the Company are working to comply with the U.S. Department of Justice’s second request for additional information and documentary material issued October 14, 2009, and to complete the Merger as quickly as practicable, and they currently expect the Merger to be completed during the Company’s second fiscal quarter of fiscal 2010. However, the Company cannot predict with certainty when the Merger will be completed, because completion of the Merger is subject to conditions both within and beyond the Company’s control.
49
Table of Contents
BJ SERVICES COMPANY
NOTES TO CONSOLIDATED FINANCIAL STATEMENTS—(Continued)
2. Summary of Significant Accounting Policies
Cash and cash equivalents: We consider all highly liquid investments purchased with original maturities of three months or less at the time of purchase to be cash equivalents.
Allowance for doubtful accounts: We perform ongoing credit evaluations of our customers and adjust credit limits based upon payment history and the customer’s current creditworthiness, as determined by our review of their available credit information. We continuously monitor collections and payments from our customers and maintain a provision for estimated uncollectible accounts based upon our historical experience and any specific customer collection issues that we have identified.
Inventories: Inventories, which consist principally of (i) products which are consumed in our services provided to customers, (ii) spare parts for equipment used in providing these services and (iii) manufactured components and attachments for equipment used in providing services, are stated primarily at the lower of weighted-average cost or market. Cost primarily represents invoiced costs. We regularly review inventory quantities on hand and record provisions for excess or obsolete inventory based primarily on our estimated forecast of product demand, market conditions, production requirements and technological developments. Significant or unanticipated changes in market condition or to our forecast could require additional provisions for excess or obsolete inventory.
Property: Property is stated at cost less amounts provided for permanent impairments and includes capitalized interest of $6.0 million, $7.0 million, and $8.0 million for the years ended September 30, 2009, 2008 and 2007, respectively. Depreciation is generally provided using the straight-line method over the estimated useful lives of individual items. Leasehold improvements are amortized on a straight-line basis over the shorter of their estimated useful lives or the lease terms. The estimated useful lives are 10 to 30 years for buildings and leasehold improvements and range from 3 to 12 years for machinery and equipment. We make judgments and estimates in conjunction with the carrying value of these assets, including amounts to be capitalized, depreciation and amortization methods and useful lives. Additionally, the carrying values of these assets are reviewed for impairment whenever events or changes in circumstances indicate that the carrying amounts may not be recoverable. The determination of recoverability is made based upon estimated undiscounted future cash flows. An impairment loss is recorded in the period in which it is determined that the carrying amount is not recoverable. The amount of the impairment, if any, is the amount by which the net book value of the asset exceeds fair value. Fair value determination requires us to make long-term forecasts of future revenue and costs related to the assets subject to review. These forecasts require assumptions about demand for our products and services, future market conditions and technological developments. Significant and unanticipated changes to these assumptions could require a provision for impairment in a future period.
Intangible assets: Goodwill represents the excess of cost over the fair value of the net assets of companies acquired in purchase transactions. We review goodwill by reporting unit for possible impairment on an annual basis, or if circumstances indicate that impairment may exist. In determining our reporting units we considered the way we manage our operations and the nature of those operations. Our reporting units are our operating segments. See Note 9 for Segment Information. We reviewed our goodwill balance for impairment at March 31, June 30 and September 30, 2009 and concluded each time that no impairment existed. In fiscal 2008 we recorded a $6.1 million impairment of goodwill related to our Russia operations. Other intangible assets primarily consist of acquired patents and are being amortized on a straight-line basis ranging from 2 to 20 years, with the weighted average amortization period being 12.2 years. We utilize undiscounted estimated cash flows to evaluate any possible impairment of intangible assets. The discount rate utilized is based on market factors at the time the evaluation is performed.
Income taxes: We provide for income taxes in accordance with ASC 740, Income Taxes. This standard takes into account the differences between financial statement treatment and tax treatment of certain transactions. Deferred tax assets and liabilities are recognized for the future tax consequences attributable to differences between the financial statement carrying amounts of existing assets and liabilities and their respective tax bases. Deferred tax assets and liabilities are measured using enacted tax rates expected to apply to taxable income in the years in which those temporary differences are expected to be recovered or settled. The effect of a change in tax rates is recognized as income or expense in the period that includes the enactment date. This calculation requires us to make certain estimates about our future operations. Changes in state, federal and foreign tax laws as well as changes in our financial condition could affect these estimates. We record a valuation allowance to reduce our deferred tax assets when it is more likely than not that some portion or all of the deferred tax assets will not be utilized. We consider all available evidence, both positive and negative, to determine whether a valuation allowance is needed. The ultimate realization of the deferred tax assets depends on the ability to generate sufficient taxable income of the appropriate
50
Table of Contents
BJ SERVICES COMPANY
NOTES TO CONSOLIDATED FINANCIAL STATEMENTS—(Continued)
character within the carryback or carryforward period set forth under the applicable tax law. Our tax filings for various periods are subjected to audit by tax authorities in the jurisdictions where we conduct business. These audits may result in assessments of additional taxes that are resolved with the authorities or potentially through the courts. Resolution of these situations inevitably includes some degree of uncertainty. ASC 740 also addresses the determination of whether tax benefits claimed or expected to be claimed on a tax return should be recorded in the financial statements. The tax benefit from an uncertain tax position is to be recognized when it is more likely than not, based on the technical merits of the position, that the position will be sustained on examination by the taxing authorities. Additionally, the amount of the tax benefit to be recognized is the largest amount of benefit that has a greater than fifty percent likelihood of being realized upon ultimate settlement. ASC 740 also provides guidance on derecognition, classification, interest and penalties on income taxes, accounting in interim periods, and financial statement disclosures. We recognize potential penalties and interest related to unrecognized tax benefits as a component of income tax expense.
Self-insurance accruals: We are self-insured for certain losses relating to workers’ compensation, general liability, property damage and employee medical benefits for claims filed and claims incurred but not reported. Our liability is based primarily on an actuarial undiscounted basis using individual case-based valuations and statistical analysis and is based upon judgment and historical experience; however, the final cost of many of these claims may not be known for five years or longer. We review our self-insurance accruals on a quarterly basis. We have purchased stop-loss coverage to limit, to the extent feasible, our aggregate exposure to certain claims. There is no assurance that such coverage will adequately protect us against liability from all potential consequences.
Contingencies: We record an estimated loss from a loss contingency when information available prior to the issuance of our financial statements indicates that it is probable that an asset has been impaired or a liability has been incurred at the date of the financial statements and the amount of the loss can be reasonably estimated. Accounting for contingencies such as environmental, legal and income tax matters requires us to use judgment. While we believe that our accruals for these matters are adequate, if the actual loss from a loss contingency is significantly different than the estimated loss, our results of operations may be adversely impacted. For significant litigation, we accrue for our estimated legal defense costs.
Environmental remediation and compliance: Environmental remediation costs are accrued based on estimates of known environmental exposures using currently available facts, existing environmental permits and technology and presently enacted laws and regulations. For sites where we are primarily responsible for the remediation, our estimate of costs are developed based on internal evaluations and are not discounted. Such accruals are recorded when environmental assessments and/or remedial efforts are probable and the cost can be reasonably estimated. The accrual is recorded even if significant uncertainties exist over the ultimate cost of the remediation and is updated as additional information becomes available. Ongoing environmental compliance costs, such as obtaining environmental permits, installation of pollution control equipment and waste disposal, are expensed as incurred. Where we have been identified as a potentially responsible party in a U.S. federal or state Superfund site, we accrue our share of the estimated remediation costs of the site based on the ratio of the estimated volume of waste contributed to the site by us to the total estimated volume of waste at the site.
Revenue recognition: Our revenue is composed of product sales, rental, service and other revenue. Products, rentals, and services are generally sold based on fixed or determinable priced purchase orders or contracts with the customer and do not include the right of return. We recognize revenue from product sales when title passes to the customer, the customer assumes risks and rewards of ownership, and collectibility is reasonably assured. Rental, service and other revenue is recognized when the services are provided and collectibility is reasonably assured.
Research and development expenditures: Research and development expenditures are expensed as incurred.
Maintenance and repairs: Expenditures for maintenance and repairs are expensed as incurred. Expenditures for renewals and improvements are capitalized if they extend the life, increase the capacity or improve the efficiency of the asset.
Foreign currency translation: Our functional currency is primarily the U.S. dollar. Gains and losses resulting from financial statement translation of foreign operations where a foreign currency is the functional currency are included in other comprehensive income. Our operations in Canada and Algeria use their respective local currencies as the functional currency.
51
Table of Contents
BJ SERVICES COMPANY
NOTES TO CONSOLIDATED FINANCIAL STATEMENTS—(Continued)
Derivative instruments: We occasionally enter into forward foreign exchange contracts to hedge the impact of currency fluctuations on certain transactions and assets and liabilities denominated in foreign currencies. We do not enter into derivative instruments for speculative or trading purposes. We recognize all derivatives on the balance sheet at fair value. No such contracts were outstanding as of September 30, 2009 or 2008.
Employee stock-based compensation: Employee services received in exchange for stock or stock-based awards are expensed in accordance with ASC 505, Equity and ASC 718, Compensation – Stock Compensation. The fair value of the employee services received in exchange for stock-based awards is measured based on the grant-date fair value which is determined using the Black-Scholes option-pricing model for the stock option awards, bonus stock and phantom stock and a Monte-Carlo simulation model for the performance units. Awards granted are expensed ratably over the vesting period of the award, unless retirement age is reached in which case the expense is accelerated. We reduce the expense recognized based on an estimated forfeiture rate at the time of grant and revise this rate, if necessary, in subsequent periods to reflect actual forfeitures. Excess tax benefits, as defined, are recognized as an addition to capital in excess of par. Detriments are recognized as a reduction to capital in excess of par to the extent that there is sufficient capital in excess of par available. To the extent there is not sufficient capital in excess of par available, the detriment is recorded as income tax expense.
New accounting pronouncements: In June 2009, the Financial Accounting Standards Board (“FASB”) issued guidance contained in ASC 105, Generally Accepted Accounting Principles, establishing an authoritative United States GAAP superseding all pre-existing accounting standards and literature. This guidance is effective for financial statements issued for interim and annual periods after September 15, 2009. Consequently, we have changed the accounting literature references contained in this report, but other than that, this new standard had no significant impact on our consolidated financial statements.
In June 2009, the FASB issued ASC 810, Consolidation – Variable Interest Entities, which addresses the addition of qualified special purpose entities into previous guidance as the concept of these entities was eliminated by ASC 860. This guidance also modifies the analysis by which a controlling interest of a variable interest entity is determined thereby requiring the controlling interest to consolidate the variable interest entity. A controlling interest exists if a party to a variable interest entity has both (i) the power to direct the activities of a variable interest entity that most significantly impact the entity’s economic performance and (ii) the obligation to absorb losses of or receive benefits from the entity that could be potentially significant to the variable interest entity. This statement could impact the way we account for our limited partnership discussed in Note 11 under Lease and Other Long-Term Commitments. ASC 810 becomes effective as of the beginning of the first annual reporting period beginning after November 15, 2009 and should be applied prospectively for interim and annual periods during that period going forward. We will adopt the guidance under ASC 810 on October 1, 2010, and have not yet determined the impact, if any, on our consolidated financial statements.
In June 2009, the FASB issued guidance under ASC 860 – Transfers and Servicing, which eliminates the concept of a qualified special purpose entity and enhances guidance related to derecognition of transferred assets. ASC 860 becomes effective as of the beginning of the first annual reporting period beginning after November 15, 2009 and should be applied prospectively for interim and annual periods during that period going forward. We will adopt the guidance under ASC 860 on October 1, 2010, and have not yet determined the impact, if any, on our consolidated financial statements.
On June 30, 2009, we adopted guidance under ASC 825, Financial Instruments – Overall, requiring publicly-traded companies to disclose the fair value of financial instruments in their interim financial statements. See Note 7 for such disclosure.
In May 2009, the FASB issued guidance in ASC 855, Subsequent Events, to establish general standards of accounting for and disclosures of events that occur after the balance sheet date but before financial statements are issued or are available to be issued. We adopted this guidance beginning with our June 30, 2009 condensed consolidated financial statements.
In December 2008, the FASB issued guidance under ASC 715, Compensation – Retirement Benefits – Defined Benefit Plans, requiring the disclosure of major categories of plan assets, investment policies and strategies, fair value measurement of plan assets and significant concentration of credit risks related to defined benefit pension or other postretirement plans. This guidance is effective for fiscal years ending after December 15, 2009 and, accordingly, we will adopt it in fiscal 2010.
52
Table of Contents
BJ SERVICES COMPANY
NOTES TO CONSOLIDATED FINANCIAL STATEMENTS—(Continued)
In April 2008, the FASB issued guidance contained in ASC 350, Intangibles – Goodwill and Others – General Intangibles Other than Goodwill, amending the factors that should be considered in developing renewal or extension assumptions used to determine the useful life of a recognized intangible asset under previously existing literature. The objective of this guidance is to improve the consistency between the useful life of a recognized intangible asset under ASC 350 and the period of expected cash flows used to measure the fair value of the asset under ASC 805, Business Combinations. ASC 350 is effective for the Company beginning October 1, 2009, and is not expected to have a significant impact on our consolidated financial statements.
In March 2008, the FASB issued guidance under ASC 815, Derivatives and Hedging, changing the disclosure requirements for derivative instruments and hedging activities. Entities are required to provide enhanced disclosures about (1) how and why an entity uses derivative instruments, (2) how derivative instruments and related hedged items are accounted for under ASC 815, and its related interpretations, and (3) how derivative instruments and related hedged items affect an entity’s financial position, financial performance and cash flows. We adopted this guidance in the second quarter of fiscal 2009. We currently have no derivative financial instruments subject to accounting or disclosure under ASC 815; therefore, the guidance under ASC 815 had no effect on our consolidated statements of financial position, results of operations or cash flows.
In December 2007, the FASB issued guidance under ASC 805, Business Combinations, that retains fundamental requirements requiring the acquisition method of accounting be used for all business combinations and for an acquirer to be identified for each business combination. ASC 805 defines the acquirer as the entity that obtains control of one or more businesses in the business combination and establishes the acquisition date as the date that the acquirer achieves control. ASC 805 establishes principles and requirements for how the acquirer:
| a. | Recognizes and measures in its financial statements the identifiable assets acquired, the liabilities assumed, and any noncontrolling interest in the acquiree. |
| b. | Recognizes and measures the goodwill acquired in the business combination or a gain from a bargain purchase. |
| c. | Determines what information to disclose to enable users of the financial statements to evaluate the nature and financial effects of the business combination. |
This guidance is effective for business combinations occurring on or after the beginning of the first annual reporting period beginning after December 15, 2008. Consequently, we will adopt this guidance on October 1, 2009.
In December 2007, the FASB issued guidance under ASC 810, Consolidation – Overall – Transition, amending previous guidance to establish accounting and reporting standards for the noncontrolling interest in a subsidiary and for the deconsolidation of a subsidiary. ASC 810 requires consolidated net income to be reported at amounts that include the amounts attributable to both the parent and the noncontrolling interest. It also requires disclosure, on the face of the consolidated statement of income, of the amounts of consolidated net income attributable to the parent and to the noncontrolling interest and requires that a parent recognize a gain or loss in net income when a subsidiary is deconsolidated. ASC 810 requires expanded disclosures in the consolidated financial statements that identify and distinguish between the interests of the parent’s owners and the interests of the noncontrolling owners of a subsidiary and shall be applied prospectively as of the beginning of the fiscal year in which initially applied, except for the presentation and disclosure requirements. The presentation and disclosure requirements shall be applied retrospectively for all periods presented. This guidance is effective for fiscal years beginning after December 15, 2008 (our fiscal year beginning October 1, 2009). We do not have significant noncontrolling interests in consolidated subsidiaries, and therefore, adoption of this guidance is not expected to have a significant impact on our consolidated financial statements.
In February 2007, the FASB issued guidance under ASC 825, Financial Instruments, providing companies with an option to report selected financial assets and liabilities at fair value. Under ASC 825, companies that elect the fair value option will report unrealized gains and losses in earnings at each subsequent reporting date. In addition, the guidance establishes presentation and disclosure requirements designed to facilitate comparisons between companies that choose different measurement attributes for similar types of assets and liabilities. The fair value option election is irrevocable, unless a new election date occurs. ASC 825 is effective the beginning of an entity’s first fiscal year beginning after November 15, 2007 and is to be applied prospectively, unless the entity elects early adoption. Consequently, we adopted ASC 825 effective October 1, 2008 and elected not to apply the fair value option.
53
Table of Contents
BJ SERVICES COMPANY
NOTES TO CONSOLIDATED FINANCIAL STATEMENTS—(Continued)
In September 2006, the FASB issued guidance under ASC 820, Fair Value Measurements and Disclosures, section 10, defining fair value, outlining a fair value hierarchy (requiring market-based assumptions be used, if available) and setting disclosure requirements of assets and liabilities measured at fair value based on their level in the hierarchy. On October 1, 2008, we adopted, without material impact on our consolidated financial statements, the provisions of ASC 820 related to financial assets and liabilities. We will adopt the provisions of ASC 820 related to non-financial assets and liabilities on October 1, 2009 and we do not expect the adoption of these provisions to materially impact our consolidated financial statements.
3. Discontinued Operations
We completed work on our final pressure pumping contract in Russia in July 2009. Consequently, we classified the Russia pressure pumping unit, an operating segment within the International Pumping Services segment, as a discontinued operation. Accordingly, the assets and liabilities of this business, along with its results of operations, have been reclassified for all periods presented. As soon as our contractual obligations were fulfilled, we began the process of redeployment and liquidation of the assets associated with this business and other exit activities. In the fourth quarter of fiscal 2009, we recorded charges totaling $6.6 million in connection with these exit activities, including employee separation costs, fixed asset and inventory impairment charges. We expect to incur additional exit costs during fiscal 2010 in the range of $3-4 million as we complete the exit activities associated with our Russia pressure pumping business.
In fiscal 2008, the goodwill related to our Russia pressure pumping operations of $6.1 million was fully impaired. Our analysis at that time indicated that such goodwill would likely not be recoverable, largely as a result of competitive pressure in the areas in which we operated, cost inflation, currency risks and concerns over future activity reductions.
Summarized operating results from discontinued operations are as follows:
| Year Ended September 30, | ||||||||||||
| 2009 | 2008 | 2007 | ||||||||||
| (in thousands) | ||||||||||||
| Revenue |
$ | 30,035 | $ | 67,185 | $ | 71,916 | ||||||
| Loss before income taxes |
(16,231 | ) | (10,374 | ) | (1,033 | ) | ||||||
| Income tax expense (benefit) |
(203 | ) | 747 | (865 | ) | |||||||
| Loss from discontinued operations |
$ | (16,028 | ) | $ | (11,121 | ) | $ | (168 | ) | |||
Significant categories of assets and liabilities from discontinued operations are shown below, as of September 30:
| 2009 | 2008 | |||||
| (in thousands) | ||||||
| Total assets: |
||||||
| Receivables, net of allowance for doubtful accounts |
$ | — | $ | 16,503 | ||
| Inventories, net |
2,910 | 16,348 | ||||
| Prepaid and other current assets |
— | 1,709 | ||||
| Property, net |
4,708 | 32,601 | ||||
| Total assets |
$ | 7,618 | $ | 67,161 | ||
| Total liabilities: |
||||||
| Accounts payable, trade |
$ | — | $ | 4,285 | ||
| Accrued liabilities |
1,121 | 592 | ||||
| Total liabilities |
$ | 1,121 | $ | 4,877 | ||
4. Acquisitions of Businesses
Fiscal 2008
On May 21, 2008, we acquired all of the outstanding shares of Innicor Subsurface Technologies Inc. (“Innicor”) for a purchase price of $54.4 million, including transaction costs, which resulted in an increase of $36.4 million in total current assets, $14.5 million in property and equipment, $0.7 million in intangible assets, $11.3 million in current liabilities, $3.1 million in long term liabilities and $17.2 million of goodwill. Innicor designs, manufactures and provides tools and equipment utilized in the completion and production phases of oil and gas well development in Canada and select international markets. This business complements our completion tools business in the Oilfield Services Group. Pro forma financial information for this acquisition is not included as it is not material to our consolidated financial statements.
54
Table of Contents
BJ SERVICES COMPANY
NOTES TO CONSOLIDATED FINANCIAL STATEMENTS—(Continued)
Fiscal 2007
On November 3, 2006, we completed the acquisition of Profile International Ltd. (“Profile”) for a total purchase price of $2.5 million, which resulted in $2.2 million of goodwill. Profile, located in Newcastle, England, was a provider of caliper inspection tools for pipeline integrity assessment to markets worldwide. This business complements our pipeline inspection business in the Oilfield Services Group segment.
On December 20, 2006, we purchased substantially all of the operating assets of Tekcor Technology, Ltd. (“Tekcor”) for $8.3 million, which resulted in an increase of $3.6 million to total current assets, $0.7 million in property and equipment and $4.0 million to technology-based intangible assets. Located in Houston, Texas, Tekcor was a provider of specialty chemicals and related services to the oil and gas well drilling industry along the Texas and Louisiana Gulf Coast and is included in our completion fluids business in the Oilfield Services Group segment.
On March 1, 2007 we acquired Aberdeen-based Norson Services Ltd, (“Norson”), a division of Norson Group Ltd., and substantially all of the assets of Norson Group’s United States subsidiary Norson Services LLC. The total purchase price paid for both acquisitions was $29.0 million, including legal fees, which resulted in an increase of $7.4 million in total current assets, $5.9 million in property and equipment, $1.8 million in intangible assets, $5.4 million in current liabilities and $19.3 million of goodwill. The addition of Norson’s hydraulic and electrical umbilical testing services and the services provided by the Norson’s subsea units, which include remote pigging and flooding, subsea hydro testing and subsea data logging, strengthened the service capabilities of our process and pipeline services business in the Oilfield Services Group segment.
On June 30, 2007, we completed the acquisition of substantially all of the capillary tubing assets of Allis-Chalmers for a total purchase price of $16.3 million, which resulted in an increase of $1.5 million in current assets, $1.8 in property and equipment and $13.0 million of goodwill. The assets are used for the installation and service of capillary injection systems primarily in the United States and Mexico. The assets complement our Dyna-Coil acquisition which occurred in the fourth quarter of fiscal 2006 and enhance our chemical services operation in the Oilfield Services Group segment.
Pro forma financial information for our fiscal 2007 acquisitions is not included as they were not material individually or in aggregate to our consolidated financial statements.
5. Earnings Per Share
Basic earnings per share excludes dilution and is computed by dividing net income by the weighted-average number of common shares outstanding for the period. Diluted earnings per share is based on the weighted-average number of shares outstanding during each period and the assumed exercise of dilutive instruments (stock options, employee stock purchase plan, stock incentive awards, bonus stock and director stock awards) less the number of treasury shares assumed to be purchased with the exercise proceeds using the average market price of our common stock for each of the periods presented.
55
Table of Contents
BJ SERVICES COMPANY
NOTES TO CONSOLIDATED FINANCIAL STATEMENTS—(Continued)
The following table presents information necessary to calculate earnings per share for each of the three years in the period ended September 30, 2009 (in thousands, except per share amounts):
| 2009 | 2008 | 2007 | ||||||||||
| Income from continuing operations |
$ | 165,971 | $ | 620,486 | $ | 753,808 | ||||||
| Loss from discontinued operations |
(16,028 | ) | (11,121 | ) | (168 | ) | ||||||
| Net income |
$ | 149,943 | $ | 609,365 | $ | 753,640 | ||||||
| Weighted-average common shares outstanding |
292,239 | 293,479 | 292,757 | |||||||||
| Basic earnings per share: |
||||||||||||
| Income from continuing operations |
$ | 0.57 | $ | 2.11 | $ | 2.57 | ||||||
| Loss from discontinued operations |
(0.06 | ) | (0.03 | ) | — | |||||||
| Net income |
$ | 0.51 | $ | 2.08 | $ | 2.57 | ||||||
| Weighted-average common and dilutive potential common shares outstanding: |
||||||||||||
| Weighted-average common shares outstanding |
292,239 | 293,479 | 292,757 | |||||||||
| Assumed exercise of stock options |
25 | 1,792 | 2,960 | |||||||||
| Assumed stock purchase plan grants |
— | 297 | 135 | |||||||||
| Assumed vesting of other stock awards |
1,129 | 198 | 64 | |||||||||
| Weighted-average dilutive shares outstanding |
293,393 | 295,766 | 295,916 | |||||||||
| Diluted earnings per share: |
||||||||||||
| Income from continuing operations |
$ | 0.57 | $ | 2.10 | $ | 2.55 | ||||||
| Loss from discontinued operations |
(0.06 | ) | (0.04 | ) | — | |||||||
| Net income |
$ | 0.51 | $ | 2.06 | $ | 2.55 | ||||||
For the years ended September 30, 2009, 2008 and 2007, 11.4 million, 2.9 million and 2.9 million stock options, respectively, were excluded from the computation of diluted earnings per share due to their antidilutive effect. For the year ended September 30, 2009, the 0.9 million shares to be granted under the stock purchase plan (see Note 14) were excluded from the computation of diluted earnings per share due to their antidilutive effect.
6. Debt
Long-term debt at September 30 consisted of the following (in thousands):
| 2009 | 2008 | |||||
| 5.75% Senior Notes due 2011, net of discount |
$ | 249,891 | $ | 249,825 | ||
| 6% Senior Notes due 2018, net of discount |
249,019 | 248,905 | ||||
| Long-term debt |
$ | 498,910 | $ | 498,730 | ||
On May 19, 2008, we completed a public offering of $250.0 million of 6% Senior Notes due 2018. The net proceeds from the offering of approximately $246.9 million, after deducting underwriting discounts and commissions and expenses, were used to retire $250.0 million in outstanding floating rate Senior Notes, which matured June 1, 2008. We also have outstanding $250.0 million of 5.75% Senior Notes due 2011.
Our amended and restated revolving credit facility (the “Revolving Credit Facility”) permits borrowings of up to $400 million in principal amount. The Revolving Credit Facility includes a $50 million sublimit for the issuance of standby letters of credit and a $20 million sublimit for swingline loans. Swingline loans have short-term maturities and the remaining amounts outstanding under the Revolving Credit Facility become due and payable in August 2012. In addition, we have the right to request up to an additional $200 million over the permitted borrowings of $400 million, subject to the approval of our lenders at the time of the request. Depending on the amount of borrowings outstanding under this facility, the interest rate applicable to borrowings generally ranges from 30-40 basis points above LIBOR. We are charged various fees in connection with the Revolving Credit Facility, including a commitment fee based on the average daily unused portion of the commitment, totaling $0.3 million, $0.2 million and $0.3 million in fiscal 2009, 2008 and 2007, respectively. In addition, the Revolving Credit Facility charges a utilization fee on all outstanding loans and letters of credit when usage of the Revolving Credit Facility exceeds 62.5%; there were no material utilization fees incurred for the fiscal years ended September 30,
56
Table of Contents
BJ SERVICES COMPANY
NOTES TO CONSOLIDATED FINANCIAL STATEMENTS—(Continued)
2009, 2008 or 2007. There were no borrowings under the Revolving Credit Facility at September 30, 2009 and 2008 and pursuant to the Merger Agreement, their must be no borrowings outstanding under the Revolving Credit Facility on the completion date of the Merger.
In May 2008, we entered into a $50.0 million Committed Credit Facility with a commercial bank to finance our acquisition of Innicor Subsurface Technologies Inc. There were no commitment fees required by this facility, and the interest rate was based on market rates on the dates that amounts are borrowed. This facility expired in May 2009 and was repaid with cash on hand.
In addition to the Revolving Credit Facility, we had available $24.3 million of unsecured discretionary lines of credit at September 30, 2009, which expire at the bank’s discretion. There are no requirements for commitment fees or compensating balances in connection with these lines of credit, and interest is at prevailing market rates. There was $7.2 million and $7.6 million in outstanding borrowings under these lines of credit at September 30, 2009 and 2008, respectively. The weighted average interest rates on short-term borrowings outstanding as of September 30, 2009 and 2008 were 4.50% and 5.23%, respectively.
The Senior Notes and Revolving Credit Facility include various customary covenants and other provisions, including the maintenance of certain profitability and solvency ratios, none of which materially restrict our activities. We are currently in compliance with all financial covenants imposed.
7. Financial Instruments
The following methods and assumptions were used to estimate the fair value of each class of financial instruments for which it is practicable.
Cash and Cash Equivalents, Short-term Investments, Trade Receivables, Trade Payables and Short-Term Borrowings: The carrying amount approximates fair value because of the short-term maturity of those instruments.
Long-term Debt: Fair value is based on quoted prices in active markets for our debt securities.
Foreign Currency Debt: Periodically, we borrow funds which are denominated in foreign currencies, which exposes us to market risk associated with exchange rate movements. There were $7.2 million and $7.6 million borrowings denominated in foreign currencies at September 30, 2009 and 2008, respectively.
The fair value of financial instruments that differed from their carrying value at September 30, 2009 and 2008 was as follows (in thousands):
| 2009 | 2008 | |||||||||||
| Carrying Amount |
Fair Value |
Carrying Amount |
Fair Value | |||||||||
| 5.75% Senior Notes due 2011 |
$ | 249,891 | $ | 260,000 | $ | 249,825 | $ | 255,225 | ||||
| 6% Senior Notes due 2018 |
249,019 | 251,465 | 248,905 | 250,300 | ||||||||
8. Income Taxes
The geographical sources of income from continuing operations before income taxes for each of the three years in the period ended September 30, 2009 were as follows (in thousands):
| 2009 | 2008 | 2007 | ||||||||
| United States |
$ | (81,935 | ) | $ | 522,242 | $ | 831,852 | |||
| International |
276,102 | 356,278 | 282,029 | |||||||
| Income from continuing operations before income taxes |
$ | 194,167 | $ | 878,520 | $ | 1,113,881 | ||||
57
Table of Contents
BJ SERVICES COMPANY
NOTES TO CONSOLIDATED FINANCIAL STATEMENTS—(Continued)
The provision for income taxes for each of the three years in the period ended September 30, 2009 is summarized below (in thousands):
| 2009 | 2008 | 2007 | ||||||||
| Current: |
||||||||||
| United States – Federal |
$ | (54,448 | ) | $ | 106,467 | $ | 260,374 | |||
| United States – State |
(9,899 | ) | 12,234 | 21,680 | ||||||
| International |
63,489 | 80,013 | 60,594 | |||||||
| Total current |
(858 | ) | 198,714 | 342,648 | ||||||
| Deferred: |
||||||||||
| United States – Federal |
12,641 | 45,634 | 5,069 | |||||||
| United States – State |
1,849 | 4,872 | 1,258 | |||||||
| International |
14,564 | 8,814 | 11,098 | |||||||
| Total deferred |
29,054 | 59,320 | 17,425 | |||||||
| Income tax expense |
$ | 28,196 | $ | 258,034 | $ | 360,073 | ||||
The consolidated effective income tax rates (as a percent of income before income taxes) for each of the three years in the period ended September 30, 2009 varied from the U.S. statutory income tax rate for the reasons set forth below:
| 2009 | 2008 | 2007 | |||||||
| U.S. statutory rate |
35.0 | % | 35.0 | % | 35.0 | % | |||
| Foreign earnings at varying rates |
(17.8 | ) | (4.5 | ) | (3.1 | ) | |||
| State income taxes, net of federal benefit |
(2.7 | ) | 1.3 | 1.3 | |||||
| Other income taxes |
10.9 | 1.8 | 1.0 | ||||||
| Changes in valuation allowance |
2.7 | (1.0 | ) | (1.1 | ) | ||||
| Foreign income recognized domestically |
3.7 | (0.1 | ) | — | |||||
| Foreign expense recognized domestically |
(9.4 | ) | — | — | |||||
| Domestic production activity deduction |
— | (1.0 | ) | (0.7 | ) | ||||
| Tax credits |
(9.8 | ) | (1.2 | ) | (1.0 | ) | |||
| Nondeductible expenses |
1.3 | 0.5 | 1.0 | ||||||
| Other, net |
0.6 | (1.4 | ) | (0.1 | ) | ||||
| 14.5 | % | 29.4 | % | 32.3 | % | ||||
58
Table of Contents
BJ SERVICES COMPANY
NOTES TO CONSOLIDATED FINANCIAL STATEMENTS—(Continued)
Deferred tax assets and liabilities are recognized for the estimated future tax effects of temporary differences between the tax basis of assets or liabilities and its reported amount in the financial statements. The measurement of deferred tax assets and liabilities is based on enacted tax laws and rules currently in effect in each of the taxing jurisdictions in which we have operations. Generally, deferred tax assets and liabilities are classified as current or noncurrent according to the classification of the related asset or liability for financial reporting purposes. Deferred tax assets and liabilities as of September 30 were as follows (in thousands):
| 2009 | 2008 | |||||||
| Assets: |
||||||||
| Accrued compensation expense |
$ | 46,857 | $ | 35,769 | ||||
| Accrued postretirement benefits |
9,412 | 18,114 | ||||||
| Pension liability |
22,798 | 16,927 | ||||||
| Deferred / unrealized gain |
859 | 2,161 | ||||||
| Accrued insurance expense |
11,376 | 12,449 | ||||||
| Other accrued expenses |
5,228 | 18,009 | ||||||
| Foreign tax credit carryforwards |
14,948 | — | ||||||
| Deferred revenue |
7,099 | 4,151 | ||||||
| Net operating and capital loss carryforwards |
7,220 | 10,230 | ||||||
| Valuation allowance |
(7,795 | ) | (1,831 | ) | ||||
| Total deferred tax asset |
118,002 | 115,979 | ||||||
| Liabilities: |
||||||||
| Differences in depreciable basis of property |
(265,733 | ) | (212,418 | ) | ||||
| Unrealized gain/loss |
— | (6,332 | ) | |||||
| Pension asset |
— | (2,547 | ) | |||||
| Earnings of foreign affiliates |
(1,946 | ) | — | |||||
| Total deferred tax liability |
(267,679 | ) | (221,297 | ) | ||||
| Net deferred tax liability |
$ | (149,677 | ) | $ | (105,318 | ) | ||
We adopted the provisions of ASC 740 regarding the recognition of tax benefits on October 1, 2007. As a result of the implementation of the new standard, we recognized a reduction of $8.1 million in the October 1, 2007 balance of retained earnings, with a corresponding increase to other long-term liabilities. We have unrecognized tax benefits which, if recognized, would favorably affect the effective tax rate in the period in which recognized. A reconciliation of the beginning and ending amount of unrecognized tax benefits is as follows (in thousands):
| Gross Unrecognized Tax Benefits, Excluding Interest and Penalties |
Interest and Penalties |
Total Gross Unrecognized Tax Benefits |
||||||||||
| Balance at October 1, 2008 |
$ | 50,383 | $ | 8,866 | $ | 59,249 | ||||||
| Increases during fiscal 2009 |
5,593 | 3,165 | 8,758 | |||||||||
| Decreases due to resolution of uncertain tax positions |
(16,044 | ) | (1,532 | ) | (17,576 | ) | ||||||
| Balance at September 30, 2009 |
$ | 39,932 | $ | 10,499 | $ | 50,431 | ||||||
We recognize potential penalties and interest related to unrecognized tax benefits as a component of income tax expense. It is reasonably possible that approximately $14.4 million of unrecognized tax benefits could be realized in the next twelve months, due to expiring statutes of limitation and settlements with government authorities.
We file tax returns in the United States and approximately fifty countries and are subject to audits periodically, none of which is expected to have a material impact on our financial statements. Due to the uncertainty and various stages of such audits, we are unable to make reasonably reliable estimates of the period of any cash settlement related to our tax benefit liabilities or whether any material net cash settlement will be required. The United States and Canada are our major taxing jurisdictions. The earliest open tax year subject to examination is 2006 for the United States and 2001 for Canada.
At September 30, 2009, we had approximately $31.3 million of foreign net operating loss carryforwards and $1.0 million of state net operating loss carryforwards. The foreign net operating loss carryforwards expire as follows: $1.3 million in 2012, $2.4 million by fiscal year 2014 and the remaining $27.6 million does not expire. The state net operating losses will expire between fiscal year 2010 and fiscal year 2019.
59
Table of Contents
BJ SERVICES COMPANY
NOTES TO CONSOLIDATED FINANCIAL STATEMENTS—(Continued)
We record a valuation allowance to reduce our deferred tax assets when it is more likely than not that some portion or all of the deferred tax assets will expire before realization of the benefit. Because management believes that it is more likely than not that a portion of the foreign net operating loss carryforwards and foreign tax credit carryforwards will not be realized, a valuation allowance has been recorded on a portion of these amounts.
Our stock basis difference in foreign subsidiaries, for which a U.S. deferred tax liability has not been established, is approximately $866.7 million as of September 30, 2009. This stock basis difference arises from the existence of unremitted foreign earnings and cumulative translation adjustments. We have provided additional taxes for the anticipated repatriation of foreign earnings of our foreign subsidiaries where we have determined that the foreign subsidiaries earnings are not indefinitely reinvested. For foreign subsidiaries whose earnings are indefinitely reinvested, no provision for U.S. federal and state income taxes has been recorded. If we were to record a tax liability for the full tax versus book basis difference of our foreign subsidiaries, an additional net deferred tax liability of approximately $121.2 million would be recorded as of September 30, 2009.
9. Segment Information
We currently have twelve operating segments for which separate financial information is available and that have separate management teams that are engaged in oilfield services. The results for these operating segments are evaluated regularly by the chief operating decision maker in deciding how to allocate resources and assessing performance. The operating segments have been aggregated into four reportable segments: U.S./Mexico Pressure Pumping, Canada Pressure Pumping, International Pressure Pumping and the Oilfield Services Group. We revised our internal management reporting structure in fiscal 2009, moving our U.S. service tool business, which previously had been reported within the U.S./Mexico Pressure Pumping segment, into the completion tools division of our Oilfield Services Group. All periods presented have been recast to conform to the new reporting structure.
The U.S./Mexico Pressure Pumping segment has two operating segments that provide cementing services and stimulation services (consisting of fracturing, acidizing, sand control, nitrogen, coiled tubing and service tool services) throughout the United States and Mexico. These two operating segments have been aggregated into one reportable segment because they offer the same type of services, have similar economic characteristics, have similar production processes and use the same methods to provide their services.
The Canada Pressure Pumping segment has one operating segment. Like U.S./Mexico Pressure Pumping, it provides cementing and stimulation services. These services are provided to customers in major oil and natural gas producing areas of Canada.
The International Pressure Pumping segment has four operating segments. Similar to U.S./Mexico and Canada Pressure Pumping, it provides cementing and stimulation services. These services are provided to customers in more than 50 countries in the major international oil and natural gas producing areas of Europe, the Middle East, Asia Pacific and Latin America. These operating segments have been aggregated into one reportable segment because they have similar economic characteristics, offer the same type of services, have similar production processes and use the same methods to provide their services. They also serve the same or similar customers, which include major multi-national, independent and national or state-owned oil companies. Our Russia pressure pumping unit, which was historically an operating segment within the International Pressure Pumping, was discontinued during 2009. See Note 3. Consequently, its operating results are excluded from the segment data tables below.
The Oilfield Services segment has five operating segments. These operating segments provide other oilfield services such as casing and tubular services, process and pipeline services, chemical services, completion tools and completion fluids services in the United States and in select markets internationally. These operating segments have been aggregated into one reportable segment as they all provide oilfield services other than pressure pumping, have similar economic characteristics, serve same or similar customers which primarily include major multi-national, independent and national or state-owned oil companies, and some of the operating segments share resources.
The accounting policies of the segments are the same as those described in the summary of significant accounting policies. We evaluate the performance of our segments based on operating income. Intersegment sales and transfers are not material.
Summarized financial information concerning our segments for each of the three years in the period ended September 30, 2009 is shown in the following tables (in thousands). The “Corporate” column includes corporate expenses and assets not allocated to the operating segments. Revenue by geographic location is determined based
60
Table of Contents
BJ SERVICES COMPANY
NOTES TO CONSOLIDATED FINANCIAL STATEMENTS—(Continued)
on the location in which services are rendered or products are sold. Historically, in disclosing Long-Lived Assets by geographic location, we have included all goodwill in the United States. For purposes of this report, we have shown the goodwill in its respective country of origin based on our acquisition history. As a result, the corresponding amounts of Long-Lived Assets in previously reported periods have been restated to conform to the current presentation format by reducing United States by $417.4 million and $355.5 million, increasing Canada by $116.9 million and $116.9 million, and increasing other countries by $300.5 million and $238.6 million for fiscal 2008 and 2007, respectively. For the years ended September 30, 2009, 2008 and 2007, we provided services to several thousand customers, none of which accounted for more than 5% of consolidated revenue.
Business Segments
| U.S./Mexico Pressure Pumping |
Canada Pressure Pumping |
International Pressure Pumping |
Oilfield Services Group |
Corporate | Total | ||||||||||||||
| 2009 |
|||||||||||||||||||
| Revenue |
$ | 1,853,831 | $ | 309,435 | $ | 1,098,493 | $ | 860,138 | $ | — | $ | 4,121,897 | |||||||
| Operating income (loss) |
104,094 | 17,610 | 121,463 | 102,928 | (116,821 | ) | 229,274 | ||||||||||||
| Total assets |
1,518,249 | 424,675 | 1,459,930 | 1,031,925 | 712,144 | 5,146,923 | |||||||||||||
| Capital expenditures |
178,756 | 9 | 131,899 | 56,211 | 27,317 | 394,192 | |||||||||||||
| Depreciation |
135,381 | 27,528 | 79,903 | 43,242 | 6,497 | 292,551 | |||||||||||||
| 2008 |
|||||||||||||||||||
| Revenue |
$ | 2,743,383 | $ | 442,474 | $ | 1,185,388 | $ | 987,832 | $ | — | $ | 5,359,077 | |||||||
| Operating income (loss) |
597,837 | 34,341 | 178,716 | 191,670 | (89,270 | ) | 913,294 | ||||||||||||
| Total assets |
1,728,751 | 515,600 | 1,415,494 | 1,076,894 | 585,169 | 5,321,908 | |||||||||||||
| Capital expenditures |
267,476 | 20,163 | 194,572 | 82,951 | 40,422 | 605,584 | |||||||||||||
| Depreciation |
115,774 | 34,797 | 63,549 | 35,490 | 10,705 | 260,315 | |||||||||||||
| 2007 |
|||||||||||||||||||
| Revenue |
$ | 2,534,601 | $ | 386,547 | $ | 1,002,828 | $ | 806,517 | $ | — | $ | 4,730,493 | |||||||
| Operating income (loss) |
874,808 | 32,493 | 154,793 | 170,362 | (79,858 | ) | 1,152,598 | ||||||||||||
| Total assets |
1,487,260 | 550,449 | 1,262,831 | 997,983 | 416,689 | 4,715,212 | |||||||||||||
| Capital expenditures |
288,037 | 83,643 | 200,366 | 84,037 | 85,712 | 741,795 | |||||||||||||
| Depreciation |
88,410 | 29,327 | 50,458 | 29,112 | 7,059 | 204,366 | |||||||||||||
Geographic Information
| Revenue | Long-Lived Assets | |||||
| 2009 |
||||||
| United States |
$ | 2,092,461 | $ | 1,819,244 | ||
| Canada |
400,943 | 423,726 | ||||
| Other countries |
1,628,493 | 1,163,475 | ||||
| Total |
$ | 4,121,897 | $ | 3,406,445 | ||
| 2008 |
||||||
| United States |
$ | 3,104,864 | $ | 1,793,758 | ||
| Canada |
522,047 | 448,193 | ||||
| Other countries |
1,732,166 | 1,065,347 | ||||
| Total |
$ | 5,359,077 | $ | 3,307,298 | ||
| 2007 |
||||||
| United States |
$ | 2,867,442 | $ | 1,707,705 | ||
| Canada |
432,392 | 453,298 | ||||
| Other countries |
1,430,659 | 779,441 | ||||
| Total |
$ | 4,730,493 | $ | 2,940,444 | ||
61
Table of Contents
BJ SERVICES COMPANY
NOTES TO CONSOLIDATED FINANCIAL STATEMENTS—(Continued)
Revenue by Product Line
| 2009 | 2008 | 2007 | |||||||
| Cementing |
$ | 1,003,345 | $ | 1,344,010 | $ | 1,231,608 | |||
| Stimulation |
2,205,751 | 2,987,827 | 2,657,208 | ||||||
| Other |
912,801 | 1,027,240 | 841,677 | ||||||
| Total revenue |
$ | 4,121,897 | $ | 5,359,077 | $ | 4,730,493 | |||
A reconciliation from the segment information to consolidated income from continuing operations before income taxes for each of the three years in the period ended September 30, 2008 is set forth below (in thousands):
| 2009 | 2008 | 2007 | ||||||||||
| Total operating income for reportable segments |
$ | 229,274 | $ | 913,294 | $ | 1,152,598 | ||||||
| Interest expense |
(27,248 | ) | (28,107 | ) | (32,741 | ) | ||||||
| Interest income |
1,224 | 1,912 | 1,624 | |||||||||
| Other expense, net |
(9,083 | ) | (8,579 | ) | (7,600 | ) | ||||||
| Income from continuing operations before income taxes |
$ | 194,167 | $ | 878,520 | $ | 1,113,881 | ||||||
As a result of the reduction in demand for our services and products caused by the recent global economic downturn, we identified a list of cementing and stimulation equipment used in our Pressure Pumping business that was not economical to repair or maintain in the current market environment. We impaired such equipment to write it down to scrap or salvage value, recording non-cash, pre-tax impairment charges totaling $5.7 million in the U.S. pressure Pumping segment and $1.5 million in the Middle East region of the International Pressure Pumping segment in the third quarter of fiscal 2009. These charges, totaling $7.2 million, are included in the loss on disposal of assets, net on the consolidated statement of operations.
10. Employee Benefit Plans
Defined Benefit Pension Plans
We have defined benefit pension plans covering employees in certain international locations, including the U.K., Canada, Norway and elsewhere. During fiscal 2004, the plans in the U.K. and Canada were frozen to new entrants.
In September 2006, we entered into an agreement with an insurance company to settle or transfer our obligation with respect to a U.S. defined benefit plan. Plan assets of approximately $72 million were used to purchase an insurance contract to fund the benefits and effectively settle the plan, subject to regulatory approvals. In December 2008, we received approval from the Pension Benefit Guaranty Corporation and the Internal Revenue Service and were relieved of primary responsibility for the pension benefit obligation. Consequently, we recorded a non-cash pre-tax charge of $21.7 million in connection with the settlement in the first quarter of fiscal 2009. This charge resulted in a $5.7 million reduction in prepaid pension cost and a $16.0 million increase in accumulated other comprehensive income, with a tax effect of $5.9 million.
We also have a non-qualified supplemental executive retirement plan (“SERP”), an unfunded defined benefit pension plan that provides our executives with supplemental retirement benefits based on the highest consecutive three years compensation out of the final ten years of employment. Benefits under the SERP become vested upon the later of the executive’s 55th birthday or the date the executive completes five full years of service as an officer.
Postretirement Benefit Plans
We also sponsor plans that provide certain health care and life insurance benefits for retired employees, primarily in the United States, who meet specified age and service requirements, and their eligible dependents. These plans are unfunded and we retain the right, subject to existing agreements, to modify or eliminate them. Our postretirement medical benefit plan provides credits based on years of service that can be used to purchase coverage under the retiree plan. This plan effectively caps our health care inflation rate at a 4% increase per year.
62
Table of Contents
BJ SERVICES COMPANY
NOTES TO CONSOLIDATED FINANCIAL STATEMENTS—(Continued)
All amounts in the following tables are presented in thousands of dollars, except for percentages and unless otherwise stated.
Obligations and Funded Status
| U.S. SERP | Non-U.S. Pension | U.S. Postretirement | ||||||||||||||||||||||
| 2009 | 2008 | 2009 | 2008 | 2009 | 2008 | |||||||||||||||||||
| Change in benefit obligation |
||||||||||||||||||||||||
| Benefit obligation, beginning of year |
$ | 32,194 | $ | 31,211 | $ | 182,139 | $ | 218,673 | $ | 49,320 | $ | 57,596 | ||||||||||||
| Service cost |
1,200 | 1,138 | 4,302 | 6,519 | 1,383 | 4,132 | ||||||||||||||||||
| Interest cost |
2,013 | 1,860 | 11,144 | 12,876 | 1,663 | 3,657 | ||||||||||||||||||
| Actuarial (gain)/loss |
4,061 | (1,237 | ) | 24,956 | (28,271 | ) | (26,333 | ) | (15,621 | ) | ||||||||||||||
| Benefits paid |
(408 | ) | (816 | ) | (8,394 | ) | (6,143 | ) | (665 | ) | (444 | ) | ||||||||||||
| Contributions by plan participants |
— | — | 1,619 | 2,246 | — | — | ||||||||||||||||||
| Plan amendments |
— | 38 | — | — | — | — | ||||||||||||||||||
| Exchange rate adjustments |
— | — | (11,774 | ) | (23,761 | ) | — | — | ||||||||||||||||
| Benefit plan obligation, end of year |
$ | 39,060 | $ | 32,194 | $ | 203,992 | $ | 182,139 | $ | 25,368 | $ | 49,320 | ||||||||||||
| Change in plan assets |
||||||||||||||||||||||||
| Fair value of plan assets, beginning of year |
$ | — | $ | — | $ | 138,293 | $ | 164,887 | $ | — | $ | — | ||||||||||||
| Actual (loss)/return on plan assets |
— | — | 13,893 | (20,333 | ) | — | — | |||||||||||||||||
| Contributions by employer |
408 | 816 | 12,404 | 15,571 | 665 | 444 | ||||||||||||||||||
| Contributions by plan participants |
— | — | 1,619 | 2,246 | — | — | ||||||||||||||||||
| Benefits paid from plan assets |
(408 | ) | (816 | ) | (8,394 | ) | (6,143 | ) | (665 | ) | (444 | ) | ||||||||||||
| Exchange rate adjustments |
— | — | (9,358 | ) | (17,935 | ) | — | — | ||||||||||||||||
| Fair value of plan assets, end of year |
$ | — | $ | — | $ | 148,457 | $ | 138,293 | $ | — | $ | — | ||||||||||||
| Underfunded status |
$ | (39,060 | ) | $ | (32,194 | ) | $ | (55,535 | ) | $ | (43,846 | ) | $ | (25,368 | ) | $ | (49,320 | ) | ||||||
Amounts recognized in the consolidated statement of financial position consist of:
| U.S. SERP | Non-U.S. Pension | U.S. Postretirement | ||||||||||||||||||||||
| 2009 | 2008 | 2009 | 2008 | 2009 | 2008 | |||||||||||||||||||
| Current liability |
$ | (408 | ) | $ | (2,065 | ) | $ | (837 | ) | $ | (623 | ) | $ | (1,337 | ) | $ | (1,086 | ) | ||||||
| Non-current liability |
(38,652 | ) | (30,129 | ) | (54,698 | ) | (43,223 | ) | (24,031 | ) | (48,234 | ) | ||||||||||||
| Net amount recognized |
$ | (39,060 | ) | $ | (32,194 | ) | $ | (55,535 | ) | $ | (43,846 | ) | $ | (25,368 | ) | $ | (49,320 | ) | ||||||
The amounts recognized in accumulated other comprehensive income consist of the following as of September 30:
| U.S. SERP | Non-U.S. Pension | U.S. Postretirement | ||||||||||||||||||||
| 2009 | 2008 | 2009 | 2008 | 2009 | 2008 | |||||||||||||||||
| Net loss (gain) |
$ | 4,934 | $ | 873 | $ | 72,917 | $ | 54,632 | $ | (41,412 | ) | $ | (19,101 | ) | ||||||||
| Prior service cost (credit) |
4,953 | 6,080 | — | — | — | — | ||||||||||||||||
| Net transition obligation |
— | — | (260 | ) | (84 | ) | — | — | ||||||||||||||
| Total |
$ | 9,887 | $ | 6,953 | $ | 72,657 | $ | 54,548 | $ | (41,412 | ) | $ | (19,101 | ) | ||||||||
The estimated net loss and prior service cost for the U.S. SERP that will be amortized from accumulated other comprehensive income into the net periodic benefit cost in fiscal 2010 are $0.1 million and $1.1 million, respectively. The estimated net loss for Non-U.S. pension plans that will be amortized from accumulated other comprehensive income into the net periodic benefit cost in fiscal 2010 is $3.0 million. The estimated net gain for the U.S. postretirement plan that will be amortized from accumulated other comprehensive income into the net periodic benefit cost in fiscal 2010 is $(4.8) million.
Accumulated Benefit Obligations (ABO) in Excess of Plan Assets
The ABO is the actuarial present value of the pension benefits at the employees’ current compensation levels. This differs from the projected benefit obligation, in that the ABO does not include any assumptions about future compensation levels. The ABO for the U.S. SERP was $27.4 million and $24.2 million at September 30, 2009 and 2008, respectively. The ABO for all non-U.S. plans was $191.4 million and $167.4 million at September 30, 2009 and 2008, respectively.
63
Table of Contents
BJ SERVICES COMPANY
NOTES TO CONSOLIDATED FINANCIAL STATEMENTS—(Continued)
The following is information for the plans with ABO’s in excess of plan assets at September 30:
| U.S. SERP | Non-U.S. Pension | |||||||||||
| 2009 | 2008 | 2009 | 2008 | |||||||||
| Projected benefit obligation |
$ | 39,060 | $ | 32,194 | $ | 157,823 | $ | 135,885 | ||||
| Accumulated benefit obligation |
27,391 | 24,202 | 152,968 | 131,388 | ||||||||
| Plan assets at fair value |
— | — | 107,070 | 97,507 | ||||||||
Components of Net Periodic Benefit Cost
| U.S. SERP | Non-U.S. Pension | U.S. Postretirement | |||||||||||||||||||||||||||||
| 2009 | 2008 | 2007 | 2009 | 2008 | 2007 | 2009 | 2008 | 2007 | |||||||||||||||||||||||
| Service cost |
$ | 1,200 | $ | 1,138 | $ | 950 | $ | 4,302 | $ | 6,519 | $ | 5,646 | $ | 1,383 | $ | 4,131 | $ | 3,971 | |||||||||||||
| Interest cost |
2,013 | 1,860 | 1,297 | 11,144 | 12,877 | 10,682 | 1,663 | 3,657 | 3,302 | ||||||||||||||||||||||
| Expected return on plan assets |
— | — | — | (8,793 | ) | (11,235 | ) | (9,696 | ) | — | — | — | |||||||||||||||||||
| Amortization of net loss (gain) |
— | — | — | 2,294 | 2,153 | 3,097 | (4,022 | ) | — | — | |||||||||||||||||||||
| Amortization of prior service cost |
1,127 | 1,124 | 996 | (42 | ) | 58 | (39 | ) | — | — | — | ||||||||||||||||||||
| Net periodic benefit cost |
$ | 4,340 | $ | 4,122 | $ | 3,243 | $ | 8,905 | $ | 10,372 | $ | 9,690 | $ | (976 | ) | $ | 7,788 | $ | 7,273 | ||||||||||||
Other Changes in Plan Assets and Projected Benefit Obligation Recognized in Other Comprehensive Income
| U.S. SERP | Non-U.S. Pension | U.S. Postretirement | ||||||||||||||||||||||
| 2009 | 2008 | 2009 | 2008 | 2009 | 2008 | |||||||||||||||||||
| Net loss (gain) |
$ | 4,061 | $ | (1,237 | ) | $ | 20,159 | $ | 7,157 | $ | (26,333 | ) | $ | (15,621 | ) | |||||||||
| Prior service cost |
— | 38 | — | — | — | — | ||||||||||||||||||
| Amortization of net loss (gain) |
— | — | (2,050 | ) | (2,165 | ) | 4,022 | — | ||||||||||||||||
| Amortization of prior service cost |
(1,127 | ) | (1,124 | ) | — | — | — | — | ||||||||||||||||
| Total recognized in other comprehensive income |
$ | 2,934 | $ | (2,323 | ) | $ | 18,109 | $ | 4,992 | $ | (22,311 | ) | $ | (15,621 | ) | |||||||||
| Total recognized in net periodic benefit cost and other comprehensive income |
$ | 7,274 | $ | 1,799 | $ | 27,014 | $ | 15,364 | $ | (23,287 | ) | $ | (7,833 | ) | ||||||||||
Assumptions
The weighted average assumptions used to determine benefit obligations at September 30, were as follows:
| U.S. SERP | Non-U.S. Pension | U.S. Postretirement | ||||||||||||||||
| 2009 | 2008 | 2009 | 2008 | 2009 | 2008 | |||||||||||||
| Discount rate |
4.6 | % | 6.5 | % | 5.9 | % | 6.9 | % | 5.6 | % | 7.6 | % | ||||||
| Rate of increase in future compensation |
5.0 | % | 5.0 | % | 3.8 | % | 4.6 | % | n/a | n/a | ||||||||
The weighted average assumptions used to determine net periodic benefit costs for the years ended September 30, were as follows:
| U.S. SERP | Non-U.S. Pension | U.S. Postretirement | |||||||||||||||||||||||||
| 2009 | 2008 | 2007 | 2009 | 2008 | 2007 | 2009 | 2008 | 2007 | |||||||||||||||||||
| Discount rate |
6.5 | % | 6.0 | % | 6.0 | % | 5.9 | % | 6.8 | % | 6.0 | % | 7.6 | % | 6.4 | % | 6.0 | % | |||||||||
| Expected long-term rate of return on assets |
n/a | n/a | n/a | 6.5 | % | 7.0 | % | 6.8 | % | n/a | n/a | n/a | |||||||||||||||
| Rate of increase in future compensation |
5.0 | % | 5.0 | % | 5.0 | % | 3.8 | % | 4.6 | % | 4.2 | % | n/a | n/a | n/a | ||||||||||||
The expected long-term rate of return assumptions represent the rate of return on plan assets reflecting the average rate of earnings expected on the funds invested or to be invested to provide for the benefits included in the projected benefit obligation. The assumption has been determined by reflecting expectations regarding future rates
64
Table of Contents
BJ SERVICES COMPANY
NOTES TO CONSOLIDATED FINANCIAL STATEMENTS—(Continued)
of return for the portfolio considering the asset distribution target and related historical rates of return. The redemption yield on government fixed interest bonds as well as corporate bonds were used as proxies for the return on debt securities, weighted by the relative proportion of each within the actual portfolio. The return on equities was based on the historical long-term performance of the equity classes. This rate is reassessed at least on an annual basis.
The postretirement benefit obligation at September 30, 2009 and 2008 was determined using a health care cost inflation rate of 4%, reflecting the cap described above. Increasing the assumed health care cost trend rates would not have a material impact on the accumulated postretirement benefit obligation or the net periodic postretirement benefit cost because these benefits are capped pursuant to the terms of the plan.
Plan Assets
Our objective is to diversify the portfolios of our pension assets among several asset classes to reduce volatility while maintaining an asset mix that provides the highest rate of return with an acceptable risk. This is primarily through a mix of equity securities and fixed income funds to generate asset returns comparable with the general market. We have investment committees that meet at least annually to review the portfolio returns and to determine asset-mix targets based on asset/liability studies. The investment committees consider these studies in the formal establishment of the current asset-mix targets based on the projected risk and return levels for each asset class. Our investment portfolio as of September 30, 2009 and 2008 was:
| Non-U.S. Pension | |||||||||
| Target | 2009 | 2008 | |||||||
| Equity securities |
60-75 | % | 61 | % | 61 | % | |||
| Debt securities |
25-35 | % | 37 | % | 36 | % | |||
| Other |
0-5 | % | 2 | % | 3 | % | |||
Contributions and Estimated Benefit Payments
The pension plans are generally funded with the amounts necessary to meet the legal or contractual minimum funding requirements. We infrequently make discretionary contributions. We contributed $12.8 million in fiscal 2009, none of which was discretionary. We expect to contribute $13.7 million to the defined benefit plans in fiscal 2010, which represents the legal or contractual minimum funding requirements. The postretirement plan is generally funded with the amounts necessary to meet benefit costs as they are incurred. We contributed $0.7 million in fiscal 2009 and we expect to contribute $1.3 million to the post retirement plan in fiscal 2010, which represents the anticipated claims.
The following benefit payments for all plans, which reflect expected future service, as appropriate, are expected to be paid (in thousands):
| Years ending September 30, |
|||
| 2010 |
$ | 5,333 | |
| 2011 |
10,271 | ||
| 2012 |
10,762 | ||
| 2013 |
11,120 | ||
| 2014 |
11,481 | ||
| Years 2015-2019 |
64,635 | ||
Defined Contribution Plans
We administer defined contribution plans for employees in the United States, the U.K. and Canada whereby eligible employees may elect to contribute from 2% to 20% of their base salaries to an employee benefit trust. We match employee contributions at the rate of 100% up to 6% of the employee’s base salary in the United States, and an equal matching up to 5.5% of the employee’s base salary in the U.K. In addition, we contribute between 2% and 6% of each employee’s base salary depending on their age or years of service in the United States, the U.K. and Canada. Our matching contributions vest immediately while our base contributions become fully vested after three years of employment. Company contributions to these defined contribution plans were $34.1 million, $30.6 million and $31.0 million, in fiscal 2009, 2008 and 2007, respectively.
65
Table of Contents
BJ SERVICES COMPANY
NOTES TO CONSOLIDATED FINANCIAL STATEMENTS—(Continued)
Directors’ Retirement Plan
We have a non-qualified directors’ retirement plan. The unfunded defined benefit plan provides our non-employee directors with benefits upon termination of their service based on the number of years of service and the last annual retainer fee. This plan has been discontinued as of December 2007, other than for currently serving directors. The expense associated with this plan was $3.3 million, $2.4 million and $0.2 million for the years ended September 30, 2009, 2008 and 2007, respectively. Benefits paid under the plan totaled $40 thousand for each of the years ended September 30, 2009, 2008 and 2007. The related accrued benefit obligation was $8.8 million and $5.5 million as of September 30, 2009 and 2008, respectively.
11. Commitments and Contingencies
Litigation
Through performance of our service operations, we are sometimes named as a defendant in litigation, usually relating to claims for personal injury or property damage (including claims for well or reservoir damage, and damage to pipelines or process facilities). We maintain insurance coverage against such claims to the extent deemed prudent by management. Further, through a series of acquisitions, we assumed responsibility for certain claims and proceedings made against the Western Company of North America, Nowsco Well Service Ltd., OSCA and other companies whose stock we acquired in connection with their businesses. Some, but not all, of such claims and proceedings will continue to be covered under insurance policies of our predecessors that were in place at the time of the acquisitions.
Although the outcome of the claims and proceedings against us cannot be predicted with certainty, management believes that there are no existing claims or proceedings that are likely to have a material adverse effect on our financial position, results of operations or cash flows.
Stockholder Lawsuits regarding Baker Hughes Merger
In connection with the pending Baker Hughes Merger, various lawsuits have been filed in the Court of Chancery of the State of Delaware (the “Delaware Lawsuits”) on behalf of the public stockholders of the Company, naming the Company, current members of the Company’s Board of Directors, and Baker Hughes as defendants. In the Delaware Lawsuits, the plaintiffs allege, among other things, that the Company’s Board of Directors violated various fiduciary duties in approving the Merger Agreement and that the Company and/or Baker Hughes aided and abetted such alleged violations. Among other remedies, the plaintiffs seek to enjoin the Merger.
On September 25, 2009, the Delaware Chancery Court entered an order consolidating the Delaware Lawsuits into one class action, In re: BJ Services Company Shareholders Litigation, C.A. No. 4851-VCN. On October 6, 2009, the Delaware Chancery Court entered an order designating the law firm of Faruqi & Faruqi, LLP of New York, New York as lead counsel and Rosenthal, Monhait & Goddess, P.A. of Wilmington, Delaware as liaison counsel. On October 16, 2009, lead counsel for the plaintiffs filed an amended complaint in the Delaware Chancery Court which, among other things, adds Jeffrey E. Smith, the Company’s Executive Vice President and Chief Financial Officer, as a defendant, contains new factual allegations about the merger negotiations, and alleges the preliminary joint proxy/prospectus filed on October 14, 2009, with the U.S. Securities and Exchange Commission (the “SEC”) omits and misrepresents material information.
Various lawsuits have also been filed in the District Courts of Harris County, Texas (the “Texas Lawsuits”). The Texas Lawsuits make substantially the same allegations as were initially asserted in the Delaware Lawsuits, and seek the same relief. On October 9, 2009, the Harris County Court consolidated the Texas Lawsuits into one class action, Garden City Employees’ Retirement System, et al. v. BJ Services Company, et al., Cause No. 2009-57320, 80th Judicial District of Harris County, Texas. On October 20, 2009, the Court of Appeals for the First District of Texas at Houston granted the defendants’ emergency motion to stay the Texas Lawsuits pending its decision on the defendants’ petition seeking a stay of the Texas Lawsuits pending adjudication of the Delaware Lawsuits, which were filed first.
The Company believes that the Delaware Lawsuits and the Texas Lawsuits are without merit, and it intends to vigorously defend itself against them. The outcome of this litigation is uncertain, however, and we cannot currently predict the manner and timing of the resolution of the suits, the likelihood of the issuance of an injunction preventing the consummation of the Merger, or an estimate of a range of possible losses or any minimum loss that could result in the event of an adverse verdict in these suits. These suits could prevent or delay the completion of
66
Table of Contents
BJ SERVICES COMPANY
NOTES TO CONSOLIDATED FINANCIAL STATEMENTS—(Continued)
the Merger and result in substantial costs to the Company and Baker Hughes. We have recorded an amount for estimated legal defense costs under our applicable insurance policies. However, there can be no assurance as to the ultimate outcome of these lawsuits or whether our applicable insurance policies will provide sufficient coverage for these claims.
Asbestos Litigation
In August 2004, certain predecessors of ours, along with numerous other defendants were named in four lawsuits filed in the Circuit Courts of Jones and Smith Counties in Mississippi. These four lawsuits included 118 individual plaintiffs alleging that they suffer various illnesses from exposure to asbestos and seeking damages. The lawsuits assert claims of unseaworthiness, negligence, and strict liability, all based upon the status of our predecessors as Jones Act employers. The plaintiffs were required to complete data sheets specifying the companies they were employed by and the asbestos-containing products to which they were allegedly exposed. Through this process, approximately 25 plaintiffs have identified us or our predecessors as their employer. Amended lawsuits were filed by four individuals against us and the remainder of the original claims (114) were dismissed. Of these four lawsuits, three failed to name us as an employer or manufacturer of asbestos-containing products so we were thereby dismissed. Subsequently an individual from one of these lawsuits brought his own action against us. As a result, we are currently named as a Jones Act employer in two of the Mississippi lawsuits. It is possible that as many as 21 other claimants who identified us or our predecessors as their employer could file suit against us, but they have not done so at this time. Only minimal medical information regarding the alleged asbestos-related disease suffered by the plaintiffs in the two lawsuits has been provided. Accordingly, we are unable to estimate our potential exposure to these lawsuits. We and our predecessors in the past maintained insurance which may be available to respond to these claims. In addition to the Jones Act cases, we have been named in a small number of additional asbestos cases. The allegations in these cases vary, but generally include claims that we provided some unspecified product or service which contained or utilized asbestos or that an employee was exposed to asbestos at one of our facilities or customer job sites. Some of the allegations involve claims that we are the successor to the Byron Jackson Company. To date, we have been successful in obtaining dismissals of such successor cases without any payment in settlements or judgments, although some remain pending at the present time. We intend to defend ourselves vigorously in all of these cases based on the information available to us at this time. We do not expect the outcome of these lawsuits, individually or collectively, to have a material adverse effect on our financial position, results of operations or cash flows; however, there can be no assurance as to the ultimate outcome of these lawsuits or additional similar lawsuits, if any, that may be filed.
Halliburton – Python Litigation
On December 21, 2007, Halliburton Energy Services, Inc. re-filed a prior suit against us and another oilfield services company for patent infringement in connection with drillable bridge plug tools. These tools are used to isolate portions of a well for stimulation work, after which the plugs are milled out using coiled tubing or a workover rig. Halliburton claims that our tools (offered under the trade name “Python”) and tools offered by the other company infringe various patents for a tool constructed of composite material. The lawsuit was filed in the United States District Court for the Northern District of Texas (Dallas). This lawsuit arises from litigation filed in 2003 by Halliburton regarding the patents at issue. The earlier case was dismissed without prejudice when Halliburton sought a re-examination of the patents by the United States Patent and Trademark Office on July 6, 2004. The parties have filed briefs with the Court arguing their positions on the construction of the coverage of Halliburton’s patent. We expect that the Court will either issue a ruling or schedule a hearing on these issues within the next few months. We do not expect the outcome of this matter to have a material adverse effect on our financial position, results of operations or cash flows; however, there can be no assurance as to the ultimate outcome of this matter or future lawsuits, if any, that may be filed.
Halliburton – OptiFrac Litigation
In December 2008, Halliburton filed a lawsuit against us in the Eastern District of Texas (Marshall) and another lawsuit in Toronto, Canada against us and another oilfield services company for patent infringement. In both suits, Halliburton claims that our coiled tubing perforating system (“OptiFrac”) infringes various patents for a coiled tubing fracturing system marketed by Halliburton. We are in the process of analyzing the methods, claims and causes of action alleged by Halliburton in the suits. We do not expect the outcome of these matters to have a material adverse effect on our financial position, results of operations or cash flows; however, there can be no assurance as to the ultimate outcome of these matters or future lawsuits, if any, that may be filed.
67
Table of Contents
BJ SERVICES COMPANY
NOTES TO CONSOLIDATED FINANCIAL STATEMENTS—(Continued)
Customer Claim
On November 19, 2009, we received correspondence from a customer operating in the North Sea, claiming that the Company’s decision to move a stimulation vessel out of the North Sea market constituted a breach of contract. The customer alleges that it was forced to purchase well stimulation services from other providers at a higher cost than in the original agreement between the customer and the Company. The customer further alleges that it has incurred actual and estimated future damages of $40.4 million plus an undisclosed amount for production loss and/or production deferral, and threatens arbitration as provided in the contract. We believe that this claim is without merit, and we intend to vigorously defend ourselves in this matter based on the information available to us at this time. We do not expect the outcome of this matter to have a material adverse effect on our financial position, results of operations or cash flows; however, there can be no assurance as to the ultimate outcome of this matter.
Investigations Regarding Misappropriation and Possible Illegal Payments
In October 2004, we received a report from a whistleblower alleging that our Asia Pacific Region Controller had misappropriated Company funds and that illegal payments had been made to government officials in that region. Management and the Audit Committee of the Board of Directors conducted investigations of these allegations, as well as questions that later arose whether illegal payments had been made elsewhere. As a result of the theft investigation, the Region Controller admitted to multiple misappropriations and returned certain amounts to the Company. His employment was terminated in 2004.
In addition, the Audit Committee’s investigation found information indicating a significant likelihood that payments, made by us to an entity in the Asia Pacific Region with which we have a contractual relationship, were then used to make payments to government officials in the region. The information also indicated that certain of our employees in the region believed that the payments by us would be used in that way. The payments, which may have been illegal, aggregated approximately $2.9 million and were made over a period of several years. The investigation also identified certain other payments as to which the legitimacy of the transactions reflected in the underlying documents could not be established or as to which questions about the adequacy of the underlying documents could not be resolved. We have voluntarily disclosed information found in the investigations to the U.S. Department of Justice (“DOJ”) and the SEC and have engaged in discussions with these authorities in connection with their review of the matter. We cannot predict whether further investigative efforts may be required or initiated by the authorities.
In May 2007, the former Region Controller pled guilty to one count of theft in Singapore. In June 2007, we filed a civil lawsuit against him seeking to recover any additional misappropriated funds and seeking an accounting of disbursements that could not be explained following the investigation. In July 2008, we reached a settlement of this litigation with the Region Controller and he made a payment to us.
The DOJ, the SEC and other authorities have a broad range of civil and criminal sanctions under the U.S. Foreign Corrupt Practices Act (“FCPA”) and other laws, which they may seek to impose in appropriate circumstances. Recent civil and criminal settlements with a number of public corporations and individuals have included multi-million dollar fines, disgorgement, injunctive relief, guilty pleas, deferred prosecution agreements and other sanctions, including requirements that corporations retain a monitor to oversee compliance with the FCPA. We cannot predict what, if any, actions may be taken by the DOJ, the SEC or other authorities or the effect the foregoing may have on our consolidated financial statements.
Environmental
We are conducting environmental investigations and remedial actions at current and former Company locations and, along with other companies, are currently named as a potentially responsible party at five waste disposal sites owned by third parties. At September 30, 2009 and 2008, we had reserved approximately $5.0 million and $4.6 million, respectively, for such environmental matters. This represents management’s best estimate of our portion of future costs to be incurred. Insurance is also maintained for some environmental liabilities.
Lease and Other Long-Term Commitments
In 1999, we contributed certain pumping service equipment to a limited partnership, in which we own a 1% interest. The equipment is used to provide services to our customers for which we pay a service fee over a period of at least six years, but not more than 13 years, at approximately $12 million annually. This is accounted for as an operating lease. We assessed the terms of this agreement and determined it was a variable interest entity. However, we were not deemed to be the primary beneficiary, and therefore, consolidation was not required. The transaction resulted in a gain that is being deferred and amortized over the partnership term. The partnership agreement permits substitution of equipment within the partnership as long as the implied fair value of the new property transferred in
68
Table of Contents
BJ SERVICES COMPANY
NOTES TO CONSOLIDATED FINANCIAL STATEMENTS—(Continued)
at the date of substitution equals or exceeds the implied fair value, as defined, of the current property in the partnership that is being replaced. Substitution activity during the partnership term has reduced the balance of the deferred gain to zero at September 30, 2009, compared to $4.2 million at September 30, 2008. In 2010, we have the option to purchase the pumping service equipment for approximately $46 million, and we have notified the partner of our intent to do so.
In 1997, we contributed certain pumping service equipment to a limited partnership, in which we owned a 1% interest. The equipment was used to provide services to our customers for which we paid a service fee. On February 9, 2007, we purchased the remaining partnership interest for $47.8 million, and as a result acquired the partnership equipment. The acquisition of the partnership controlling interest was accounted for as an asset purchase.
At September 30, 2009, we had long-term operating leases and service fee commitments covering certain facilities and equipment, as well as other long-term commitments, with varying expiration dates. Minimum non-cancelable lease and equipment financing obligations as of September 30, 2009, are as follows (in thousands):
| Years ending September 30, |
|||
| 2010 |
$ | 98,330 | |
| 2011 |
49,386 | ||
| 2012 |
29,948 | ||
| 2013 |
16,855 | ||
| 2014 |
10,097 | ||
| 2015 and thereafter |
19,525 | ||
At September 30, 2009, we also had commitments outstanding for purchase obligations related to capital expenditures and inventory under purchase orders and contracts of approximately $280.2 million.
Contractual Obligations
We routinely issue Parent Company Guarantees (“PCGs”) in connection with service contracts or performance obligations entered into by our subsidiaries. The issuance of these PCGs is frequently a condition of the bidding process imposed by our customers for work in countries outside of North America. The PCGs typically provide that we guarantee the performance of the services by our local subsidiary. The term of these PCGs varies with the length of the service contract. To date, the parent company has not been called upon to perform under any of these PCGs.
We arrange for the issuance of a variety of bank guarantees, performance bonds and standby letters of credit. The vast majority of these are issued in connection with contracts we, or our subsidiaries, have entered into with customers. The customer has the right to call on the bank guarantee, performance bond or standby letter of credit in the event that we, or our subsidiaries, default in the performance of services. These instruments are required as a condition to being awarded the contract, and are typically released upon completion of the contract. We have also issued standby letters of credit in connection with a variety of our financial obligations, such as in support of fronted insurance programs, claims administration funding, certain employee benefit plans and temporary importation bonds. The following table summarizes our other commercial commitments as of September 30, 2009 (in thousands):
| Amount of commitment expiration per period | |||||||||||||||
| Other Commercial Commitments |
Total Amounts Committed |
Less than 1 Year |
1–3 Years |
4–5 Years |
Over 5 Years | ||||||||||
| Standby letters of credit |
$ | 34,957 | $ | 34,794 | $ | 163 | $ | — | $ | — | |||||
| Guarantees |
290,956 | 155,977 | 77,195 | 48,868 | 8,916 | ||||||||||
| Total other commercial commitments |
$ | 325,913 | $ | 190,771 | $ | 77,358 | $ | 48,868 | $ | 8,916 | |||||
69
Table of Contents
BJ SERVICES COMPANY
NOTES TO CONSOLIDATED FINANCIAL STATEMENTS—(Continued)
12. Intangible Assets
The changes in the carrying amount of goodwill by reportable segment for each of the two years in the period ended September 30, 2009, are as follows (in thousands):
| U.S./Mexico Pressure Pumping |
Canada Pressure Pumping |
International Pressure Pumping |
Oilfield Services Group |
Total | |||||||||||
| Balance September 30, 2007 |
$ | 273,095 | $ | 116,842 | $ | 250,278 | $ | 317,649 | $ | 957,864 | |||||
| Acquisitions |
1,823 | — | — | 15,764 | 17,587 | ||||||||||
| Balance September 30, 2008 |
274,918 | 116,842 | 250,278 | 333,413 | 975,451 | ||||||||||
| Acquisitions |
416 | — | — | 2,074 | 2,490 | ||||||||||
| Balance September 30, 2009 |
$ | 275,334 | $ | 116,842 | $ | 250,278 | $ | 335,487 | $ | 977,941 | |||||
Goodwill increased $17.6 million in fiscal 2008, primarily as the result of the acquisition of Innicor Subsurface Technologies Inc. discussed in Note 4. Goodwill increased $2.5 million in fiscal 2009, primarily as a result of revisions to estimates used in the purchase accounting related to the Innicor acquisition.
Technology-based intangible assets had a gross carrying amount of $44.0 million and $39.0 million, with accumulated amortization of $11.4 million and $7.8 million, for a net balance of $32.6 million and $31.2 million at September 30, 2009 and 2008, respectively. Amortization for the three years ended September 30, 2009, 2008 and 2007 was $3.6 million, $3.7 million and $2.2 million, respectively. Estimated amortization expense for each of the subsequent five fiscal years is expected to be within the range of $4.0 million to $5.0 million.
13. Supplemental Financial Information
Supplemental financial information for the years ended September 30 is as follows (in thousands):
| 2009 | 2008 | 2007 | |||||||
| Consolidated statement of operations: |
|||||||||
| Research and development expense |
$ | 27,170 | $ | 26,302 | $ | 25,714 | |||
| Rent expense |
90,074 | 83,261 | 72,449 | ||||||
| Consolidated statement of cash flows: |
|||||||||
| Income tax paid |
49,985 | 190,130 | 373,109 | ||||||
| Interest paid |
30,687 | 28,959 | 39,016 | ||||||
| Property additions included in accounts payable |
9,128 | 5,168 | 6,237 | ||||||
| Details of acquisitions: |
|||||||||
| Fair value of assets acquired |
— | 51,238 | 27,712 | ||||||
| Liabilities assumed |
— | 11,356 | 5,617 | ||||||
| Goodwill |
— | 17,292 | 35,825 | ||||||
| Cash paid for acquisitions, net of cash acquired |
— | 57,174 | 57,920 | ||||||
Other expense, net for the years ended September 30 is summarized as follows (in thousands):
| 2009 | 2008 | 2007 | ||||||||||
| Minority interest |
$ | (13,765 | ) | $ | (11,903 | ) | $ | (11,315 | ) | |||
| Non-operating net foreign exchange gain (loss) |
667 | (317 | ) | 115 | ||||||||
| (Loss) gain from sale of equity method investments |
— | (2,947 | ) | 520 | ||||||||
| Legal settlements |
3,569 | 4,000 | — | |||||||||
| Other, net |
446 | 2,588 | 3,080 | |||||||||
| Other expense, net |
$ | (9,083 | ) | $ | (8,579 | ) | $ | (7,600 | ) | |||
70
Table of Contents
BJ SERVICES COMPANY
NOTES TO CONSOLIDATED FINANCIAL STATEMENTS—(Continued)
Activity in the allowance for doubtful accounts for the years ended September 30 is as follows (in thousands):
| 2009 | 2008 | 2007 | ||||||||||
| Balance at beginning year |
$ | 22,472 | $ | 20,550 | $ | 18,976 | ||||||
| Provision for bad debt charged to expense |
8,750 | 9,606 | 6,541 | |||||||||
| Additions related to acquisitions |
— | 307 | — | |||||||||
| Write-offs of uncollectible accounts |
(5,601 | ) | (7,991 | ) | (4,967 | ) | ||||||
| Balance at end of year |
$ | 25,621 | $ | 22,472 | $ | 20,550 | ||||||
14. Stock-Based Compensation
We currently have two stock incentive plans and two employee stock purchase plans. Our 2000 Incentive Plan and 2003 Incentive Plan (the “Plans”) provide for the granting of stock options to officers, certain eligible employees and non-employee directors at an exercise price equal to the fair market value of the stock at the date of the grant. The Plans also provide for the granting of performance-based long term stock incentive awards, including Performance Units (“Units”), bonus stock and phantom stock, to our officers and certain eligible employees and the 2003 Plan provides for restricted stock awards to certain eligible employees and non-employee directors. An aggregate of 27.0 million shares of Common Stock has been authorized for grants under the Plans, of which 9.7 million shares were available for future grants at September 30, 2009. The 2008 Employee Stock Purchase Plan (the “Purchase Plan”) allows all employees to purchase shares of our Common Stock at 85% of market value on the first or last business day, whichever is lower, of the twelve-month plan period beginning each October 1. Purchases are limited to 10% of an employee’s regular salary, or $21,250, whichever is less. An aggregate of 10.0 million shares of Common Stock has been authorized for purchases under the Purchase Plan, of which 10.0 million shares were available for future purchases at September 30, 2009.
The following table summarizes stock-based compensation expense for fiscal 2009, 2008 and 2007, which was allocated as follows (in thousands):
| 2009 | 2008 | 2007 | ||||||||||
| Cost of sales and services |
$ | 9,397 | $ | 6,811 | $ | 7,168 | ||||||
| Research and engineering |
2,587 | 1,808 | 1,484 | |||||||||
| Marketing |
3,869 | 3,386 | 3,359 | |||||||||
| General and administrative |
25,906 | 18,984 | 18,615 | |||||||||
| Stock-based compensation expense |
41,759 | 30,989 | 30,626 | |||||||||
| Tax benefit |
(10,093 | ) | (9,053 | ) | (7,678 | ) | ||||||
| Stock-based compensation expense, net of tax |
$ | 31,666 | $ | 21,936 | $ | 22,948 | ||||||
Stock Options: The Plans provide for the granting of stock options to officers, certain eligible employees and non-employee directors at an exercise price equal to the fair market value of the stock at the date of the grant. Options outstanding generally vest over a three-year period and are exercisable for a period of seven years.
Expected life was determined based on exercise history for the last ten years. Exercise history showed that officers tend to hold options for a longer period than non-officers. We segregate the grants of options to officers and non-officers for fair value determination due to the historical differences in exercise patterns exhibited. We calculate estimated volatility using historical daily price intervals to generate expected future volatility based on the appropriate expected lives of the options. The risk-free interest rate is based on observed U.S. Treasury rates appropriate for the expected lives of the options and the dividend yield is based on our history of dividends paid.
71
Table of Contents
BJ SERVICES COMPANY
NOTES TO CONSOLIDATED FINANCIAL STATEMENTS—(Continued)
Compensation expense for grants for the fiscal years ended September 30 was calculated using the Black-Scholes option pricing model with the following assumptions:
| Officer grants |
2009 | 2008 | 2007 | |||||||||
| Expected life (years) |
5.0 | 4.8 | 4.8 | |||||||||
| Interest rate |
2.8 | % | 3.4 | % | 4.6 | % | ||||||
| Volatility |
40.1 | % | 33.0 | % | 37.0 | % | ||||||
| Dividend yield |
0.8 | % | 0.8 | % | 0.6 | % | ||||||
| Weighted-average fair value per share at grant date |
$ | 4.62 | $ | 7.61 | $ | 12.08 | ||||||
| Non-officer grants |
||||||||||||
| Expected life (years) |
3.9 | 3.6 | 3.7 | |||||||||
| Interest rate |
2.3 | % | 3.2 | % | 4.6 | % | ||||||
| Volatility |
42.3 | % | 33.0 | % | 33.4 | % | ||||||
| Dividend yield |
0.8 | % | 0.8 | % | 0.6 | % | ||||||
| Weighted-average fair value per share at grant date |
$ | 4.21 | $ | 6.51 | $ | 9.84 | ||||||
A summary of stock option activity and related information is presented below (in thousands, except per share prices and years) as of September 30, 2009:
| Weighted-Average | |||||||||||
| Shares | Per share Exercise Price |
Remaining Contractual Term (yrs.) |
Intrinsic Value | ||||||||
| Outstanding at beginning of year |
9,313 | $ | 24.18 | ||||||||
| Granted |
3,389 | 12.62 | |||||||||
| Exercised |
(1,047 | ) | 9.69 | ||||||||
| Forfeited |
(414 | ) | 21.17 | ||||||||
| Outstanding at end of year |
11,241 | $ | 22.15 | 4.1 | $ | 27,460 | |||||
| Options exercisable at year-end |
5,850 | 26.12 | 2.8 | 4,748 | |||||||
The weighted-average grant date fair value of options granted during fiscal 2009, 2008 and 2007 was $4.45, $7.04 and $10.69, respectively. The total intrinsic value of options exercised during the years ended September 30, 2009, 2008 and 2007 was $5.1 million, $46.9 million and $7.8 million, respectively.
A summary of the status of unvested stock options as of September 30, 2009, and changes during fiscal 2009, is presented below (in thousands, except per share prices):
| Shares | Weighted-Average Grant-Date per Share Fair Value | |||||
| Unvested at October 1, 2008 |
3,978 | $ | 8.47 | |||
| Granted |
3,389 | 4.45 | ||||
| Vested |
(1,776 | ) | 9.16 | |||
| Forfeited |
(200 | ) | 5.75 | |||
| Unvested at September 30, 2009 |
5,391 | $ | 5.81 | |||
As of September 30, 2009, there was $11.2 million of total unrecognized compensation cost related to unvested stock options. That cost is expected to be recognized over a weighted-average period of 1.4 years. The total fair value of shares vested during the years ended September 30, 2009, 2008 and 2007 was $16.3 million, $14.5 million and $15.3 million, respectively.
Director Stock Awards: In addition to stock options, non-employee directors may be granted an award of common stock of the Company with no exercise price (“restricted stock”). Restricted stock awards generally vest ratably over a three-year period. Compensation expense was calculated using the Black-Scholes option pricing model and the same assumptions as those used to calculate stock-based compensation expense for non-officer stock option grants. Expense for director stock awards was $1.2 million, $1.3 million and $1.0 million in fiscal 2009, 2008 and 2007, respectively.
72
Table of Contents
BJ SERVICES COMPANY
NOTES TO CONSOLIDATED FINANCIAL STATEMENTS—(Continued)
Stock Incentive Awards: For awards made under the 2000 Stock Incentive Plan and the 2003 Stock Incentive Plan, we have reserved 965,111 shares of Common Stock for issuance for Units that have been awarded, representing the maximum number of shares the officers could receive under outstanding awards. Each Unit represents the right to receive from the Company at the end of a stipulated period up to 1.333 shares of Common Stock, contingent upon achievement of certain market-based financial performance goals over the stipulated three-year period. Under ASC 505 and ASC 718, compensation expense for stock-based compensation awards contingent upon a market condition is recorded for the entire grant amount regardless of achievement of the market condition. Expense for stock incentive awards was $4.6 million, $3.1 million and $1.5 million in fiscal 2009, 2008 and 2007, respectively.
In addition to the award of Units, each officer is also awarded cash equal to his or her tax liability on the Units they receive, if any, at the end of the performance period. We recognize compensation expense for the cash award ratably over the performance period and the cash liability is marked to market quarterly, with the adjustment recorded to compensation expense. At September 30, 2009, we have accrued $4.6 million for the cash award liability for all outstanding grants. However, the actual performance results at the end of a performance period could result in a decrease or increase to the actual cash payments, resulting in an increase or decrease to compensation expense at the end of the performance period.
The performance criteria were not met for the fiscal 2005 and 2004 Unit grants, each with a three-year performance period. In accordance with ASC 505 and ASC 718, no compensation expense was reversed for the fair value of this award; however, $1.4 million, and $3.2 million was reversed for the cash award component in fiscal year 2008 and 2007, respectively.
We recognize compensation expense for Units granted based on the fair value at the date of grant using a lattice model (Monte Carlo simulation). The fair values for each grant outstanding as of September 30, 2009 and assumptions used to determine the fair value are listed below:
| Fiscal Year |
Outstanding | Volatility | Discount Rate |
Dividend Yield |
Weighted Average Fair value Per share | |||||||||
| 2009 | 533,006 | 45.56 | % | 1.8 | % | 0.77 | % | $ | 13.83 | |||||
| 2008 | 168,144 | 32.34 | % | 3.1 | % | 0.85 | % | $ | 33.90 | |||||
| 2007 | 90,733 | 33.41 | % | 4.7 | % | 0.61 | % | $ | 45.28 | |||||
As of September 30, 2009, there was $8.2 million of total unrecognized compensation cost related to these Units. That cost is expected to be recognized over a weighted-average period of 1.7 years. During fiscal 2009, 2008 and 2007, no Units vested.
We annually grant our officers awards of phantom stock, and in fiscal 2008 and 2007, we also granted our officers awards of bonus stock. In fiscal 2009, we also granted awards of phantom stock to certain non-officer employees. Phantom stock and bonus stock are common stock of the Company with no exercise price. As there is no exercise price for the awards granted, the fair value of these awards is equal to the Company’s stock price on the date of grant. The bonus stock awards vest quarterly over the calendar year, while the phantom stock vests ratably in annual increments over a three-year period. Both types of common stock awards are contingent upon achievement of certain financial performance goals over the stipulated periods. In addition, each officer is also awarded cash equal to his or her tax liability on the common stock they receive, if any, at the end of the performance period. Fiscal 2009, 2008 and 2007 expense for the common stock awards and the related cash awards was $11.0 million, $5.1 million and $4.8 million, respectively.
Under the Merger Agreement described in Note 1, we have agreed not to grant any new stock options or other stock-based awards while the Merger is pending.
73
Table of Contents
BJ SERVICES COMPANY
NOTES TO CONSOLIDATED FINANCIAL STATEMENTS—(Continued)
Purchase Plan: In October 2009, we issued a total of 949,400 shares for fiscal 2009 plan period under the Purchase Plan, and have reserved 912,996 shares for the fiscal 2010 plan period. Compensation expense for the year ended September 30, 2009 was calculated using the Black-Scholes option pricing model with the following assumptions:
| 2009 | 2008 | 2007 | ||||||||||
| Expected life (years) |
1.0 | 1.0 | 1.0 | |||||||||
| Interest rate |
1.7 | % | 4.1 | % | 4.9 | % | ||||||
| Volatility |
45.5 | % | 31.3 | % | 39.1 | % | ||||||
| Dividend yield |
0.8 | % | 0.8 | % | 0.7 | % | ||||||
| Weighted-average fair value per share at grant date |
$ | 6.31 | $ | 7.08 | $ | 8.81 | ||||||
We calculated estimated volatility using historical daily prices based on the appropriate expected life of the Purchase Plan. The risk-free interest rate is based on observed U.S. Treasury rates appropriate for the expected life of the Purchase Plan. The dividend yield is based on our history of dividends paid.
15. Stockholders’ Equity
Common Stock: We have authorization to issue up to 910.0 million shares of common stock.
Dividends: We paid common stock dividends of $0.05 per common share each quarter since the fourth quarter of fiscal 2005, or $58.5 million, $58.6 million and $58.6 million in the aggregate in fiscal years 2009, 2008 and 2007, respectively. We anticipate paying cash dividends in the amount of $0.05 per common share on a quarterly basis in fiscal 2010, until such time as the Merger described in Note 1 is completed. Dividends declared but not yet paid prior to the closing date of the Merger will be paid upon the closing of the Merger. Dividends are subject to approval by our Board of Directors each quarter, and the Board has the ability to change the dividend policy at any time.
Stockholder Rights Plan: We have a Stockholder Rights Plan (the “Rights Plan”) designed to deter coercive takeover tactics and to prevent an acquirer from gaining control of the Company without offering a fair price to all of our stockholders. The Rights Plan was amended September 26, 2002, to extend the expiration date of the preferred share purchase right (“Right”) to September 26, 2012 and increase the purchase price of the Rights. Under this plan, as amended, each outstanding share of common stock includes one-eighth of a Right that becomes exercisable under certain circumstances, including when beneficial ownership of common stock by any person, or group, equals or exceeds 15% of the Company’s outstanding common stock. Each Right entitles the registered holder to purchase from the Company one one-thousandth of a share of Series A Junior Participating Preferred Stock at a price of $520, subject to adjustment under certain circumstances. As a result of stock splits effected in the form of stock dividends in 1998, 2001 and 2005, one Right is associated with eight outstanding shares of common stock. The purchase price for the one-eighth of a Right associated with one share of common stock is effectively $65. Upon the occurrence of certain events specified in the Rights Plan, each holder of a Right (other than an “Acquiring Person,” as defined under the Rights Plan) will have the right, upon exercise of such Right, to receive that number of shares of common stock of the Company (or the surviving corporation) that, at the time of such transaction, would have a market price of two times the purchase price of the Right. We have not issued any shares of Series A Junior Participating Preferred Stock. We amended the Rights Plan on August 30, 2009, in connection with the Merger Agreement, to permit entry into the Merger Agreement with Baker Hughes described in Note 1. The amendment provides that no triggering event shall have occurred and that no person or entity shall be deemed to have become an Acquiring Person.
Treasury Stock: In 1997, our Board of Directors initiated a stock repurchase program, which through a series of increases, authorizes the repurchase of up to $2.2 billion of Company stock. Repurchases are made at the discretion of management and the program will remain in effect until terminated by our Board of Directors. During fiscal 2009, we purchased a total of 3,466,500 shares at a cost of $44.2 million. During fiscal 2008, we purchased a total of 101,400 shares at a cost of $2.1 million. During fiscal 2007, we purchased a total of 2,564,457 shares at a cost of $74.6 million. Treasury shares have been used to satisfy our obligations under our various stock-based compensation plans described in Note 14. A total of 1,990,982 treasury shares were used at a cost of $51.8 million in fiscal 2009, 3,933,259 treasury shares were used at a cost of $104.3 million in fiscal 2008 and 1,110,321 treasury shares were used at a cost of $29.4 million in fiscal 2007.
We currently have remaining authorization to purchase up to an additional $348.4 million in stock under the repurchase program. However, under the Merger Agreement described in Note 1, we have agreed not to repurchase any common stock without the approval of Baker Hughes, and we do not expect to repurchase any more shares under this repurchase program while the Merger is pending.
74
Table of Contents
BJ SERVICES COMPANY
NOTES TO CONSOLIDATED FINANCIAL STATEMENTS—(Continued)
Accumulated Other Comprehensive Income: Accumulated other comprehensive income (loss) consists of the following (in thousands):
| Pension and Other Postretirement Plan Adjustments |
Cumulative Translation Adjustment |
Total | ||||||||||
| Balance at September 30, 2006 |
$ | (30,171 | ) | $ | 53,004 | $ | 22,833 | |||||
| Changes |
(11,740 | ) | 40,551 | 28,811 | ||||||||
| Balance at September 30, 2007 |
(41,911 | ) | 93,555 | 51,644 | ||||||||
| Changes |
5,302 | (16,387 | ) | (11,085 | ) | |||||||
| Balance at September 30, 2008 |
(36,609 | ) | 77,168 | 40,559 | ||||||||
| Changes |
8,108 | (24,853 | ) | (16,745 | ) | |||||||
| Balance at September 30, 2009 |
$ | (28,501 | ) | $ | 52,315 | $ | 23,814 | |||||
The tax effects allocated to each component of other comprehensive income is summarized as follows (in thousands):
| Before-tax Amount |
Tax (Expense) Benefit |
Net-of-Tax Amount |
||||||||||
| Year ended September 30, 2007: |
||||||||||||
| Foreign currency translation adjustment |
$ | 40,551 | $ | — | $ | 40,551 | ||||||
| Minimum pension liability adjustment |
4,572 | (1,300 | ) | 3,272 | ||||||||
| Total other comprehensive income |
$ | 45,123 | $ | (1,300 | ) | $ | 43,823 | |||||
| Year Ended September 30, 2008: |
||||||||||||
| Foreign currency translation adjustment |
$ | (16,387 | ) | $ | — | $ | (16,387 | ) | ||||
| Changes in defined benefit and other postretirement plans |
8,547 | (3,245 | ) | 5,302 | ||||||||
| Total other comprehensive income (loss) |
$ | (7,840 | ) | $ | (3,245 | ) | $ | (11,085 | ) | |||
| Year Ended September 30, 2009: |
||||||||||||
| Foreign currency translation adjustment |
$ | (24,853 | ) | $ | — | $ | (24,853 | ) | ||||
| Pension settlement |
16,040 | (5,957 | ) | 10,083 | ||||||||
| Changes in defined benefit and other postretirement plans |
1,268 | (3,243 | ) | (1,975 | ) | |||||||
| Total other comprehensive income (loss) |
$ | (7,545 | ) | $ | (9,200 | ) | $ | (16,745 | ) | |||
75
Table of Contents
BJ SERVICES COMPANY
NOTES TO CONSOLIDATED FINANCIAL STATEMENTS—(Continued)
16. Quarterly Financial Data (Unaudited)
| First Quarter |
Second Quarter |
Third Quarter |
Fourth Quarter |
Fiscal Year Total | |||||||||||||
| (in thousands, except per share amounts) | |||||||||||||||||
| Fiscal Year 2009: |
|||||||||||||||||
| Revenue |
$ | 1,416,788 | $ | 1,046,692 | $ | 780,245 | $ | 878,172 | $ | 4,121,897 | |||||||
| Gross profit (1) |
315,734 | 131,662 | 32,375 | 52,018 | 531,789 | ||||||||||||
| Income (loss) from continuing operations |
150,463 | 47,627 | (29,328 | ) | (2,791 | ) | 165,971 | ||||||||||
| Net income (loss) |
149,238 | 42,988 | (32,336 | ) | (9,947 | ) | 149,943 | ||||||||||
| Diluted earnings per share: |
|||||||||||||||||
| Income (loss) from continuing operations |
0.51 | 0.16 | (0.10 | ) | (0.01 | ) | 0.57 | ||||||||||
| Net income (loss) |
0.51 | 0.15 | (0.11 | ) | (0.03 | ) | 0.51 | ||||||||||
| Fiscal Year 2008: |
|||||||||||||||||
| Revenue |
$ | 1,271,642 | $ | 1,265,687 | $ | 1,311,160 | $ | 1,510,588 | $ | 5,359,077 | |||||||
| Gross profit (1) |
318,645 | 260,297 | 279,539 | 337,337 | 1,195,818 | ||||||||||||
| Income from continuing operations |
173,452 | 127,170 | 144,666 | 175,198 | 620,486 | ||||||||||||
| Net income |
172,184 | 127,303 | 141,783 | 168,095 | 609,365 | ||||||||||||
| Diluted earnings per share: |
|||||||||||||||||
| Income from continuing operations |
0.59 | 0.43 | 0.49 | 0.59 | 2.10 | ||||||||||||
| Net income |
0.58 | 0.43 | 0.48 | 0.57 | 2.06 | ||||||||||||
| (1) | Represents revenue less cost of sales and services and research and engineering expenses. |
| ITEM 9. | Changes in and Disagreements with Accountants on Accounting and Financial Disclosure |
None.
| ITEM 9A. | Controls and Procedures |
Evaluation of disclosure controls and procedures. As of the end of the period covered by this annual report, we have evaluated the effectiveness of the design and operation of our disclosure controls and procedures pursuant to Rule 13a-15 of the Exchange Act of 1934, as amended (the “Exchange Act”). This evaluation was carried out under the supervision and with the participation of our management, including our Chief Executive Officer and Chief Financial Officer. Based on this evaluation, these officers have concluded that, as of September 30, 2009, our disclosure controls and procedures are effective at a reasonable assurance level.
Disclosure controls and procedures are our controls and other procedures that are designed to ensure that information required to be disclosed by us in the reports that we file or submit under the Exchange Act, such as this annual report, is accumulated and communicated to our management, including our Chief Executive Officer and Chief Financial Officer, as appropriate, to allow timely decisions regarding disclosure.
Design and evaluation of internal control over financial reporting. Pursuant to Section 404 of the Sarbanes-Oxley Act of 2002, our management has prepared a report of the assessment of the design and effectiveness of our internal controls over financial reporting. Our independent registered public account firm has issued a report attesting to the effectiveness of our internal controls over financial reporting. Management’s Report on Internal Control over Financial Reporting and the Report of the Independent Registered Public Accounting Firm are set forth in Part II, Item 8 of this report and are incorporated herein by reference.
Changes in internal control over financial reporting. There has been no change in our internal controls over financial reporting during the quarter ended September 30, 2009 that has materially affected, or is reasonably likely to materially affect, our internal controls over financial reporting.
| ITEM 9B. | Other Information |
None.
76
Table of Contents
| ITEM 10. | Directors, Executive Officers and Corporate Governance |
Information for this item will be provided not later than January 28, 2010 (120 days after the end of our fiscal year) via amendment or in a Proxy Statement for our 2010 Annual Meeting of Stockholders.
| ITEM 11. | Executive Compensation |
Information for this item will be provided not later than January 28, 2010 (120 days after the end of our fiscal year) via amendment or in a Proxy Statement for our 2010 Annual Meeting of Stockholders.
| ITEM 12. | Security Ownership of Certain Beneficial Owners and Management and Related Stockholder Matters |
Information for this item will be provided not later than January 28, 2010 (120 days after the end of our fiscal year) via amendment or in a Proxy Statement for our 2010 Annual Meeting of Stockholders.
| ITEM 13. | Certain Relationships and Related Transactions, and Director Independence |
Information for this item will be provided not later than January 28, 2010 (120 days after the end of our fiscal year) via amendment or in a Proxy Statement for our 2010 Annual Meeting of Stockholders.
| ITEM 14. | Principal Accountant Fees and Services |
Information for this item will be provided not later than January 28, 2010 (120 days after the end of our fiscal year) via amendment or in a Proxy Statement for our 2010 Annual Meeting of Stockholders.
| ITEM 15. | Exhibits and Financial Statement Schedules |
| (a) | List of documents filed as part of this report or incorporated herein by reference: |
| (1) | Financial Statements: |
The following financial statements of the Registrant as set forth under Part II, Item 8 of this report on Form 10-K on the pages indicated.
| (2) | Financial Statement Schedules: |
All financial statement schedules are omitted because of the absence of conditions under which they are required or because all material information required to be reported is included in the consolidated financial statements and notes thereto.
77
Table of Contents
| (3) | Exhibits: |
| Number |
Description of Exhibit | |
| 2.1 | Agreement and Plan of Merger dated as of November 17, 1994 (“Merger Agreement”), among BJ Services Company, WCNA Acquisition Corp. and The Western Company of North America (filed as Exhibit 2.1 to the Company’s Annual Report on Form 10-K for the year ended September 30, 1995 (file no. 1-10570), and incorporated herein by reference). | |
| 2.2 | First Amendment to Agreement and Plan of Merger dated March 7, 1995, among BJ Services Company, WCNA Acquisition Corp. and The Western Company of North America (filed as Exhibit 2.2 to the Company’s Annual Report on Form 10-K for the year ended September 30, 1995 (file no. 1-10570), and incorporated herein by reference). | |
| 2.3 | Agreement and Plan of Merger dated as of February 20, 2002, among BJ Services Company, BJTX, Co., and OSCA, Inc. (filed as Exhibit 2.1 to the Company’s Current Report on Form 8-K dated May 31, 2002 (file no. 1-10570) and incorporated herein by reference). | |
| 2.4 | Agreement and Plan of Merger dated as of August 30, 2009, among BJ Services Company, Baker Hughes Incorporated, and BSA Acquisition LLC (filed as Exhibit 2.1 to the Company’s Current Report on Form 8-K filed on September 2, 2009 (file no. 1-10570) and incorporated herein by reference). | |
| 3.1 | Certificate of Incorporation, as amended as of October 22, 1996 (filed as Exhibit 3.1 to the Company’s Annual Report on Form 10-K for the year ended September 30, 1999 (file no. 1-10570) and incorporated herein by reference). | |
| 3.2 | Certificate of Amendment to Certificate of Incorporation, dated January 22, 1998 (filed as Exhibit 3.2 to the Company’s Annual Report on Form 10-K for the year ended September 30, 1999 (file no. 1-10570) and incorporated herein by reference). | |
| 3.3 | Certificate of Amendment to Certificate of Incorporation, dated May 10, 2001 (filed as Exhibit 3.5 to the Company’s Quarterly Report on Form 10-Q for the quarter ended March 31, 2001 (file no. 1-10570) and incorporated herein by reference). | |
| 3.4 | Certificate of Amendment to Certificate of Incorporation, dated January 31, 2006 (filed as Exhibit 3.1 to the Company’s Quarterly Report on Form 10-Q for the quarter ended December 31, 2005 (file no. 1-10570) and incorporated herein by reference). | |
| 3.5 | Certificate of Designation of Series A Junior Participating Preferred Stock, as amended, dated September 26, 1996 (filed as Exhibit 3.2 to the Company’s Annual Report on Form 10-K for the year ended September 30, 1996 (file no. 1-10570) and incorporated herein by reference). | |
| 3.6 | Amended and Restated Bylaws, as of December 6, 2007 (filed as Exhibit 3.1 to the Company’s Current Report of Form 8-K dated December 12, 2007 (file no. 1-10570) and incorporated herein by reference). | |
| 4.1 | Specimen form of certificate for the Common Stock (filed as Exhibit 4.1 to the Company’s Registration Statement on Form S-1 (Reg. No. 33-35187) and incorporated herein by reference). | |
| 4.2 | Amended and Restated Rights Agreement, dated September 26, 1996, between the Company and First Chicago Trust Company of New York, as Rights Agent (filed as Exhibit 4.1 to the Company’s Form 8-K dated October 21, 1996 (file no. 1-10570) and incorporated herein by reference). | |
| 4.3 | First Amendment to Amended and Restated Rights Agreement and Appointment of Rights Agent, dated March 31, 1997, among the Company, First Chicago Trust Company of New York and The Bank of New York, as successor Rights Agent (filed as Exhibit 4.3 to the Company’s Annual Report on Form 10-K for the year ended September 30, 1997 (file no. 1-10570) and incorporated herein by reference). | |
| 4.4 | Second Amendment to Amended and Restated Rights Agreement dated as of September 26, 2002, between the Company and The Bank of New York, as Rights Agent (filed as Exhibit 4.1 to the Company’s Current Report on Form 8-K dated September 26, 2002 (file no. 1-10570) and incorporated herein by reference). | |
| 4.5 | Third Amendment to Amended and Restated Rights Agreement dated as of August 30, 2009, between the Company and The Bank of New York, as Rights Agent (filed as Exhibit 4.8 to the Company’s Form 8-A/A filed on September 2, 2009 (file no. 1-10570) and incorporated herein by reference) | |
78
Table of Contents
| 4.6 | Indenture, dated June 8, 2006, between BJ Services Company, as issuer, and Wells Fargo Bank, N.A., as trustee (filed as Exhibit 4.1 to the Company’s Current Report on Form 8-K filed on June 12, 2006 (file no. 1-10570) and incorporated herein by reference). | |
| 4.7 | First Supplemental Indenture, dated June 8, 2006, between BJ Services Company, as issuer, and Wells Fargo Bank, N.A., as trustee, with respect to the 5.75% Senior Notes due 2011 (filed as Exhibit 4.2 to the Company’s Current Report on Form 8-K filed on June 12, 2006 (file no. 1-10570) and incorporated herein by reference). | |
| 4.8 | Third Supplemental Indenture, dated May 19, 2008, between BJ Services Company, as issuer, and Wells Fargo Bank, N.A., as trustee, with respect to the 6% Senior Notes due 2018 (filed as Exhibit 4.2 to the Company’s Current Report on Form 8-K filed on May 19, 2008 (file no. 1-10570) and incorporated herein by reference). | |
| 10.1 | Trust Indenture and Security Agreement dated as of December 15, 1999 among First Security Trust Company of Nevada, BJ Services Equipment II, L.P. and State Street Bank and Trust Company, as Indenture Trustee (filed as Exhibit 10.1 to the Company’s Current Report on Form 8-K dated December 15, 1999 (file no. 1-10570) and incorporated herein by reference). | |
| 10.2 | Amended and Restated Agreement of Limited Partnership dated as of December 15, 1999 of BJ Services Equipment II, L.P. (filed as Exhibit 10.2 to the Company’s Current Report on Form 8-K dated December 15, 1999 (file no. 1-10570) and incorporated herein by reference). | |
| 10.3 | Amended and Restated Credit Agreement, dated as of August 30, 2007, among the Company, Citibank, N.A., as administrative agent, swing line lender and L/C issuer, Bank of America, N.A. as syndication agent and L/C issuer, The Royal Bank of Scotland PLC, JPMorgan Chase Bank, N.A. and The Bank of Tokyo-Mitsubishi UFJ, Ltd. as co-documentation agents and certain lenders named therein (filed as Exhibit 10.1 to the Company’s Current Report on Form 8-K dated August 30, 2007 (file no. 1-10570 and incorporated herein by reference). | |
| †10.4 | BJ Services Company 1995 Incentive Plan (filed as Exhibit 4.5 to the Company’s Registration Statement on Form S-8 (Reg. No. 33-58637) and incorporated herein by reference). | |
| †10.5 | Amendments effective January 25, 1996, and December 12, 1996, to BJ Services Company 1995 Incentive Plan (filed as Exhibit 10.9 to the Company’s Annual Report on Form 10-K for the year ended September 30, 1996 (file no. 1-10570), and incorporated herein by reference). | |
| †10.6 | Amendment effective July 22, 1999 to BJ Services Company 1995 Incentive Plan (filed as Exhibit 10.25 to the Company’s Annual Report on Form 10-K for the year ended September 30, 1999 (file no. 1-10570), and incorporated herein by reference). | |
| †10.7 | Amendment effective January 27, 2000 to BJ Services Company 1995 Incentive Plan (filed as Appendix B to the Company’s Proxy Statement dated December 20, 1999 (file no. 1-10570) and incorporated herein by reference). | |
| †10.8 | Amendment effective May 10, 2001 to BJ Services Company 1995 Incentive Plan (filed as Appendix B to the Company’s Proxy Statement dated April 10, 2001 and (file no. 1-10570) incorporated herein by reference). | |
| †10.9 | Eighth Amendment effective October 15, 2001 to BJ Services Company 1995 Incentive Plan (filed as Exhibit 10.12 to the Company’s Annual Report on Form 10-K for the year ended September 30, 2001 (file no. 1-10570) and incorporated herein by reference). | |
| †10.10 | Tenth Amendment effective December 5, 2008 to BJ Services Company 1995 Incentive Plan (filed as Exhibit 10.1 to the Company’s Quarterly Report on Form 10-Q for the quarterly period ended December 31, 2008 (file no. 1-10570) and incorporated herein by reference). | |
| †10.11 | BJ Services Company 1997 Incentive Plan (filed as Appendix B to the Company’s Proxy Statement dated December 22, 1997 (file no. 1-10570) and incorporated herein by reference). | |
| †10.12 | Amendment effective July 22, 1999 to BJ Services Company 1997 Incentive Plan (filed as Exhibit 10.26 to the Company’s Annual Report on Form 10-K for the year ended September 30, 1999 (file no. 1-10570) and incorporated herein by reference). | |
79
Table of Contents
| †10.13 | Amendment effective January 27, 2000 to BJ Services Company 1997 Incentive Plan (filed as Appendix C to the Company’s Proxy Statement dated December 20, 1999 (file no. 1-10570) and incorporated herein by reference). | |
| †10.14 | Amendment effective May 10, 2001 to BJ Services Company 1997 Incentive Plan (filed as Appendix C to the Company’s Proxy Statement dated April 10, 2001 (file no. 1-10570) and incorporated herein by reference). | |
| †10.15 | Fifth Amendment effective October 15, 2001 to BJ Services Company 1997 Incentive Plan (filed as Exhibit 10.17 to the Company’s Annual Report on Form 10-K for the year ended September 30, 2001 (file no. 1-10570) and incorporated herein by reference). | |
| †10.16 | Eighth Amendment effective November 15, 2006 to BJ Services Company 1997 Incentive Plan (filed as Exhibit 10.3 to the Company’s Current Report on Form 8-K filed on December 13, 2006 and incorporated herein by reference). | |
| †10.17 | Ninth Amendment effective October 13, 2008 to BJ Services Company 1997 Incentive Plan (filed as Exhibit 10.16 to the Company’s Annual Report on Form 10-K for the year ended September 30, 2008 (file no. 1-10570) and incorporated herein by reference). | |
| †10.18 | Tenth Amendment effective December 5, 2008 to BJ Services Company 1997 Incentive Plan (filed as Exhibit 10.2 to the Company’s Quarterly Report for the quarterly period ended December 31, 2008 (file no. 1-10570) and incorporated herein by reference). | |
| †10.19 | BJ Services Company 2000 Incentive Plan (filed as Appendix B to the Company’s Proxy Statement dated December 20, 2000 (file no. 1-10570) and incorporated herein by reference). | |
| †10.20 | First Amendment effective March 22, 2001 to BJ Services Company 2000 Incentive Plan (filed as Exhibit 10.2 to the Company’s Registration Statement on Form S-8 (Reg. No. 333-73348) and incorporated herein by reference). | |
| †10.21 | Second Amendment effective May 10, 2001 to BJ Services Company 2000 Incentive Plan (filed as Appendix D to the Company’s Proxy Statement dated April 10, 2001 (file no. 1-10570) and incorporated herein by reference). | |
| †10.22 | Third Amendment effective October 15, 2001 to BJ Services Company 2000 Incentive Plan (filed as Exhibit 10.24 to the Company’s Annual Report on Form 10-K for the year ended September 30, 2001 (file no. 1-10570) and incorporated herein by reference). | |
| †10.23 | Fifth Amendment effective November 15, 2006 to BJ Services Company 2000 Incentive Plan (filed as Exhibit 10.4 to the Company’s Current Report on Form 8-K filed on December 13, 2006 (file no. 1-10570) and incorporated herein by reference). | |
| †10.24 | Sixth Amendment effective October 13, 2008 to BJ Services Company 2000 Incentive Plan (filed as Exhibit 10.22 to the Company’s Annual Report on Form 10-K for the year ended September 30, 2008 (file no. 1-10570) and incorporated herein by reference). | |
| †10.25 | Seventh Amendment effective December 5, 2008 to BJ Services Company 2000 Incentive Plan (filed as Exhibit 10.3 to the Company’s Quarterly Report for the quarterly period ended December 31, 2008 (file no. 1-10570) and incorporated herein by reference). | |
| †10.26 | Amended and Restated BJ Services Company 2003 Incentive Plan (filed as Appendix A to the Company’s Proxy Statement dated December 15, 2008 (file no. 1-10570) and incorporated herein by reference). | |
| †10.27 | First Amendment to the Amended and Restated BJ Services Company 2003 Incentive Plan (filed as Exhibit 10.1 to the Company’s Quarterly Report for the quarterly period ended March 31, 2008 (file no. 1-10570) and incorporated herein by reference). | |
| †10.28 | 2008 Employee Stock Purchase Plan (filed as Appendix A to the Company’s Proxy Statement dated December 19, 2007 (file no. 1-10570) and incorporated herein by reference). | |
80
Table of Contents
| †10.29 | BJ Services Company Amended and Restated Supplemental Executive Retirement Plan effective as of December 5, 2008 (filed as Exhibit 10.6 to the Company’s Quarterly Report on Form 10-Q for the quarterly period ended December 31, 2008 (file no. 1-10570) and incorporated herein by reference). | |
| †10.30 | Key Employee Security Option Plan (filed as Exhibit 10.14 to the Company’s Annual Report on Form 10-K for the year ended September 30, 1997 (file no. 1-10570) and incorporated herein by reference). | |
| †10.31 | Amended and Restated BJ Services Company Directors’ Benefit Plan, effective January 1, 2008 (filed as Exhibit 10.31 to the Company’s Annual Report on Form 10-K for the year ended September 30, 2008 (file no. 1-10570) and incorporated herein by reference). | |
| †10.32 | Amended and Restated BJ Services Company Deferred Compensation Plan, effective December 5, 2008 (filed as Exhibit 10.5 to the Company’s Quarterly Report on Form 10-Q for the quarterly period ended December 31, 2008 (file no. 1-10570) and incorporated herein by reference). | |
| †10.33 | Form of Amended and Restated Executive Severance Agreement between BJ Services Company and certain executive officers (filed as Exhibit 10.6 to the Company’s Quarterly Report on Form 10-Q for the quarterly period ended December 31, 2008 (file no. 1-10570) and incorporated herein by reference). | |
| †10.34 | Form of Indemnification Agreement, dated as of December 9, 2004 between the Company and its directors and executive officers. (filed as Exhibit 10.1 to the Company’s Current Report on Form 8-K, filed on December 15, 2004 (file no. 1-10570) and incorporated herein by reference). | |
| †10.35 | Form of letter agreement setting forth terms and conditions of options to purchase shares of common stock awarded to non-employee directors (pre-2007 form) (filed as Exhibit 10.3 to the Company’s Current Report on Form 8-K, filed on November 23, 2004 (file no. 1-10570) and incorporated herein by reference). | |
| †10.36 | Form of letter agreement setting forth terms and conditions of options to purchase shares of common stock awarded to non-employee directors (2007 form) (filed as Exhibit 10.2 to the Company’s Current Report on Form 8-K filed on November 21, 2006 (file no. 1-10570) and incorporated herein by reference). | |
| †10.37 | Form of letter agreement setting forth terms and conditions of options to purchase shares of common stock awarded to non-employee directors (2008 form) (filed as Exhibit 10.38 to the Company’s Annual Report on Form 10-K for the year ended September 30, 2008 (file no. 1-10570) and incorporated herein by reference). | |
| †10.38 | Form of letter agreement setting forth terms and conditions of phantom stock awarded to non-employee directors (pre-2008 form) (filed as Exhibit 10.67 to the Company’s Annual Report on Form 10-K for the year ended September 30, 2006 (file no. 1-10570) and incorporated herein by reference). | |
| †10.39 | Form of letter agreement setting forth terms and conditions of phantom stock awarded to non-employee directors (2008 form) (filed as Exhibit 10.40 to the Company’s Annual Report on Form 10-K for the year ended September 30, 2008 (file no. 1-10570) and incorporated herein by reference). | |
| †10.40 | Form of letter agreement setting forth terms and conditions of options to purchase shares of common stock awarded to executive officers (pre-2007 form) (filed as Exhibit 10.1 to the Company’s Current Report on Form 8-K filed on November 21, 2006(file no. 1-10570) and incorporated herein by reference). | |
| †10.41 | Form of amended letter agreement setting forth terms and conditions of options to purchase shares of common stock awarded to executive officers (2007 form) (filed as Exhibit 10.1 to the Company’s Current Report on Form 8-K filed on December 13, 2006 (file no. 1-10570) and incorporated herein by reference). | |
| †10.42 | Form of letter agreement setting forth terms and conditions options to purchase shares of common stock awarded to executive officers (2008 form) (filed as Exhibit 10.43 to the Company’s Annual Report on Form 10-K for the year ended September 30, 2008 (file no. 1-10570) and incorporated herein by reference). | |
| †10.43 | Form of letter agreement setting forth terms and conditions of phantom stock awarded to executive officers (pre-2008 form) (filed as Exhibit 10.66 to the Company’s Annual Report on Form 10-K for the year ended September 30, 2006 (file no. 1-10570) and incorporated herein by reference). | |
81
Table of Contents
| †10.44 | Form of letter agreement setting forth terms and conditions of phantom stock awarded to executive officers (2008 form) (filed as Exhibit 10.45 to the Company’s Annual Report on Form 10-K for the year ended September 30, 2008 (file no. 1-10570) and incorporated herein by reference). | |
| †10.45 | Form of letter agreement setting forth terms and conditions of performance units awarded to executive officers (pre-2008 form) (filed as Exhibit 10.64 to the Company’s Annual Report on Form 10-K for the year ended September 30, 2006 (file no. 1-10570) and incorporated herein by reference). | |
| †10.46 | Form of letter agreement setting forth terms and conditions of performance units awarded to executive officers (2008 form) (filed as Exhibit 10.47 to the Company’s Annual Report on Form 10-K for the year ended September 30, 2008 (file no. 1-10570) and incorporated herein by reference). | |
| †10.47 | Form of letter agreement setting forth terms and conditions of bonus stock awarded to executive officers for fiscal 2009 (filed as Exhibit 10.1 to the Company’s Current Report on Form 8-K/A filed on November 17, 2008 (file no. 1-10570) and incorporated herein by reference). | |
| *12.1 | Ratios of Earnings to Fixed Charges. | |
| *21.1 | Subsidiaries of the Company. | |
| *23.1 | Consent of Deloitte & Touche LLP. | |
| *31.1 | Section 302 certification for J. W. Stewart. | |
| *31.2 | Section 302 certification for Jeffrey E. Smith. | |
| *32.1 | Section 906 certification furnished for J. W. Stewart. | |
| *32.2 | Section 906 certification furnished for Jeffrey E. Smith. | |
| * | Filed herewith. |
| † | Management contract or compensatory plan or arrangement. |
82
Table of Contents
SIGNATURES
Pursuant to the requirements of Section 13 or 15 (d) of the Securities Exchange Act of 1934, the registrant has duly caused this report to be signed on its behalf by the undersigned, thereunto duly authorized.
| BJ SERVICES COMPANY | ||
| By | /S/ J.W. STEWART | |
| J. W. Stewart | ||
| President and Chief Executive Officer | ||
Date: November 23, 2009
Pursuant to the requirements of the Securities Exchange Act of 1934, this report has been signed below by the following persons on behalf of the registrant and in the capacities and on the dates indicated.
| Signature |
Title |
Date | ||
| /S/ J.W. STEWART |
Chairman of the Board, | November 23, 2009 | ||
| J.W. Stewart | President, and Chief Executive Officer (Principal Executive Officer) |
|||
| /S/ JEFFREY E. SMITH |
Executive Vice President – Finance, and | November 23, 2009 | ||
| Jeffrey E. Smith | Chief Financial Officer (Principal Financial Officer) |
|||
| /S/ L. SCOTT BIAR |
Vice President - Controller | November 23, 2009 | ||
| L. Scott Biar | (Principal Accounting Officer) | |||
| /S/ L. WILLIAM HEILIGBRODT |
Director | November 23, 2009 | ||
| L. William Heiligbrodt | ||||
| /S/ JOHN R. HUFF |
Director | November 23, 2009 | ||
| John R. Huff | ||||
| /S/ DON D. JORDAN |
Director | November 23, 2009 | ||
| Don D. Jordan | ||||
| /S/ WILLIAM H. WHITE |
Director | November 23, 2009 | ||
| William H. White | ||||
| /S/ MICHAEL E. PATRICK |
Director | November 23, 2009 | ||
| Michael E. Patrick | ||||
| /S/ JAMES L. PAYNE |
Director | November 23, 2009 | ||
| James L. Payne | ||||
83