Attached files
| file | filename |
|---|---|
| 8-K/A - FORM 8-K/A - LORILLARD, LLC | c92928e8vkza.htm |
Exhibit 99.1

| Morgan Stanley Global Consumer & Retail Conference November 2009 |

| Presenters Martin L. Orlowsky Chairman, President and Chief Executive Officer David H. Taylor Executive Vice President, Finance and Planning, Chief Financial Officer |

| Safe Harbor Disclaimer You are cautioned that certain statements made in this presentation are "forward-looking" statements within the meaning of the Private Securities Litigation Reform Act of 1995. Forward-looking statements include, without limitation, any statement that may project, indicate or imply future results, events, performance or achievements, and may contain the words "expect", "intend", "plan", "anticipate", "estimate", "believe", "will be", "will continue", "will likely result", and similar expressions. In addition, any statement that may be provided by management concerning future financial performance (including future revenues, earnings or growth rates), ongoing business strategies or prospects, and possible actions by Lorillard, Inc. are also forward-looking statements as defined by the Act. Forward-looking statements are based on current expectations and projections about future events and are inherently subject to a variety of risks and uncertainties, many of which are beyond the control of Lorillard, Inc., that could cause actual results to differ materially from those anticipated or projected. Information describing factors that could cause actual results to differ materially from those in forward-looking statements is available in Lorillard, Inc.'s various filings with the Securities and Exchange Commission. These filings are available from the SEC over the Internet or on hard copy, and are, in some cases, available from Lorillard, Inc. as well. Forward-looking statements speak only as of the time they are made, and Lorillard, Inc. expressly disclaims any obligation or undertaking to update these statements to reflect any change in expectations or beliefs or any change in events, conditions or circumstances on which any forward-looking statement is based. This forward-looking statements disclaimer is only a brief summary of Lorillard, Inc.'s statutory forward-looking- statements disclaimer. You are urged to read that disclaimer, which is included in Lorillard Inc.'s 10K and 10Q filings with the SEC. |

| Regulation G Compliance You are also reminded that during this presentation, certain non-GAAP financial measures, such as EBITDA and Adjusted Operating Income per 1,000 Cigarettes may be discussed. These measures should not be considered an alternative to net income, or any other measure of financial performance or liquidity presented in accordance with generally accepted accounting principles (GAAP). These measures are not necessarily comparable to a similarly titled measure of another company. Please refer to Appendix A for information that reconciles these discussed figures with the most comparable GAAP measures. |

| Lorillard Overview Third largest tobacco company in the United States Sell products only in the U.S., Puerto Rico and U.S. possessions Spun off from Loews Corporation in June 2008 Leading position in the two best performing categories in the cigarette market Strong brand portfolio led by the Newport brand #1 menthol cigarette brand #2 overall cigarette brand Other brands include: Premium: Kent, True, Max Savings: Maverick, Old Gold Sound strategy and strong execution has generated industry-leading growth and profitability |

| Trends in the U.S. Cigarette Market Industry unit volume has declined at a 3.1% CAGR over the past six years and declined 3.3% in 2008 Increases in federal and state excise taxes are impacting trends First 9 months of 2009 declined 8.9% Remainder of 2009 trends appear to remain in the same range (billions of cigarettes shipped) 2002 - 2008 CAGR (3.1%) Source: Domestic wholesale shipments per MSAI. 9 Mos. (8.9%) annualized ? 286 276 274 271 270 260 251 79 68 64 60 56 52 54 57 56 51 49 45 418 401 394 382 376 357 345 49 45 0 100 200 300 400 500 600 2002 2003 2004 2005 2006 2007 2008 2009 Premium Discount Deep Discount |

| Strong Brand Portfolio is Led by Newport 2009 3Q YTD Sales: $3.9 billion Source: Lorillard Shipment Data. (1) Includes Old Gold, Maverick, Kent, True and Max brands. Accounted for 89.2% of domestic shipments in 9 months 2009 Newport (91.7% of 9 months sales) Primary driver of profitability Kent, True and Max Mature brands -- harvesting profit Premium Brands Accounted for 10.8% of domestic shipments in 9 months 2009 Maverick and Old Gold Old Gold - Maintain presence in lower price segment Maverick - Maintain profitable volume growth Discount Brands 3Q YTD 2009 Net Sales Breakdown by Brand 3Q YTD 2009 Volume Breakdown by Price 2009 3Q YTD Domestic Shipments: 26.7 billion Others 8.3% Newport 91.7% Discount 10.8% Premium 89.2% |

| Menthol Continues to Gain Share As consumer preferences continue to evolve, Lorillard is best positioned to capitalize on that trend Source: Domestic wholesale shipments per MSAI (adjusted to exclude Camel Crush). 26.4% 26.4% 26.7% 27.4% 27.9% 28.4% 29.2% 20.0% 21.0% 22.0% 23.0% 24.0% 25.0% 26.0% 27.0% 28.0% 29.0% 30.0% 2003 2004 2005 2006 2007 2008 2009 3Q YTD |

| Recent Menthol Share Growth Recent Menthol share growth can be attributed to: Lower rate of decline for menthol than overall industry: Industry - down 10.8% in 3rd quarter 2009 vs. 3rd quarter 2008 Menthol - down 6.3% in 3rd quarter 2009 vs. 3rd quarter 2008 Continuation of competitors' line extension strategies (i.e., Marlboro Blend 54) along with introductory/sustaining promotional support |

| Newport Leads the Menthol Segment Source: Domestic wholesale shipments per MSAI (adjusted to exclude Camel Crush). Wholesale Shipments 29.2% 30.1% 31.5% 32.2% 32.9% 34.0% 34.1% 12.8% 14.2% 15.0% 16.4% 17.7% 18.7% 11.4% 11.5% 11.4% 11.1% 10.1% 8.9% 11.0% 11.2% 5.7% 6.0% 6.4% 6.8% 7.5% 8.5% 8.8% 2.3% 2.8% 2.9% 2.3% 1.3% 1.1% 1.0% 0% 5% 10% 15% 20% 25% 30% 35% 40% 2003 2004 2005 2006 2007 2008 2009 3Q YTD Share of Menthol Segment Newport Marlboro Menthol Kool Salem Camel Menthol |

| Source: Lorillard Proprietary Database +1.66 -1.87 +0.06 Premium Segment Share of Market All Other Companies - Insignificant By Manufacturer Change 45.94% 46.65% 46.82% 47.02% 47.12% 46.00% 18.15% 17.85% 17.82% 17.66% 16.93% 16.28% 8.81% 9.14% 9.48% 9.82% 10.16% 10.47% 0% 10% 20% 30% 40% 50% 60% 70% 80% 2004 2005 2006 2007 2008 2009 3Q YTD Philip Morris RJ Reynolds Lorillard |
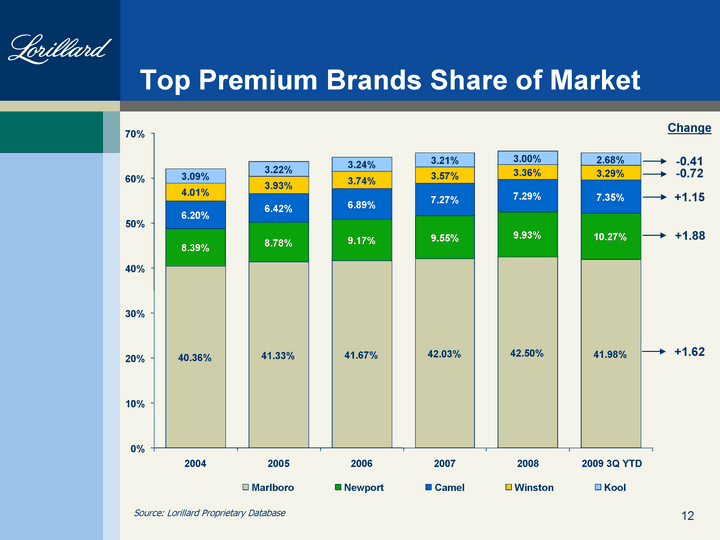
| Source: Lorillard Proprietary Database -0.41 -0.72 +1.15 Top Premium Brands Share of Market Change +1.88 +1.62 40.36% 41.33% 41.67% 42.03% 42.50% 41.98% 8.39% 8.78% 9.17% 9.55% 9.93% 10.27% 6.20% 6.42% 6.89% 7.27% 7.29% 7.35% 4.01% 3.93% 3.74% 3.57% 3.36% 3.29% 3.09% 3.22% 3.24% 3.21% 3.00% 2.68% 0% 10% 20% 30% 40% 50% 60% 70% 2004 2005 2006 2007 2008 2009 3Q YTD Marlboro Newport Camel Winston Kool |

| Maverick Growth Source: Domestic wholesale shipments per MSAI. Maverick's volume growth continues (millions of domestic cigarettes shipped) First nine months of 2009 up 55.4% over 2008 514 692 869 1,073 1,440 2,312 - 500 1,000 1,500 2,000 2,500 2003 2004 2005 2006 2007 2008 |
| Current Environment Pricing Recent price increases by several manufacturers Lorillard adjusted its credit terms - approximately $0.01 per pack Lingering effects of 2009 FET and SET increases FDA Impact No impact to-date June 2010 potentially affecting certain advertising practices Menthol issue to be evaluated by yet to be formed Scientific Advisory Committee Litigation |

| Operating Strategy Continue to manage business with long-term perspective Continued focus on premium price segment via Newport Manage Maverick's growth in discount price segment to optimize brand profitability Harvest profits from all other brands Balance trade-off between Newport's market share growth opportunities and profitability Consider expansion opportunities in tobacco Overall objective is to profitably grow Newport's market share |

| Financial Results |

| Recent Results Wholesale shipments Industry down 12.6% Lorillard down 6.1% Newport down 9.8% Wholesale inventory movements and promotional patterns masking underlying trends After adjustment for these factors, Newport shipments down ~ 4.5% Increased pricing drove sales growth Costs per unit up due to higher tobacco and wrapping costs, pension costs and impact of LIFO SG&A up primarily due to legal defense costs Operating income per unit up 9.9% |

| Most Profitable Operating Model Profitability of Lorillard vs. Competition Lorillard operates the most profitable business model among major U.S. cigarette companies, consistently outperforming key competitors Note: Based on Lorillard's analysis of competitors' public information. Adjusted Operating Income Per 1,000 Cigarettes $27.21 $28.35 $30.10 $34.13 $36.58 $37.95 $22.29 $23.72 $25.02 $26.29 $28.07 $29.74 $9.02 $13.43 $17.06 $18.63 $20.79 $23.42 $0.00 $5.00 $10.00 $15.00 $20.00 $25.00 $30.00 $35.00 $40.00 2003 2004 2005 2006 2007 2008 Lorillard Philip Morris USA Reynolds |

| Financial Policy Highlights Uses for free cash flow Capital investment (~$50 million per year) Dividends (target payout ratio of 70 - 75% of earnings) Share repurchases Potential acquisitions Return of cash to shareholders (~ $2.2 billion) $400 million share repurchase program completed in October 2008 $250 million share repurchase program completed July 2009 $750 million share repurchase program announced July 27, 2009 $786 million in dividends paid since spin-off from Loews in June 2008 September 2009 - quarterly dividend increased to $1 per share Capital structure Recently completed successful offering of $750 million senior notes First step toward long term target of 1.5X total debt to EBITDA |

| Investment Highlights Leader in the best performing segments of the cigarette market: premium and menthol Significant Newport brand equity and customer loyalty Allows for premium pricing Drives volume increases and market share gains Efficient business model and disciplined operating philosophy focused on optimizing profitability and market share growth Consistent earnings, substantial free cash flow and conservative balance sheet provides opportunity to generate attractive returns for shareholders Well-positioned for today's economic and regulatory environment |

| Appendix A Regulation G Reconciliations Reconciliation of Net Income to EBITDA Reconciliation of Operating Income to Adjusted Operating Income |

| Questions |