Attached files
| file | filename |
|---|---|
| 8-K - 8-K - LEHMAN BROTHERS HOLDINGS INC. PLAN TRUST | a09-33824_18k.htm |
Exhibit 99.1
|
|
LEADERSHIP • PROBLEM SOLVING • VALUE CREATION Lehman Brothers Holdings Inc. The State of the Estate November 18, 2009 © Copyright 2009. Alvarez & Marsal Holdings, LLC. All Rights Reserved. |
|
|
The information and data included in this Report are derived from sources available to Lehman Brothers Holdings Inc. and its other subsidiaries that have filed proceedings under Chapter 11 of the Bankruptcy Code (collectively, the "Debtors"). The Debtors have prepared this presentation based on the information available to them at this time, but note that such information is incomplete and may be materially deficient in certain respects. This report was prepared by the Debtors for purposes of presenting the Court with a status of the Estate as of the date of the presentation and is not meant to be relied upon by investors or others as a complete description of the Estate, its business, condition (financial or otherwise), results of operations, prospects, assets or liabilities. The information in this presentation will only be updated, including any corrections, in connection with future presentations to the Court on the state of the Debtors' estate. The Debtors reserve all rights to revise this report. All amounts are unaudited and subject to revision. 1 This report is intended to be read in conjunction with annotated explanations and footnotes which have been included in the version of this report filed with the Court and included in the filing on Form 8-K with the Securities and Exchange Commission (“SEC”). The annotated version of this report is also available on the website that hosts information about the Debtor at www.lehman-docket.com. This report should also be read in conjunction with Monthly Operating Reports (“MORs”) and other reports filed with the SEC and the Court. These reports can also be located at www.lehman-docket. com. |
|
|
Contents I. Executive Summary II. Financial A. Cash Position B. Cash Flow C. Finance and Accounting D. IT Migration Update 2 III. Asset Management Updates A. Loan Book B. Bank Platforms C. Private Equity / Principal Investments D. Real Estate Assets E. Derivatives Book F. Summary of Unfunded Commitments |
|
|
Contents (continued) IV. Claims Management Report A. Filed Claims Overview B. Selected Filed Claims Detail C. Reconciliation Efforts D. Next Steps V. Key Litigation Update 3 A. Bank of America Matter B. Barclays Matter VI. Plan of Reorganization Status A. Issue of Substantive Consolidation B. Target End of Q1 ’10 Plan of Reorganization Outline VII. Key Challenges |
|
|
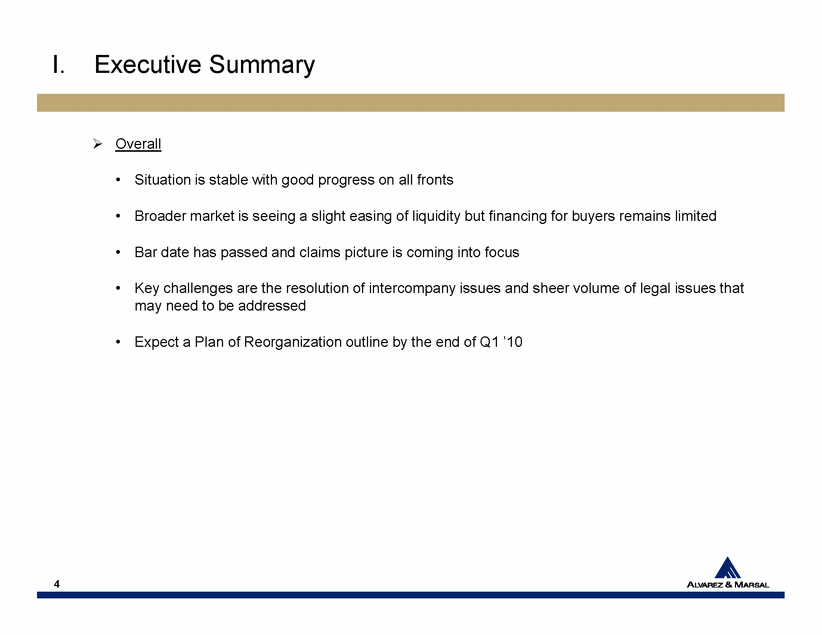
I. Executive Summary Overall • Situation is stable with good progress on all fronts • Broader market is seeing a slight easing of liquidity but financing for buyers remains limited • Bar date has passed and claims picture is coming into focus • Key challenges are the resolution of intercompany issues and sheer volume of legal issues that may need to be addressed 4 • Expect a Plan of Reorganization outline by the end of Q1 ’10 |
|
|
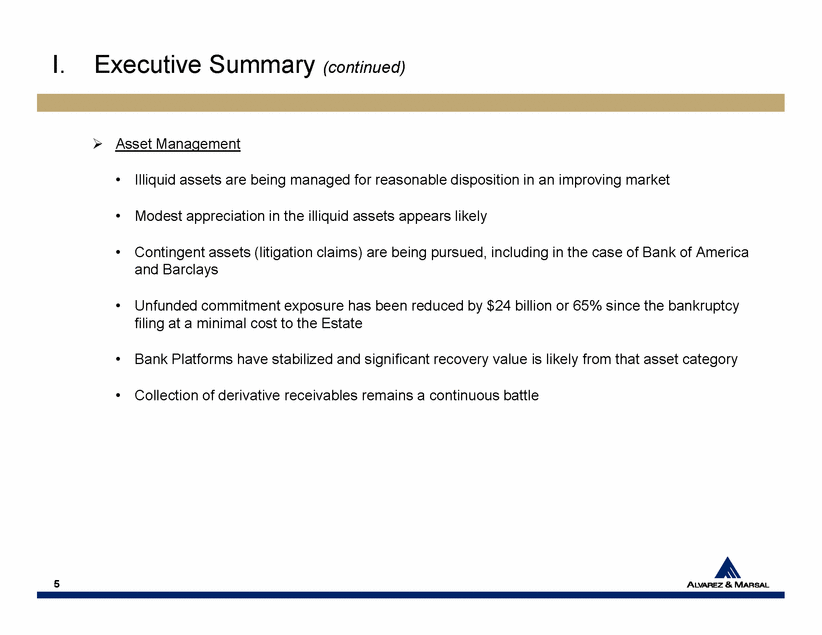
I. Executive Summary (continued) Asset Management • Illiquid assets are being managed for reasonable disposition in an improving market • Modest appreciation in the illiquid assets appears likely • Contingent assets (litigation claims) are being pursued, including in the case of Bank of America and Barclays • Unfunded commitment exposure has been reduced by $24 billion or 65% since the bankruptcy filing at a minimal cost to the Estate 5 • Bank Platforms have stabilized and significant recovery value is likely from that asset category • Collection of derivative receivables remains a continuous battle |
|
|
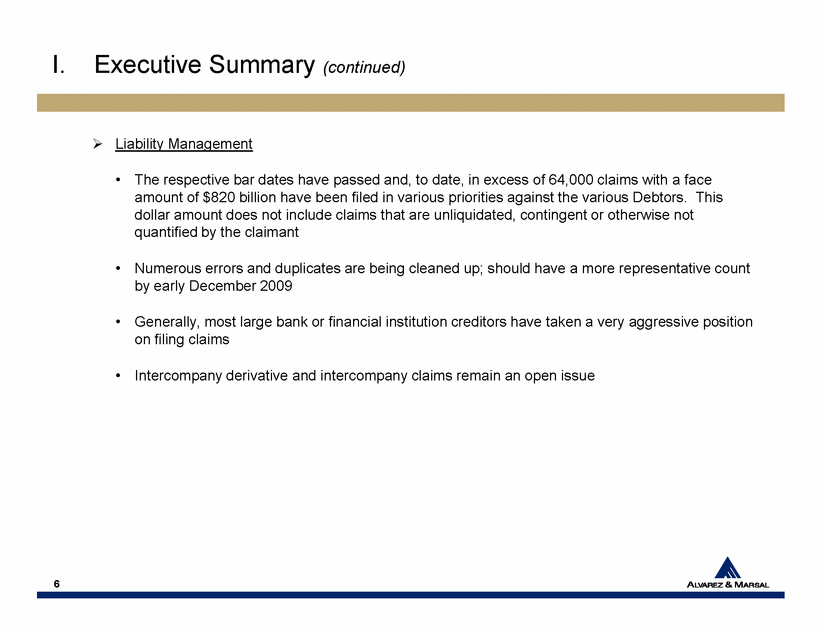
I. Executive Summary (continued) Liability Management • The respective bar dates have passed and, to date, in excess of 64,000 claims with a face amount of $820 billion have been filed in various priorities against the various Debtors. This dollar amount does not include claims that are unliquidated, contingent or otherwise not quantified by the claimant • Numerous errors and duplicates are being cleaned up; should have a more representative count by early December 2009 • Generally, most large bank or financial institution creditors have taken a very aggressive position 6 on filing claims • Intercompany derivative and intercompany claims remain an open issue |
|
|
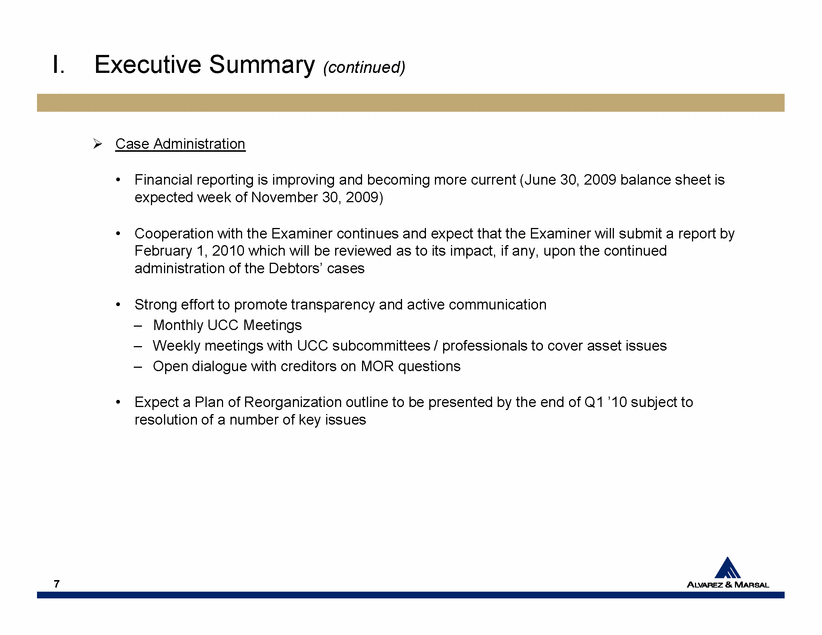
I. Executive Summary (continued) Case Administration • Financial reporting is improving and becoming more current (June 30, 2009 balance sheet is expected week of November 30, 2009) • Cooperation with the Examiner continues and expect that the Examiner will submit a report by February 1, 2010 which will be reviewed as to its impact, if any, upon the continued administration of the Debtors’ cases • Strong effort to promote transparency and active communication – Monthly UCC Meetings 7 – Weekly meetings with UCC subcommittees / professionals to cover asset issues – Open dialogue with creditors on MOR questions • Expect a Plan of Reorganization outline to be presented by the end of Q1 ’10 subject to resolution of a number of key issues |
|
|
II. Financial A. Cash Position B. Cash Flow C. Finance and Accounting D. IT Migration Update 8 |
|
|
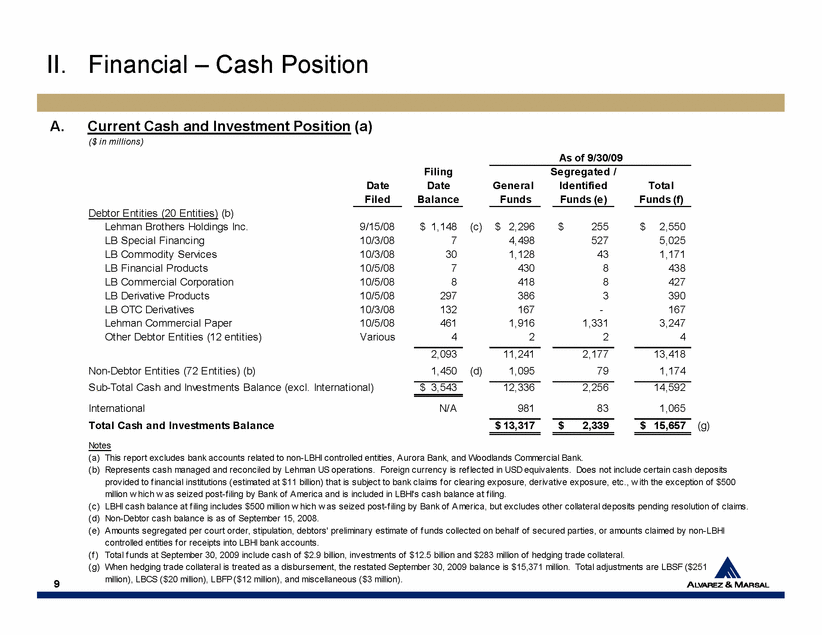
A. Current Cash and Investment Position (a) II. Financial – Cash Position ($ in millions) Filing Segregated / Date Date General Identified Total Filed Balance Funds Funds (e) Funds (f) Debtor Entities (20 Entities) (b) Lehman Brothers Holdings Inc. 9/15/08 1,148 $ (c) 2,296 $ 255 $ 2,550 $ LB Special Financing 10/3/08 7 4,498 527 5,025 LB Commodity Services 10/3/08 30 1,128 43 1,171 LB Financial Products 10/5/08 7 430 8 438 LB Commercial Corporation 10/5/08 8 418 8 427 LB Derivative Products 10/5/08 297 386 3 390 LB OTC Derivatives 10/3/08 132 167 - 167 Lehman Commercial Paper 10/5/08 461 1,916 1,331 3,247 As of 9/30/09 9 Other Debtor Entities (12 entities) Various 4 2 2 4 2,093 11,241 2,177 13,418 Non-Debtor Entities (72 Entities) (b) 1,450 (d) 1,095 79 1,174 Sub-Total Cash and Investments Balance (excl. International) 3,543 $ 12,336 2,256 14,592 International N/A 981 83 1,065 Total Cash and Investments Balance 13,317 $ 2,339 $ 15,657 $ (g) Notes (a) This report excludes bank accounts related to non-LBHI controlled entities, Aurora Bank, and Woodlands Commercial Bank. (b) Represents cash managed and reconciled by Lehman US operations. Foreign currency is reflected in USD equivalents. Does not include certain cash deposits provided to financial institutions (estimated at $11 billion) that is subject to bank claims for clearing exposure, derivative exposure, etc., with the exception of $500 million which was seized post-filing by Bank of America and is included in LBHI's cash balance at filing. (c) LBHI cash balance at filing includes $500 million which was seized post-filing by Bank of America, but excludes other collateral deposits pending resolution of claims. (d) Non-Debtor cash balance is as of September 15, 2008. (e) Amounts segregated per court order, stipulation, debtors' preliminary estimate of funds collected on behalf of secured parties, or amounts claimed by non-LBHI controlled entities for receipts into LBHI bank accounts. (f ) Total funds at September 30, 2009 include cash of $2.9 billion, investments of $12.5 billion and $283 million of hedging trade collateral. (g) When hedging trade collateral is treated as a disbursement, the restated September 30, 2009 balance is $15,371 million. Total adjustments are LBSF ($251 million), LBCS ($20 million), LBFP ($12 million), and miscellaneous ($3 million). |
|
|
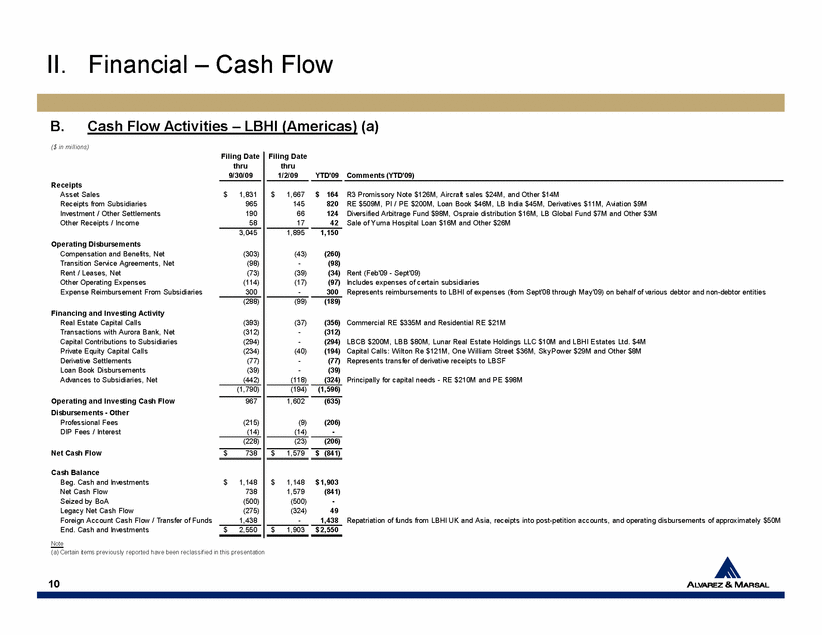
B. Cash Flow Activities – LBHI (Americas) (a) II. Financial – Cash Flow ($ in millions) Filing Date Filing Date thru thru 9/30/09 1/2/09 YTD'09 Comments (YTD'09) Receipts Asset Sales 1,831 $ 1,667 $ 164 $ R3 Promissory Note $126M, Aircraft sales $24M, and Other $14M Receipts from Subsidiaries 965 145 820 RE $509M, PI / PE $200M, Loan Book $46M, LB India $45M, Derivatives $11M, Aviation $9M Investment / Other Settlements 190 66 124 Diversified Arbitrage Fund $98M, Ospraie distribution $16M, LB Global Fund $7M and Other $3M Other Receipts / Income 58 17 42 Sale of Yuma Hospital Loan $16M and Other $26M 3,045 1,895 1,150 Operating Disbursements Compensation and Benefits, Net (303) (43) (260) Transition Service Agreements, Net (98) - (98) Rent / Leases, Net (73) (39) (34) Rent (Feb'09 - Sept'09) Other Operating Expenses (114) (17) (97) Includes expenses of certain subsidiaries Expense Reimbursement From Subsidiaries 300 - 300 Represents reimbursements to LBHI of expenses (from Sept'08 through May'09) on behalf of various debtor and non-debtor entities (288) (99) (189) Financing and Investing Activity 10 Real Estate Capital Calls (393) (37) (356) Commercial RE $335M and Residential RE $21M Transactions with Aurora Bank, Net (312) - (312) Capital Contributions to Subsidiaries (294) - (294) LBCB $200M, LBB $80M, Lunar Real Estate Holdings LLC $10M and LBHI Estates Ltd. $4M Private Equity Capital Calls (234) (40) (194) Capital Calls: Wilton Re $121M, One William Street $36M, SkyPower $29M and Other $8M Derivative Settlements (77) - (77) Represents transfer of derivative receipts to LBSF Loan Book Disbursements (39) - (39) Advances to Subsidiaries, Net (442) (118) (324) Principally for capital needs - RE $210M and PE $98M (1,790) (194) (1,596) Operating and Investing Cash Flow 967 1,602 (635) Disbursements - Other Professional Fees (215) (9) (206) DIP Fees / Interest (14) (14) - (228) (23) (206) Net Cash Flow 738 $ 1,579 $ (841) $ Cash Balance Beg. Cash and Investments 1,148 $ 1,148 $ 1,903 $ Net Cash Flow 738 1,579 (841) Seized by BoA (500) (500) - Legacy Net Cash Flow (275) (324) 49 Foreign Account Cash Flow / Transfer of Funds 1,438 - 1,438 Repatriation of funds from LBHI UK and Asia, receipts into post-petition accounts, and operating disbursements of approximately $50M End. Cash and Investments 2,550 $ 1,903 $ 2,550 $ Note (a) Certain items previously reported have been reclassified in this presentation |
|
|
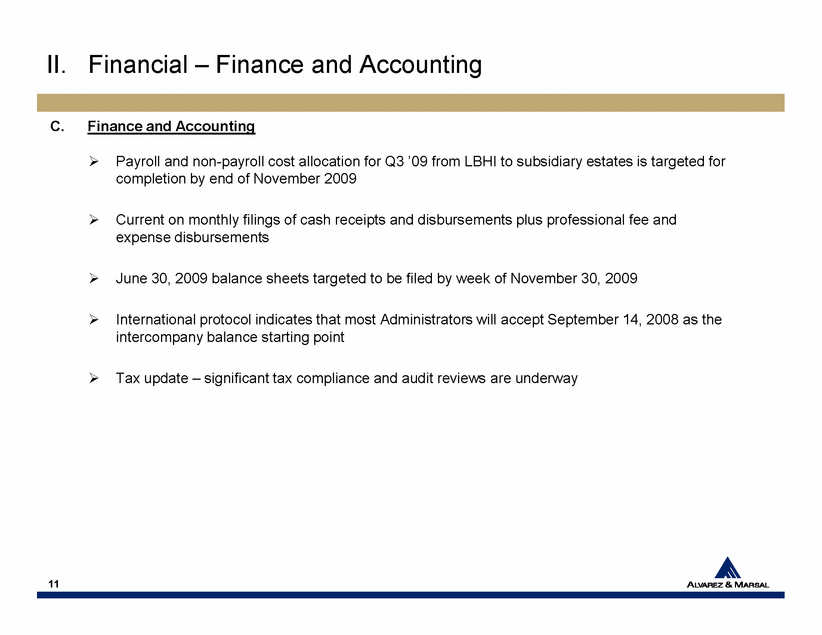
C. Finance and Accounting • Payroll and non-payroll cost allocation for Q3 ’09 from LBHI to subsidiary estates is targeted for completion by end of November 2009 • Current on monthly filings of cash receipts and disbursements plus professional fee and expense disbursements • June 30, 2009 balance sheets targeted to be filed by week of November 30, 2009 • International protocol indicates that most Administrators will accept September 14, 2008 as the II. Financial – Finance and Accounting intercompany balance starting point • Tax update – significant tax compliance and audit reviews are underway 11 |
|
|
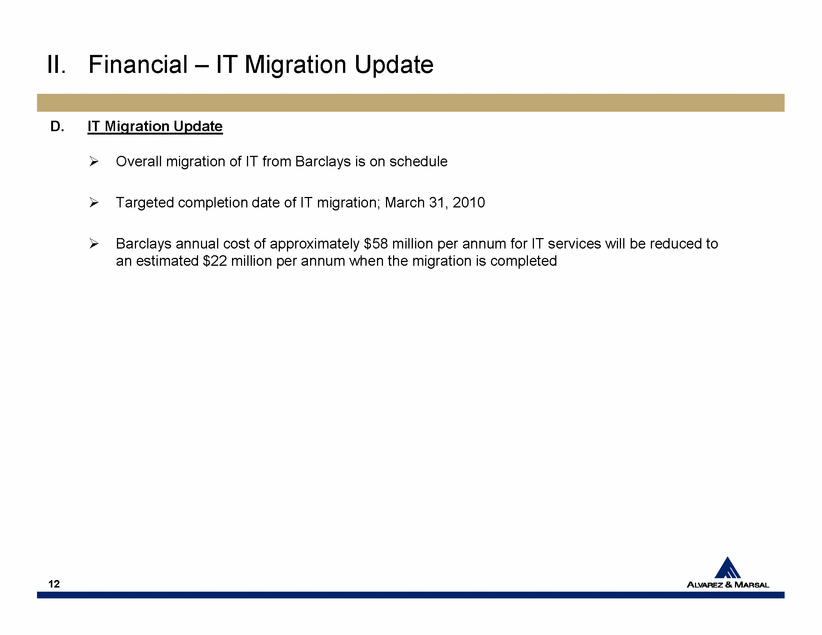
D. IT Migration Update • Overall migration of IT from Barclays is on schedule • Targeted completion date of IT migration; March 31, 2010 • Barclays annual cost of approximately $58 million per annum for IT services will be reduced to an estimated $22 million per annum when the migration is completed II. Financial – IT Migration Update 12 |
|
|
III. Asset Management Updates A. Loan Book B. Bank Platforms C. Private Equity / Principal Investments D. Real Estate Assets 13 E. Derivatives Book F. Summary of Unfunded Commitments |
|
|
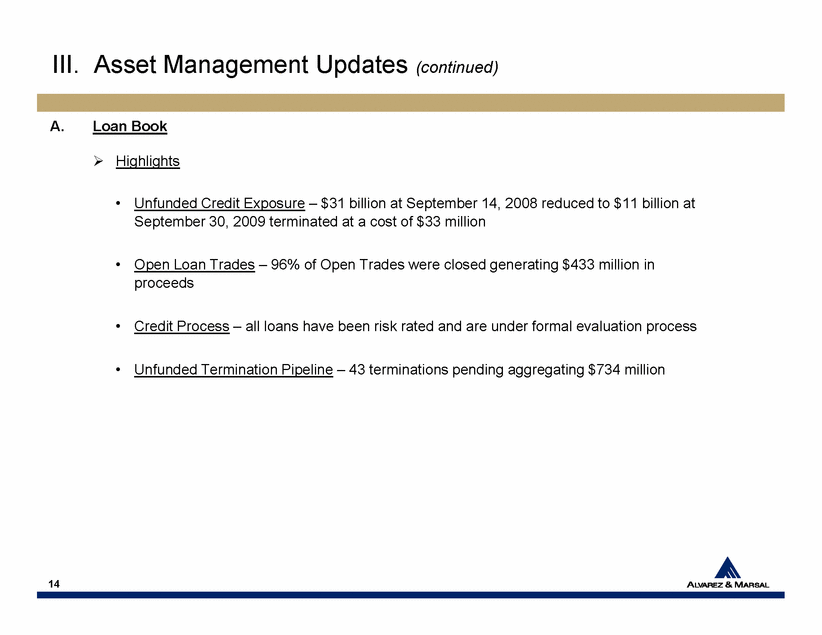
III. Asset Management Updates (continued) A. Loan Book Highlights • Unfunded Credit Exposure – $31 billion at September 14, 2008 reduced to $11 billion at September 30, 2009 terminated at a cost of $33 million • Open Loan Trades – 96% of Open Trades were closed generating $433 million in proceeds 14 • Credit Process – all loans have been risk rated and are under formal evaluation process • Unfunded Termination Pipeline – 43 terminations pending aggregating $734 million |
|
|
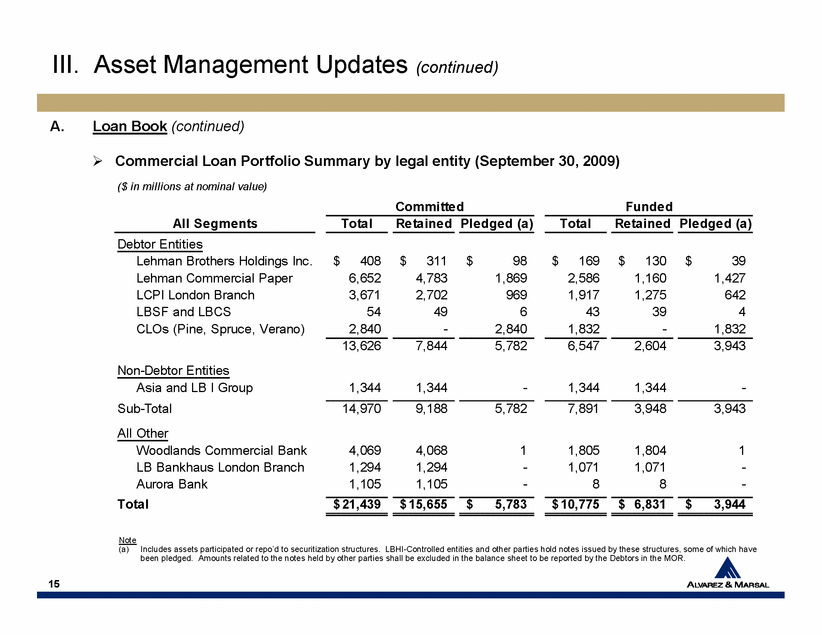
III. Asset Management Updates (continued) A. Loan Book (continued) Commercial Loan Portfolio Summary by legal entity (September 30, 2009) ($ in millions at nominal value) Committed Funded All Segments Total Retained Pledged (a) Total Retained Pledged (a) Debtor Entities Lehman Brothers Holdings Inc. 408 $ 311 $ 98 $ 169 $ 130 $ 39 $ Lehman Commercial Paper 6,652 4,783 1,869 2,586 1,160 1,427 LCPI London Branch 3,671 2,702 969 1,917 1,275 642 LBSF and LBCS 54 49 6 43 39 4 15 Note (a) Includes assets participated or repo’d to securitization structures. LBHI-Controlled entities and other parties hold notes issued by these structures, some of which have been pledged. Amounts related to the notes held by other parties shall be excluded in the balance sheet to be reported by the Debtors in the MOR. CLOs (Pine, Spruce, Verano) 2,840 - 2,840 1,832 - 1,832 13,626 7,844 5,782 6,547 2,604 3,943 Non-Debtor Entities Asia and LB I Group 1,344 1,344 - 1,344 1,344 - Sub-Total 14,970 9,188 5,782 7,891 3,948 3,943 All Other Woodlands Commercial Bank 4,069 4,068 1 1,805 1,804 1 LB Bankhaus London Branch 1,294 1,294 - 1,071 1,071 - Aurora Bank 1,105 1,105 - 8 8 - Total 21,439 $ 15,655 $ 5,783 $ 10,775 $ 6,831 $ 3,944 $ |
|
|
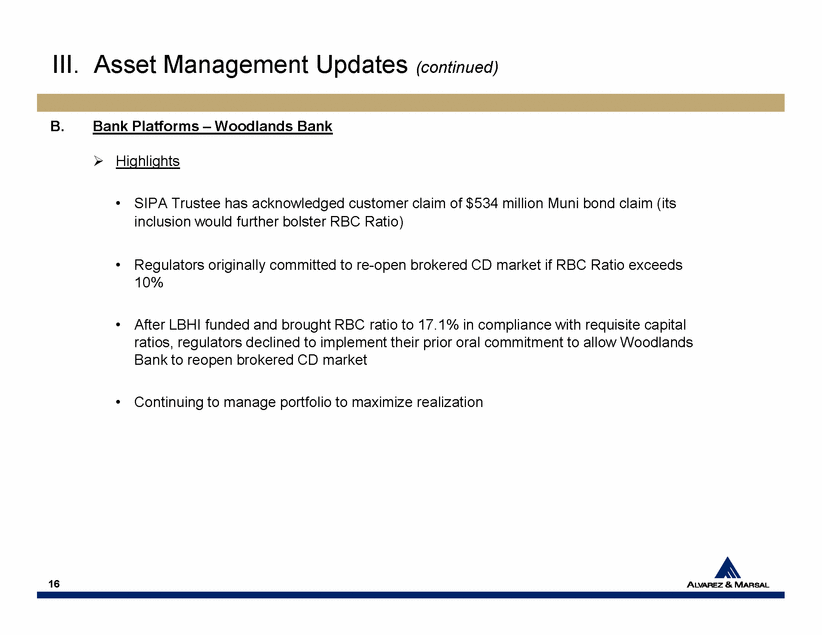
III. Asset Management Updates (continued) B. Bank Platforms – Woodlands Bank Highlights • SIPA Trustee has acknowledged customer claim of $534 million Muni bond claim (its inclusion would further bolster RBC Ratio) • Regulators originally committed to re-open brokered CD market if RBC Ratio exceeds 10% • After LBHI funded and brought RBC ratio to 17.1% in compliance with requisite capital 16 ratios, regulators declined to implement their prior oral commitment to allow Woodlands Bank to reopen brokered CD market • Continuing to manage portfolio to maximize realization |
|
|
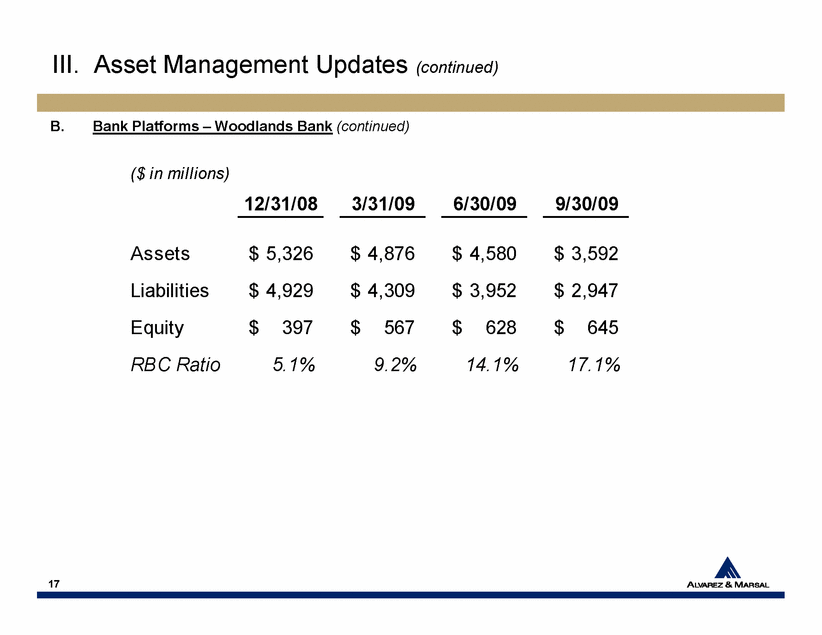
III. Asset Management Updates (continued) B. Bank Platforms – Woodlands Bank (continued) ($ in millions) 12/31/08 3/31/09 6/30/09 9/30/09 Assets 5,326 $ 4,876 $ 4,580 $ 3,592 $ Liabilities 4,929 $ 4,309 $ 3,952 $ 2,947 $ Equity 397 $ 567 $ 628 $ 645 $ 17 RBC Ratio 5.1% 9.2% 14.1% 17.1% |
|
|
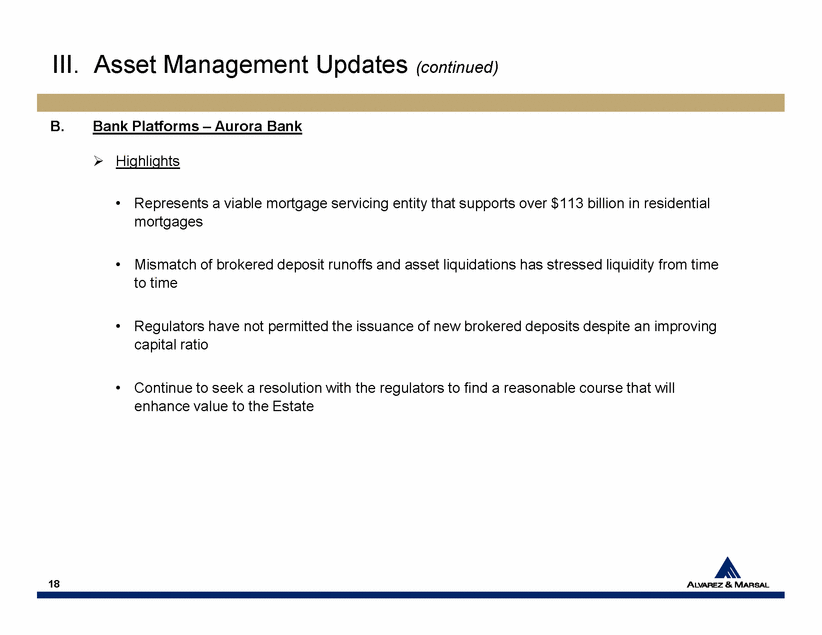
III. Asset Management Updates (continued) B. Bank Platforms – Aurora Bank Highlights • Represents a viable mortgage servicing entity that supports over $113 billion in residential mortgages • Mismatch of brokered deposit runoffs and asset liquidations has stressed liquidity from time to time 18 • Regulators have not permitted the issuance of new brokered deposits despite an improving capital ratio • Continue to seek a resolution with the regulators to find a reasonable course that will enhance value to the Estate |
|
|
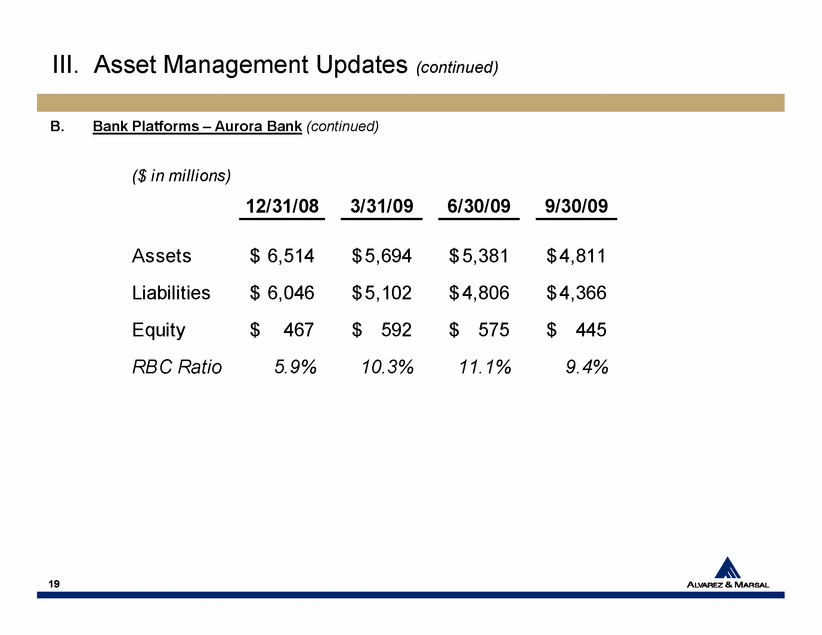
III. Asset Management Updates (continued) B. Bank Platforms – Aurora Bank (continued) ($ in millions) 12/31/08 3/31/09 6/30/09 9/30/09 Assets 6,514 $ 5,694 $ 5,381 $ 4,811 $ Liabilities 6,046 $ 5,102 $ 4,806 $ 4,366 $ 19 Equity 467 $ 592 $ 575 $ 445 $ RBC Ratio 5.9% 10.3% 11.1% 9.4% |
|
|
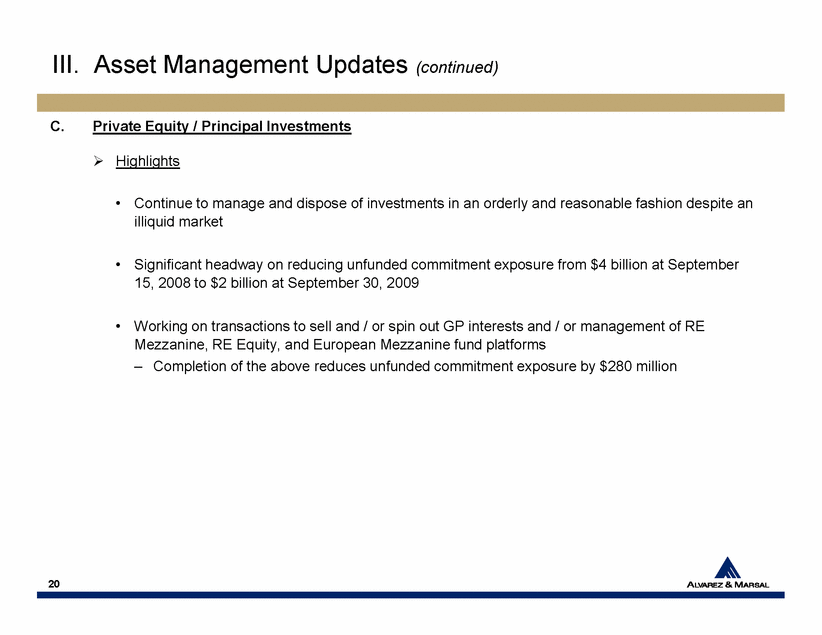
III. Asset Management Updates (continued) C. Private Equity / Principal Investments Highlights • Continue to manage and dispose of investments in an orderly and reasonable fashion despite an illiquid market • Significant headway on reducing unfunded commitment exposure from $4 billion at September 15, 2008 to $2 billion at September 30, 2009 20 • Working on transactions to sell and / or spin out GP interests and / or management of RE Mezzanine, RE Equity, and European Mezzanine fund platforms – Completion of the above reduces unfunded commitment exposure by $280 million |
|
|
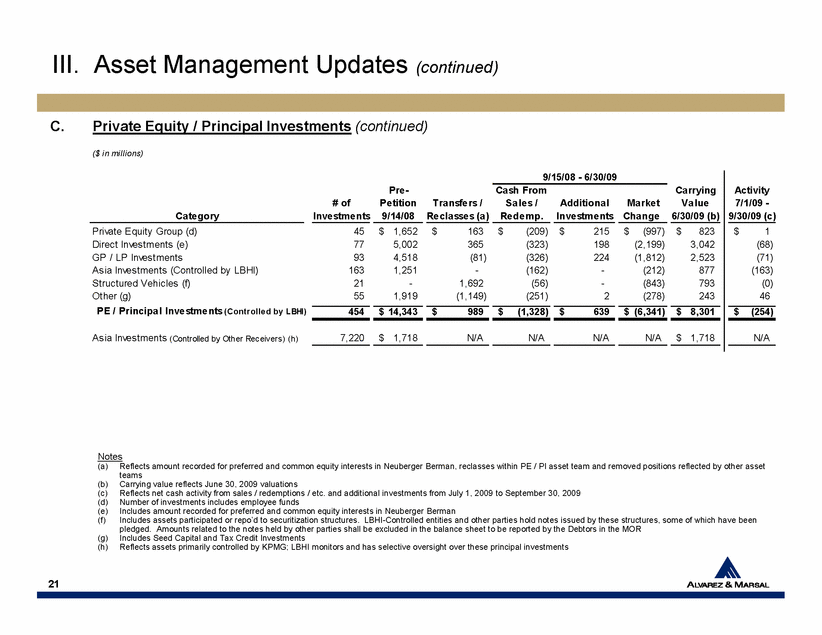
III. Asset Management Updates (continued) C. Private Equity / Principal Investments (continued) ($ in millions) 9/15/08 - 6/30/09 Pre- Cash From Carrying Activity # of Petition Transfers / Sales / Additional Market Value 7/1/09 - Category Investments 9/14/08 Reclasses (a) Redemp. Investments Change 6/30/09 (b) 9/30/09 (c) Private Equity Group (d) 45 1,652 $ 163 $ (209) $ 215 $ (997) $ 823 $ 1 $ Direct Investments (e) 77 5,002 365 (323) 198 (2,199) 3,042 (68) GP / LP Investments 93 4,518 (81) (326) 224 (1,812) 2,523 (71) Asia Investments (Controlled by LBHI) 163 1,251 - (162) - (212) 877 (163) Structured Vehicles (f) 21 - 1,692 (56) - (843) 793 (0) Other (g) 55 1,919 (1,149) (251) 2 (278) 243 46 PE / Principal Investments (Controlled by LBHI) 454 14,343 $ 989 $ (1,328) $ 639 $ (6,341) $ 8,301 $ (254) $ 21 Notes (a) Reflects amount recorded for preferred and common equity interests in Neuberger Berman, reclasses within PE / PI asset team and removed positions reflected by other asset teams (b) Carrying value reflects June 30, 2009 valuations (c) Reflects net cash activity from sales / redemptions / etc. and additional investments from July 1, 2009 to September 30, 2009 (d) Number of investments includes employee funds (e) Includes amount recorded for preferred and common equity interests in Neuberger Berman (f) Includes assets participated or repo’d to securitization structures. LBHI-Controlled entities and other parties hold notes issued by these structures, some of which have been pledged. Amounts related to the notes held by other parties shall be excluded in the balance sheet to be reported by the Debtors in the MOR (g) Includes Seed Capital and Tax Credit Investments (h) Reflects assets primarily controlled by KPMG; LBHI monitors and has selective oversight over these principal investments Asia Investments (Controlled by Other Receivers) (h) 7,220 1,718 $ N/A N/A N/A N/A 1,718 $ N/A |
|
|
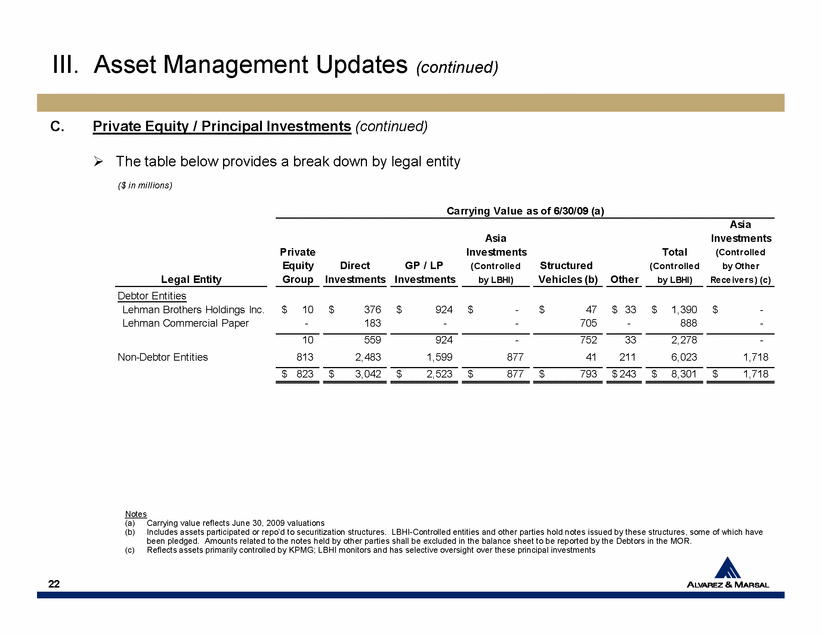
III. Asset Management Updates (continued) C. Private Equity / Principal Investments (continued) The table below provides a break down by legal entity ($ in millions) Carrying Value as of 6/30/09 (a) Asia Asia Investments Private Investments Total (Controlled Equity Direct GP / LP (Controlled Structured (Controlled by Other Legal Entity Group Investments Investments by LBHI) Vehicles (b) Other by LBHI) Receivers) (c) Debtor Entities Lehman Brothers Holdings Inc. 10 $ 376 $ 924 $ - $ 47 $ 33 $ 1,390 $ - $ Lehman Commercial Paper - 183 - - 705 - 888 - 22 Notes (a) Carrying value reflects June 30, 2009 valuations (b) Includes assets participated or repo’d to securitization structures. LBHI-Controlled entities and other parties hold notes issued by these structures, some of which have been pledged. Amounts related to the notes held by other parties shall be excluded in the balance sheet to be reported by the Debtors in the MOR. (c) Reflects assets primarily controlled by KPMG; LBHI monitors and has selective oversight over these principal investments 10 559 924 - 752 33 2,278 - Non-Debtor Entities 813 2,483 1,599 877 41 211 6,023 1,718 823 $ 3,042 $ 2,523 $ 877 $ 793 $ 243 $ 8,301 $ 1,718 $ |
|
|
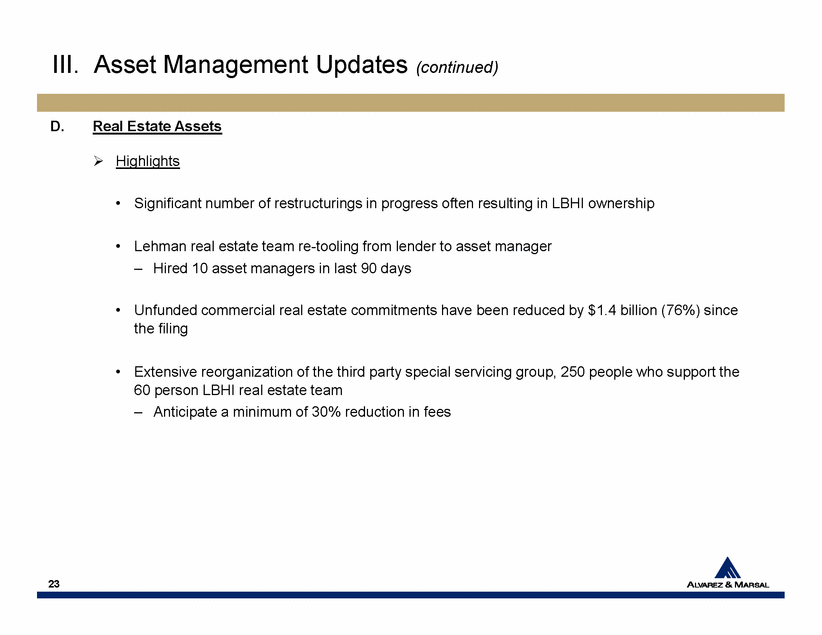
III. Asset Management Updates (continued) D. Real Estate Assets Highlights • Significant number of restructurings in progress often resulting in LBHI ownership • Lehman real estate team re-tooling from lender to asset manager – Hired 10 asset managers in last 90 days • Unfunded commercial real estate commitments have been reduced by $1.4 billion (76%) since 23 the filing • Extensive reorganization of the third party special servicing group, 250 people who support the 60 person LBHI real estate team – Anticipate a minimum of 30% reduction in fees |
|
|
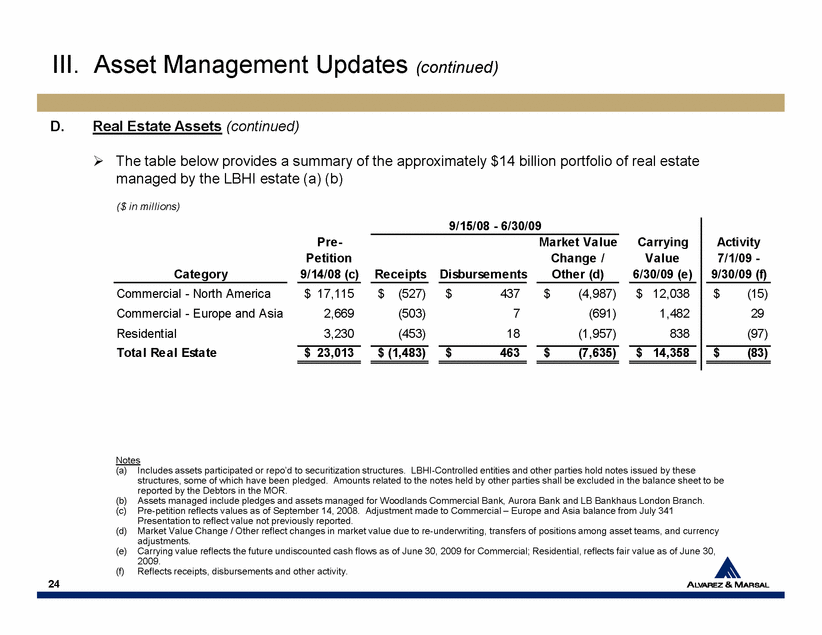
III. Asset Management Updates (continued) D. Real Estate Assets (continued) The table below provides a summary of the approximately $14 billion portfolio of real estate managed by the LBHI estate (a) (b) ($ in millions) 9/15/08 - 6/30/09 Pre- Market Value Carrying Activity Petition Change / Value 7/1/09 - Category 9/14/08 (c) Receipts Disbursements Other (d) 6/30/09 (e) 9/30/09 (f) Commercial - North America 17,115 $ (527) $ 437 $ (4,987) $ 12,038 $ (15) $ Commercial - Europe and Asia 2,669 (503) 7 (691) 1,482 29 24 Notes (a) Includes assets participated or repo’d to securitization structures. LBHI-Controlled entities and other parties hold notes issued by these structures, some of which have been pledged. Amounts related to the notes held by other parties shall be excluded in the balance sheet to be reported by the Debtors in the MOR. (b) Assets managed include pledges and assets managed for Woodlands Commercial Bank, Aurora Bank and LB Bankhaus London Branch. (c) Pre-petition reflects values as of September 14, 2008. Adjustment made to Commercial – Europe and Asia balance from July 341 Presentation to reflect value not previously reported. (d) Market Value Change / Other reflect changes in market value due to re-underwriting, transfers of positions among asset teams, and currency adjustments. (e) Carrying value reflects the future undiscounted cash flows as of June 30, 2009 for Commercial; Residential, reflects fair value as of June 30, 2009. (f) Reflects receipts, disbursements and other activity. Residential 3,230 (453) 18 (1,957) 838 (97) Total Real Estate 23,013 $ (1,483) $ 463 $ (7,635) $ 14,358 $ (83) $ |
|
|
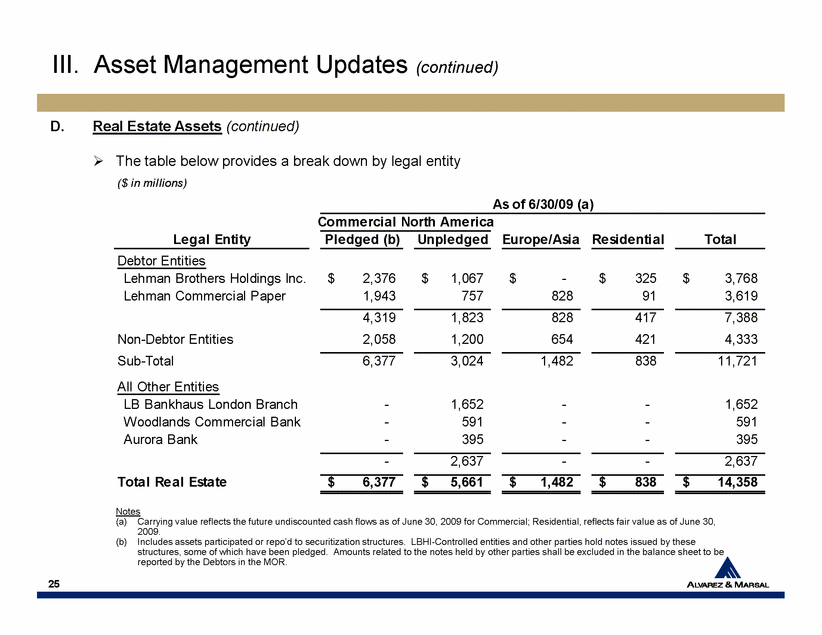
III. Asset Management Updates (continued) D. Real Estate Assets (continued) • The table below provides a break down by legal entity ($ in millions) As of 6/30/09 (a) Commercial North America Legal Entity Pledged (b) Unpledged Europe/Asia Residential Total Debtor Entities Lehman Brothers Holdings Inc. 2,376 $ 1,067 $ - $ 325 $ 3,768 $ Lehman Commercial Paper 1,943 757 828 91 3,619 4,319 1,823 828 417 7,388 25 Notes (a) Carrying value reflects the future undiscounted cash flows as of June 30, 2009 for Commercial; Residential, reflects fair value as of June 30, 2009. (b) Includes assets participated or repo’d to securitization structures. LBHI-Controlled entities and other parties hold notes issued by these structures, some of which have been pledged. Amounts related to the notes held by other parties shall be excluded in the balance sheet to be reported by the Debtors in the MOR. Non-Debtor Entities 2,058 1,200 654 421 4,333 Sub-Total 6,377 3,024 1,482 838 11,721 All Other Entities LB Bankhaus London Branch - 1,652 - - 1,652 Woodlands Commercial Bank - 591 - - 591 Aurora Bank - 395 - - 395 - 2,637 - - 2,637 Total Real Estate 6,377 $ 5,661 $ 1,482 $ 838 $ 14,358 $ |
|
|
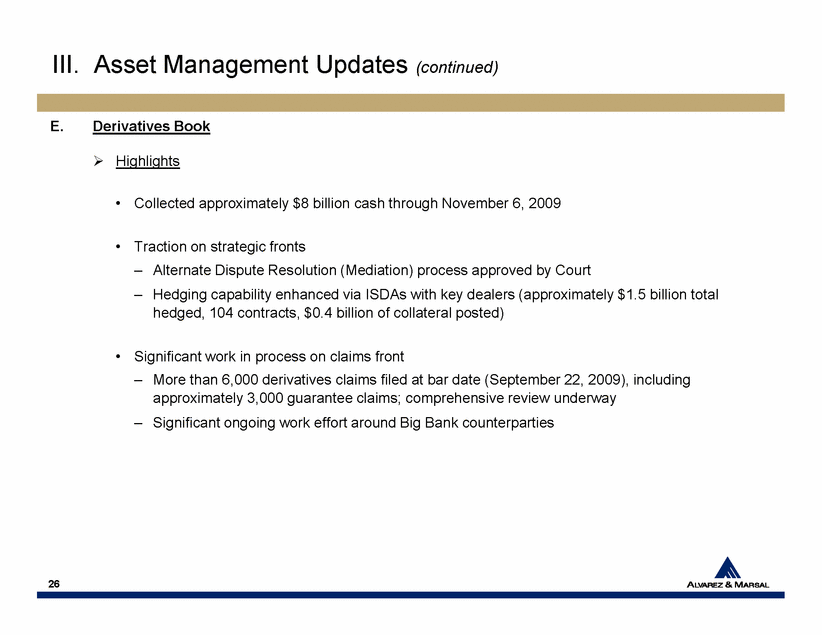
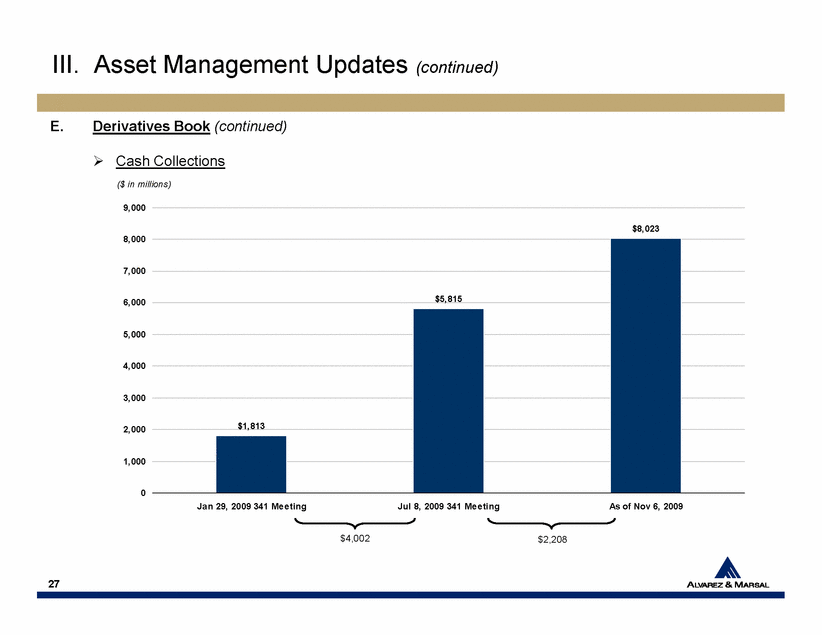
III. Asset Management Updates (continued) E. Derivatives Book • Highlights • Collected approximately $8 billion cash through November 6, 2009 • Traction on strategic fronts – Alternate Dispute Resolution (Mediation) process approved by Court – Hedging capability enhanced via ISDAs with key dealers (approximately $1.5 billion total hedged, 104 contracts, $0.4 billion of collateral posted) 26 • Significant work in process on claims front – More than 6,000 derivatives claims filed at bar date (September 22, 2009), including approximately 3,000 guarantee claims; comprehensive review underway – Significant ongoing work effort around Big Bank counterparties |
|
|
E. Derivatives Book (continued) • Cash Collections III. Asset Management Updates (continued) $5,815 $8,023 6,000 7,000 8,000 9,000 ($ in millions) 27 $4,002 $2,208 $1,813 0 1,000 2,000 3,000 4,000 5,000 Jan 29, 2009 341 Meeting Jul 8, 2009 341 Meeting As of Nov 6, 2009 |
|
|
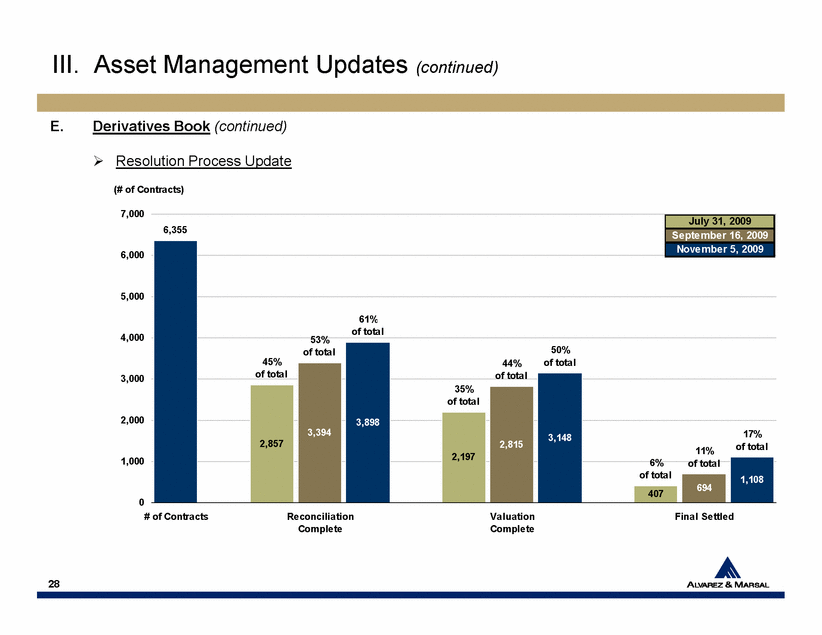
6,355 61% 5,000 6,000 7,000 (# of Contracts) III. Asset Management Updates (continued) E. Derivatives Book (continued) • Resolution Process Update July 31, 2009 September 16, 2009 November 5, 2009 3,394 3,898 3,148 694 407 2,197 1,108 2,815 2,857 11% of total 35% of total 45% of total 53% of total of total 44% of total 50% of total 6% of total 17% of total 0 1,000 2,000 3,000 4,000 # of Contracts Reconciliation Complete Valuation Complete Final Settled 28 |
|
|
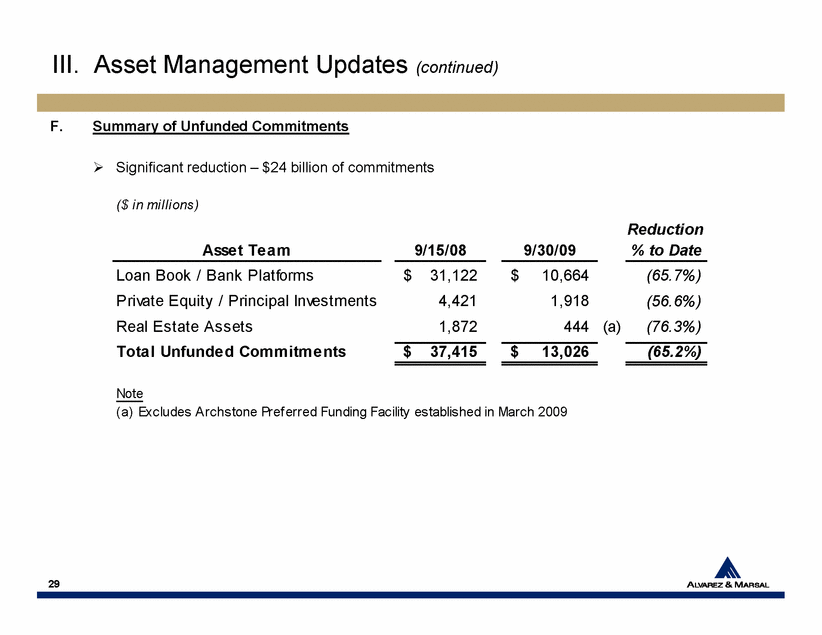
III. Asset Management Updates (continued) F. Summary of Unfunded Commitments • Significant reduction – $24 billion of commitments ($ in millions) Reduction Asset Team 9/15/08 9/30/09 % to Date Loan Book / Bank Platforms 31,122 $ 10,664 $ (65.7%) Private Equity / Principal Investments 4,421 1,918 (56.6%) 29 Real Estate Assets 1,872 444 (a) (76.3%) Total Unfunded Commitments 37,415 $ 13,026 $ (65.2%) Note (a) Excludes Archstone Preferred Funding Facility established in March 2009 |
|
|
IV. Claims Management Report A. Filed Claims Overview B. Selected Filed Claims Detail C. Reconciliation Efforts D. Next Steps 30 |
|
|
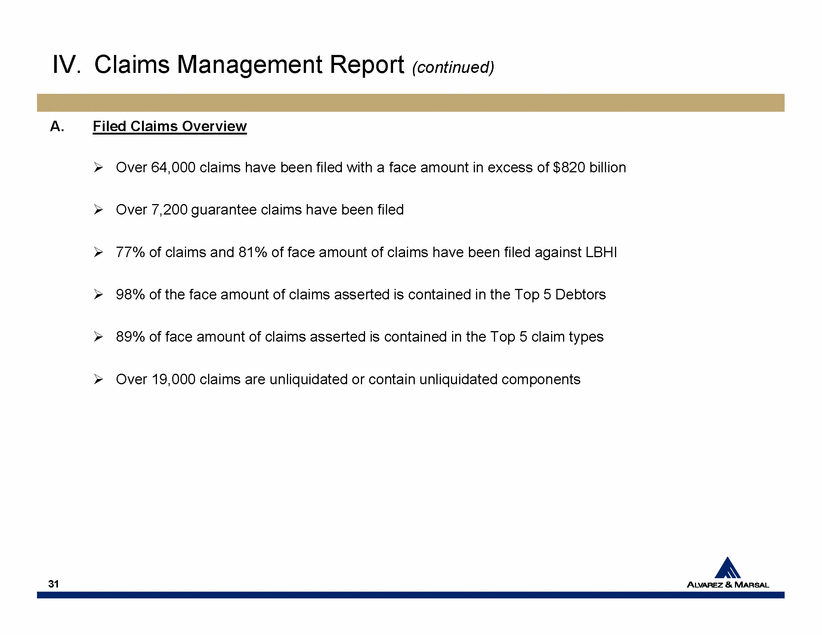
IV. Claims Management Report (continued) A. Filed Claims Overview • Over 64,000 claims have been filed with a face amount in excess of $820 billion • Over 7,200 guarantee claims have been filed • 77% of claims and 81% of face amount of claims have been filed against LBHI • 98% of the face amount of claims asserted is contained in the Top 5 Debtors 31 • 89% of face amount of claims asserted is contained in the Top 5 claim types • Over 19,000 claims are unliquidated or contain unliquidated components |
|
|
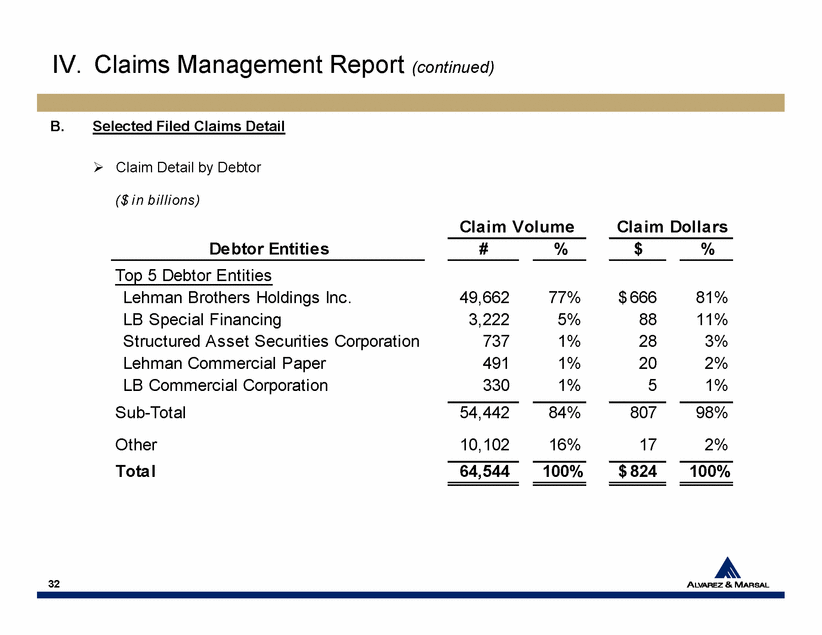
IV. Claims Management Report (continued) B. Selected Filed Claims Detail • Claim Detail by Debtor ($ in billions) Claim Volume Claim Dollars Debtor Entities # % $ % Top 5 Debtor Entities Lehman Brothers Holdings Inc. 49,662 77% 666 $ 81% LB Special Financing 3,222 5% 88 11% 32 Structured Asset Securities Corporation 737 1% 28 3% Lehman Commercial Paper 491 1% 20 2% LB Commercial Corporation 330 1% 5 1% Sub-Total 54,442 84% 807 98% Other 10,102 16% 17 2% Total 64,544 100% 824 $ 100% |
|
|
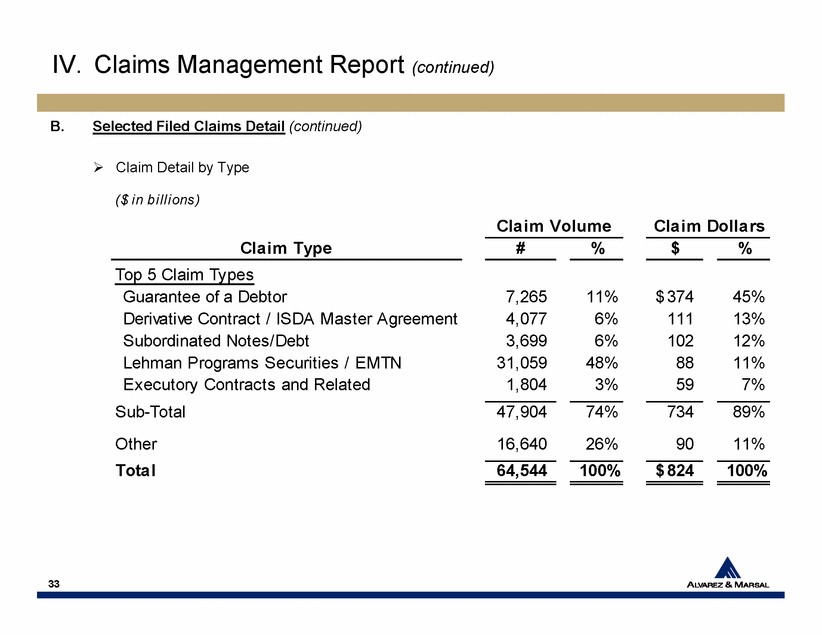
IV. Claims Management Report (continued) B. Selected Filed Claims Detail (continued) • Claim Detail by Type ($ in billions) Claim Volume Claim Dollars Claim Type # % $ % Top 5 Claim Types Guarantee of a Debtor 7,265 11% 374 $ 45% Derivative Contract / ISDA Master Agreement 4,077 6% 111 13% 33 Subordinated Notes/Debt 3,699 6% 102 12% Lehman Programs Securities / EMTN 31,059 48% 88 11% Executory Contracts and Related 1,804 3% 59 7% Sub-Total 47,904 74% 734 89% Other 16,640 26% 90 11% Total 64,544 100% 824 $ 100% |
|
|
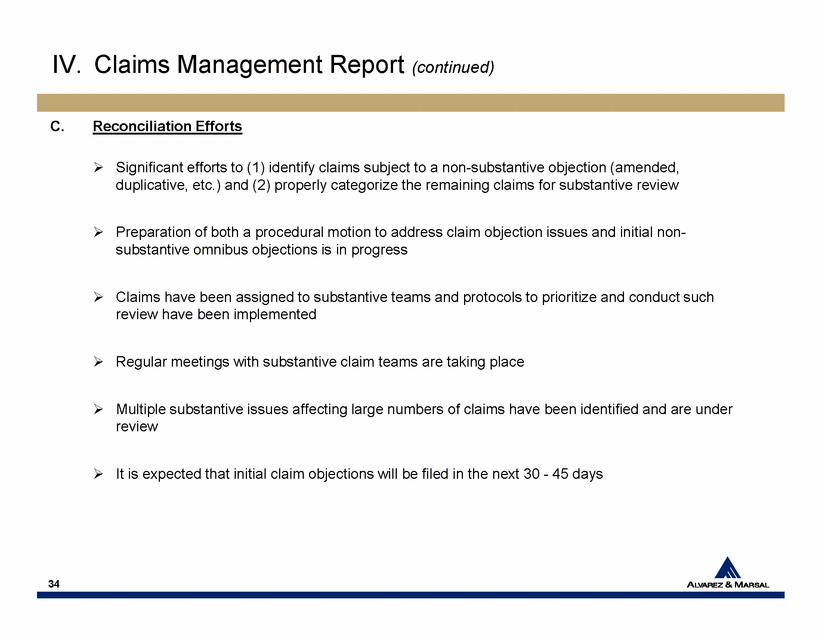
IV. Claims Management Report (continued) C. Reconciliation Efforts • Significant efforts to (1) identify claims subject to a non-substantive objection (amended, duplicative, etc.) and (2) properly categorize the remaining claims for substantive review • Preparation of both a procedural motion to address claim objection issues and initial non-substantive omnibus objections is in progress • Claims have been assigned to substantive teams and protocols to prioritize and conduct such review have been implemented 34 • Regular meetings with substantive claim teams are taking place • Multiple substantive issues affecting large numbers of claims have been identified and are under review • It is expected that initial claim objections will be filed in the next 30 - 45 days |
|
|
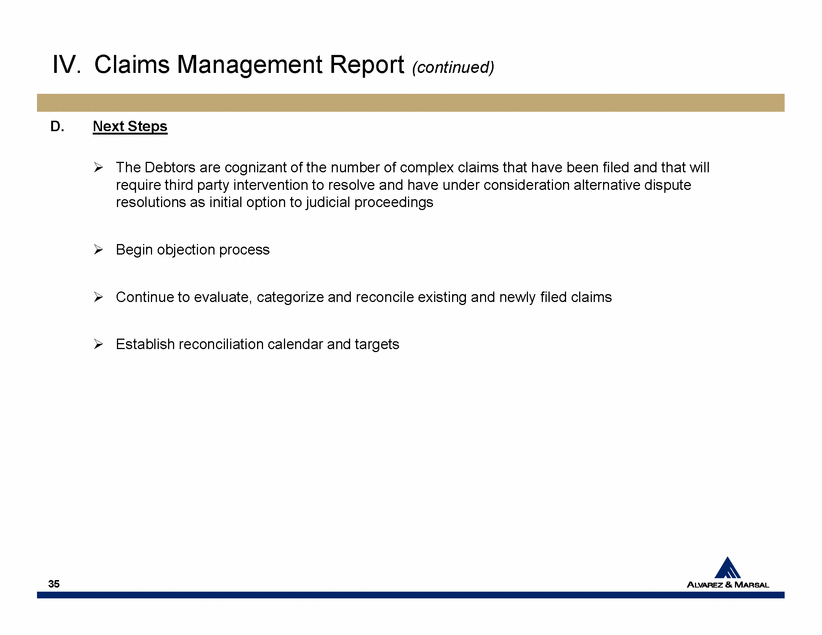
IV. Claims Management Report (continued) D. Next Steps • The Debtors are cognizant of the number of complex claims that have been filed and that will require third party intervention to resolve and have under consideration alternative dispute resolutions as initial option to judicial proceedings • Begin objection process • Continue to evaluate, categorize and reconcile existing and newly filed claims 35 • Establish reconciliation calendar and targets |
|
|
V. Key Litigation Update A. Bank of America Matter B. Barclays Matter 36 |
|
|
V. Key Litigation Update (continued) A. Bank of America Matter • Cross motions for summary judgments filed • Fully briefed and court will hear on December 10, 2009 37 |
|
|
V. Key Litigation Update (continued) B. Barclays Matter • 60 (b) motion filed • Complaint filed November 16, 2009 • Discovery underway 38 |
|
|
VI. Plan of Reorganization Status A. Issue of Substantive Consolidation • Issue is being intensively studied and any recommendation or action pursued will be the result of deep consideration and carefully deliberated judgment B. Target End of Q1 ’10 Plan of Reorganization Outline 39 |
|
|
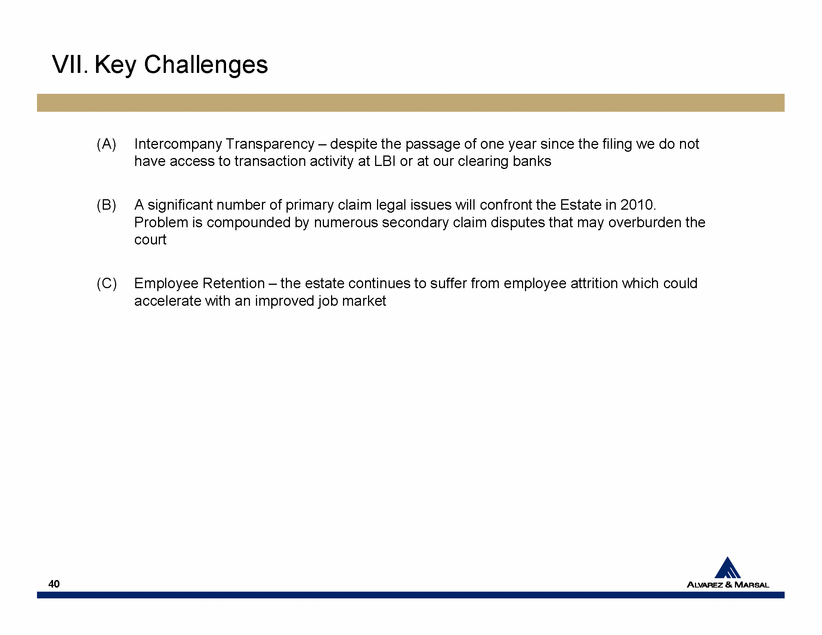
VII. Key Challenges (A) Intercompany Transparency – despite the passage of one year since the filing we do not have access to transaction activity at LBI or at our clearing banks (B) A significant number of primary claim legal issues will confront the Estate in 2010. Problem is compounded by numerous secondary claim disputes that may overburden the court (C) Employee Retention – the estate continues to suffer from employee attrition which could accelerate with an improved job market 40 |

