Attached files
| file | filename |
|---|---|
| 8-K - CSC 8K FORM 11182009 - COMPUTER SCIENCES CORP | form8k.htm |

*
November 18,
2009
INVESTOR
CONFERENCE
CONFERENCE

*
Forward-Looking
Statement
All
written or oral statements made by CSC at this meeting or in
these presentation materials that do not directly and exclusively
relate to historical facts constitute “forward-looking statements”
within the meaning of the Private Securities Litigation Reform Act
of 1995. These statements represent CSC’s expectations and
beliefs, and no assurance can be given that the results described
in such statements will be achieved. These statements are
subject to risks, uncertainties, and other factors, many outside of
CSC’s control, that could cause actual results to differ materially
from the results described in such statements. For a description
of these factors, please see CSC’s most recent Annual Report on
Form 10-K and Quarterly Reports on Form 10-Q.

*
This
presentation includes certain non-GAAP financial measures, such as
operating income, operating costs, and free cash flow. These non-GAAP
financial measures are not meant to be considered in isolation or as a
substitute for results prepared in accordance with accounting principles
generally accepted in the United States (GAAP). A reconciliation of non-
GAAP financial measures included in this presentation to the most
directly comparable financial measure calculated and presented in
accordance with GAAP is set forth elsewhere in this presentation and on
our web site at www.csc.com. CSC management believes that these
non-GAAP financial measures provide useful information to investors
regarding the Company's financial condition and results of operations as
they provide another measure of the Company's profitability and ability
to service its debt, and are considered important measures by financial
analysts covering CSC and its peers.
Non-GAAP
Measures

*
Company
and
Strategic Overview
Strategic Overview
Mike
Laphen
Chairman
and
Chief Executive Officer
Chief Executive Officer
November 18,
2009
CSC
INVESTOR CONFERENCE
*
Welcome
to CSC’s Investor Conference
$16B
global IT services powerhouse
Ranking
153 on the Fortune 500
Operating in more
than 90 countries
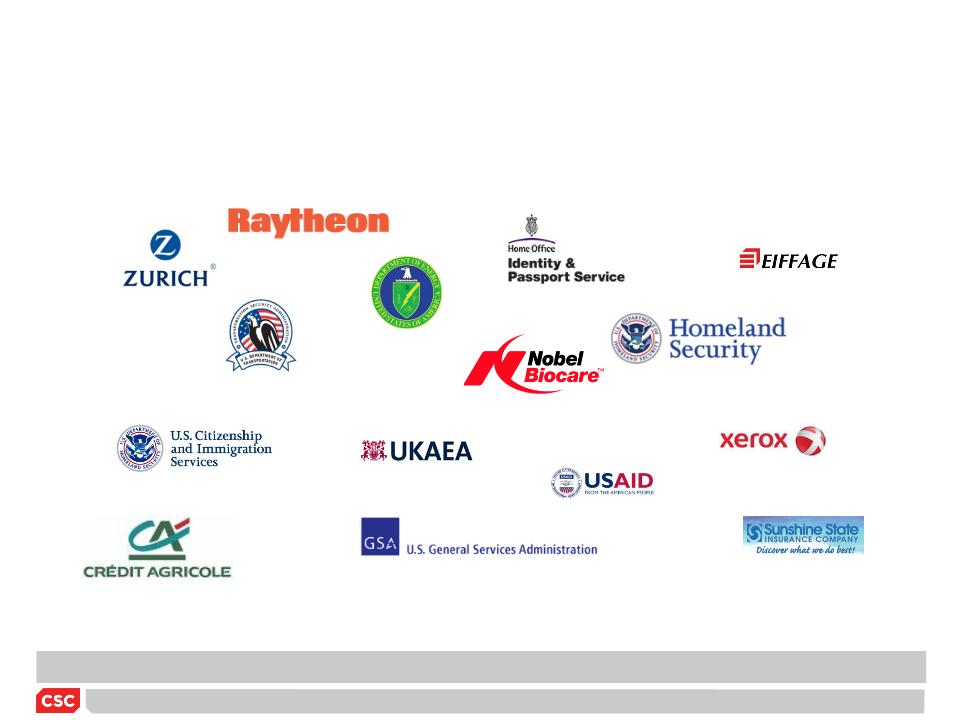
2,500
world-class customers
92,000
employees worldwide
50-year
track record of client service excellence
NYSE:
CSC
CSC
Today
*
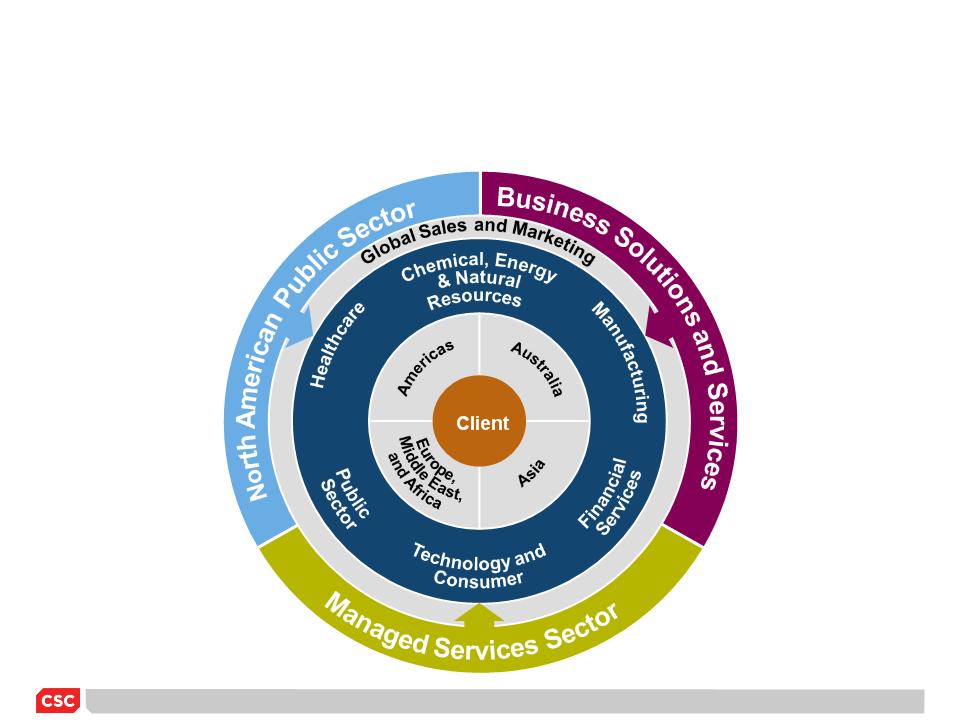
CSC:
A Global Technology and Business Services Company
Business Solutions
and
Services (BSS)
Services (BSS)
North
American Public Sector
(NPS)
(NPS)
Government
Managed
Services
Sector (MSS)
Sector (MSS)
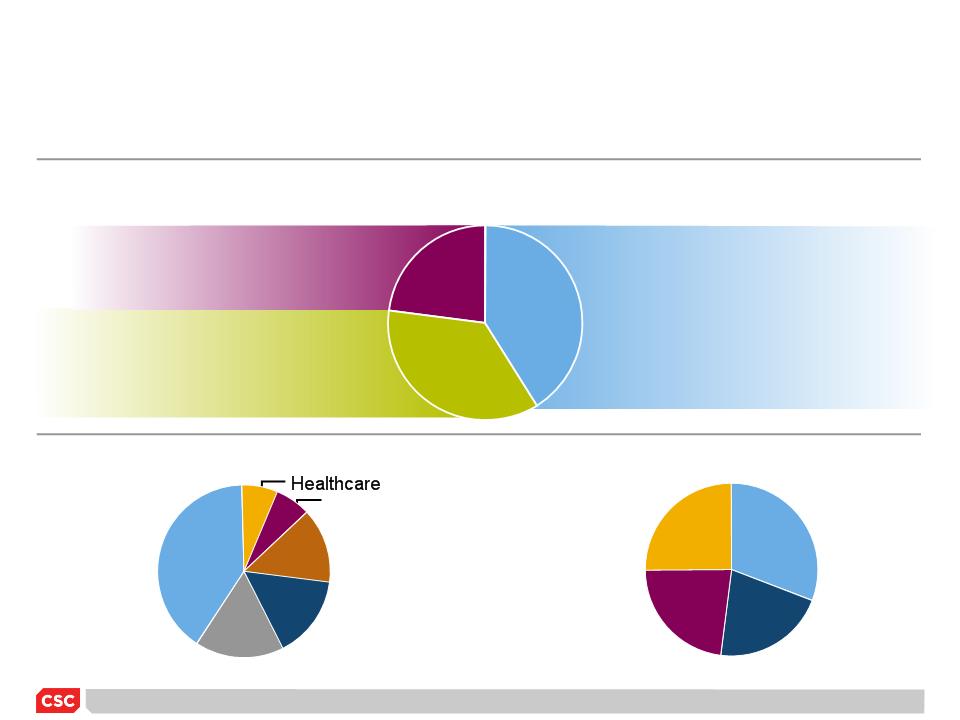
Commercial
$16.7B*
Revenue
Operating in Three
Lines of Business
25%
31%
23%
21%
Globally Balanced
Workforce
7%
6%
15%
17%
15%
40%
Across
Six Vertical Industry Groups
Public
Sector
Financial
Services
Manufacturing
Technology
and
Consumer
Consumer
Chemical, Energy
&
Natural
Resources
EMEA
Americas
Commercial
Commercial
Asia/Pacific
NPS
*Ended
FY09
41%
23%
36%
*
Growing
New Business Momentum
DOE
Hanford
TSA
ITIP
Positioned to
deliver growth as markets recover

*
Improved
Financial Performance
|
Solid
Financial Performance
|
Measure
|
FY08
|
FY09
|
FY10
Guidance |
|
ü Increased New
Business Bookings
|
TCV
|
$15.6B
|
$16.2B
|
$17 to
$18B
|
|
ü Held Revenue
through global crisis
|
Revenue
|
$16.5B
|
$16.7B
|
$16.0 -
$16.5B
|
|
ü Improved
Margin performance
|
OI
Margin
|
7.98%
|
8.25%
|
8.5% -
8.75%
|
|
ü Grew EPS
faster than Revenue
|
EPS
|
$3.20
|
$4.07*
|
$4.80 -
$5.00
|
|
ü Improved Cash
Performance
|
Cash (NI
%)
|
32%
|
92%
|
90% -
100%
|
Positioned to
deliver sustainable, profitable growth as markets recover
*Non-GAAP EPS
normalized for IRS tax settlement benefit and goodwill impairment
charge
*
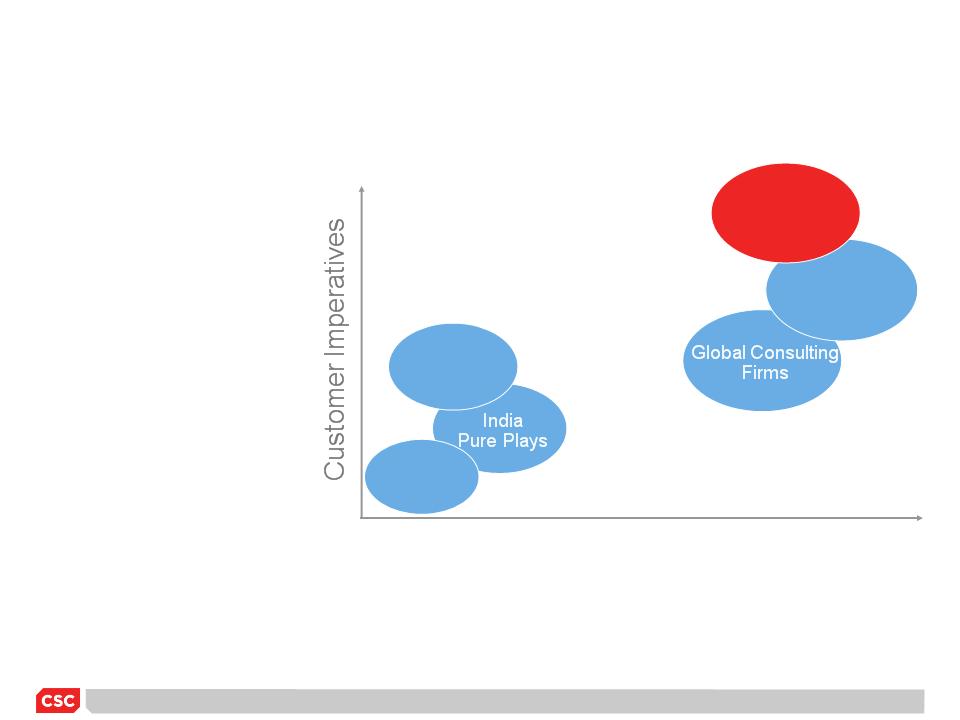
Global
Product
Companies
Companies
CSC
Local
Providers
Providers
Regional
Providers
Providers
Market
Dynamics: We Like Our Competitive Market Position
Global
Scale and Reach
• Full-service
offerings
• Mission-critical
delivery
• Product
independent
• Extensive
partner
ecosystem
ecosystem
• Locally intimate —
globally leveraged
• Delivery to the
world from around the world
• Global
cross-fertilization between public sector and
commercial businesses
commercial businesses
*
CSC’s
Strategic Directions

*
Major
Market Trends Provide Opportunities for Growth
Solutions to Cut Costs, Improve Efficiency, and Ensure Sustainability
Solutions to Cut Costs, Improve Efficiency, and Ensure Sustainability
Cybersecurity
and
Identity Management
Identity Management
Critical
Infrastructure Improvement
(Transportation, Utilities, Smart Grids)
(Transportation, Utilities, Smart Grids)
Health
IT Solutions for Commercial and
Government Reform Initiatives
Government Reform Initiatives
IT
Infrastructure Evolution
(Remote, Virtual, Mobile, Cloud)
(Remote, Virtual, Mobile, Cloud)
Sourcing
Solutions That Conserve Cash
and Drive Profitability Improvement
and Drive Profitability Improvement
Solutions
to Help Address
Regulatory Compliance
Regulatory Compliance
Industry
Relevance
Relevance
*
Organic
Revenue Growth and Operating Margin Goals
|
$19
- $21B
|
Annual
Revenue Growth
|
Operating
Margin Goals
|
|
BSS
|
7% - 10%
annual growth
|
Mid-teens
|
|
NPS
|
6% - 8% annual
growth
|
High single
digit
|
|
MSS
|
5% - 7% annual
growth
|
Low double
digit
|
|
FY13
|
6% - 8% annual
growth
|
≥
10%
|
NPS
MSS
BSS
FY10
$16.0
- $16.5B*
Project 6% -
8% organic revenue growth (CAGR) and low double-digit operating
margins
*FY10
guidance

*
Summary
• Excellent market
position
• Elevated financial
performance
• Positioned for
top-line growth
• Focused strategic
direction
• Creating shareholder
value
Solid case for
investment

*
|
Revenue
|
6% - 8% CAGR,
organic
2% - 3% additional from acquisition |
|
Margin
|
25 - 50 BPS
improvement, YoY
|
|
EPS
|
Growth at a
rate in excess of revenue
|
|
FCF
|
In line with
EPS growth and
In excess of
90% of Net Income
|
Investment
Case
• CSC is an
attractive, undervalued stock for investors seeking
– Fortune 200 company
with investment grade credit
– Leading technology
in all aspects of the IT services sector
– An expansive global
footprint across both public sector and
commercial markets
commercial markets
– A marquee set of
commercial and public sector clients who
provide long-term revenues and cash flows
provide long-term revenues and cash flows
• Three-Year Financial
Performance Objectives

*
Financial
Performance
Performance
Mike
Mancuso
Chief
Financial Officer
November 18,
2009
CSC
INVESTOR CONFERENCE

*
The
Past…
Financial
Accomplishments
Accomplishments
*

*
History
of Solid Performance
Most Recent 3 Years
Most Recent 3 Years
|
|
FY07
|
FY08
|
FY09
|
Improvement
|
|
Revenue
|
$14.9B
|
$16.5B
|
$16.7B
|
6%
CAGR
|
|
OI
Margin
|
8%
|
8%
|
8.3%
|
30
bps
|
|
EPS
|
$2.21
|
$3.20
|
$4.071
|
36%
CAGR
|
|
DSO
|
94
|
90
|
84
|
10-day
improvement
|
|
FCF2
|
$672M
|
$175M
|
$1,021M
|
Reached 90% of
NI
|
1 Non-GAAP EPS accounts
for net favorable tax audit settlements and a goodwill impairment
charge
2 Free Cash Flow is a
non-GAAP measure
*
The
Present…
Solid
Financial
Performance
Performance
*
*
*Non-GAAP EPS
accounts for net favorable tax audit settlements and a goodwill impairment
charge
FY
2010 ― YTD Solid Financial Performance
|
|
1st
Half
FY10 Actual |
FY10
Guidance |
FY09
Actual |
|
Bookings
|
$8.1B
|
$17 -
$18B
|
$16.2B
|
|
Revenue
|
$7.9B
|
$16 -
$16.5B
|
$16.7B
|
|
Margin
|
7.6%
|
8.5% -
8.8%
|
8.3%
|
|
EPS
|
$2.26
|
$4.80 -
$5.00
|
$4.07*
|
|
FCF
|
$(33)M
|
90% - 100% of
NI
|
$1,021M
|
*
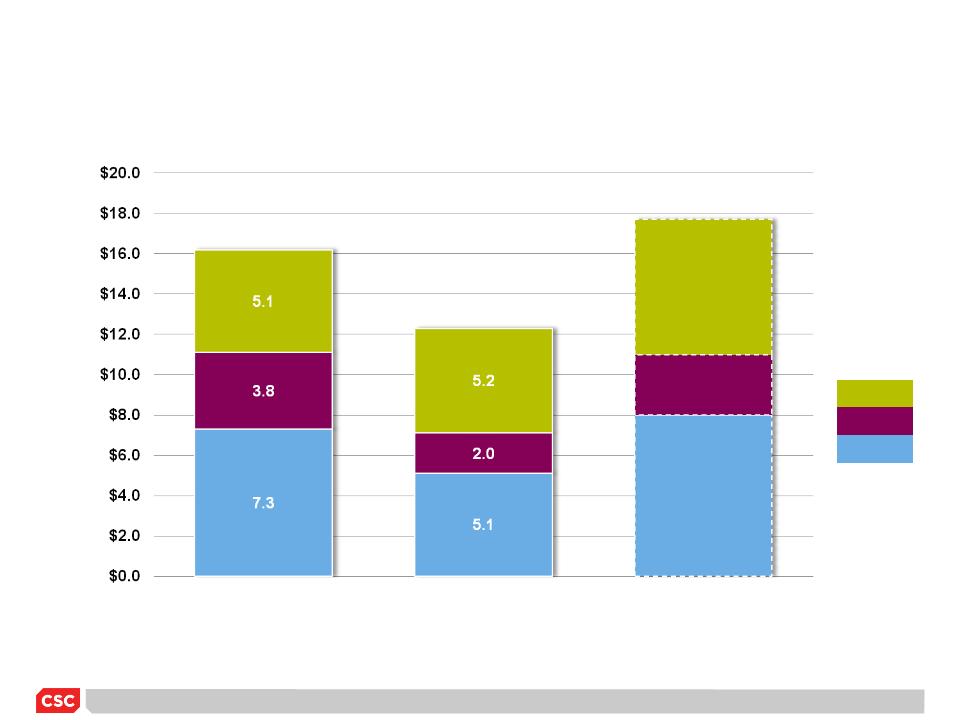
New
Business Bookings Comparison
TCV
($B)
($B)
|
MSS
|
|
BSS
|
|
NPS
|
$17
- $18
FY09
FY10
Guidance
Guidance
$12.3*
$16.2
YTD
November
FY10
*Includes Zurich
Financial Services: down-selected for negotiations
*
The
Future…
Positioned
for Growth
for Growth
*
*
Financial
Performance Plan
Three-Year Planning Period FY11 - FY13
Three-Year Planning Period FY11 - FY13
Deliver
top-line
growth
6% - 8%
(excluding
acquisitions)
growth
6% - 8%
(excluding
acquisitions)
Achieve
10% OI margin
by FY13
(25 - 50 bps
improvement
annually)
10% OI margin
by FY13
(25 - 50 bps
improvement
annually)
Grow
EPS at a
rate in excess
of top-line
growth
rate in excess
of top-line
growth
Sustain
cash
performance at
> 90% of
net income
performance at
> 90% of
net income

*
NPS
Targeted
Revenue Growth
|
$19
- $21B
|
FY11
- FY13
|
Strategic
Growth Vectors
|
|
BSS
|
7% -
10%
|
• Healthcare
reform
• Regulatory
compliance
• Information
security/management
|
|
NPS
|
6% -
8%
|
• Cybersecurity
• Healthcare
reform
• International
public sector
|
|
MSS
|
5% -
7%
|
• Applications
management
• Cybersecurity
• Virtualization
• Trusted Cloud
Computing
|
|
CSC
FY13
|
|
|
Today
$16
- $16.5B*
Positioned to
deliver growth as markets recover
*FY10
guidance
BSS
MSS
*
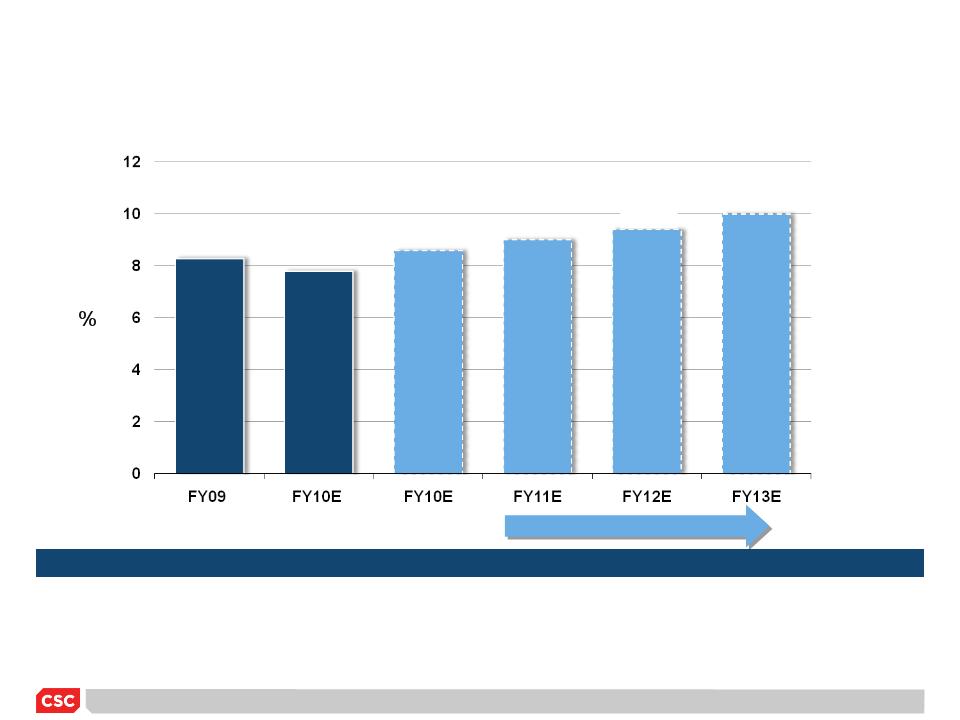
Operating
Income Margin
(25 - 50 bps Improvement Annually)
(25 - 50 bps Improvement Annually)
8.3%
8.6%1
7.6%
Actual
YTD
9.1%
10.1%
9.6%
|
Major
Margin Drivers
|
|
|
• Benefit cost
containment
|
• Work migration
to lower cost centers
|
|
• Lower
depreciation/amortization
|
• Continuous
improved execution
|
|
• Healthier
client base
|
• Portfolio
mix
|
High
End of Guidance
1FY10E margin represents
mid-point of guidance
*
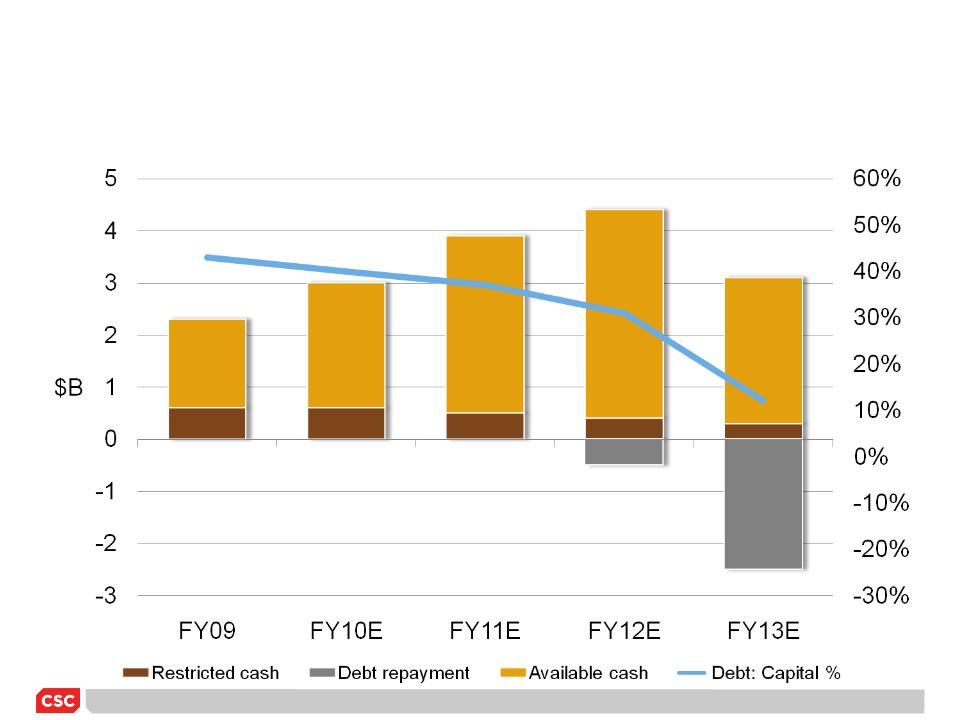
Cash
Profile
*
90%
- 100% of
Net
Income
91.5%
Free
Cash Flow
Cash
Flow Drivers
• Lower
pension
contributions
contributions
• Reduced
capital
expenditures
expenditures
• DSO
improvements
FY10
Guidance
Guidance
>
90% of NI
FY09
Actual
CSC
FY13E
*
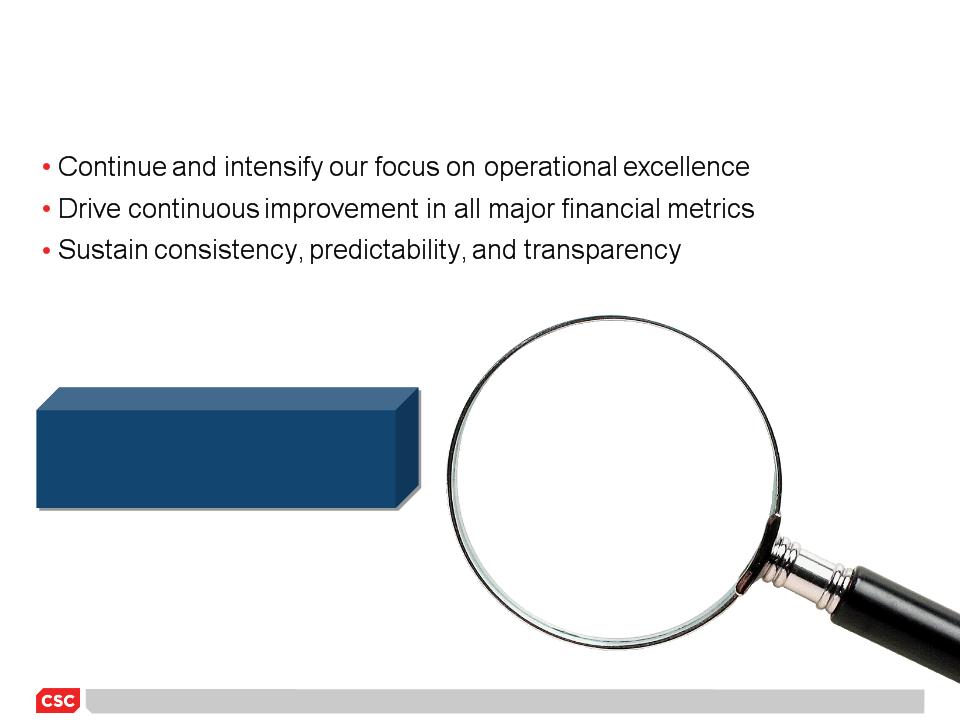
For
Our Stakeholders, We Will…
lence
Excel
Improve
shareholder
value
value

*
Supplemental
Information
Information
CSC
INVESTOR CONFERENCE

*
Non-GAAP
Measures and Other Definitions
• Operating
Cost: Equal to the sum of
(1) cost of services, (2) business units
SG&A, (3) depreciation and amortization
SG&A, (3) depreciation and amortization
• Operating
Income: Revenue minus
operating cost
• Operating
Income Margin: Operating Income as
a percentage of revenue
• DSO:
Total
receivables at quarter end divided by revenue per day. Revenue per
day equals total revenues for the last quarter divided by the number of days in the
fiscal quarter. Total receivables includes unbilled receivables but excludes tax
receivables
day equals total revenues for the last quarter divided by the number of days in the
fiscal quarter. Total receivables includes unbilled receivables but excludes tax
receivables
• Free
Cash Flow: Equal to the sum of
(1) operating cash flows, (2) investing cash
flows, excluding business acquisitions and dispositions, purchase, or sale of
available for sale securities, and (3) capital lease payments
flows, excluding business acquisitions and dispositions, purchase, or sale of
available for sale securities, and (3) capital lease payments

*
Non-GAAP
Reconciliation
|
$M
(Except per
share amounts)
|
FY09
|
FY08
|
|
Total
revenue
|
$16,740
|
$16,500
|
|
Operating
income (OI)
|
$ 1,382
|
$ 1,316
|
|
OI
margin
|
8.25%
|
7.98%
|
|
Goodwill
impairment
|
($19)
|
-
|
|
Other
(income)/expense
|
$23
|
($
48)
|
|
Special
items
|
-
|
($156)
|
|
Tax
rate
|
(17.5)%
|
40.7%
|
|
GAAP
EPS
|
$7.31
|
$3.20
|
|
Tax
benefit/goodwill
|
(3.24)
|
-
|
|
Special
items
|
|
.64
|
|
Non-GAAP
EPS
|
$4.07
|
$3.84
|
*
Non-GAAP
Reconciliation (Cont’d)
|
$M
|
|
Fiscal
Year Ended
|
||
|
April
3, 2009
|
March
28, 2008
|
March
30, 2007
|
||
|
Operating
Income
|
|
$ 1,381.8
|
$ 1,316.4
|
$ 1,187.2
|
|
Minority
Interest Expense
|
|
(8.4)
|
(14.3)
|
(14.8)
|
|
Equity
Earnings
|
|
15.4
|
12.7
|
13.1
|
|
Corporate
G&A
|
|
(177.9)
|
(141.2)
|
(136.0)
|
|
Interest
Expense
|
|
(260.5)
|
(185.4)
|
(217.9)
|
|
Interest
Income
|
|
41.0
|
37.1
|
49.5
|
|
Special
Items
|
|
-
|
(155.8)
|
(316.1)
|
|
Goodwill
Impairment
|
|
(18.9)
|
-
|
-
|
|
Other
(Expense)/Income
|
|
(23.4)
|
48.4
|
41.3
|
|
Income Before
Taxes
|
|
949.1
|
917.9
|
606.3
|
|
Tax (Benefit)
/ Expense on Income
|
|
(166.1)
|
373.3
|
209.0
|
|
Net
Income
|
|
$ 1,115.2
|
$ 544.6
|
$ 397.3
|
|
Operating
Income Margin
|
|
8.25%
|
7.98%
|
7.99%
|
*
Non-GAAP
Reconciliation (Cont’d)
1) Unaudited financial
results
2) Audited financial
results
3) Capital lease
payments and proceeds from the sale of property and equipment
(included in investing activities) are included in the calculation of free cash flow.
(included in investing activities) are included in the calculation of free cash flow.
|
$M
|
Six
Months
Ended1 |
Fiscal Year
Ended2
|
||
|
October
2,
2009
|
April
3,
2009
|
March
28,
2008
|
March
30,
2007
|
|
|
Free Cash
Flow
|
(33)
|
1,020.6
|
175.2
|
671.5
|
|
Net Cash Used
in Investing Activities
|
286
|
1,038.0
|
2,718.7
|
872.7
|
|
Proceeds from
preferred stock
redemption |
|
|
|
126.5
|
|
Acquisitions,
Net of Cash Acquired
|
(5)
|
(100.3)
|
(1,591.1)
|
(134.3)
|
|
Business
dispositions
|
12
|
|
|
2.8
|
|
Capital Lease
Payments3
|
15
|
28.1
|
40.1
|
39.4
|
|
Net Cash
Provided by Operating
Activities |
$
275
|
$
1,986.4
|
$1,342.9
|
$1,578.6
|

*
Thank
You
CSC
INVESTOR CONFERENCE