Attached files
| file | filename |
|---|---|
| 8-K - LINCOLN NATIONAL CORPORATION FORM 8-K - LINCOLN NATIONAL CORP | lincoln8k.htm |
Exhibit 99.1

Dennis
R. Glass
President and Chief
Executive Officer
Lincoln
Financial Group
©2009 Lincoln
National Corporation
2009
Conference for
Investors and Bankers
Investors and Bankers
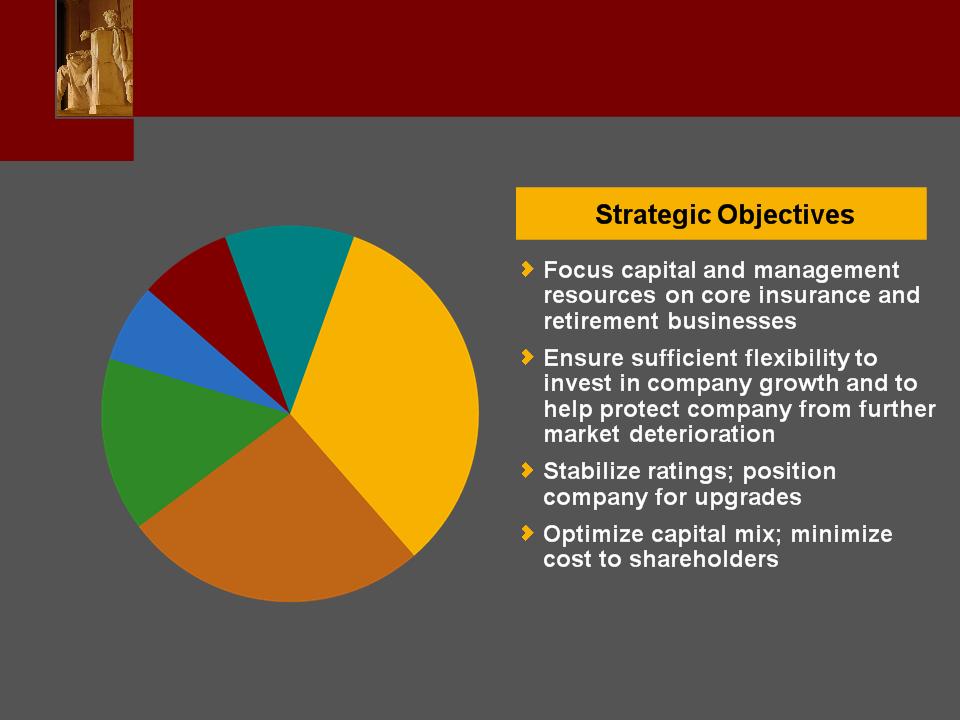
Strategic
Overview
2
Equity
and
Debt
$1,190
Capital
Purchase
Program
$950
Dividend,
Expense
Cuts $650
Cuts $650
LNUK
$300
Reinsurance
$240
Delaware
Investments
Investments
$400
Actions
Taken Over Past 12 Months to Focus on
Core Businesses and Support Franchise
Core Businesses and Support Franchise

3
Despite
the weakened macro-
economy, demand characteristics for
Lincoln products are strong
economy, demand characteristics for
Lincoln products are strong
Increased
risk aversion and consumer
demand for guarantees and advice
demand for guarantees and advice
Continued
shift in consumer
demographics toward retirees
demographics toward retirees
Rising
taxes at both the state and
federal levels
federal levels
DC,
individual
annuities,
individual life,
and Group
Protection
will likely
experience
tailwinds from
consumer
trends
individual
annuities,
individual life,
and Group
Protection
will likely
experience
tailwinds from
consumer
trends
Source:
McKinsey Consumer Financial Health Survey (March 2009); 2009 Retirement Consumer
Survey
Considerable
Tailwinds from Consumer Trends
Post-Crisis and Demographics
Post-Crisis and Demographics

4
Individual
Life
Variable
Annuity
Group
large case
Top
20+ player
No
participation
Top
10 player
Top
11-20 player
Fixed
Annuity
Based
on sales rankings from
industry sources1 (data compiled
by McKinsey & Co.)
industry sources1 (data compiled
by McKinsey & Co.)
Asset
Management
Group
<500 lives2
DC
401(k)
DC
403(b)
Competitors
1 Metrics
used to calculate rankings: Individual Life - New Sales; VA/FA - Sales; Group -
Premiums; DC / Asset management - Total AUM
2
Approximates; actual rankings are not available for <500 lives
Source:
Pensions and Investments, Plan Sponsors, Limra, Institutional Investor, AM Best,
Conning, Bloomberg
LNC
C
D
A
B
E
H
F
G
I
Lincoln
One of Four Competitors with
Significant Market Position in Core Businesses
Significant Market Position in Core Businesses

5
Lincoln’s
share of volume and ranking for key strategic partners
Variable
Annuities
Share
of
partner volume
partner volume
(Percent)
Rank
within
partner
partner
Major
Wire / Bank
Major
Wire / Bank
10
Major
Wire / Bank
Top
MGA
Top
MGA
Top
MGA
Top
Regional
Top
Independent BD
Top
Independent BD
Major
Wire / Bank
33
23
26
30
14
15
25
4
3
4
4
1
5
7
1
1
2
3
2
1
2
Strategic
partner
partner
Life
(incl. MoneyGuard1)
1 MoneyGuard
is included as normalized sales in share of LFD volume (15% of gross
premium)
Share
of
partner volume
partner volume
(Percent)
Rank
within
partner
partner
10
29
9
9
7
5
Top
Partner Status with Key Distribution Firms

6
Life
Insurance
Insurance
49%
Individual
Annuities
28%
Defined
Contribution
12%
Group
Protection
11%
1 Based on
LFG after-tax third quarter of 2009 YTD income from operations, excluding Other
Operations.
Earnings1
2010
Focus
Clearly
Focused on Four Core Insurance
and Retirement Businesses
and Retirement Businesses

Mark
Konen
President
Insurance Solutions
and
Retirement Solutions
Retirement Solutions
Will
Fuller
President
Lincoln
Financial Distributors
©2009 Lincoln
National Corporation
2009
Conference for
Investors and Bankers
Investors and Bankers
Life
Insurance and
Individual Annuities
Individual Annuities

2
Product
Innovation and
Responsiveness
Responsiveness
Securing
Financial Futures
Financial Futures
Operational
Effectiveness
Comprehensive
Risk Management
Risk Management
Distribution
Depth
and Breadth
and Breadth
Cornerstones
of Our Success

3
Scale
Fuels Market Leadership
Compelling
-
And
competitive products, along with a distribution
organization that is both a differentiator and a value
creator for Lincoln
organization that is both a differentiator and a value
creator for Lincoln
Comprehensive
-
Suite
of solutions and a multi-channel, multi-product
distribution model
distribution model
Consistent
-
Approach
to product development, risk management and
our deep distribution relationships and wholesaler
execution
our deep distribution relationships and wholesaler
execution

4
1 Source:
LIMRA, based on YTD sales as of June 30, 2009, except Life/LTC ranking which is
based on FY 2008 sales
2 As of
September 30, 2009
|
UL
|
#
1
|
Life-LTC
|
#
1
|
|
VUL
|
#
4
|
Term
|
#
16
|
Life
Insurance Overview
Leveraging
scale to drive value
#3
life insurance provider in 20091
$532
billion of life insurance in-force2
Multi-channel
distribution
Comprehensive
product suite1
Industry
leading underwriting
Consistent,
stable market presence year
after year
after year

5
1 Based on
YTD sales as of September 30, 2009, specialty represents COLI/BOLI
Key
Takeaways:
Driving
sales through multiple channels
Leveraging
presence in MGA to increase MoneyGuard sales
Lincoln
ranked top 1, 2 or 3 Life
carrier in many key distribution
firms
carrier in many key distribution
firms
Expanded
distribution
relationships
relationships
Increased
advisor base by 11%
Sales
by Channel1
2009
Channel Highlights
Leveraging
Scale and Footprint to Grow
Life Insurance Sales Across Key Partners
Life Insurance Sales Across Key Partners

6
Key
Takeaways:
Increasing
market share
Shift
to term life and lower face amount UL policies
Significant
increase in number of policies sold (UL +26%, Term +107%)3
COLI
/ BOLI
VUL
UL
Term
$415
$530
1 As of
September 30, 2009; 2 Source: LIMRA, based on YTD sales as of June 30, 2009; 3
YTD 3Q09 versus YTD 3Q08
2008
2009
YTD
Sales by Product1
($
in millions)
Market
Share2
Increasing
Market Share in a Changing
Sales Environment
Sales Environment

7
Secondary
Guarantee
UL Product Management
UL Product Management
Changing
competitive landscape
New
products earn 12 - 15% returns without
capital solution
capital solution
Pricing
and compensation changes
Focus
on less capital-intensive “cells”
Leverage
underwriting expertise
Manage
interest rate risk
Liability
structure Æ
long investment strategy
Pricing
assumes very low lapses

8
2005
2006
2007
2008
2009
YTD2
YTD2
MoneyGuard
Sales
(in
PAP, millions)
3Q08
YTD MoneyGuard Sales
1 Source:
LIMRA, based on sales
2 As of
September 30, 2009
MoneyGuard
Product
meets consumer preference for flexible
benefits solutions
benefits solutions
Simplified
story and product processes (fall 2006)
70%
market share in 20081
YTD
3Q 2009 sales up 18%
Product
and distribution
enhancements create
new opportunities
enhancements create
new opportunities

9
Life
Insurance
2010 Focus
2010 Focus
Maintain
product leadership
Build
on core distribution strength
Explore
opportunities with financial advisors
who do not currently sell life insurance
who do not currently sell life insurance

10
|
Variable
Annuities
|
# 7
|
|
Fixed
Annuities
|
#
13
|
|
Indexed
Annuities
|
# 4
|
1 Source:
MARC and LIMRA, based on YTD sales as of June 30, 2009
2 As of
September 30, 2009
Product
mix + continuity in the market = diversified risk
Individual
Annuities Overview
Leveraging
scale, traditionally conservative
approach to drive value
approach to drive value
#
5 overall annuity provider1
$72
billion in account values2
Multi-channel
distribution
Comprehensive
product suite1
Multiple
income solutions

11
1 Based on
YTD sales as of September 30, 2009, VA includes fixed portion
Key
Takeaways:
Leverage
distribution strength and product mix
Expand
distribution relationships
Increase
wholesaler productivity
Sales
by Channel1
Sales
by Product1
VA
Indexed
Fixed
Leveraging
Scale and Footprint to Grow
Annuity Sales Across Key Partners
Annuity Sales Across Key Partners

12
Key
Takeaways:
Increasing
wholesaler productivity
Broad
product portfolio to meet shifting demand
Distribution
relationships drive long-term value
1 Variable
includes fixed portion
Variable1
Indexed/Fixed
$7.9
YTD
Sales by Product
($
in billions)
YTD
Total Net Flows
($
in billions)
$9.4
Resilient
Business Model in a Changing
Sales Environment
Sales Environment
13
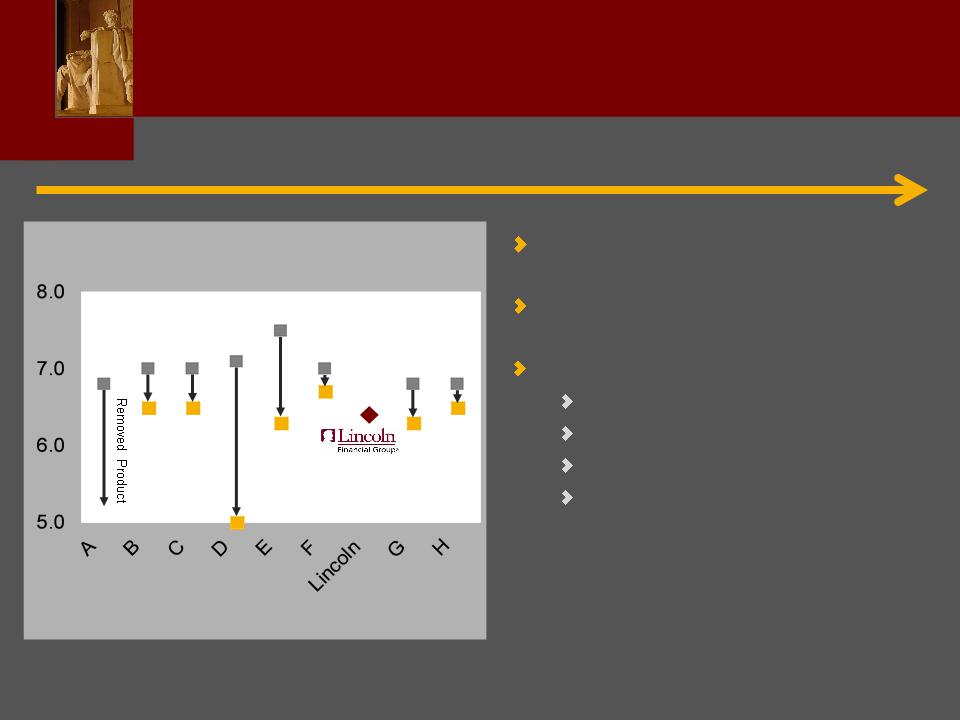
Move
toward more conservative products & guarantees
Lincoln
objective - be a consistent
market participant
market participant
Stayed
at conservative end of the
spectrum of guarantees
spectrum of guarantees
Product
Guarantees1, May
2008
1 Calculated
as initial withdrawal as a percentage of principal, buying at 60 and holding to
65
Source:
Variable Annuity Internal Competitive Intelligence
àOctober
2009
Recent
actions taken:
Tightened
investment restrictions
Increased
rider fees
Reduced
roll-up period
Removed
“double” from Lincoln
Lifetime Advantage
Lifetime Advantage
Industry
Redesign of VA Living Benefits

14
Writing
business consistently through market
cycles improves risk profile
cycles improves risk profile
Did
not add roll-up to GMWB until early 2008
No
significant change in policyholder behavior
during crisis
during crisis
Conservative
death benefit guarantees
Hedge
Program covers all VA guarantees
Assets
cover liabilities
|
9/30/09
GMWB Exposure (Net
Amount at Risk1/Account
Value)
|
|||||||
|
2003
|
2004
|
2005
|
2006
|
2007
|
2008
|
2009
|
Total
|
|
1.5%
|
5.3%
|
16.6%
|
21.6%
|
25.4%
|
8.1%
|
0.3%
|
11.6%
|
1 Net amount
at risk is calculated as the guaranteed amount minus account value, floored at
zero
Inforce
VA Risk Profile

15
VA
FA
Combined
1Q
09
VA
FA
Combined
2Q
09
VA
FA
Combined
3Q
09
1 Represents
un-levered returns based on pricing assumptions and capital markets conditions
during the quarter
New
Business Profitability
Strong
Indexed/Fixed returns in early 2009 help
balance VA returns
balance VA returns
VA
product changes (removing “double”) would
push Q3 VA return to 15%
push Q3 VA return to 15%
Reduced
“tail” risk on new GMWB design

16
Individual
Annuities
2010 Focus
2010 Focus
Maintain
product leadership
Build
on core distribution strengths
Simplify
and enhance advisor experience
Explore
new opportunities for annuities

Bob
Dineen
President and Chief
Executive Officer
Lincoln
Financial Network
©2009 Lincoln
National Corporation
2009
Conference for
Investors and Bankers
Investors and Bankers
The
Retail Model &
Consumer Behavior
Consumer Behavior

2
Lincoln
Financial Network Overview
LFN
Positioned for Growth
Investment
in Recruiting Platform
Trend
in the Industry towards Independence
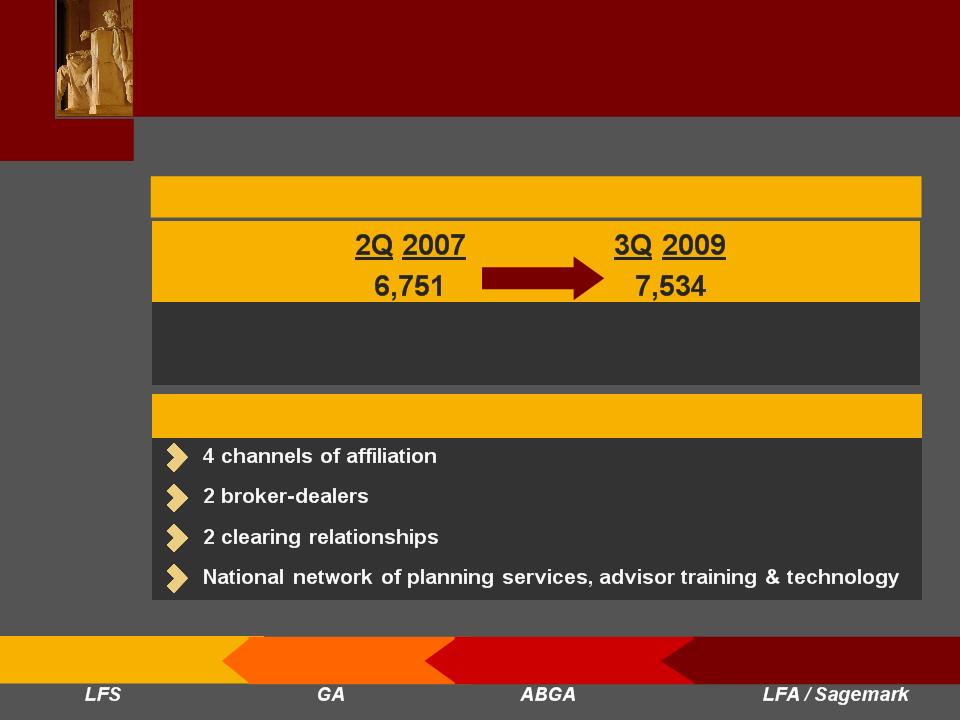
3
|
2007:
First year of new national recruiting effort
|
|
Successfully
recruiting experienced, productive
advisors
|
Independent
Full
Service Support
|
A
National Support Network for Advisors and their Clients
|
Growth
of Advisor Population
LFN
Offers a Unique Value Proposition
For Planners and Producers
For Planners and Producers

4
* Defined
as distribution revenues, less producer compensation and fully allocated
expenses
** Reflects
LFN percentage of total LFG production, YTD as of September 30,
2009
LFN
Internal P&L*
26%
life insurance PAP**
~$100
million
~50%
in-force life
insurance block
insurance block
11%
annuity deposits**
~$1
billion
Bottom
Line Operating Results and
Significant Contributions to the Corporation
Significant Contributions to the Corporation

5
|
Pre-Crisis
February 2008 |
Post-Crisis
April 2009 |
|
20%
of
retirees say that they
are less financially secure than they thought they would be* |
49%
of
retirees say that they
are less financially secure than they thought they would be* |
|
53%
of
retirees are risk-
averse* (call themselves extremely or somewhat conservative) |
70%
of
retirees are risk-
averse* (call themselves extremely or somewhat conservative) |
Post-crisis,
72% of pre-retirees
are concerned about
taxes in retirement**
taxes in retirement**
* Society of
Actuaries, LIMRA, InFRE study: What a Difference a Year Makes, April 2009 **
McKinsey Consumer Financial Health Survey, March, 2009
Consumer
Sentiment Shift Post-Crisis…

6
* U.S. Census
Bureau
The
Need for Advice
Opportunity for Lincoln and the Industry
Opportunity for Lincoln and the Industry
Of
79 million baby boomers …
…
only 20% have a clear plan for their retirement*
Consumers
are more risk-averse
$3
trillion “on the sidelines” in minimal interest accounts
Implications:
muted recovery plus low interest rates will
suppress individual wealth building
suppress individual wealth building
Advisors
can build trust in this environment by
understanding new desire for downside protection and
income guarantees
understanding new desire for downside protection and
income guarantees
Taxes
are expected to become more of a top-of-
mind issue as marginal tax rates increase and
Congress pursues estate tax legislation
mind issue as marginal tax rates increase and
Congress pursues estate tax legislation

Will
Fuller
President and Chief
Executive Officer
Lincoln
Financial Distributors
©2009 Lincoln
National Corporation
2009
Conference for
Investors and Bankers
Investors and Bankers
Executing and
Evolving
the LFD Model
the LFD Model
8
Goal
is to Build on LFD’s Strengths and Position in
the Industry to Increase Our Contribution to Lincoln
the Industry to Increase Our Contribution to Lincoln
Annuities 288
Life
Insurance 223
Defined
Contribution 44
LFD
Sales Force

9
Client
needs
and preferences
and preferences
Distribution
partnerships
partnerships
Execution
ACT
III
Execute
in the
Current
Environment
Current
Environment
Adjust
to
Market
Realities
Market
Realities
Align
to enterprise
structure
structure
Contain
/ reduce
expenses
expenses
Right-size
sales force
for market opportunity
for market opportunity
Align
sales structure
with consumer
demand
with consumer
demand
Protect
and strengthen distribution
relationships
relationships
26
new or expanded distribution
relationships
relationships
Base
of active advisors up 6%
Achieve
Sales Targets
Gross
sales
Diverse
mix of sales
Net
flows
Focus
on wholesaler productivity
discipline
discipline
Focus
on talent retention and
recruiting
recruiting
2009
was a Transitional Year - Focused on
Executing Through the Financial Crisis
Executing Through the Financial Crisis
ACT
I
ACT
II
10
Grow
Sales in core products
Annuities
Life
Insurance
Defined
Contribution
Pursue
natural cross-sell
synergies
synergies
Increase
wholesaler
productivity
productivity
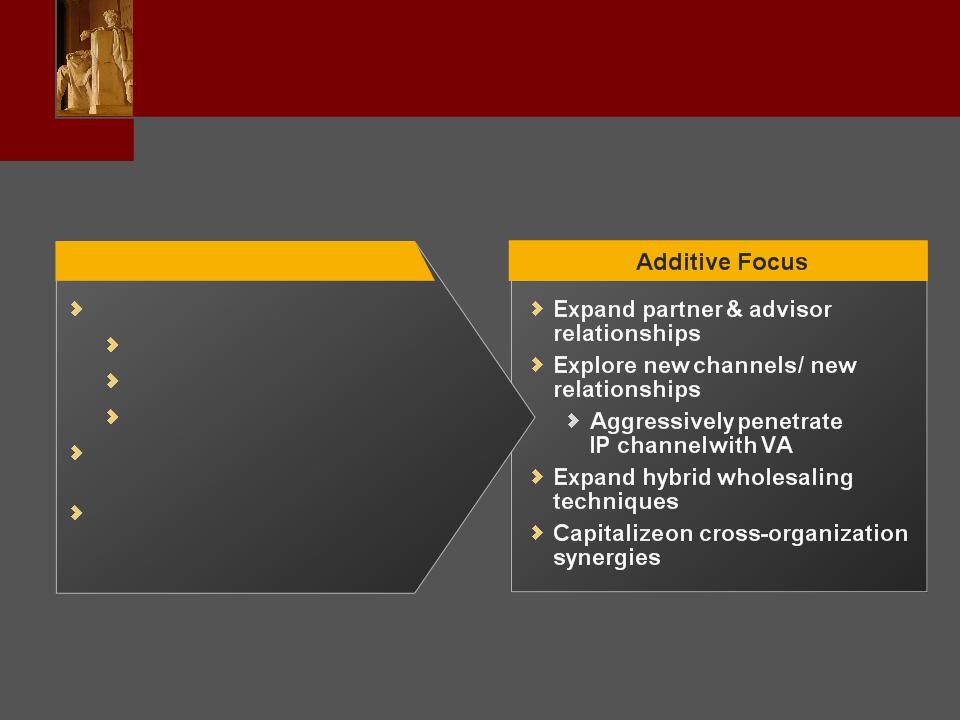
Core
Focus
Drive
Execution and Growth: Focus on
Core Strengths and Additive Opportunities
Core Strengths and Additive Opportunities
11
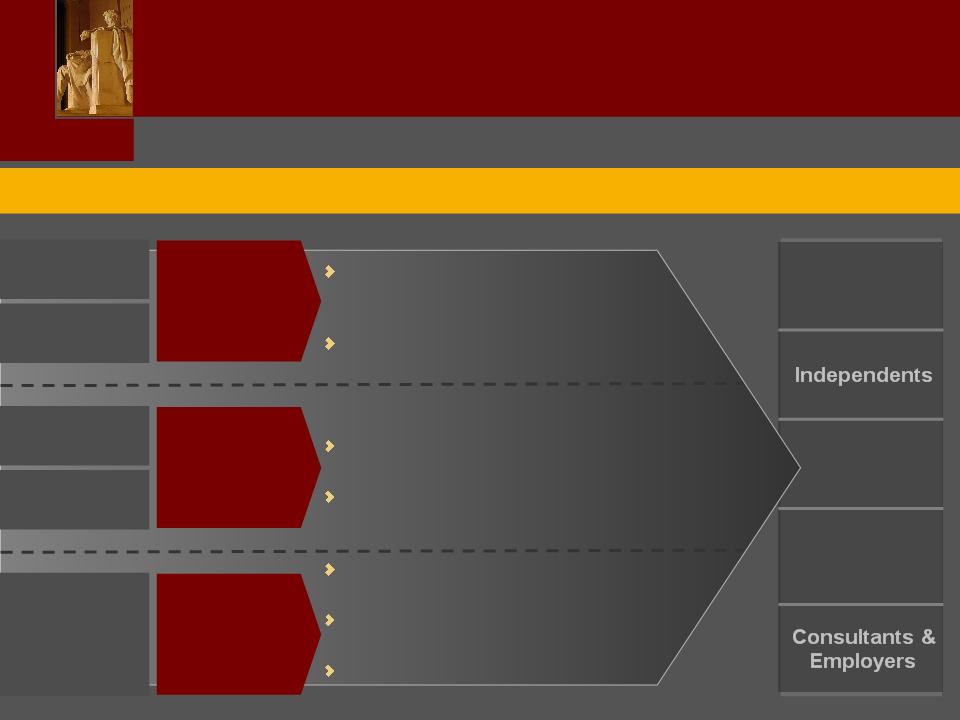
|
Financial
Institutions |
|
General
Agents |
|
Lincoln
Financial Network |
Preeminent
Execution
Focus
What
We Will Do
To
Benefit Our Clients
Driving
Growth and Profitability in 2010 and Beyond
with A Client Centric Approach to Distribution
with A Client Centric Approach to Distribution
Establish
a “360°view” of
distribution relationships with
shared goals
distribution relationships with
shared goals
Improve
client experience with formalized
“Voice of the Customer” process
“Voice of the Customer” process
Implement
firm-wide core skills &
productivity initiative
productivity initiative
Recruit
& retain THE BEST industry talent
Continue
to drive a diverse mix
of business
of business
Leverage
cross-organization synergies
and promote cross-product sales
and promote cross-product sales
Maintain
fiscal discipline
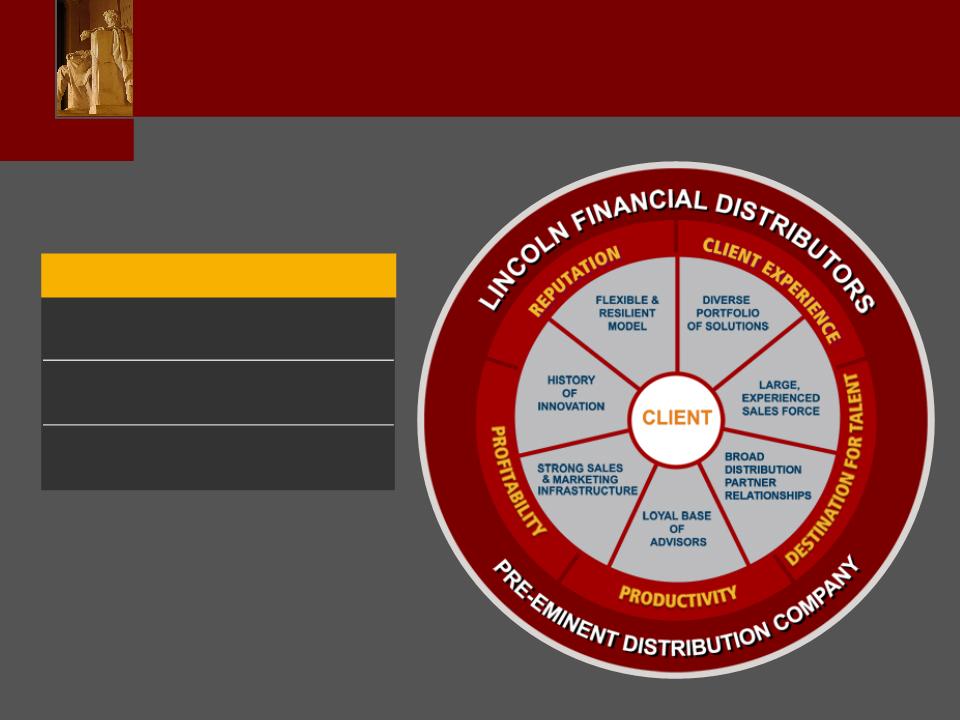
Essential
Partner
Program
Partner
Program
Client
Experience
Experience
Reputation
Sales
Force
Productivity
Productivity
Productivity
Talent
Maximize
Distribution
Value to LFG
Distribution
Value to LFG
Profitability

©2009 Lincoln
National Corporation
Mark
Konen
President
Insurance Solutions
and
Retirement Solutions
Retirement Solutions
2009
Conference for
Investors and Bankers
Investors and Bankers
Defined
Contribution and
Group Protection
Group Protection

2
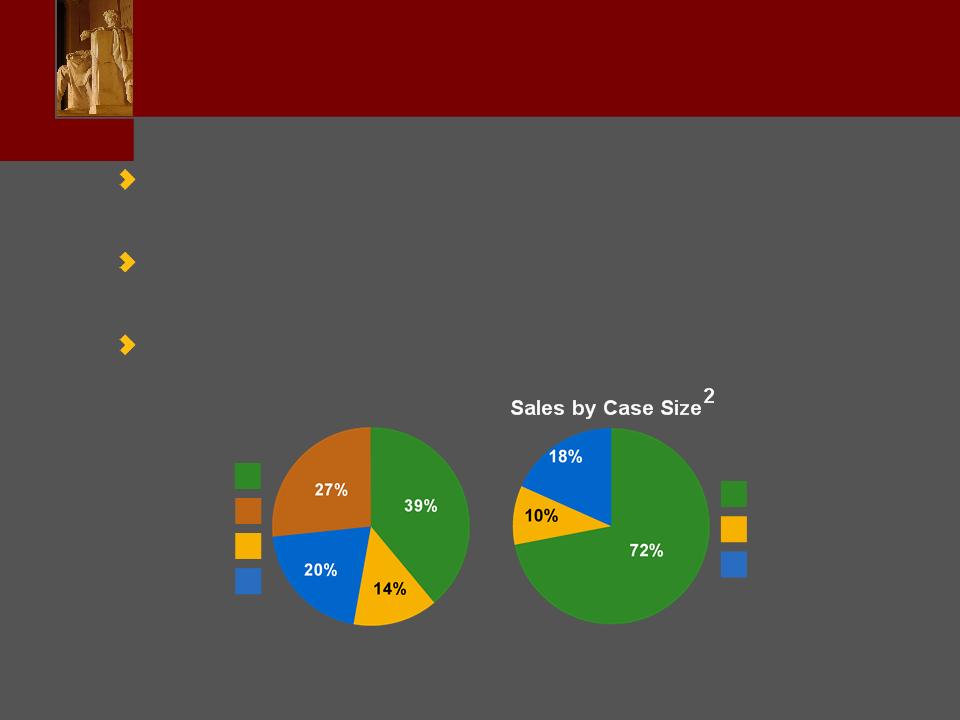
Small
Case Market
(Director
Program)
Large
Case Market
(Alliance
Program)
Multi-Fund
and
Other
Sales3
AUM3
1 Source:
LIMRA, as of June 30, 2009
2 Source:
LIMRA, YTD as of June 30, 2009
3 YTD as of
September 30, 2009
$3.8
billion
$34.3
billion
Defined
Contribution Overview
Focus
on 403(b) consolidation
#6
in 403(b) plan assets1
Top
3 in Healthcare and top 10 in K-12, based on
contributions2
contributions2
Focus
401(k) efforts on top strategic partners
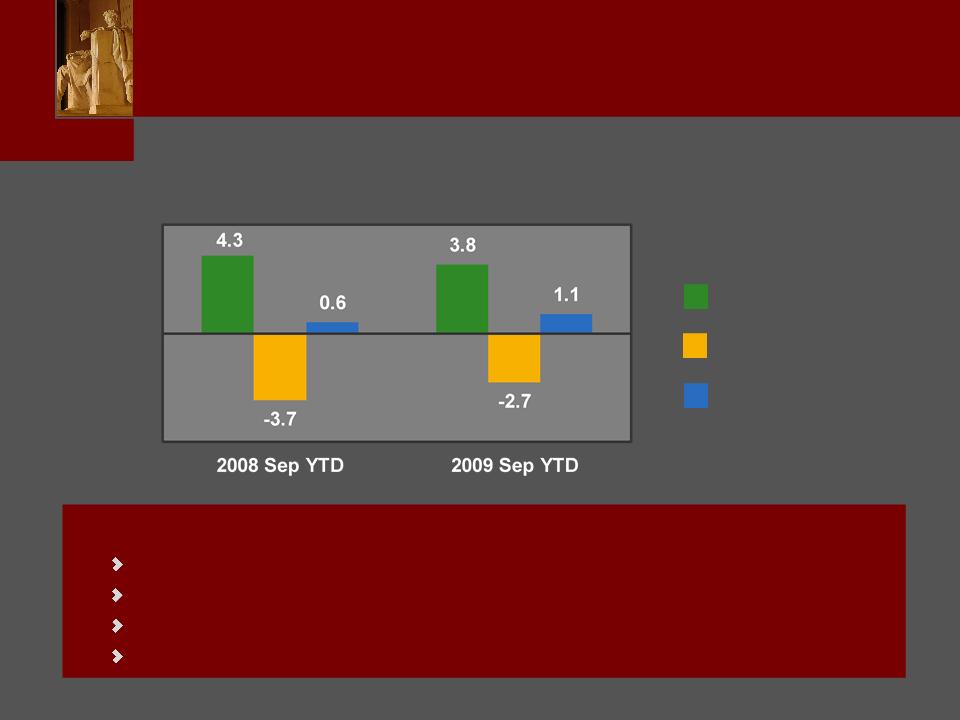
3
Deposits
Outflows
Net
Flows
Production
Results
($ billions)
($ billions)
Key
Takeaways:
Market
“frozen” throughout much of 2009
Solid
production despite economic pressures
Improved
lapse experience driving increase in net flows
Total
DC participants up 5% over last year
Defined
Contribution
Increasing Net Flows
Increasing Net Flows

4
|
|
Mid-Large
403(b)
and Corporate |
Micro-Small
401(k)
|
|
Distribution
Force
|
Plan
Sponsor-Focused
10
external and
6 internal wholesalers 21
account
executives Participant
Focused
300
Retirement
Consultants and Advisors |
16
external and
8 internal wholesalers Leverage
LFD
strategic relationships |
|
Participants
|
1.2
million
|
0.2
million
|
|
AUM1
|
$28.5
billion
|
$5.8
billion
|
1 As of
September 30, 2009
Defined
Contribution
Distribution Depth and Breadth
Distribution Depth and Breadth

5
2010
Focus - Leveraging Participant
Relationships
Relationships
Untapped
Opportunity
Over
a million DC participants
Need
for retirement planning guidance
Maximize
participant lifecycle with Lincoln
Differentiated
service models depending on
client needs
client needs
High-Touch
model with Retirement Consultants and
Advisors
Advisors
Efficient-Touch
model with Phone Team and Web

6
2010
Focus - Continued
Strengthen
core service offering
Attract
new assets and maintain existing plans
Key
investments
UNIFIER
enhancements
Website
upgrades
Focus
on key Strategic Partners and TPAs in
small 401(k) space
small 401(k) space
Leverage
LFD relationships
Increase
wholesaler productivity
7
Less
than 500 Lives
501-1000
Lives
1000+
Lives
Sales
by Product2
Short-Term
Disability
Dental
Group
Life/AD&D
Long-Term
Disability
1 Source:
LIMRA, YTD as of June 30, 2009
2 Based on
YTD annualized sales as of September 30, 2009
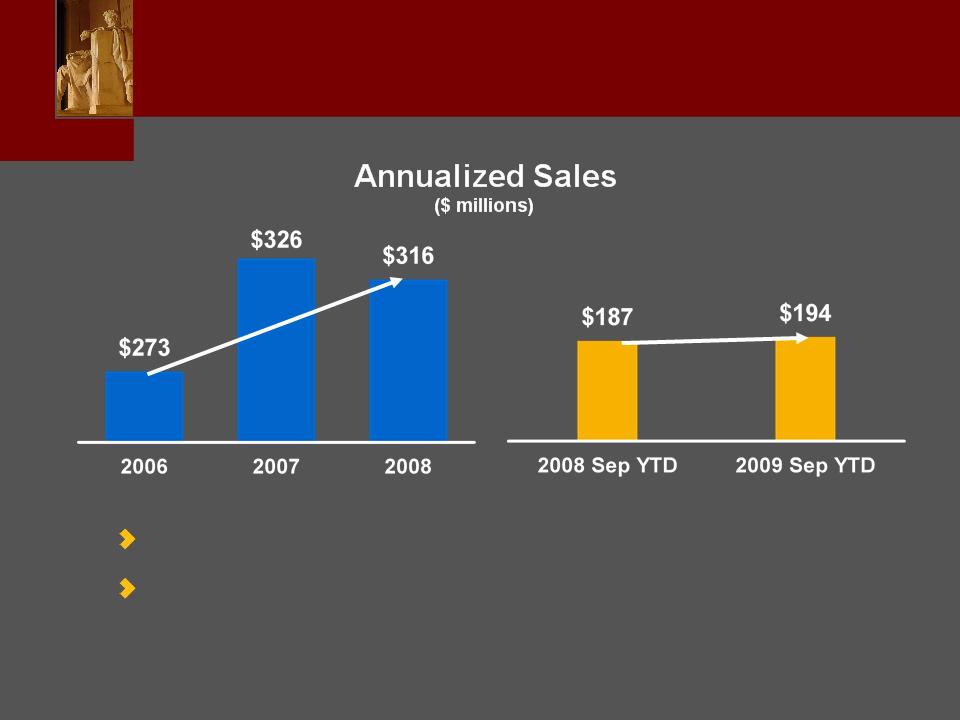
$194
million
Group
Protection Overview
Leveraging
service expertise and distribution
strengths in core market of under 500 lives
strengths in core market of under 500 lives
#3
Group LTD and #7 Life carrier by new
contracts issued1
contracts issued1
Voluntary
sales ~38% of total new sales2

8
1 As of
September 30, 2009
2 YTD as of
September 30, 2009 compared to YTD September 30, 2008
Group
Protection
Distribution Depth and Breadth
Distribution Depth and Breadth
Distribution
model
2
Regional VP’s
12
Regional Directors
122
sales reps (wholesalers)1
Focus
on rep productivity
Number
of reps down slightly from 2008
Cautious
due to economic environment
Upgraded
talent
Rep
productivity up 7% versus last year2
Poised
for growth
9
8%
CAGR
Gaining
momentum with a strong pipeline
Year-over-year
third quarter 2009 sales up 17%
+4%
Group
Protection
Sales Growth
Sales Growth
10
Net
Earned Premium
Solid
growth in spite of difficult environment
Case
lapses consistent with recent history
Unemployment
and wage actions depressing
inforce premium growth
inforce premium growth
11%
CAGR
+5%
Group
Protection
Non-Medical Premium Growth
Non-Medical Premium Growth
11
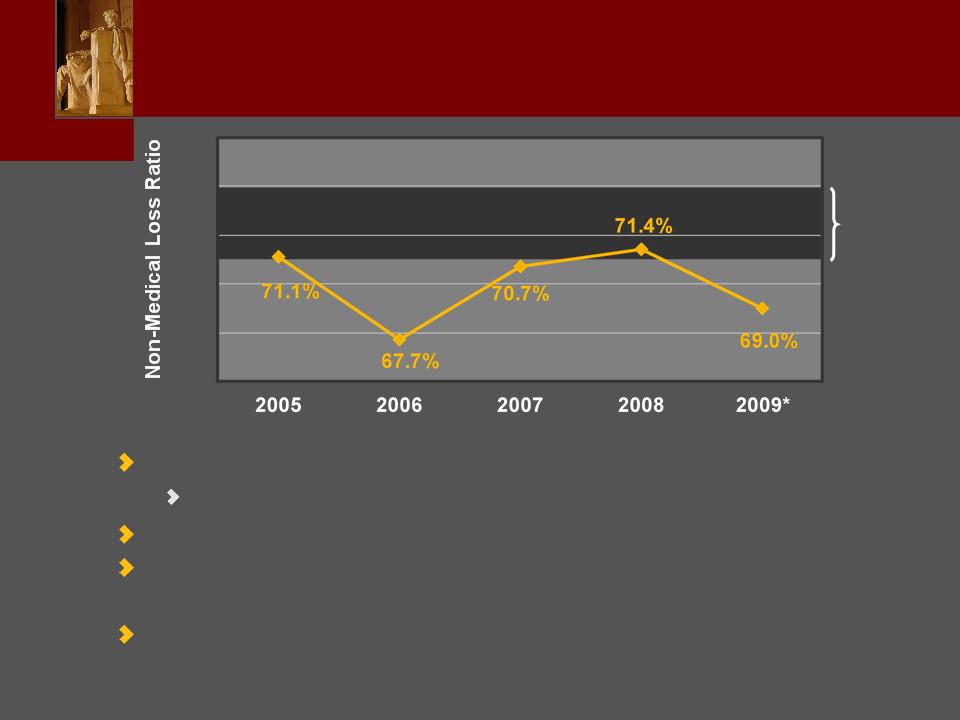
74%
71%
68%
Historic
Guidance
Guidance
Actual
Consistently
strong loss ratios over several years
Disciplined
risk selection and claims management expertise
Recent
disability loss ratios extremely good
Expect
near-term loss ratios to continue to trend
favorably to historic guidance
favorably to historic guidance
Significant
investments in claims management
infrastructure
infrastructure
* YTD as of
September 30, 2009
Group
Protection
Strong, Consistent Loss Ratios
Strong, Consistent Loss Ratios

12
1
Source: Eastbridge
Consulting Group, Inc., An
Update on the Voluntary Industry, May 2008
2 Best’s
Review, July 2009
2010
Focus - The Voluntary Opportunity
Compelling
Industry Opportunity
Continued
trend of employers shifting costs to employees
79%
of employers with 101-500 lives offer at least one
voluntary product1
voluntary product1
2008
industry sales of $5.2 billion and growing2
Compelling
LFG Opportunity
Proven
success and momentum with YTD sales of
$73 million up 18% versus last year
$73 million up 18% versus last year
Attractive
profit characteristics
2010
Initiatives
Expand
penetration with brokers
Position
for entry with classic worksite brokers
New
product offerings (e.g. accident)
Expanded
online enrollment

13
2010
Focus - Continued
Expansion
of field force
Increase
rep base to capitalize on opportunities
Continue
to increase rep productivity
Complete
reengineering of claims system and
processes
processes
Increased
efficiency and effectiveness
Enhanced
ability to manage claims

14
Product
Innovation and
Responsiveness
Responsiveness
Securing
Financial Futures
Financial Futures
Operational
Effectiveness
Comprehensive
Risk Management
Risk Management
Distribution
Depth
and Breadth
and Breadth
Cornerstones
of Our Success

©2009 Lincoln
National Corporation
Fred
Crawford
Chief
Financial Officer
2009
Conference for
Investors and Bankers
Investors and Bankers
Financial
Overview
Earnings and Capital
Earnings and Capital
2
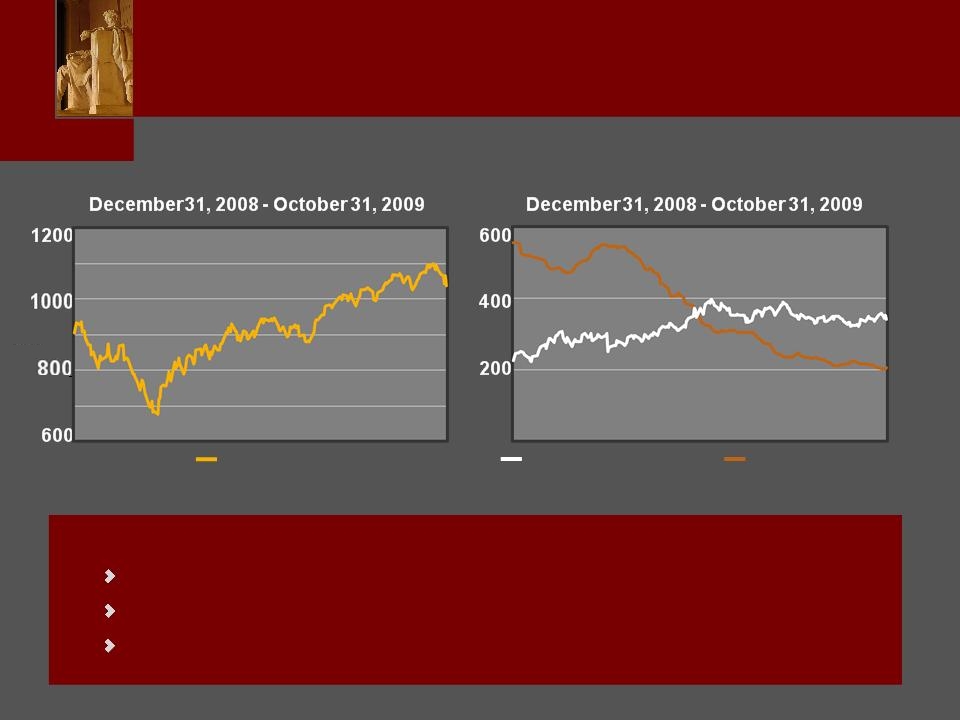
S&P
500
Equity
Markets
Market
Dynamics:
Account
values recovering - variable fees, NAR, DAC, statutory results
Rates
rising & spreads tightening - portfolio yields flat and hedge
volatility
Unrealized
gains/losses recover - some trading account profits generated
Interest
Rates & Spreads
Barclays
Credit
OAS
OAS
10yr
Treasury Rates
0
2009
Market Recovery
3
$228
$263
Life
Insurance
Group
Protection
Annuities
Defined
Contrib.
Avg.
diluted shares
257.8 262.4 310.0
1 See
appendix at the end of this presentation for a definition and reconciliation of
income from operations to net income and a schedule of notable
items
3Q
Income From Continuing Operations
Adjusted for Notable Items1
Adjusted for Notable Items1
($
in millions)
Earnings
Drivers
UK
and Delaware moved to
Discontinued Operations
Discontinued Operations
Insurance
Solutions:
Reinsurance
impact
Alternative
investments
Strong
group loss ratios
Retirement
Solutions:
Positive
and balanced flows
Market
impact on account values
EPS
impact from capital actions
$217
Third
Quarter Results
Sequential Growth in Account Values and Earnings
Sequential Growth in Account Values and Earnings
4
Life
36%
36%
Dental
10%
10%
Disability
44%
44%
Group
Net Earned Premium $1.6b
Medical
10%
10%
UL
43%
VUL
14%
UL
SG
23%
23%
MG
7%
Life
GAAP Reserves $42b
Whole
Life
10%
10%
Term
3%
Return
on Capital1
Life
Segment 9%
Stable
returns with building
in-force and account vales
in-force and account vales
Reinsurance
transactions impact
on earnings and capital
on earnings and capital
Alternative
investment income
expected to recover
expected to recover
Group
Segment 16%
Favorable
loss ratios below 70%
Steady
but lower growth in
premium expected near-term
premium expected near-term
1 Reflects
YTD reported un-leveraged returns excluding goodwill.
Note: Life
Insurance GAAP reserves as of September 30, 2009. Group Protection net earned
premium represents trailing 12 months.
Insurance
and Protection Businesses
Stable and Building Returns
Stable and Building Returns

5
Current
Reserve Financing
$1.8b
LOC facility through 2012
$400mm
long-term financing
$800mm
of reserves held
Statutory
Reserves
$25b
of UL reserves
$6b
of Whole Life & Term reserves
$2.5b
of UL reserves
$500mm
of Term reserves
Strategy:
Term-out
a portion of LOC needs in next few years
Plans
to execute on a $300mm term solution in 2009
Absorb
natural growth in reserves through statutory earnings
Required
Reserves Subject
to
Capital Financing
Life
Reserve Management
Executing on a Prudent Long-Term Plan Over 3 Years
Executing on a Prudent Long-Term Plan Over 3 Years

6
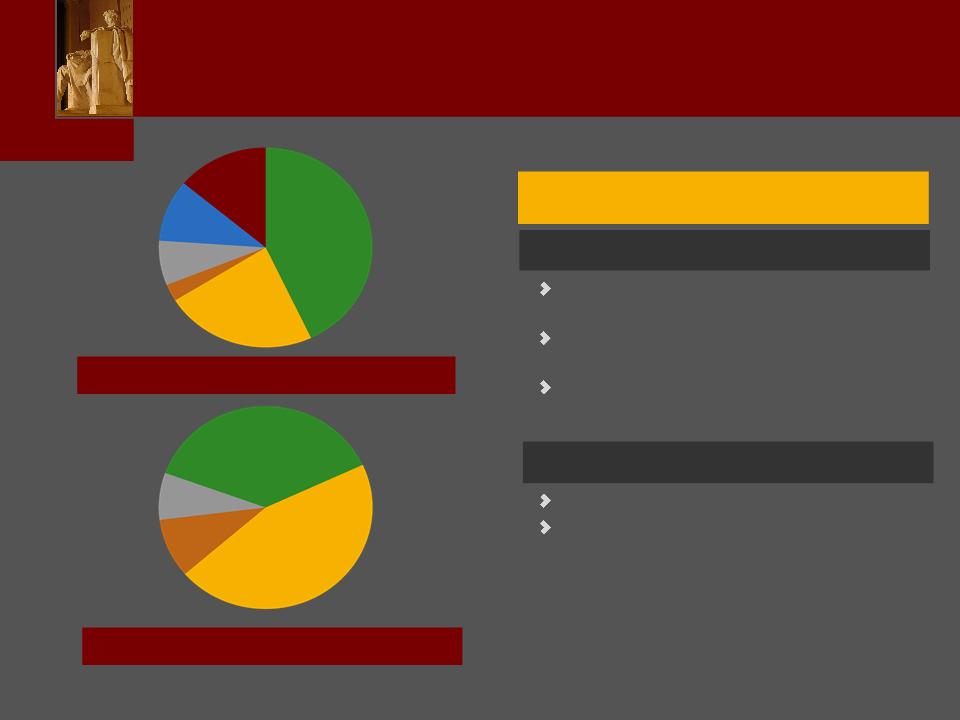
Retirement
AUM = $105 billion
DC
Mutual
Funds
DC
Fixed
Annuities
DC
Variable
Annuities1
Variable
Annuities1
Individual
Fixed Annuities
Individual
Variable
Annuities
14%
18%
6%
9%
49%
4%
Fixed
Portion of Individual
Variable Annuities
Variable Annuities
1 Includes
fixed portion of VA
2 Reflects
year-to-date reported un-leveraged returns excluding goodwill.
Return
on Capital2
Individual
Annuities 10%
Average
account values recovering
Liquidity
fully invested in 3Q
Death
benefit reserve and DAC
amortization elevated
amortization elevated
Defined
Contribution 13%
Average
account values recovering
Plans
to invest in the platform
Retirement
Returns
Diverse Portfolio Driving Balanced Returns
Diverse Portfolio Driving Balanced Returns

7
55%
Account
Value
Value
Step
Up <1%
36%
Individual
VA AUM1 = $56
billion
Hi-Water
Mark
8%
Return
of
Premium
Individual
VA Death Benefits
LB
NAR3 $6.5b $3.1b
DB
NAR3 $14.8b $7.3b
Hedge
Target $3.7b $1.1b
Hedge
Assets $4.3b $1.2b
GAAP
Reserves $3.2b $1.2b
Statutory
Reserves2 $1.1b $.8b
12/31/08 9/30/09
16%
46%
38%
No
Guarantee
Guaranteed
Income
Benefit
Income
Benefit
Guaranteed
Withdrawal
Benefit
Withdrawal
Benefit
1 Includes
fixed portion of VA
2 Statutory
reserves excludes adoption of VACARVM
3 Net amount
at risk is calculated as the guaranteed amount minus account value, floored at
zero
Reserve
Metrics
Individual
Variable Annuities
Proven Risk Management and Full Economic Hedge
Proven Risk Management and Full Economic Hedge
8
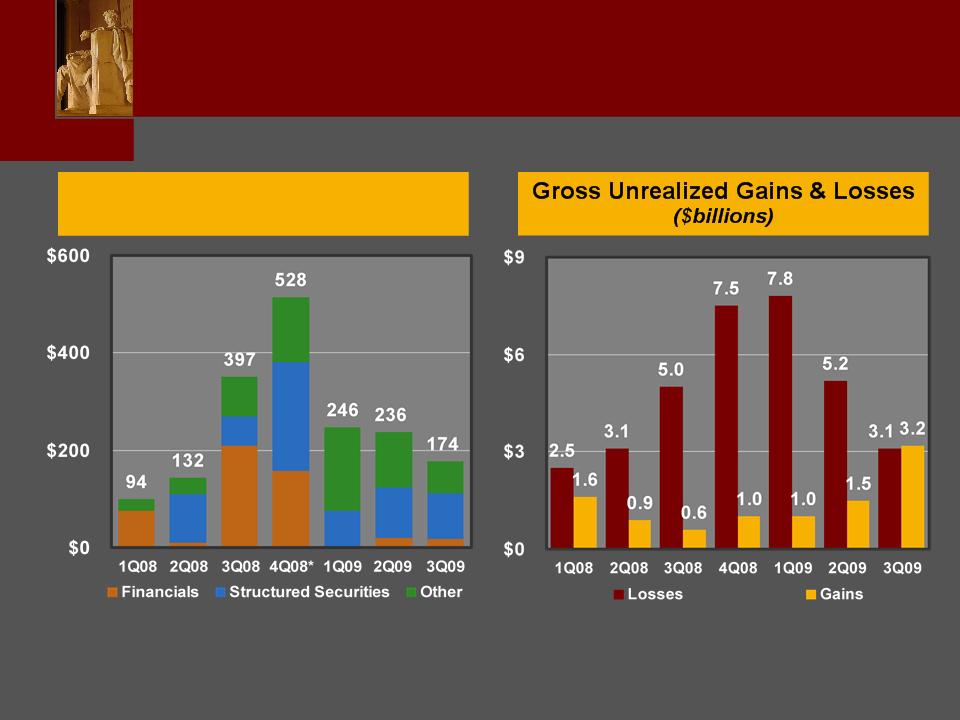
Realized
Losses
($millions)
All data
shown for available-for-sale securities. All
realized loss data presented on a pre-DAC and tax basis; excludes losses on
derivatives; includes losses
on sold securities.
on sold securities.
* Excludes
the impairment on Bank of America common stock securities of $131 million,
pre-tax, held at the holding company and does not impact insurance
subsidiary capital.
subsidiary capital.
Note: 2009
reflects the adoption of FASB Staff Position No. FAS 115-2 and
124-2.
General
Account Investment Results
Unrealized Loss Conditions Improving
Unrealized Loss Conditions Improving

9
1 Represents
statutory results of Lincoln National Life Insurance Company, Lincoln Life &
Annuity of New York, and First-Penn Pacific Life Insurance Company;
The reporting of RBC measures is not intended for the purpose of ranking any insurance company or for use in connection with any marketing, advertising or
promotional activities.
The reporting of RBC measures is not intended for the purpose of ranking any insurance company or for use in connection with any marketing, advertising or
promotional activities.
Potential
Headwinds
- asset impairments, ratings migration, and
adoption of VACARVM
adoption of VACARVM
Potential
Tailwinds
- statutory earnings, securitization, and potential net
impact of various NAIC actions
impact of various NAIC actions
Est.
Total
Adjusted Capital & RBC1
($billions)
Risk
Based Capital Ratio1
Insurance
Company Capitalization
Capital Positioned to Withstand Stressed Markets
Capital Positioned to Withstand Stressed Markets

10
$900mm
of liquid
investments1
investments1
CP:
$150mm issued under
A2/P2 program1
A2/P2 program1
Next
maturity of $250mm due
March 2010
March 2010
Delaware
sale on track with
$400mm in proceeds
$400mm in proceeds
Expect
to push some capital
down into subsidiaries
down into subsidiaries
Considering
refinancing
alternatives to pre-fund 2010
maturity
alternatives to pre-fund 2010
maturity
Holding
Company
Year-end
Outlook
Strategy:
Target
12-18 months of cash flow held at the holding company
Ladder
maturities and pre-fund when markets are favorable
1 As of
September 30, 2009
Financial
Flexibility
Excess Holding Company Liquidity and Ready Capital
Excess Holding Company Liquidity and Ready Capital

Appendix

12
Income
(loss) from operations and ROE, as used in the earnings release, are non-GAAP
financial measures and
are not substitutes for net income (loss) and ROE, calculated using GAAP measures. Income (loss) from
operations represents after-tax results excluding, as applicable, realized gains and losses associated with the
following: sale or disposal of securities; impairments of securities; change in the fair value of embedded
derivatives within certain reinsurance arrangements and the change in the fair value of related trading securities;
change in the guaranteed living benefits embedded derivative reserves within our variable annuities net of the
change in the fair value of the derivatives we own to hedge the changes in the embedded derivative reserves,
the net of which is referred to as GLB net derivatives results; net difference between the benefit ratio reserves on
our guaranteed death benefit riders within our variable annuities and the change in the fair value of the
derivatives excluding our expected cost of the hedging instruments; and changes in the fair value of the
embedded derivative liabilities related to index call options we may purchase in the future to hedge contract
holder index allocations applicable to future reset periods for our indexed annuity products, income (loss) from
the initial adoption of changes in accounting standards, income (loss) from reserve changes (net of related
amortization) on business sold through reinsurance, losses on early retirement of debt, including subordinated
debt, losses from the impairment of intangible assets and income (loss) from discontinued operations.
The
earnings used to calculate ROE, as used in the earnings release, are income
(loss) from operations.
Income (loss) from operations is an internal measure used by the company in the management of its operations.
Management believes that this performance measure explains the results of the company's ongoing businesses
in a manner that allows for a better understanding of the underlying trends in the company's current business
because the excluded items are unpredictable and not necessarily indicative of current operating fundamentals
or future performance of the business segments, and, in most instances, decisions regarding these items do not
necessarily relate to the operations of the individual segments.
Definition
of Income From Operations

13
Net
Income (Loss Available to Common Stockholders)
Less:
Preferred
stock dividends and accretion of discount
Minority
adjustment
Net
Income
Less:
Excluded
realized gain (loss)
Income
from reserve changes (net of related
amortization) on business sold through reinsurance
amortization) on business sold through reinsurance
Gain
on early extinguishment of debt
Impairment
of intangibles
Income
(loss) from discontinued operations
Income
from Operations
Earnings
per share (diluted)
Net
Income (Loss)
Income
from Operations
($
in millions, except per share data)
$(161.4)
(161.4)
(215.9)
0.4
0.6
(153.8)
$
207.3
$(0.62)
$
0.79
2Q
09
3Q
09
$(579.0)
(0.1)
(578.9)
(188.4)
0.4
41.8
(603.5)
7.7
$
163.1
$(2.27)
$
0.63
1Q
09
$137.0
(16.3)
153.3
(196.0)
0.4
1.4
72.0
$275.5
$0.44
$0.84
Net
Income to Income from Operations
Reconciliation
Reconciliation

14
Reported
DAC
Unlocking
Tax-related
items
Expenses
Other
(net)
Total*
Alternative
Investments**
($
in millions)
74
74
* Excludes
alternative investment income
** Reflects
actual income or (loss) on alternative investment portfolio
Retirement
Solutions
Annuities
Insurance
Solutions
Defined
Contrib.
Contrib.
Life
Insurance
Insurance
Group
Protection
Protection
Other
Operations
Operations
30
30
142
142
(2)
26
26
(108)
(64)
(44)
1Q
2009 Income From Operations
Schedule of Notable Items
Schedule of Notable Items

15
Reported
DAC
Unlocking
Tax-related
items
Expenses
Mortality
Other
(net)
Total*
Alternative
Investments**
($
in millions)
65
65
(5)
Retirement
Solutions
Annuities
Insurance
Solutions
Defined
Contrib.
Contrib.
Life
Insurance
Insurance
Group
Protection
Protection
Other
Operations
Operations
28
28
(3)
133
2
5
3
123
(20)
34
34
(1)
(52)
(19)
(33)
* Excludes
alternative investment income
** Reflects
actual income or (loss) on alternative investment portfolio
2Q
2009 Income From Operations
Schedule of Notable Items
Schedule of Notable Items

16
Reported
DAC
Unlocking
Tax-related
items
Other
Total*
Alternative
Investments**
($
in millions)
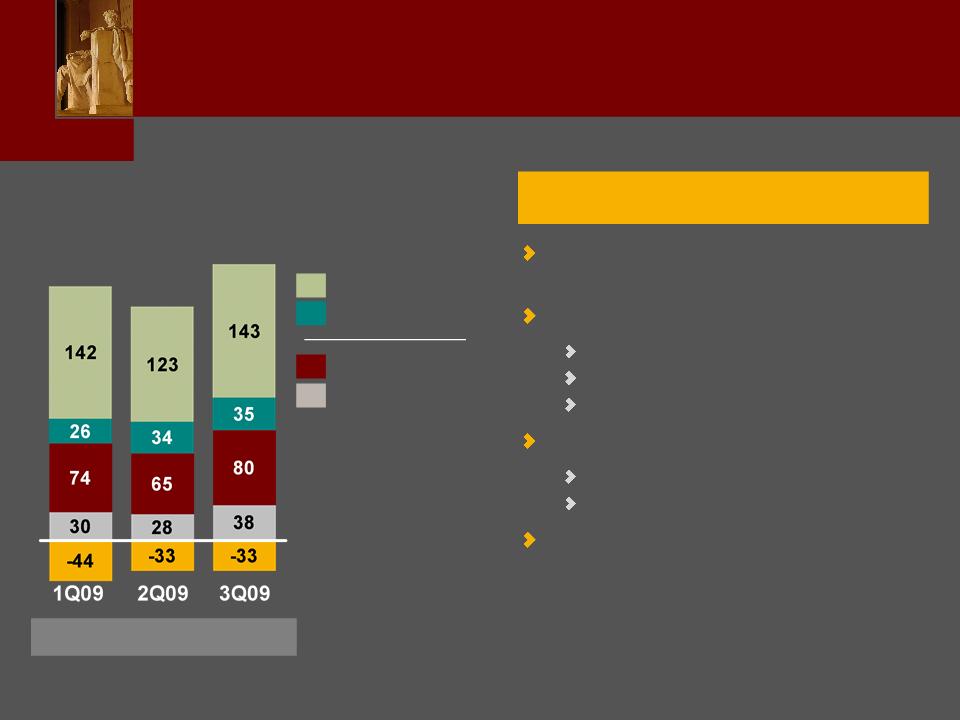
95
11
3
1
80
2
Retirement
Solutions
Annuities
Insurance
Solutions
Defined
Contrib.
Contrib.
Life
Insurance
Insurance
Group
Protection
Protection
Other
Operations
Operations
43
5
38
1
137
(12)
6
143
(5)
35
35
(33)
(33)
1
* Excludes
alternative investment income
** Reflects
actual income or (loss) on alternative investment portfolio
3Q
2009 Income From Operations
Schedule of Notable Items
Schedule of Notable Items