Attached files
| file | filename |
|---|---|
| 8-K - CURRENT REPORT OF MATERIAL EVENTS OR CORPORATE CHANGES - XETA TECHNOLOGIES INC | a09-33355_18k.htm |
Exhibit 99.1
|
|
Investor Presentation Southwest IDEAS Investor Conference November 12, 2009 |
|
|
Portions of this presentation contain forward-looking statements within the meaning of the Private Securities Litigation Reform Act of 1995. Forward-looking statements include information concerning our possible or assumed future results of operations, as well as trends and conditions in our markets and technologies, market opportunity, and our plans regarding our business strategies. These statements can generally be identified by such words as "expects," "plans," "believes," "anticipates," "should," "may," "will" and similar words or expressions. Forward-looking statements are not guarantees of performance but rather reflect our current expectations, assumptions and beliefs based upon information currently available to us. Investors are cautioned that all forward-looking statements are subject to risks and uncertainties which are difficult to predict and that could cause actual results to differ materially from those projected. Many of these risks and uncertainties are described in Part I of our Form 10-K for the fiscal year ended October 31, 2008 under the heading "Risk Factors", and in our subsequently filed quarterly reports. Some of these risk factors include: the U.S. economic crisis and its impact on capital spending trends in the Company's markets; reduced availability of credit; the Nortel Networks bankruptcy filing; the financial condition of our suppliers and changes in their distribution strategies and support; unpredictable quarter to quarter revenues; our ability to maintain and improve upon current gross profit margins; the success of the Mitel product and services offering; our ability to acquire and retain the technical competencies needed to implement new advanced communications technologies; intense competition and industry consolidation; dependence upon a single customer for the recent growth in the our Managed Services offering; and the availability and retention of revenue professionals and certified technicians. Investors are cautioned that the foregoing list of important risk factors is not exclusive. These and other factors should be considered carefully and investors should not place undue reliance on our forward-looking statements. Forward-looking statements speak only as of the date made and we do not undertake to update any forward-looking statement that is contained in any communications. GAAP Reconciliation The Company uses EBITDA (earnings before net interest, income taxes, depreciation and amortization) as part of its overall assessment and comparison of financial performance between accounting periods. XETA believes that EBITDA is often used by the financial community as a method of measuring the Company's performance and of evaluating the market value of companies considered to be in similar businesses. EBITDA is a non-GAAP financial measure and should not be considered an alternative to net income or cash provided by operating activities, as defined by accounting principles generally accepted in the United States ("GAAP"). A reconciliation of EBITDA to net income is provided in Exhibit A of this presentation. Forward-Looking Statements |
|
|
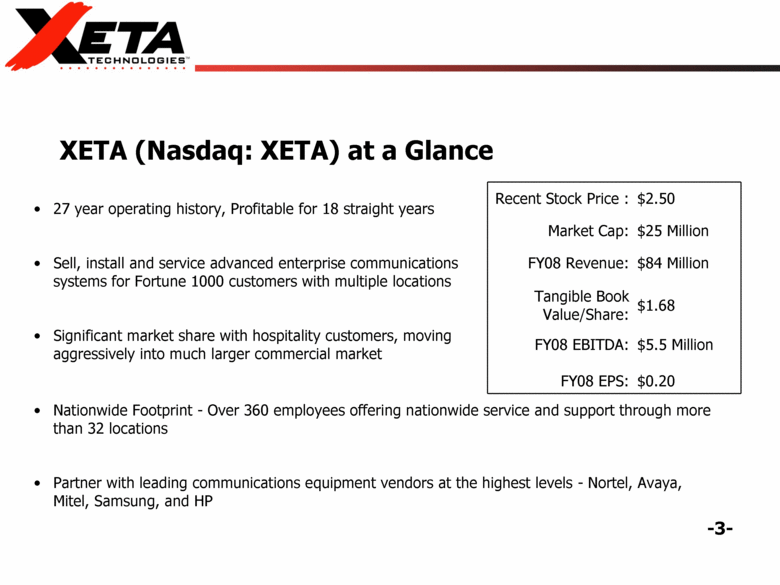
27 year operating history, Profitable for 18 straight years Sell, install and service advanced enterprise communications systems for Fortune 1000 customers with multiple locations Significant market share with hospitality customers, moving aggressively into much larger commercial market XETA (Nasdaq: XETA) at a Glance Nationwide Footprint - Over 360 employees offering nationwide service and support through more than 32 locations Partner with leading communications equipment vendors at the highest levels - Nortel, Avaya, Mitel, Samsung, and HP Recent Stock Price : $2.50 Market Cap: $25 Million FY08 Revenue: $84 Million Tangible Book Value/Share: $1.68 FY08 EBITDA: FY08 EPS: $5.5 Million $0.20 |
|
|
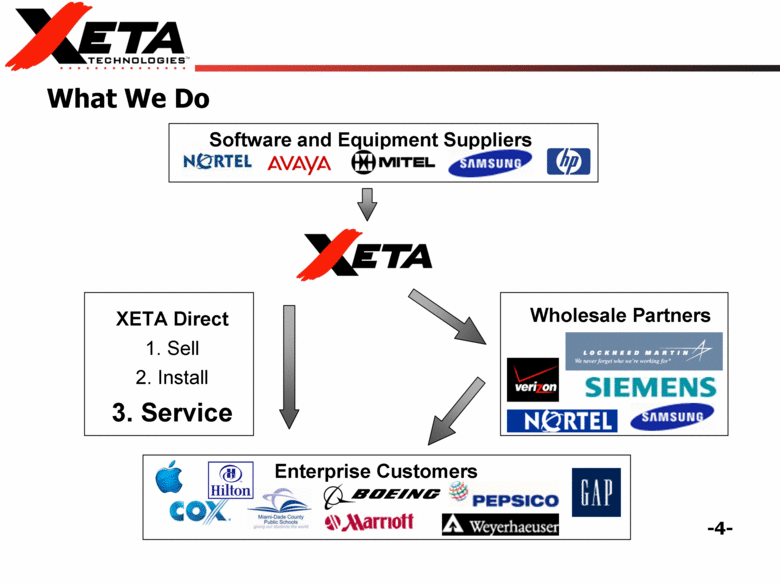
What We Do Software and Equipment Suppliers Wholesale Partners Enterprise Customers XETA Direct 1. Sell 2. Install 3. Service |
|
|
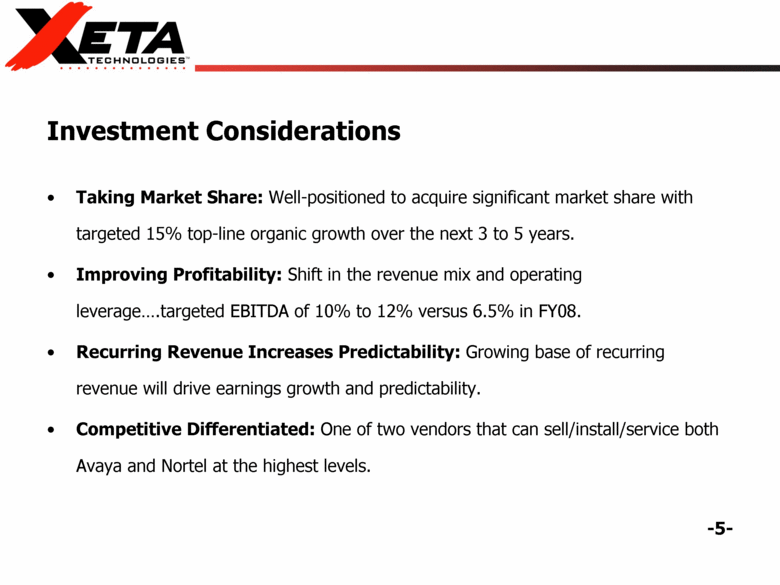
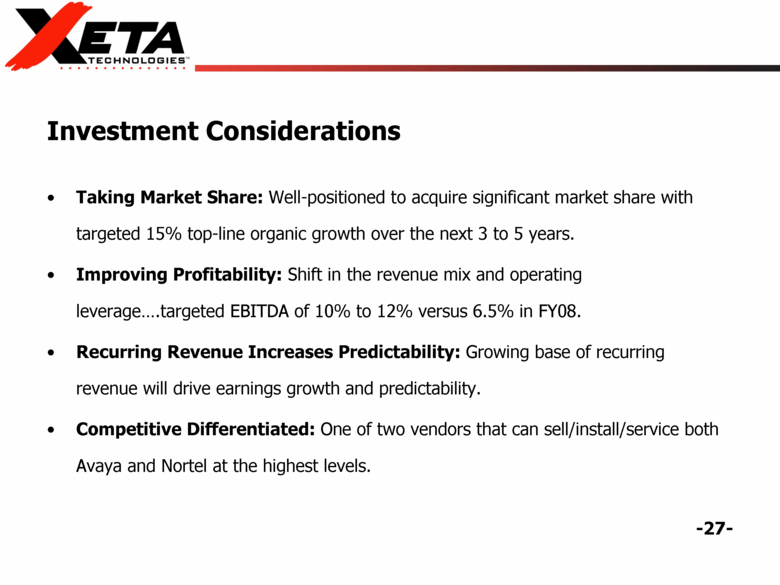
Taking Market Share: Well-positioned to acquire significant market share with targeted 15% top-line organic growth over the next 3 to 5 years. Improving Profitability: Shift in the revenue mix and operating leverage....targeted EBITDA of 10% to 12% versus 6.5% in FY08. Recurring Revenue Increases Predictability: Growing base of recurring revenue will drive earnings growth and predictability. Competitive Differentiated: One of two vendors that can sell/install/service both Avaya and Nortel at the highest levels. Investment Considerations |
|
|
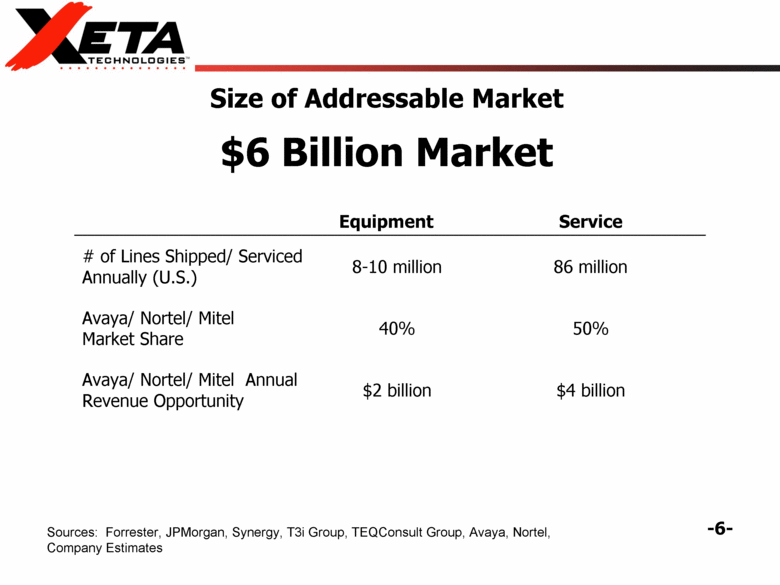
Size of Addressable Market $6 Billion Market Sources: Forrester, JPMorgan, Synergy, T3i Group, TEQConsult Group, Avaya, Nortel, Company Estimates Equipment Service # of Lines Shipped/ Serviced Annually (U.S.) 8-10 million 86 million Avaya/ Nortel/ Mitel Market Share 40% 50% Avaya/ Nortel/ Mitel Annual Revenue Opportunity $2 billion $4 billion |
|
|
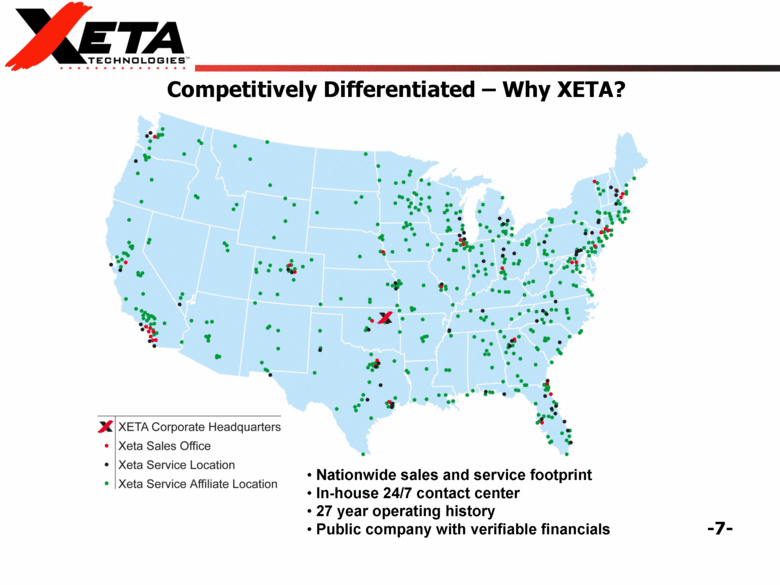
Competitively Differentiated – Why XETA? Nationwide sales and service footprint In-house 24/7 contact center 27 year operating history Public company with verifiable financials |
|
|
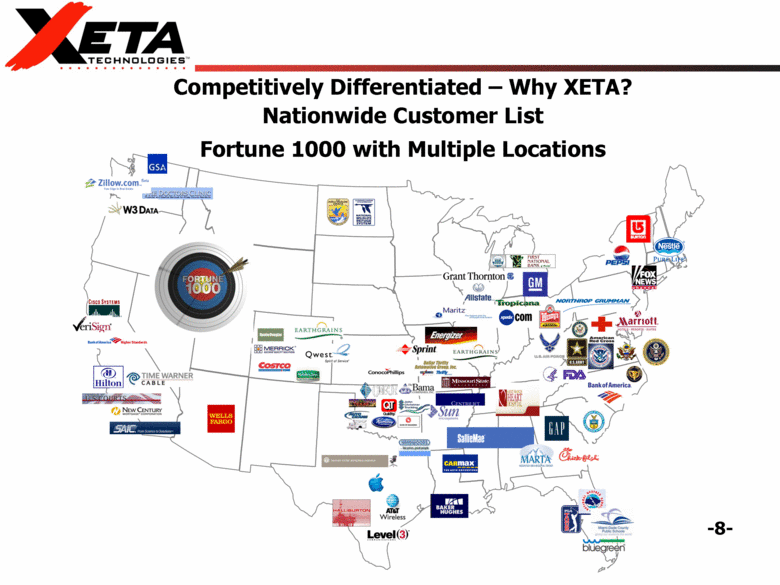
Competitively Differentiated – Why XETA? Nationwide Customer List Fortune 1000 with Multiple Locations |
|
|
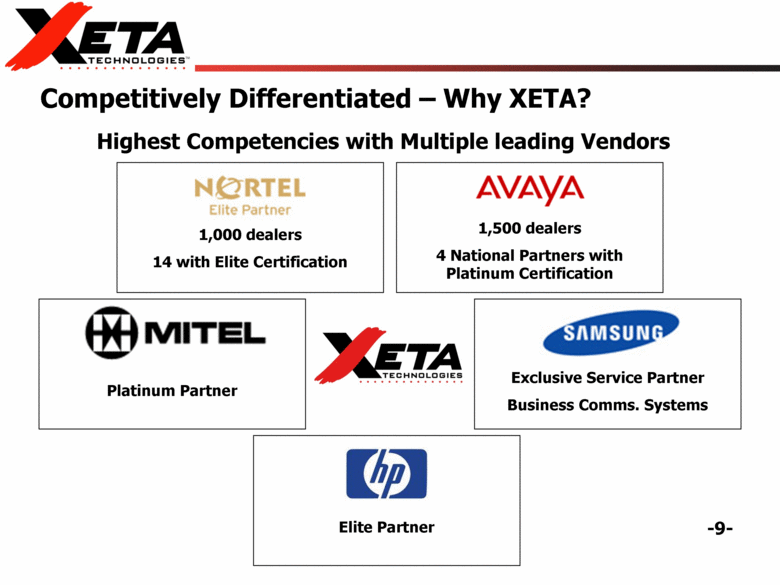
Competitively Differentiated – Why XETA? 1,000 dealers 14 with Elite Certification 1,500 dealers 4 National Partners with Platinum Certification Highest Competencies with Multiple leading Vendors Platinum Partner Elite Partner Exclusive Service Partner Business Comms. Systems |
|
|
Multiple Avenues of Growth Innovative wholesale model creates win-win-win for XETA, wholesale partners and end customers Take share from local and regional players Combination of Avaya and Nortel Enterprise businesses Education Vertical Success Consolidation opportunities among local and regional players |
|
|
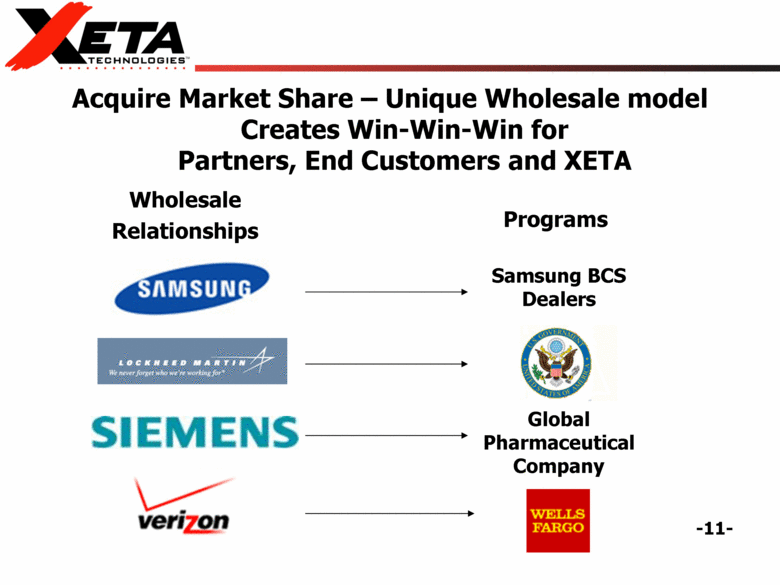
Wholesale Relationships Programs Acquire Market Share – Unique Wholesale model Creates Win-Win-Win for Partners, End Customers and XETA Samsung BCS Dealers Global Pharmaceutical Company |
|
|
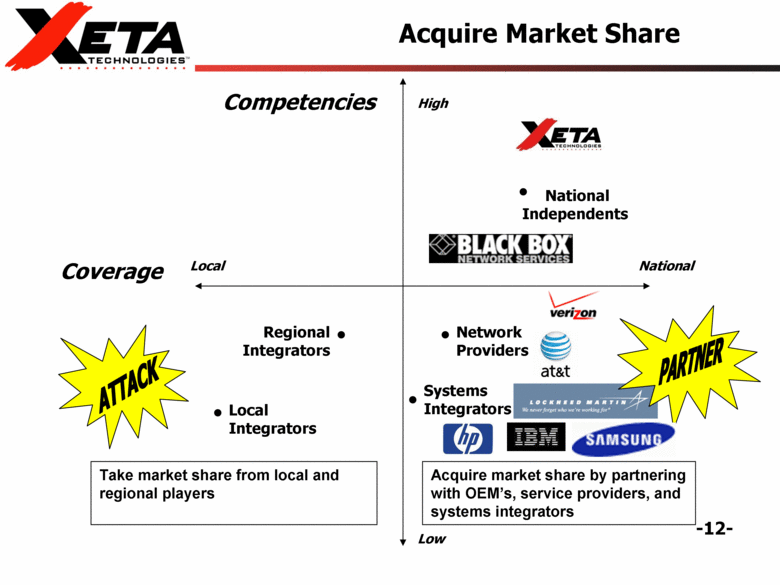
National Independents Regional Integrators Systems Integrators Network Providers Local Integrators Competencies Coverage Acquire Market Share Take market share from local and regional players Acquire market share by partnering with OEM’s, service providers, and systems integrators High Low Local National |
|
|
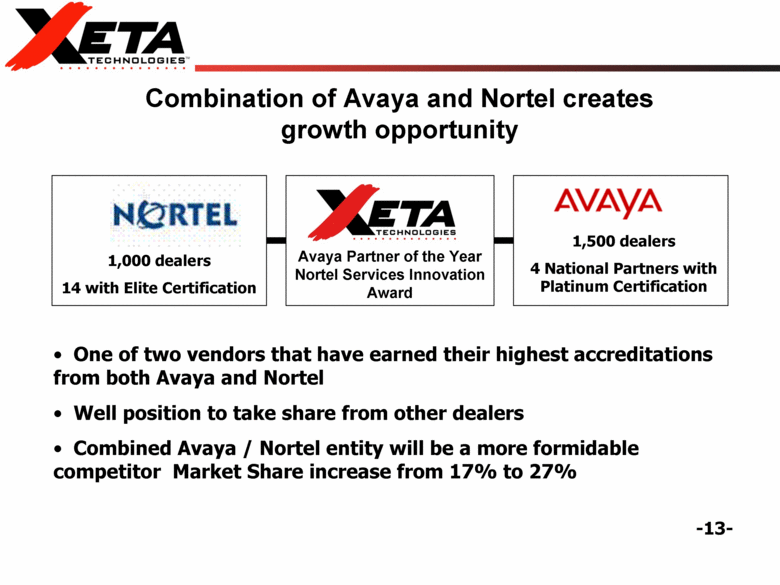
1,000 dealers 14 with Elite Certification One of two vendors that have earned their highest accreditations from both Avaya and Nortel Well position to take share from other dealers Combined Avaya / Nortel entity will be a more formidable competitor Market Share increase from 17% to 27% 1,500 dealers 4 National Partners with Platinum Certification Combination of Avaya and Nortel creates growth opportunity Avaya Partner of the Year Nortel Services Innovation Award |
|
|
Education Vertical E-rate – Federally funded spending program 6 school project wins during FY09 Miami Dade County Public Schools |
|
|
Target both Scale and Scope Strategic Recurring Revenue Added Coverage and Competency Targeted Customers and Talent Operational Manufacturer Competencies and Relationships Comparable Business Models Cultural Fit Economic Deal Size $5M to $25M Annual Revenues EBITDA contribution Accretive Accelerate Growth Through Targeted Acquisitions |
|
|
Experienced Leadership Team Greg Forrest – CEO and President – CEO since June 2007, joined the company in July 2005 through an acquisition. Prior to XETA, founded several fast-growing companies in the clothing, commercial interior and telecommunications industries. Robert Wagner – CFO – Joined the company in 1986. 24 years public Accounting/ financial management experience. Don Reigel – Executive Director, Avaya – Joined company in 1993. Prior to XETA, held senior sales management positions at large Avaya dealer. Scott Davis – Executive Director, Managed Services – Joined company in 2006. 10 years senior sales positions inside Nortel. Paul Comeau – Executive Director of Operations – Joined the company in 2007. 25 years of achievements in field operations, call center, customer support center, sales engineering and business process improvement. Tom Luce – Executive Director, Managed Services – Joined the company during its founding in 1982. Jerry Moore – Executive Director, Information Technology – Joined the company November 2009. Previously CIO of largest technology education center in Oklahoma. |
|
|
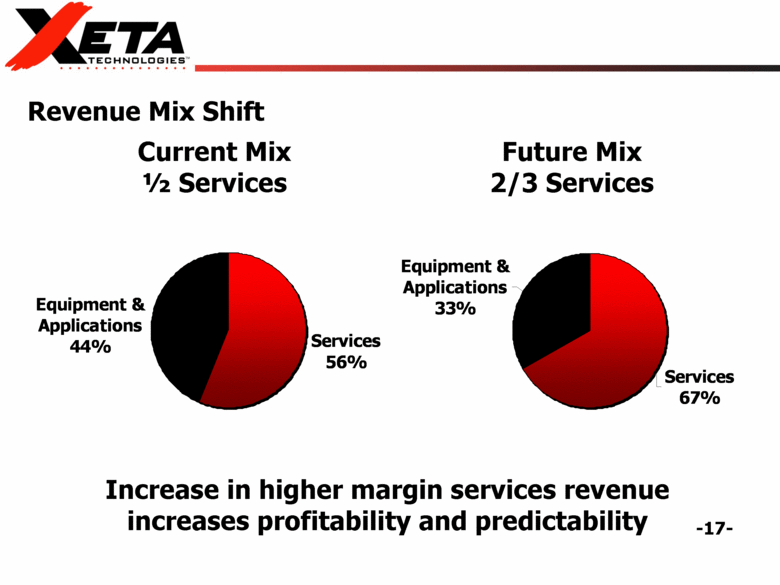
Revenue Mix Shift Current Mix ½ Services Future Mix 2/3 Services Increase in higher margin services revenue increases profitability and predictability Equipment & Applications 33% Services 67% Equipment & Applications 44% Services 56% |
|
|
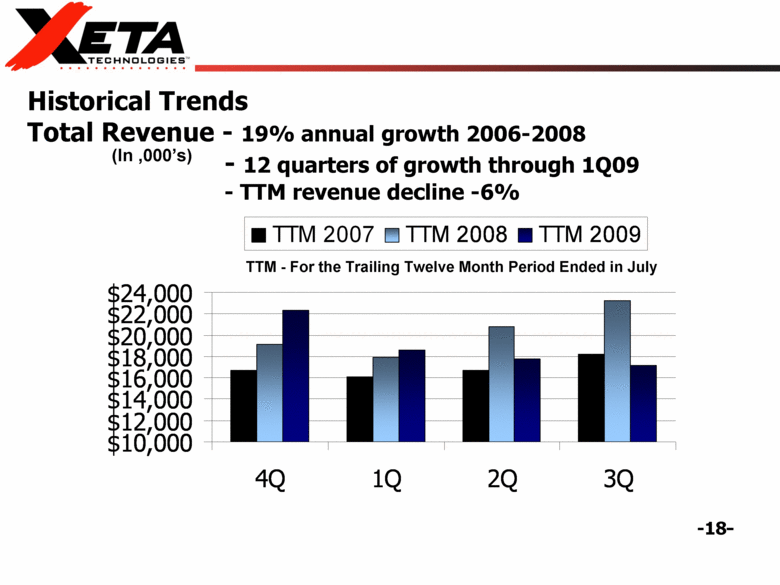
Historical Trends Total Revenue - 19% annual growth 2006-2008 - 12 quarters of growth through 1Q09 - TTM revenue decline -6% (In ,000’s) TTM - For the Trailing Twelve Month Period Ended in July $10,000 $12,000 $14,000 $16,000 $18,000 $20,000 $22,000 $24,000 4Q 1Q 2Q 3Q TTM 2007 TTM 2008 TTM 2009 |
|
|
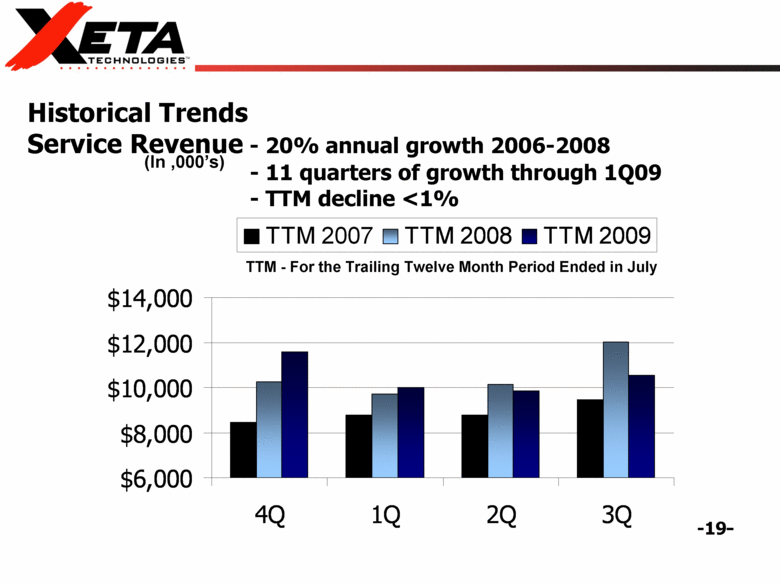
Historical Trends Service Revenue - 20% annual growth 2006-2008 - 11 quarters of growth through 1Q09 - TTM decline <1% TTM - For the Trailing Twelve Month Period Ended in July (In ,000’s) $6,000 $8,000 $10,000 $12,000 $14,000 4Q 1Q 2Q 3Q TTM 2007 TTM 2008 TTM 2009 |
|
|
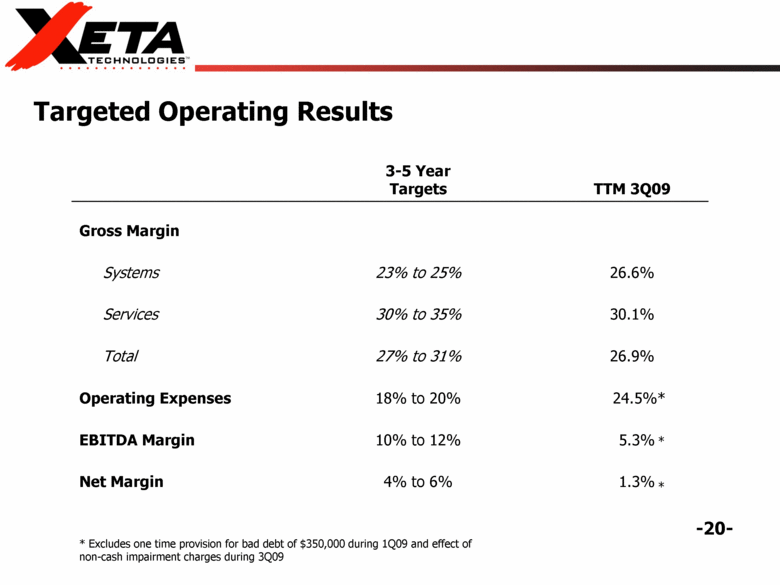
Targeted Operating Results 3-5 Year Targets TTM 3Q09 Gross Margin Systems 23% to 25% 26.6% Services 30% to 35% 30.1% Total 27% to 31% 26.9% Operating Expenses 18% to 20% 24.5%* EBITDA Margin 10% to 12% 5.3% Net Margin 4% to 6% 1.3% * Excludes one time provision for bad debt of $350,000 during 1Q09 and effect of non-cash impairment charges during 3Q09 * * |
|
|
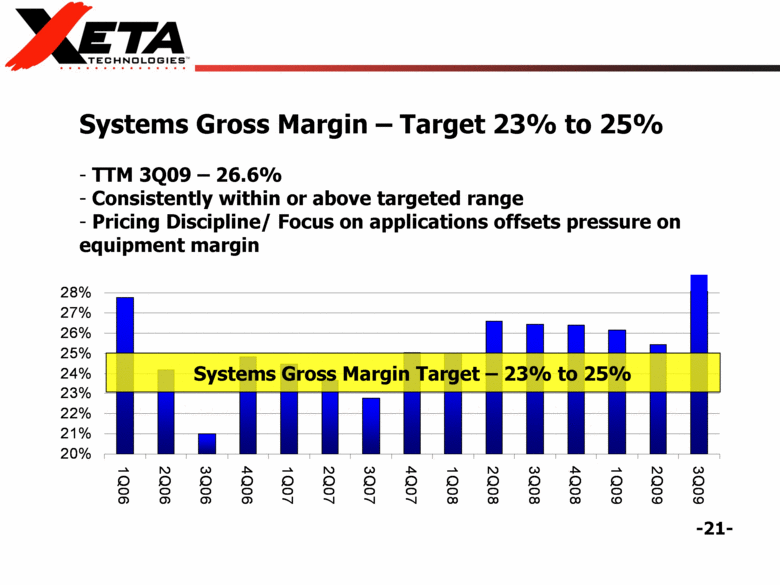
Systems Gross Margin Target – 23% to 25% Systems Gross Margin – Target 23% to 25% TTM 3Q09 – 26.6% Consistently within or above targeted range Pricing Discipline/ Focus on applications offsets pressure on equipment margin 20% 21% 22% 23% 24% 25% 26% 27% 28% 1Q06 2Q06 3Q06 4Q06 1Q07 2Q07 3Q07 4Q07 1Q08 2Q08 3Q08 4Q08 1Q09 2Q09 3Q09 |
|
|
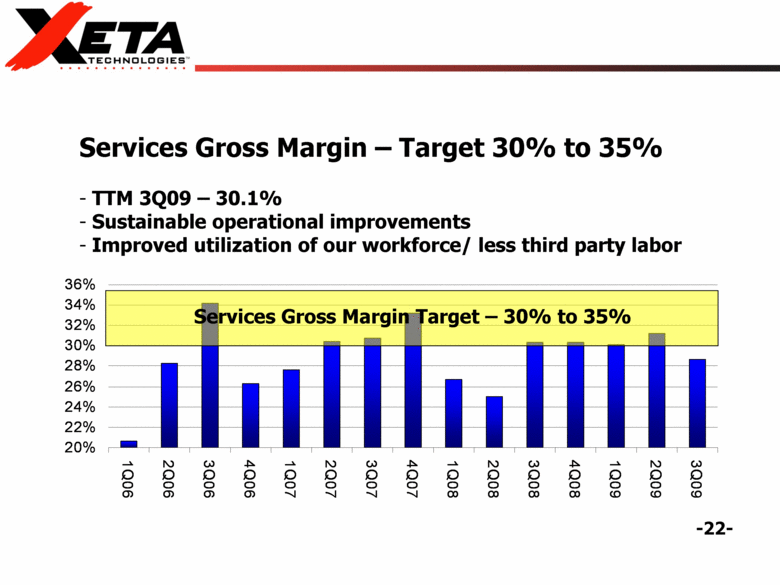
Services Gross Margin Target – 30% to 35% Services Gross Margin – Target 30% to 35% TTM 3Q09 – 30.1% Sustainable operational improvements Improved utilization of our workforce/ less third party labor 20% 22% 24% 26% 28% 30% 32% 34% 36% 1Q06 2Q06 3Q06 4Q06 1Q07 2Q07 3Q07 4Q07 1Q08 2Q08 3Q08 4Q08 1Q09 2Q09 3Q09 |
|
|
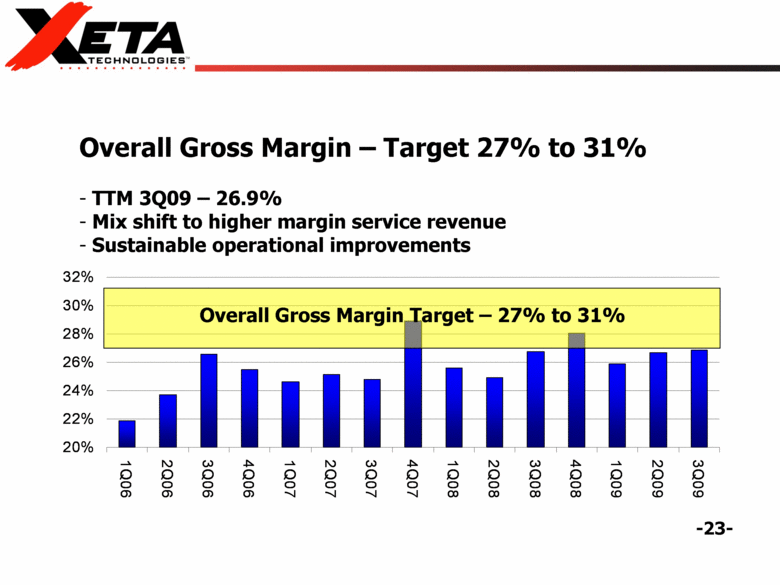
Overall Gross Margin Target – 27% to 31% Overall Gross Margin – Target 27% to 31% TTM 3Q09 – 26.9% Mix shift to higher margin service revenue Sustainable operational improvements 20% 22% 24% 26% 28% 30% 32% 1Q06 2Q06 3Q06 4Q06 1Q07 2Q07 3Q07 4Q07 1Q08 2Q08 3Q08 4Q08 1Q09 2Q09 3Q09 |
|
|
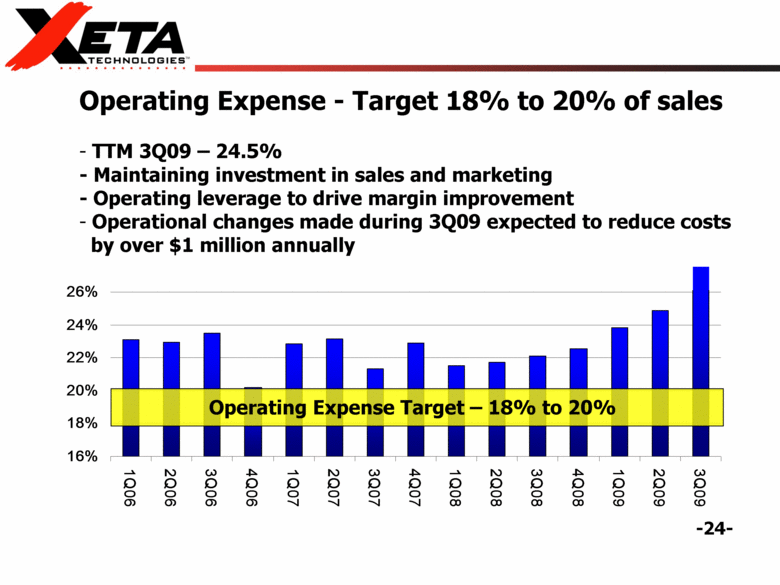
Operating Expense Target – 18% to 20% Operation Expense - Target 18% to 20% of sales - TTM 3Q09 – 24.5% - Maintaining investment in sales and marketing - Operating leverage to drive margin improvement - Operational changes made during 3Q09 expected to reduce costs by over $1 million annually 16% 18% 20% 22% 24% 26% 1Q06 2Q06 3Q06 4Q06 1Q07 2Q07 3Q07 4Q07 1Q08 2Q08 3Q08 4Q08 1Q09 2Q09 3Q09 |
|
|
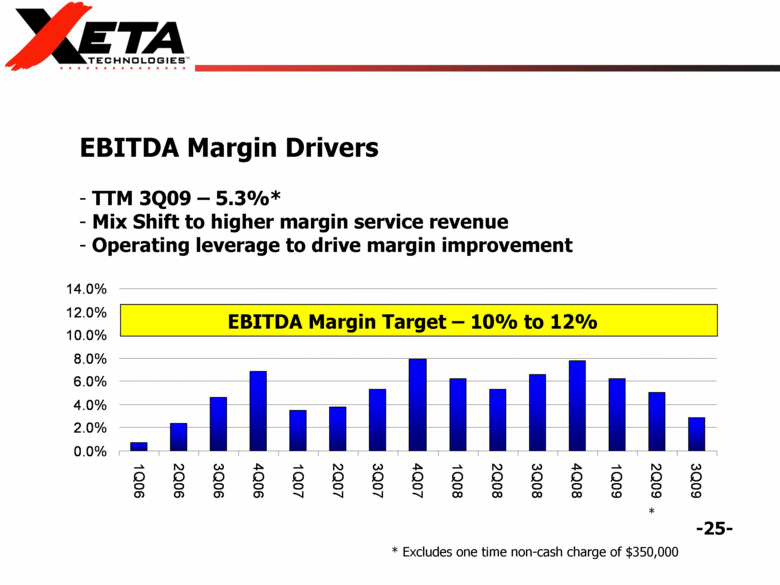
EBITDA Margin Target – 10% to 12% EBITDA Margin Drivers TTM 3Q09 – 5.3%* Mix Shift to higher margin service revenue Operating leverage to drive margin improvement * * Excludes one time non-cash charge of $350,000 0.0% 2.0% 4.0% 6.0% 8.0% 10.0% 12.0% 14.0% 1Q06 2Q06 3Q06 4Q06 1Q07 2Q07 3Q07 4Q07 1Q08 2Q08 3Q08 4Q08 1Q09 2Q09 3Q09 |
|
|
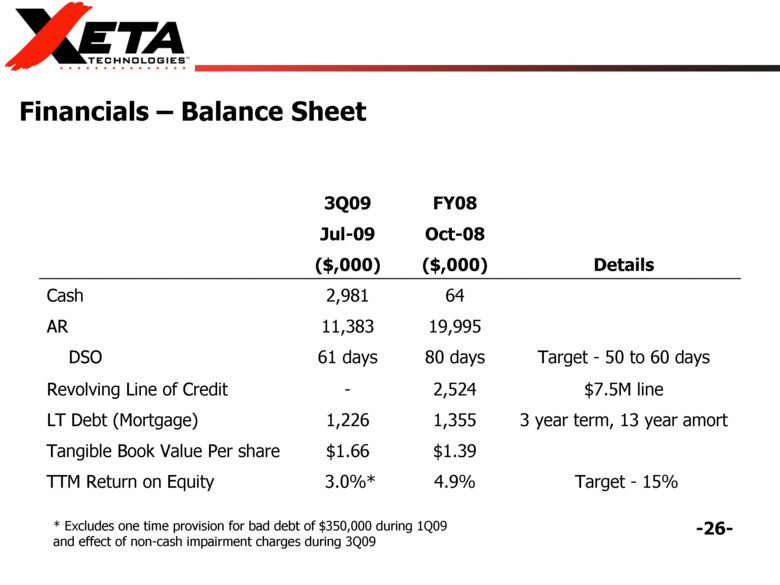
Financials – Balance Sheet 3Q09 FY08 Jul-09 Oct-08 ($,000) ($,000) Details Cash 2,981 64 AR 11,383 19,995 DSO 61 days 80 days Target - 50 to 60 days Revolving Line of Credit - 2,524 $7.5M line LT Debt (Mortgage) 1,226 1,355 3 year term, 13 year amort Tangible Book Value Per share $1.66 $1.39 TTM Return on Equity 3.0%* 4.9% Target - 15% * Excludes one time provision for bad debt of $350,000 during 1Q09 and effect of non-cash impairment charges during 3Q09 |
|
|
Taking Market Share: Well-positioned to acquire significant market share with targeted 15% top-line organic growth over the next 3 to 5 years. Improving Profitability: Shift in the revenue mix and operating leverage....targeted EBITDA of 10% to 12% versus 6.5% in FY08. Recurring Revenue Increases Predictability: Growing base of recurring revenue will drive earnings growth and predictability. Competitive Differentiated: One of two vendors that can sell/install/service both Avaya and Nortel at the highest levels. Investment Considerations |
|
|
Investor Presentation Southwest IDEAS Investor Conference November 12, 2009 |
|
|
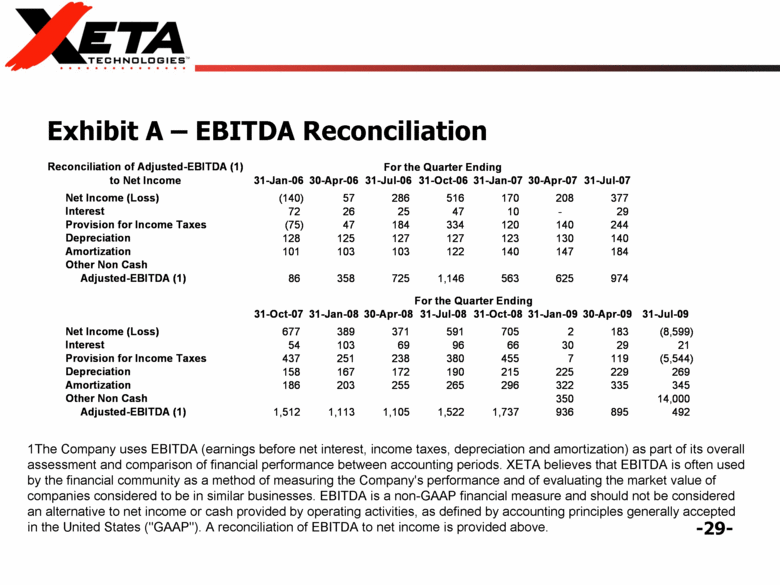
Exhibit A – EBITDA Reconciliation 1The Company uses EBITDA (earnings before net interest, income taxes, depreciation and amortization) as part of its overall assessment and comparison of financial performance between accounting periods. XETA believes that EBITDA is often used by the financial community as a method of measuring the Company's performance and of evaluating the market value of companies considered to be in similar businesses. EBITDA is a non-GAAP financial measure and should not be considered an alternative to net income or cash provided by operating activities, as defined by accounting principles generally accepted in the United States ("GAAP"). A reconciliation of EBITDA to net income is provided above. 31-Jan-06 30-Apr-06 31-Jul-06 31-Oct-06 31-Jan-07 30-Apr-07 31-Jul-07 Net Income (Loss) (140) 57 286 516 170 208 377 Interest 72 26 25 47 10 - 29 Provision for Income Taxes (75) 47 184 334 120 140 244 Depreciation 128 125 127 127 123 130 140 Amortization 101 103 103 122 140 147 184 Other Non Cash Adjusted-EBITDA (1) 86 358 725 1,146 563 625 974 31-Oct-07 31-Jan-08 30-Apr-08 31-Jul-08 31-Oct-08 31-Jan-09 30-Apr-09 31-Jul-09 Net Income (Loss) 677 389 371 591 705 2 183 (8,599) Interest 54 103 69 96 66 30 29 21 Provision for Income Taxes 437 251 238 380 455 7 119 (5,544) Depreciation 158 167 172 190 215 225 229 269 Amortization 186 203 255 265 296 322 335 345 Other Non Cash 350 14,000 Adjusted-EBITDA (1) 1,512 1,113 1,105 1,522 1,737 936 895 492 Reconciliation of Adjusted-EBITDA (1) to Net Income For the Quarter Ending For the Quarter Ending |

