Attached files
| file | filename |
|---|---|
| 8-K - FORM 8-K - KITE REALTY GROUP TRUST | form8k_111209.htm |
EXHIBIT
99.1

Kite Realty
Group Trust
Investor
Presentation
Information
as of September 30, 2009

2
|
§ Stable
Operating Portfolio
|
§ 55
Operating Properties in 9 states
§ 91.2%
leased
§ Diverse
tenant base
§ Strong
demographics
|
|
§ Increased
Leasing Productivity
|
§ 400,000
square feet of productivity in Q2 and Q3
§ Targeting
another 200,000 square feet for Q4
§ Strengthened
leasing team and revised compensation structure
§ Bud
Moll as new EVP of Leasing
|
|
§ Proven
Access to Capital
|
§ Equity
Offerings in October 2008 and May 2009
§ Over
$200 million of property refinancings and extensions since 3Q
2008
§ Property
sales
|
|
§ Mitigating
Development Exposure
|
§ Only
two developments under construction
§ Significant
pre-leasing
§ Rent
commencements throughout 2010
§ Anticipated
shadow pipeline costs reduced by over $100
million
|
Information as of
September 30, 2009
COMPANY
OVERVIEW
3
(1) Annualized
base rent represents the monthly contractual rent for September 2009 for each
applicable tenant multiplied by 12.
(2) S&P
credit ratings for parent company as of
11/5/2009.
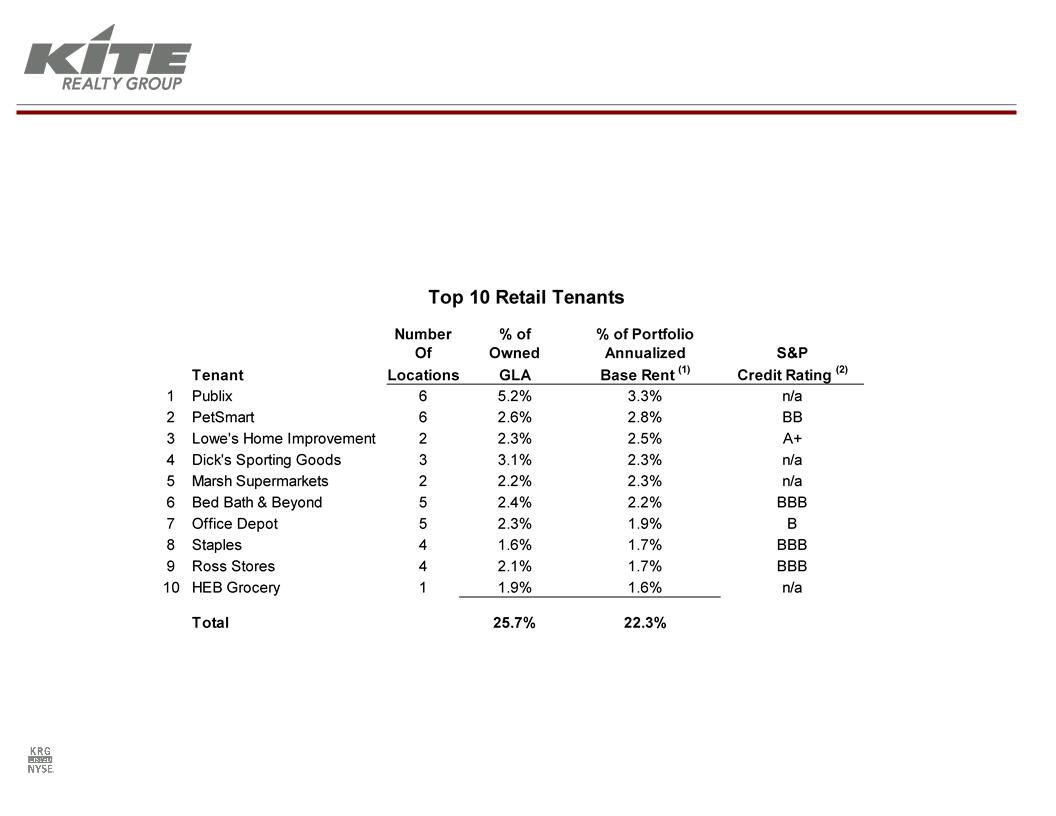
§ Largest
single retail tenant comprises only 3.3% of total annualized base
rent
§ Top
10 retail tenants account for only 22.3% of total annualized base
rent
Information as of
September 30, 2009
DIVERSE
TENANT BASE

4
Peer
Group Assessment:
Top
Tenant as a Percent of Annualized Base Rent
|
Kroger
|
Bed
Bath
Beyond |
Home
Depot |
Publix
|
TJ
Maxx
|
Wal-Mart/
Sam’s |
Kroger
|
Supervalu
|
A&P
|
Publix
|
Giant
Foods |
Source:
Company filings.
Information as of
September 30, 2009
DIVERSE
TENANT BASE
5
Source:
Applied Geographic Solutions.
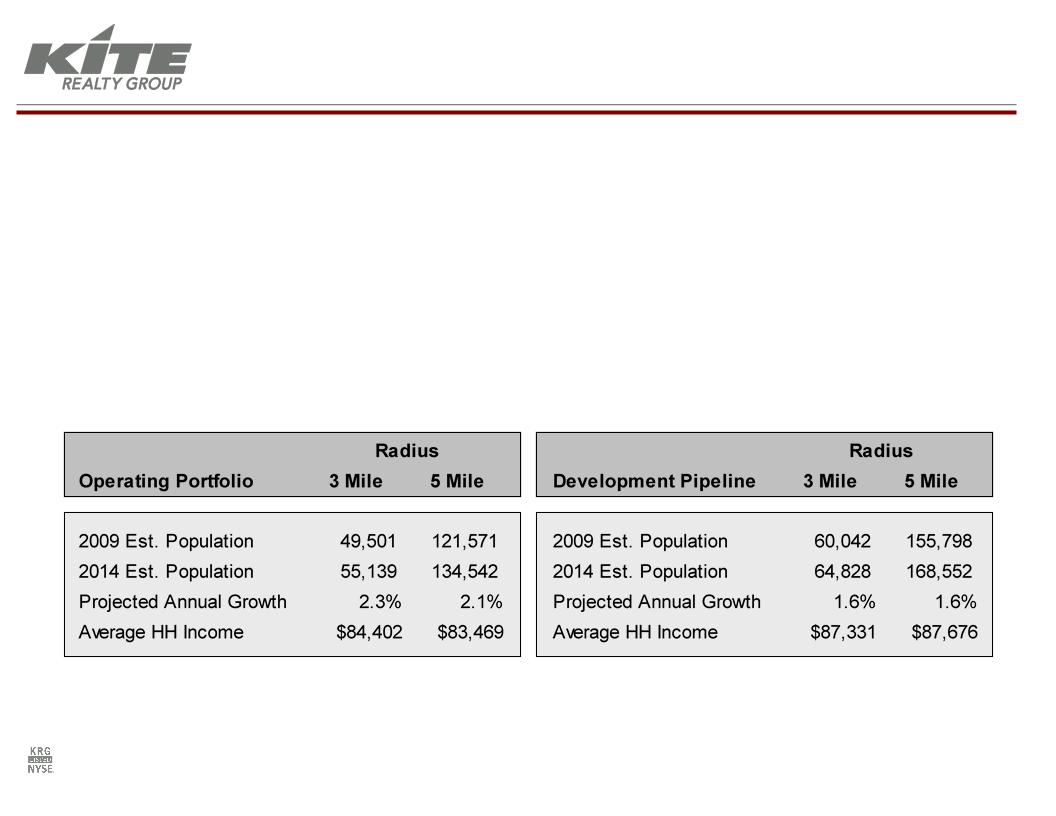
§ High
quality assets with an average age of only eight years
§ Approximately
half of the current portfolio was developed by KRG
§ Portfolio
benefits from 100% non-owned anchor occupancy
§ Strong
household incomes surrounding operating portfolio and development
pipelines
Portfolio
Demographics Comparison
Operating Portfolio
vs. Development Pipelines
STRONG
DEMOGRAPHICS

6
(1) Lease
expirations of operating portfolio and excludes option periods and ground
leases. Annualized base rent represents the monthly contractual rent
for September 2009 for each applicable property multiplied by 12.
for September 2009 for each applicable property multiplied by 12.
§ No
more than 11.0% of total annualized rent is expected to rollover in any one
year
§ Higher
2011-2015 rollover defers renewal negotiations to a potentially
stronger
leasing environment
leasing environment
Percentage
of Lease Expiration by Total Annualized Base Rent (1)
Information as of
September 30, 2009
WELL-STAGGERED LEASE
EXPIRATIONS

7
|
§ Equity
Capital Markets
|
§ $88
million - May 2009 offering net proceeds
§ $48
million - October 2008 offering net proceeds
|
|
§ Unsecured
Term Loan
|
§ $55
million - August 2008 unsecured 3 year term loan
|
|
§ Line
of Credit
|
§ Only $78
million outstanding as of September 30, 2009
§ 2012
maturity date including extension option
|
|
§ Non-Core
Asset Sales
|
§ $11
million - June 2009 ground leased land sales
§ $24
million - December 2008 medical office and non-core shopping center
sale
§ Targeting
$50 million in land sales to end users through 2012
|
|
§ Property
Level Financing
|
§ $200
million in financings/extensions executed from Oct. 2008 through Sept.
2009
§ $29
million construction loan on Eddy Street Commons at Notre Dame in Dec.
2008
|
|
§ The
Result…
|
§ $102
million of cash and availability as of September 30, 2009
§ No
remaining 2009 debt maturities
§ Manageable
$90 million of debt (no CMBS) maturing in 2010
§ 53%
debt to gross assets at 9/30/09 - 900 basis point reduction from
9/30/08
§ 77%
of total debt is fixed rate
§ Only
2 CMBS loans totaling $20 million maturing through
2011
|
PROVEN
ACCESS TO CAPITAL
8
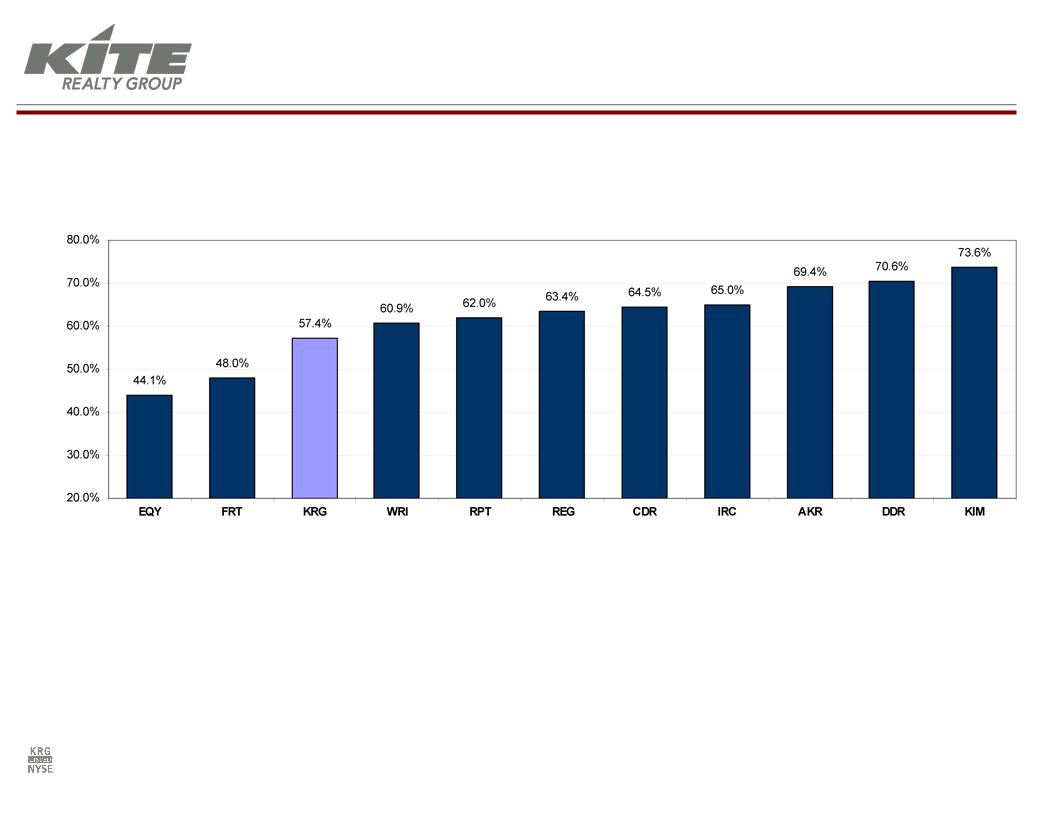
Peer
Group Assessment:
Debt
Plus Preferred as a Percent of Gross Assets
(1) Source: KeyBanc
Capital Markets Leaderboard, 11/9/09.
MANAGING
LEVERAGE

9
Scheduled
Debt Maturities
(1) Maturities
exclude annual principal amortization.
(2) Includes
effects of loan closings, payoffs, and commitments that occurred subsequent to
September 30, 2009.
(3) Amount
due in 2012 includes the outstanding balance on our unsecured revolving credit
facility, and assumes exercise of available extension option.
§ Extended
or refinanced over $200 million in maturing debt since Q3 2008
§ Only
$20 million of CMBS debt maturing through 2011
§ $17
million average loan balance maturing in 2010
§ Approximately
86% of debt maturities through 2012 are held on balance sheet by
relationship
banks including unsecured term loan
banks including unsecured term loan
MANAGING
LEVERAGE

10
§ Only 2 projects in
the Current Development Pipeline
§ Eddy Street Commons
at Notre Dame
§ 72% pre-leased or
committed
§ 67% of projected
costs incurred
§ Tenant openings
commenced September 2009
§ Cobblestone
Plaza
§ 41% pre-leased with
late-stage anchor negotiations
§ 92% of projected
costs incurred
§ Initial tenant rent
commencement occurred 2Q 2009
§ Capital
Summary
(Dollars in
thousands)
§ Eddy Street
Estimated Project Costs: $35,000
§ Cobblestone Plaza
Estimated Project
Costs:
$47,000
§ Total Cost Incurred
as of 9/30/09: ($68,420)
§ Remaining Cost to be
Spent:
$13,580 - Majority
to be funded by existing construction
loans
loans
Current
Development Pipeline
Information as of
September 30, 2009
REDUCING
DEVELOPMENT

11
§ Reduced the
estimated costs of the Shadow Pipeline by over $100 million
§ Capital Summary
(Dollars in
thousands)
KRG Share of
Projected Total Costs as of 12/31/08:
$293,800
KRG Share of
Projected Total Costs as of 9/30/09:
$186,500
Estimated
Cost Reduction: $107,300
§ Focus on ground
leases or land sales to transfer vertical construction costs to end
users
§ Phased development
aligns project scope with market conditions
§ Negotiated removal
of residential and parking garage components of Delray Marketplace
§ Reflects the
Company’s share of Parkside Town Commons at 20% upon commencement of
construction
construction
Shadow
Pipeline
Information as of
September 30, 2009
REDUCING
DEVELOPMENT
12
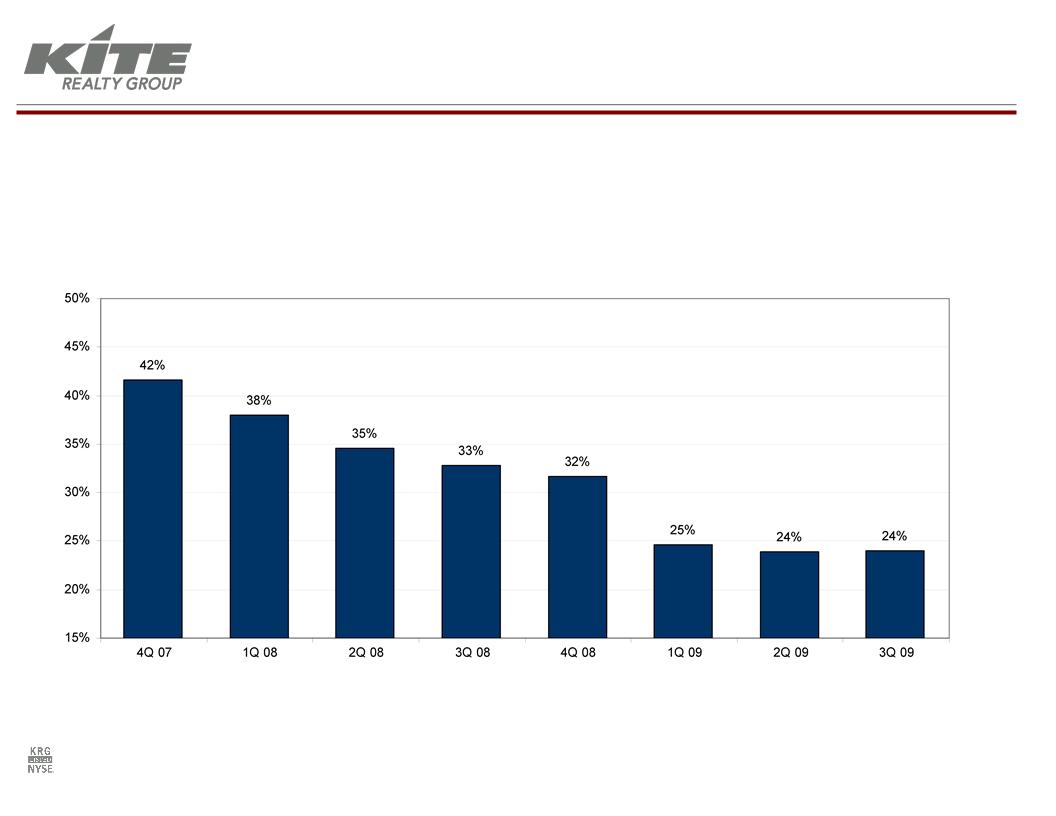
§ Ongoing
effort to reduce the size of our development pipeline.
Total
Development Pipeline as a Percent of Gross Real Estate Assets (1,2)
(1) Development
Pipeline includes Current Developments, Redevelopments and Shadow Pipeline with
the Company’s share of Parkside Town Commons reflected at 20%.
(2) Also
includes unconsolidated Gross Real Estate Assets with the Company’s share of
Parkside Town Commons reflected at 20%.
REDUCING
DEVELOPMENT
13
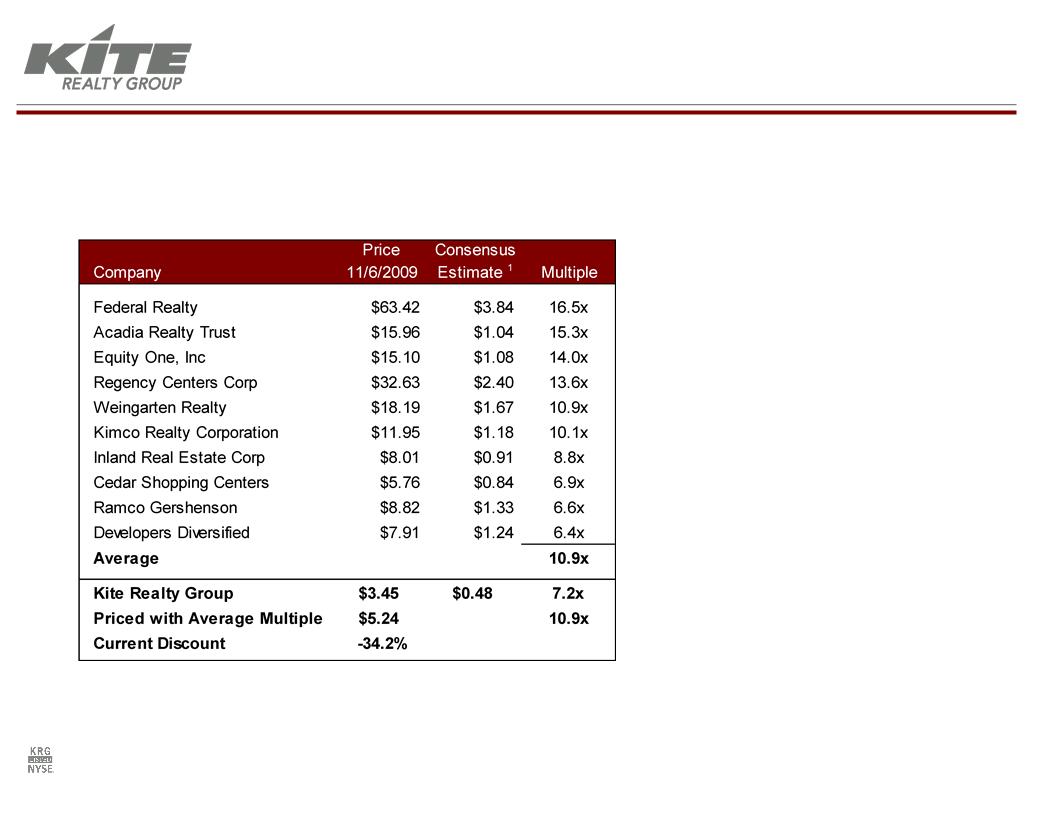
§ Assuming
a peer group average
multiple of 10.9x, our stock is
trading at a 34% discount
multiple of 10.9x, our stock is
trading at a 34% discount
(1) Source: Thomson
mean 2010 estimate as of November 6, 2009.
Peer
Group Assessment:
FFO
Multiple
PEER
GROUP ANALYSIS

14
Peer
Group Assessment:
2009
AFFO PAYOUT RATIO
(1) Source: Company
filings and KeyBanc Capital Markets Leaderboard, 11/9/09.
PEER
GROUP ANALYSIS

15
§ KRG’s
current dividend is fully
funded by free cash flow
funded by free cash flow
§ KRG’s
7.0% yield is 180 basis points
higher than the peer group average
higher than the peer group average
(1) Source: Company
filings.
(2) Source: KeyBanc
Capital Markets Leaderboard, 11/9/09.
Peer
Group Assessment:
Current
Dividend Yield
PEER
GROUP ANALYSIS

16
Peer
Group Analysis:
Implied
Cap Rate
(1) Source: Citigroup
Investment Research, November 5, 2009.
§ Using
the peer group average implied cap rate of 8.0%, KRG is trading at a 52%
discount
§ KRG
Share Price 11/6/09: $3.45
§ KRG
Share Price using 8.0% implied cap rate: $7.25
PEER
GROUP ANALYSIS

17
§ Secure
Off Balance Sheet JV Capital
§ Redeploy
Land Sale Proceeds
§ Lease-Up
of Vacant Junior Boxes
§ Complete
Current Development and Redevelopment Pipelines
§ Utilize
Lender Relationships for First Look at Distressed
Opportunities
Opportunities
GROWTH
STRATEGY

18
DISCLAIMER
This
presentation may include certain “forward-looking statements” within the
meaning
of the Private Securities Litigation Reform Act of 1995. These forward-looking
statements include, but are not limited to, our plans, objectives, expectations and
intentions and other statements contained in this document that are not historical facts
and statements identified by words such as “expects, “anticipates,” “intends,” “plans,”
“believes,” “seeks,” “estimates” or words of similar meaning. These statements are
based on our current beliefs or expectations and are inherently subject to significant
uncertainties and changes in circumstances, many of which are beyond our control.
Actual results may differ materially from these expectations due to changes in global
political, economic, business, competitive, market and regulatory risk factors.
Information concerning risk factors that could affect Kite Realty Group Trust’s actual
results is contained in the Company’s reports filed from time to time with the Securities
and Exchange Commission, including its 2008 Annual Report on Form 10-K and its
quarterly reports on Form 10-Q. Kite Realty Group Trust does not undertake any
obligation to update any forward-looking statements contained in this document, as a
result of new information, future events or otherwise.
