Attached files
| file | filename |
|---|---|
| 8-K - CSC FORM 8K 11112009 - COMPUTER SCIENCES CORP | csc8k_11112009.htm |
| EX-99.1 - EARNINGS RELEASE (FURNISHED HEREWITH) - COMPUTER SCIENCES CORP | exhibit99-1_11112009.htm |

*
2nd
QUARTER FY 2010
EARNINGS PRESENTATION
EARNINGS PRESENTATION
November 11,
2009

2nd
QUARTER FY 2010 EARNINGS PRESENTATION
*
All
written or oral statements made by CSC at this meeting or in these
presentation materials that do not directly and exclusively relate to
historical facts constitute “forward-looking statements” within the
meaning of the Private Securities Litigation Reform Act of 1995.
These statements represent CSC’s expectations and beliefs, and no
assurance can be given that the results described in such statements will
be achieved. These statements are subject to risks, uncertainties, and
other factors, many outside of CSC’s control, that could cause actual
results to differ materially from the results described in such statements.
For a description of these factors, please see CSC’s most recent Annual
Report on Form 10-K, and subsequently filed Form 10-Qs.

2nd
QUARTER FY 2010 EARNINGS PRESENTATION
*
This
presentation includes certain non-GAAP financial measures, such as
operating income, operating margin, operating costs, and free cash flow.
These non-GAAP financial measures are not meant to be considered in
isolation or as a substitute for results prepared in accordance with
accounting principles generally accepted in the United States (GAAP). A
reconciliation of non-GAAP financial measures included in this
presentation to the most directly comparable financial measure
calculated and presented in accordance with GAAP is set forth
elsewhere in this presentation and on our web site at www.csc.com.
CSC management believes that these non-GAAP financial measures
provide useful information to investors regarding the Company's
financial condition and results of operations as they provide another
measure of the Company's profitability and ability to service its debt, and
are considered important measures by financial analysts covering CSC
and its peers.
*
2nd
QUARTER FY 2010 EARNINGS
2nd
QUARTER FY 2010 EARNINGS PRESENTATION
*
Financial
and Operational Performance Scorecard
|
Earnings
per Share
|
|
|
Operating
Margin
|
|
|
Free
Cash Flow
|
|
|
Revenue
|
|
|
Operational
Performance
|
|
|
New
Business Bookings
|
|
2nd
QUARTER FY 2010 EARNINGS PRESENTATION
*
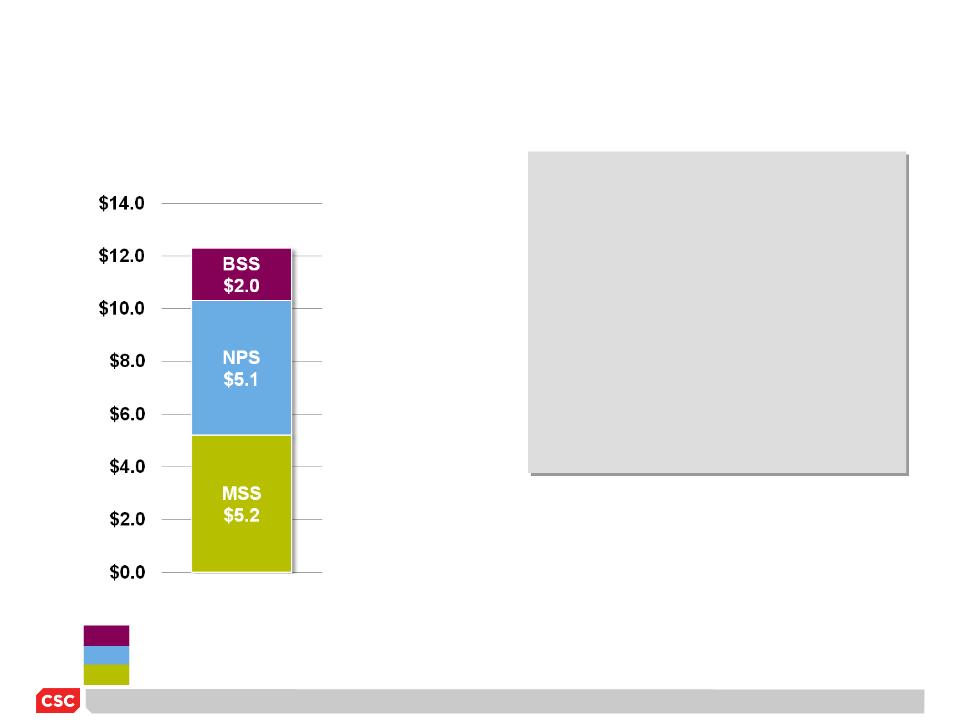
New
Business Bookings by Lines of Business
North
American Public Sector
NPS
Business
Solutions and Services
BSS
Managed
Services Sector
MSS
• DOE Hanford/Lockheed
Martin
• Nobel
Biocare
• Raytheon
• TSA
ITIP
• UK Atomic
Energy
• UK Identity and
Passport Service
• Xerox Business
Services
• Zurich Financial
Services*
|
$B
|
|
YTD
November
|
|
$12.3B
|
*Down
selected for negotiations

2nd
QUARTER FY 2010 EARNINGS PRESENTATION
*
Reaffirming
Full Year Guidance
MSS
growth based on
bookings and recovering
demand
bookings and recovering
demand
Lift
for BSS from an
improving demand for
discretionary projects
improving demand for
discretionary projects
Returning
to historic rates
of
growth for NPS
Increased
demand as
clients budget for CY10
and return to
transformational agendas
clients budget for CY10
and return to
transformational agendas
Business
Outlook for Second Half FY10:
Anticipated Improvements…
Anticipated Improvements…
Business
Outlook
2010
Outlook
2010

*
Mike
Mancuso
Vice President
Chief Financial Officer
Vice President
Chief Financial Officer
2nd
QUARTER FY 2010 EARNINGS

2nd
QUARTER FY 2010 EARNINGS PRESENTATION
*
2nd
Quarter FY 2010 Financial Accomplishments
• Significant new
business awards
• Sequential revenue
stability
• Operating income
growth
• Margin rate
improvement
• Achievement of
forecasted EPS
• Strong cash
generation
2nd
QUARTER FY 2010 EARNINGS PRESENTATION
*
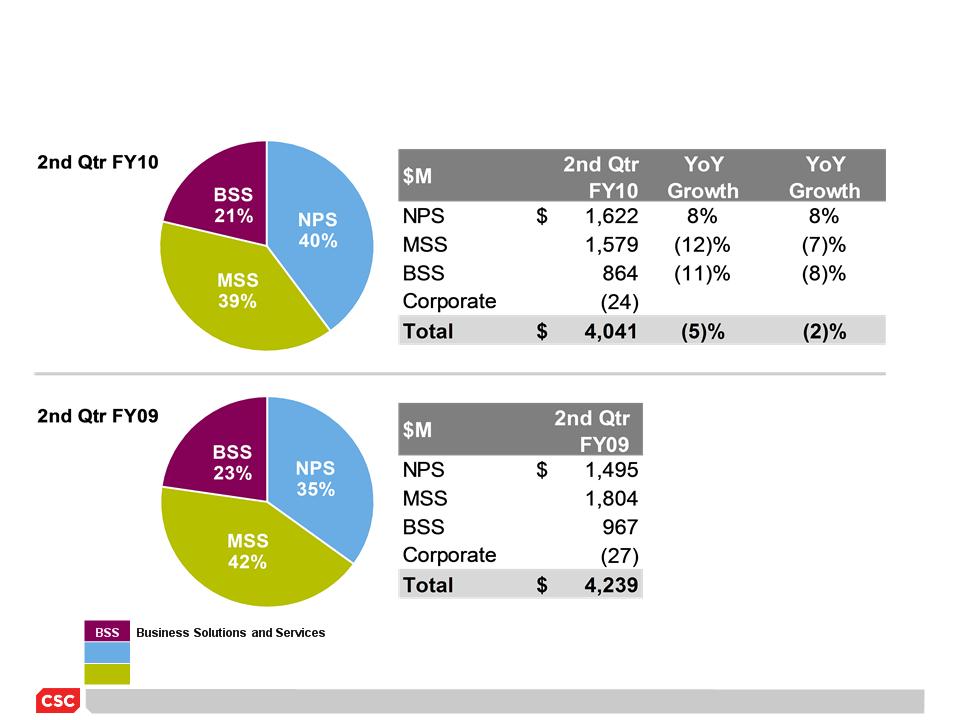
Revenue
by Lines of Business
FY09
reflects realignment for operating segments
North
American Public Sector
Managed
Services Sector
NPS
MSS
2nd
QUARTER FY 2010 EARNINGS PRESENTATION
*
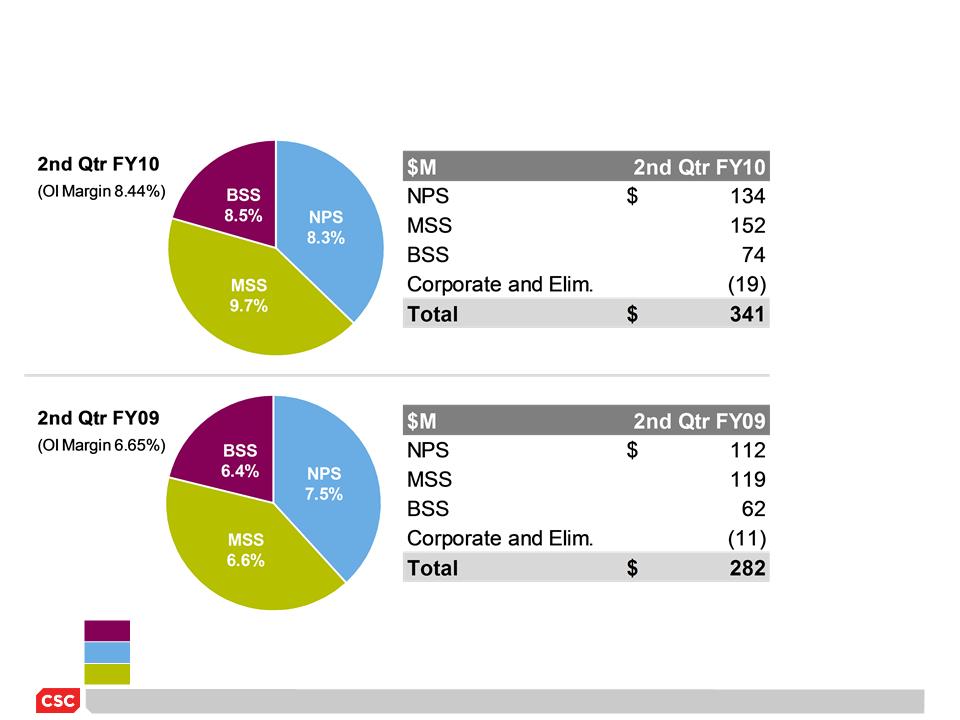
Operating
Income by Lines of Business
North
American Public Sector
Business
Solutions and Services
Managed
Services Sector
NPS
BSS
MSS
FY09
reflects realignment for operating segments
2nd
QUARTER FY 2010 EARNINGS PRESENTATION
*
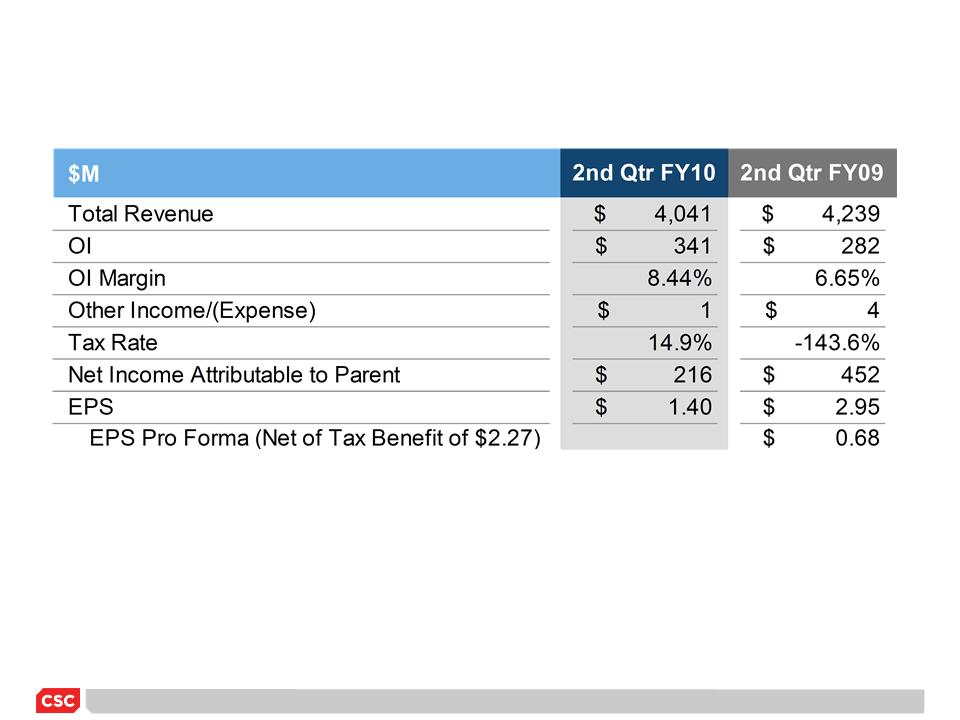
Selected
Financial Information
2nd
QUARTER FY 2010 EARNINGS PRESENTATION
*
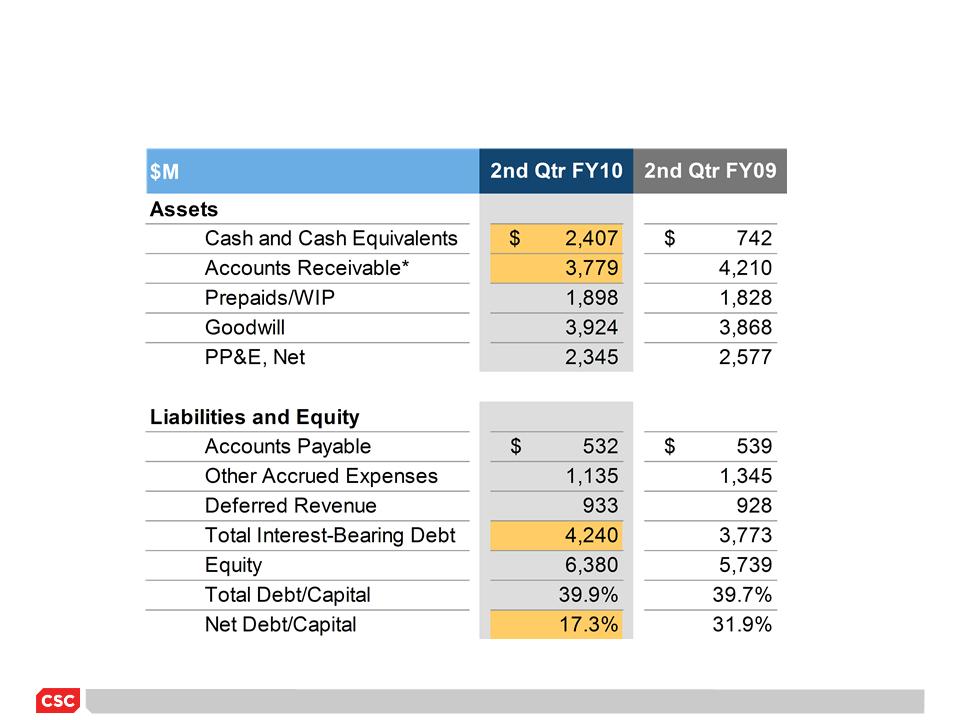
Selected
Balance Sheet Items
*Accounts
receivable excludes tax receivables of $71M and $34M for FY10 and FY09,
respectively
2nd
QUARTER FY 2010 EARNINGS PRESENTATION
*
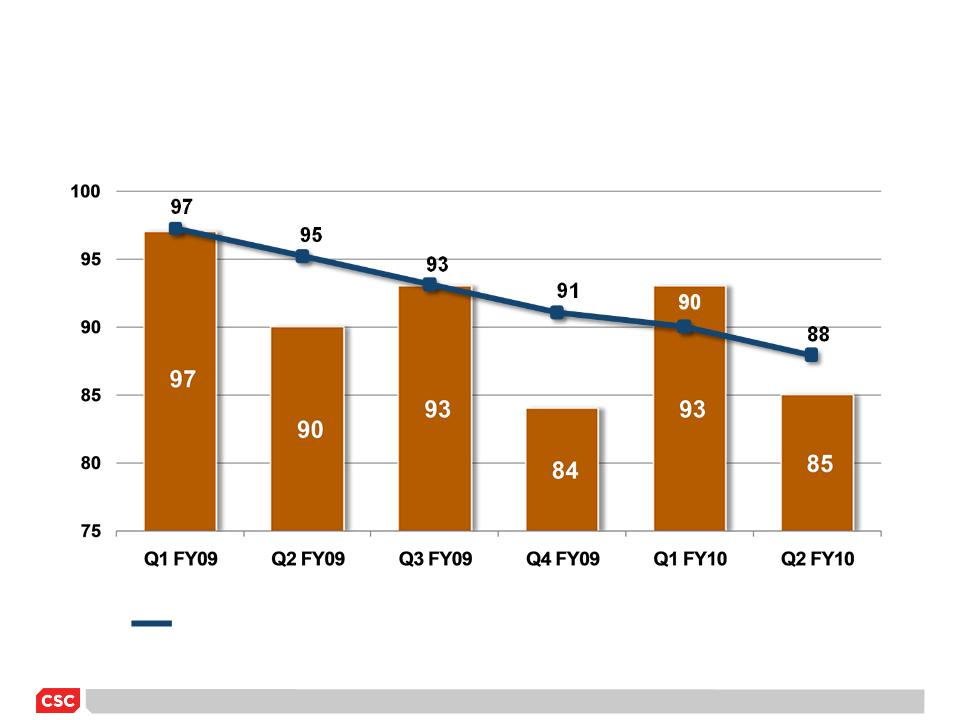
Days
Sales Outstanding (DSO)*
*DSO
excludes tax receivables
Four
Quarter DSO Average
Days
2nd
QUARTER FY 2010 EARNINGS PRESENTATION
*
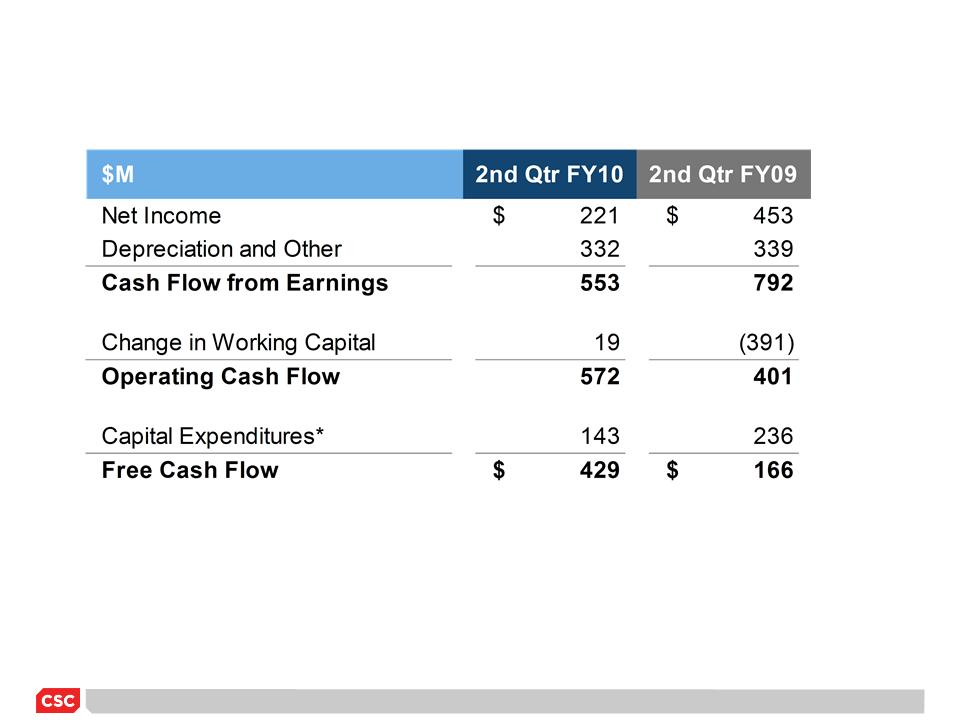
Selected
Cash Flow Items
*Capital
expenditures figures include capital lease payments and exclude cash
used/received for acquisitions/dispositions
2nd
QUARTER FY 2010 EARNINGS PRESENTATION
*
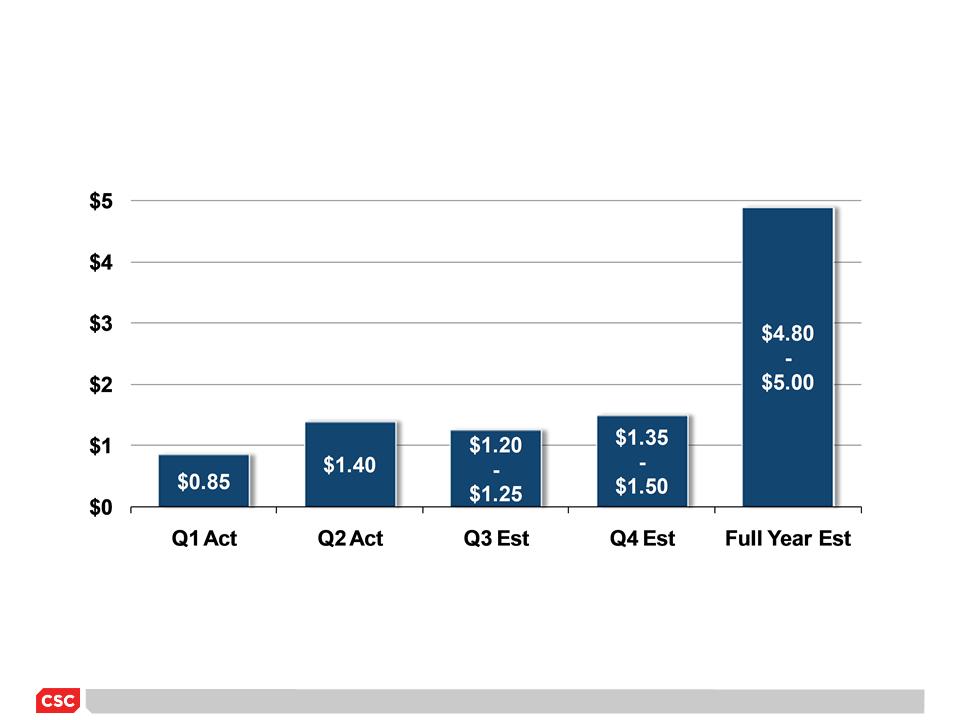
Earnings
per Share (EPS)

2nd
QUARTER FY 2010 EARNINGS PRESENTATION
*
Summary
FY 2010 Guidance
Positive
performance in 1st half provides confidence
in
delivery of full year guidance
• EPS between $4.80
and $5.00
• New Business
Bookings in the range of $17B to $18B
• Revenue in the range
of $16.0B to $16.5B
• Free Cash Flow
performance of 90% to 100% of net income
• Operating Margin
Improvement of 25 to 50 BPS

*
Supplemental
Information
Information
2nd
QUARTER FY 2010 EARNINGS
2nd
QUARTER FY 2010 EARNINGS PRESENTATION
*
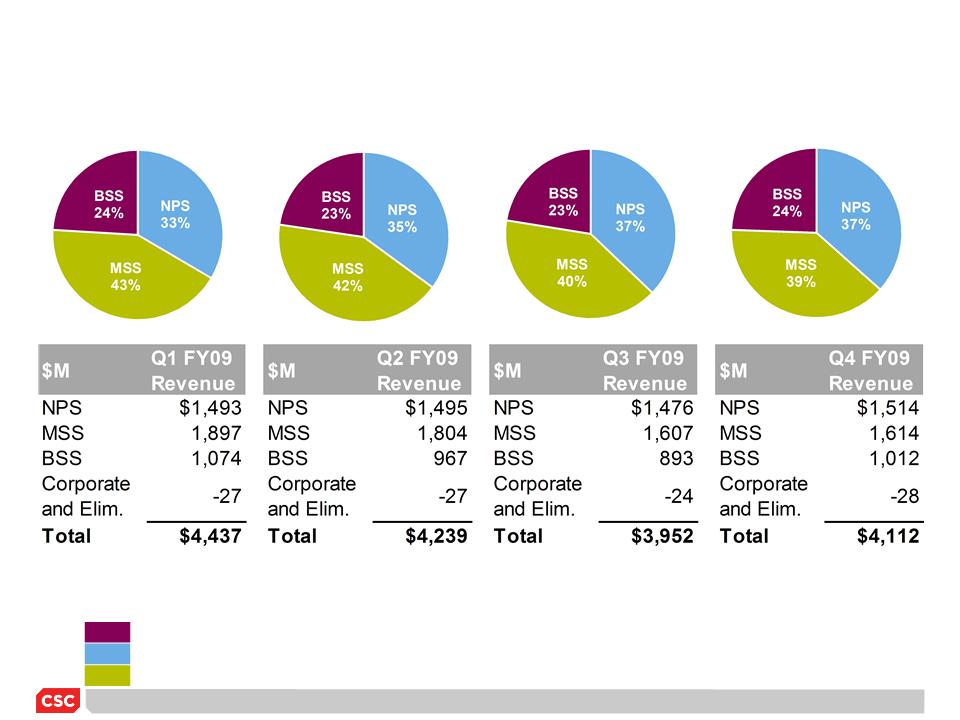
FY09
Revenue by Lines of Business*
*
Percentages exclude corp. and other eliminations
FY09
reflects realignment for operating segments
North
American Public Sector
Business
Solutions and Services
Managed
Services Sector
NPS
BSS
MSS
2nd
QUARTER FY 2010 EARNINGS PRESENTATION
*
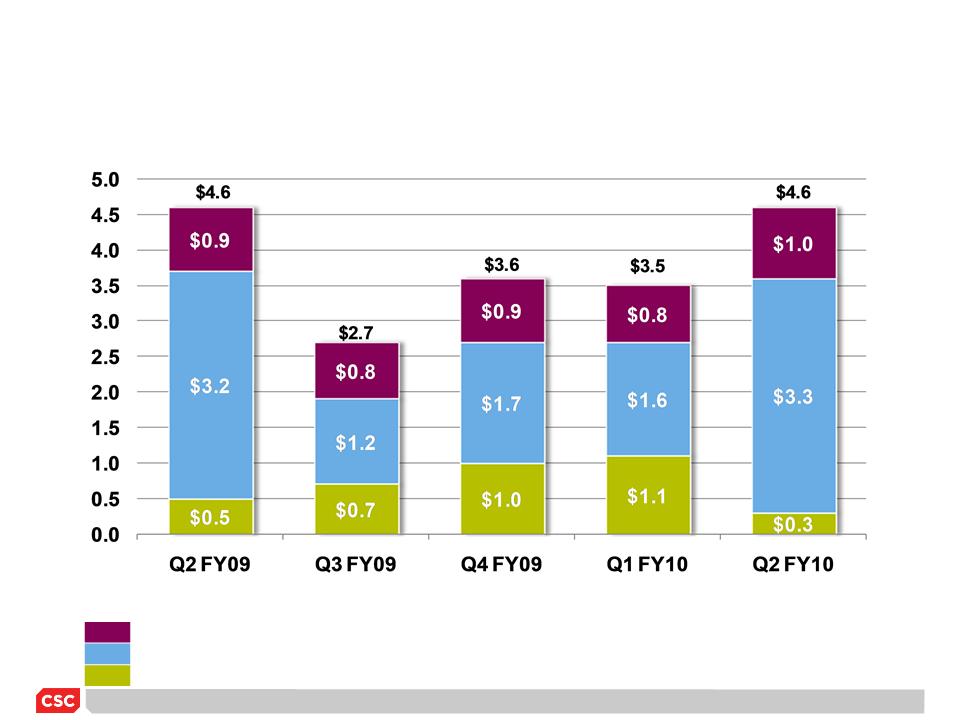
New
Business Bookings
$B
FY09
reflects realignment for operating segments
North
American Public Sector
Business
Solutions and Services
Managed
Services Sector
NPS
BSS
MSS
2nd
QUARTER FY 2010 EARNINGS PRESENTATION
*
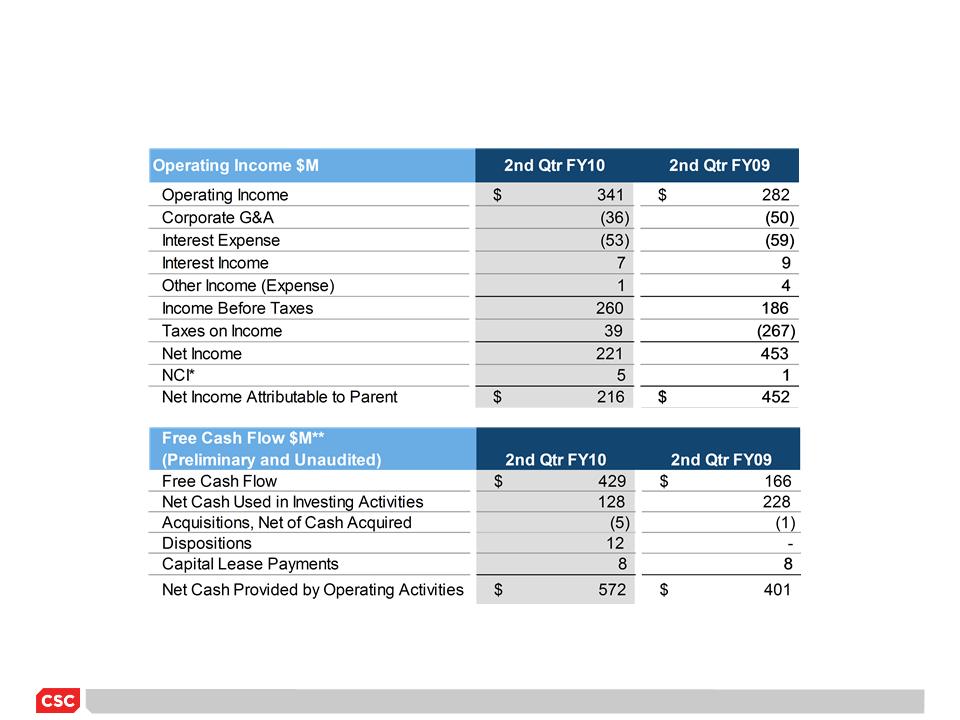
Non-GAAP
Reconciliation
*NCI:
Net Income Attributable to Non-Controlling Interest Net of Tax
**Capital lease
payments and proceeds from the sale of P&E (included in investing
activities)
are included in the calculation of Free Cash Flow
are included in the calculation of Free Cash Flow
2nd
QUARTER FY 2010 EARNINGS PRESENTATION
*
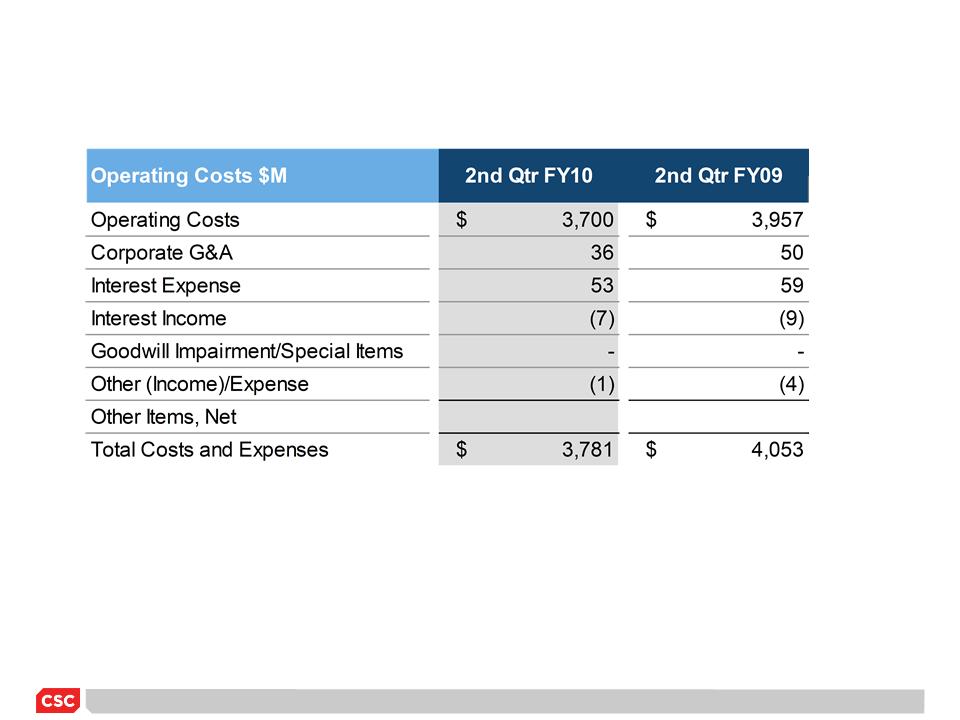
Non-GAAP
Reconciliation (Cont’d)
2nd
QUARTER FY 2010 EARNINGS PRESENTATION
*
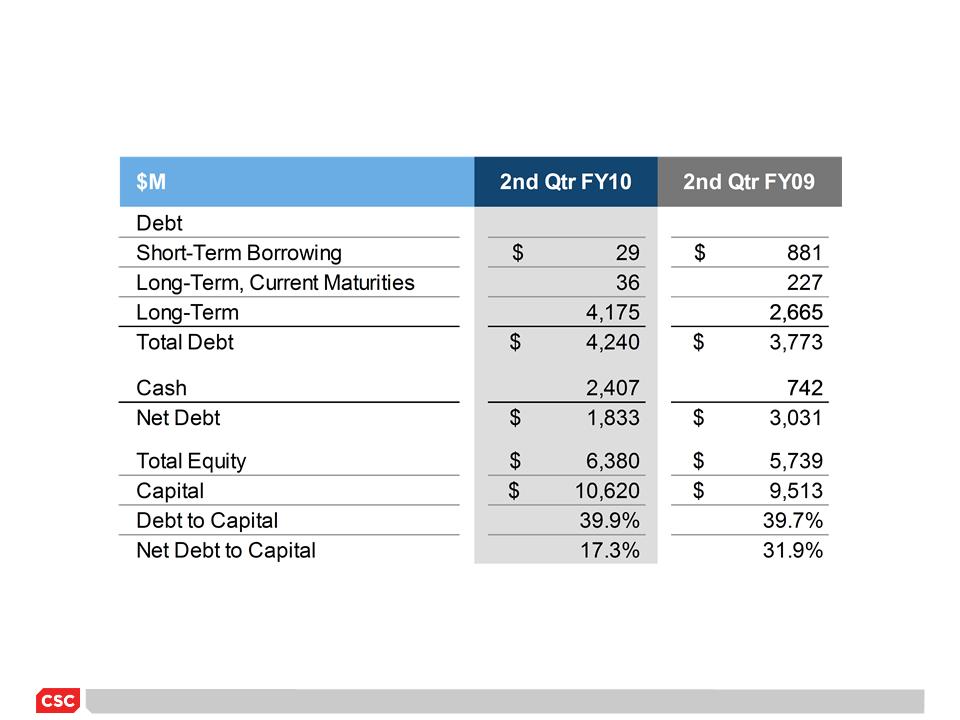
Net
Debt Reconciliation
2nd
QUARTER FY 2010 EARNINGS PRESENTATION
*
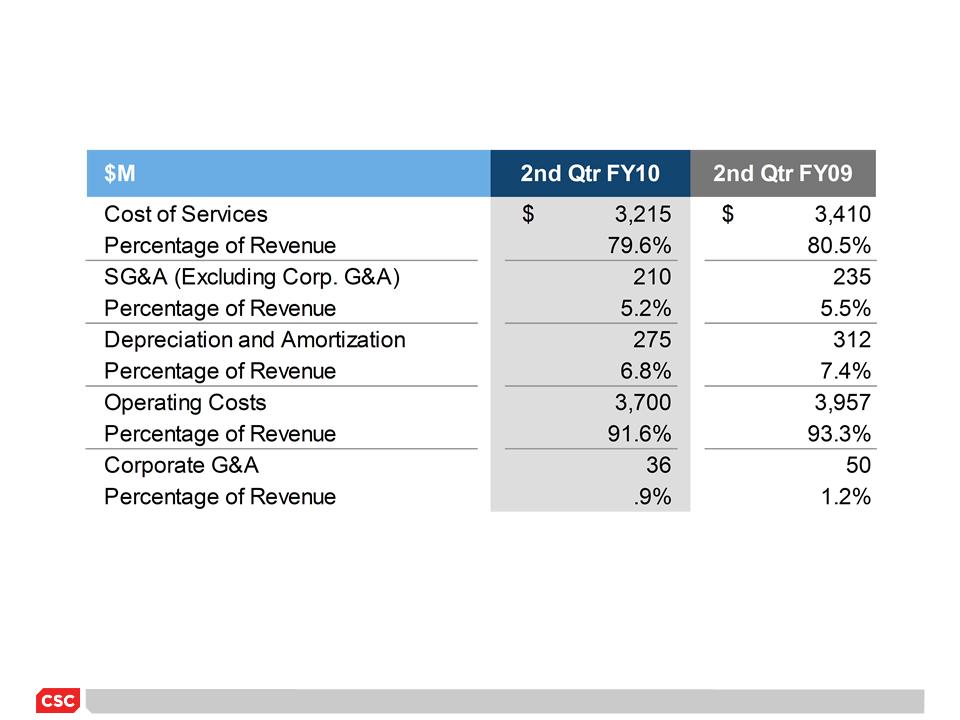
Components
of Operating Costs

2nd
QUARTER FY 2010 EARNINGS PRESENTATION
*
Non-GAAP
and Other Definitions
• Operating
Cost: Equal to the sum of
(1) cost of services, (2) business units
SG&A, (3) depreciation and amortization
SG&A, (3) depreciation and amortization
• Operating
Income: Revenue minus
operating cost
• Operating
Income Margin: Operating Income as
a percentage of revenue
• DSO:
Total
receivables at quarter end divided by revenue per day. Revenue per
day equals total revenues for the last quarter divided by the number of days in the
fiscal quarter. Total receivables includes unbilled receivables but excludes tax
receivables
day equals total revenues for the last quarter divided by the number of days in the
fiscal quarter. Total receivables includes unbilled receivables but excludes tax
receivables
• Free
Cash Flow: Equal to the sum of
(1) operating cash flows, (2) investing cash
flows, excluding business acquisitions and dispositions, purchase, or sale of
available for sale securities, and (3) capital lease payments
flows, excluding business acquisitions and dispositions, purchase, or sale of
available for sale securities, and (3) capital lease payments
• Net
Debt: Calculated as the
sum of long-term and short-term debt, less cash and
marketable securities
marketable securities
• Net
Debt to Capital: Calculated as the
ratio of net debt to capital (total debt
plus equity)
plus equity)
2nd
QUARTER FY 2010 EARNINGS PRESENTATION
*