Attached files
| file | filename |
|---|---|
| 8-K - FORM 8-K - Beneficial Mutual Bancorp Inc | t66609_8k.htm |
Exhibit 99.1
Investor Presentation
Beneficial Mutual Bancorp, Inc. (MHC)
NASDAQ: BNCL
November 12, 2009
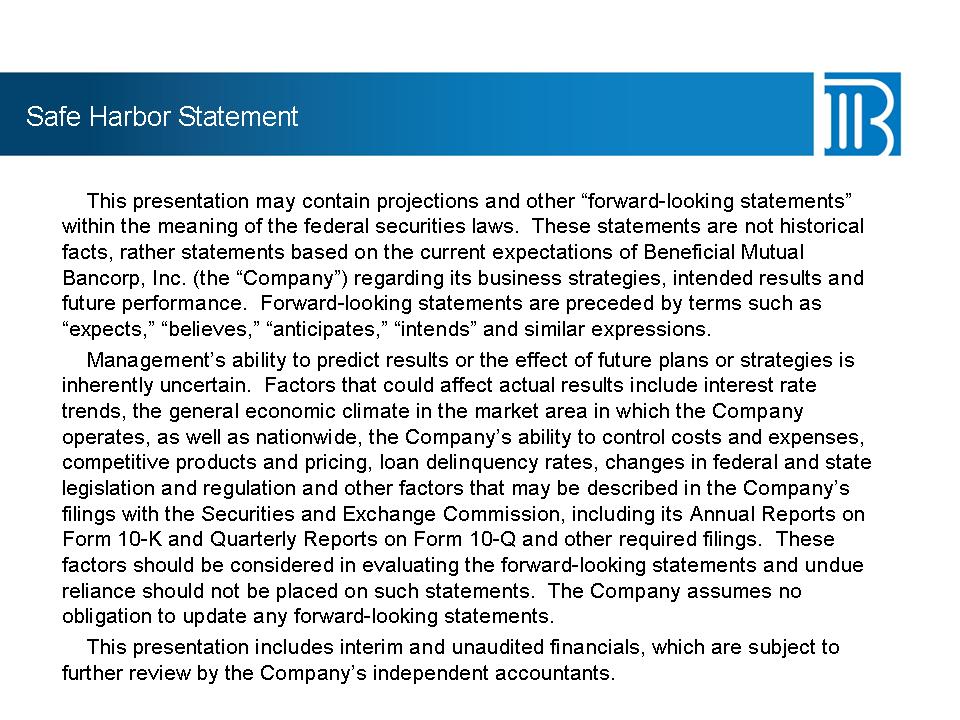
Safe Harbor Statement This presentation may contain projections and other “forward-looking statements” within the meaning of the federal securities laws. These statements are not historical facts, rather statements based on the current expectations of Beneficial Mutual Bancorp, Inc. (the “Company”)
regarding its business strategies, intended results and future performance. Forward-looking statements are preceded by terms such as “expects,” “believes,” “anticipates,” “intends” and similar expressions. Management’s ability to predict results or the effect of future plans or strategies is inherently uncertain. Factors that could affect actual results include interest rate trends, the general economic climate in the market area in which the Company operates,
as well as nationwide, the Company’s ability to control costs and expenses, competitive products and pricing, loan delinquency rates, changes in federal and state legislation and regulation and other factors that may be described in the Company’s filings with the Securities and Exchange Commission, including its Annual Reports on Form 10-K and Quarterly Reports on Form 10-Q and other required filings. These factors should be considered in evaluating the forward-looking statements and undue reliance
should not be placed on such statements. The Company assumes no obligation to update any forward-looking statements. This presentation includes interim and unaudited financials, which are subject to further review by the Company’s independent accountants.
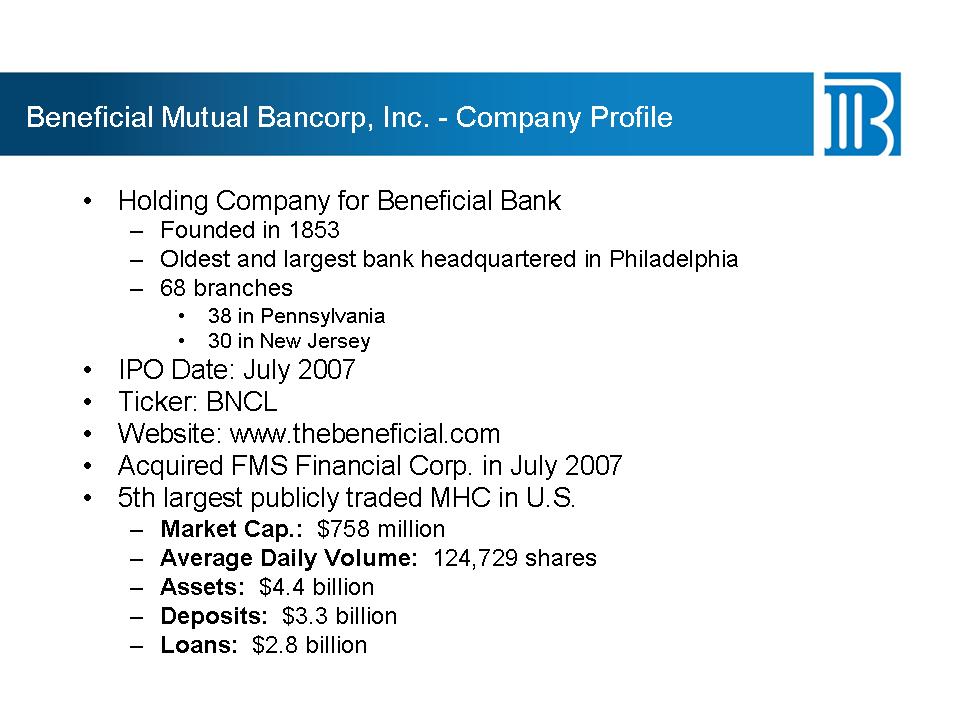
Beneficial Mutual Bancorp, Inc. -Company Profile
• Holding Company for Beneficial Bank
– Founded in 1853
– Oldest and largest bank headquartered in Philadelphia
– 68 branches
• 38 in Pennsylvania
• 30 in New Jersey
• IPO Date: July 2007
• Ticker: BNCL
• Website: www.thebeneficial.com
• Acquired FMS Financial Corp. in July 2007
• 5th largest publicly traded MHC in U.S.
– Market Cap.: $758 million
– Average Daily Volume: 124,729 shares
– Assets: $4.4 billion
– Deposits: $3.3 billion
– Loans: $2.8 billion
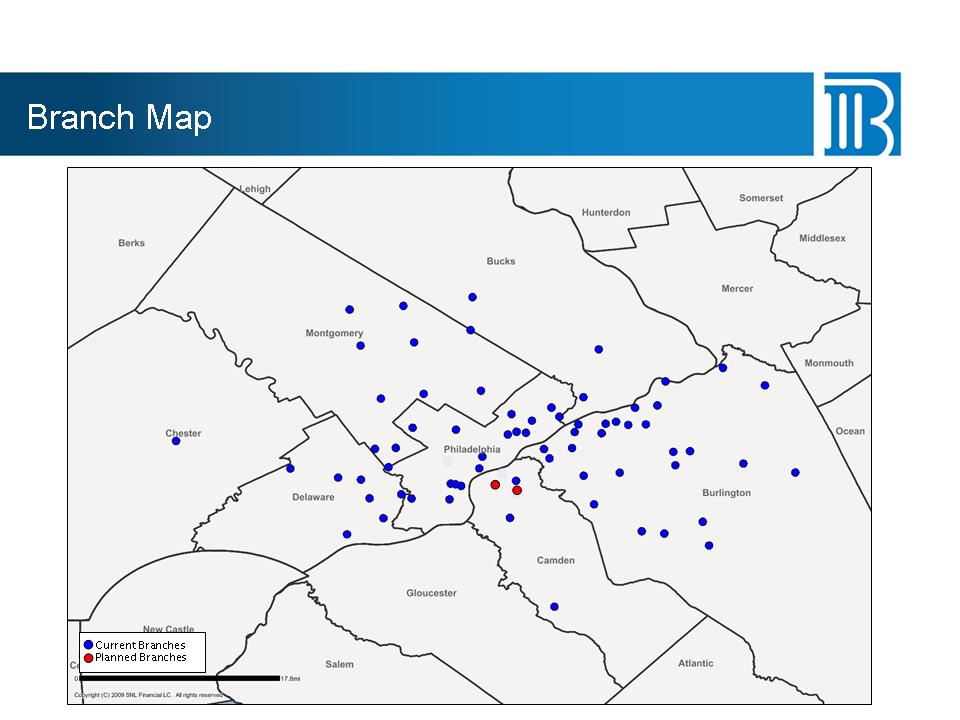
Branch Map
Current Branches
Planned Branches
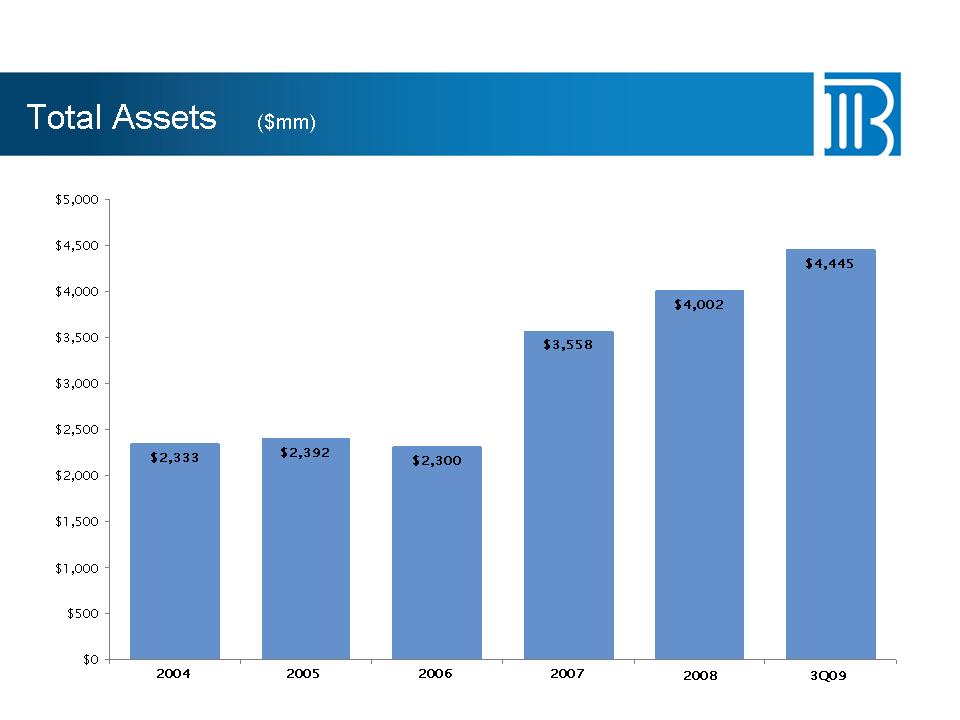
Total Assets ($mm) $2,392 $2,300 $3,558 $4,002 $4,445 $2,333 $0 $500 $1,000 $1,500 $2,000 $2,500 $3,000 $3,500 $4,000 $4,500 $5,000 2004 2005 2006 2007 2008 3Q09
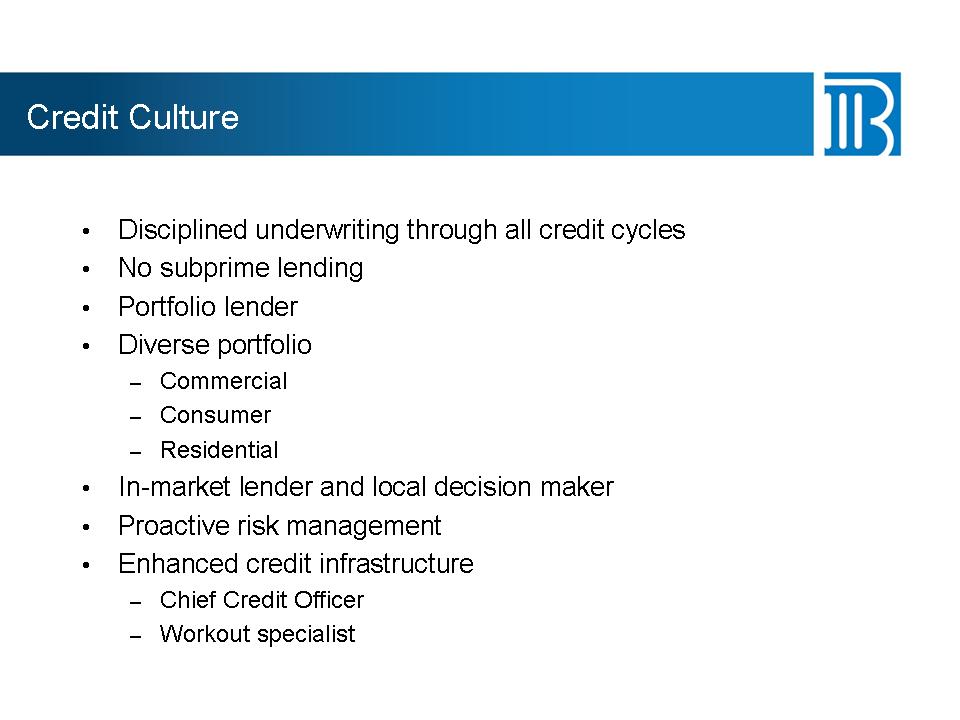
Credit Culture
• Disciplined underwriting through all credit cycles
• No subprime lending
• Portfolio lender
• Diverse portfolio
– Commercial
– Consumer
– Residential
• In-market lender and local decision maker
• Proactive risk management
• Enhanced credit infrastructure
– Chief Credit Officer
– Workout specialist
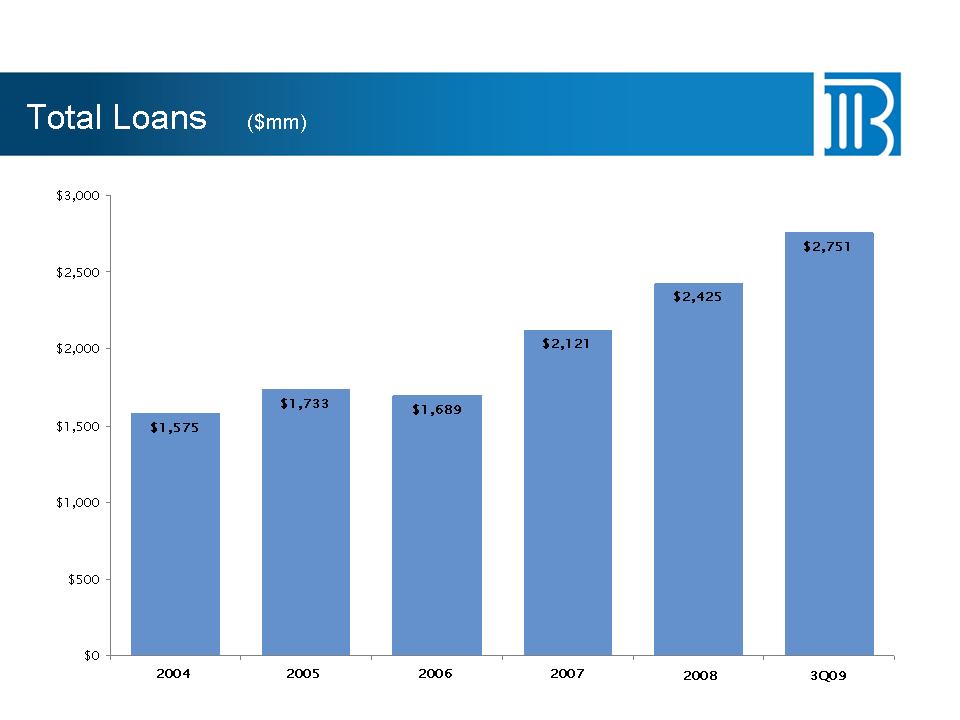
$1,733 $1,689 $2,121 $2,425 $2,751 $1,575 $0 $500 $1,000 $1,500 $2,000 $2,500 $3,000 Total Loans ($mm) 2004 2005 2006 2007 2008 3Q09
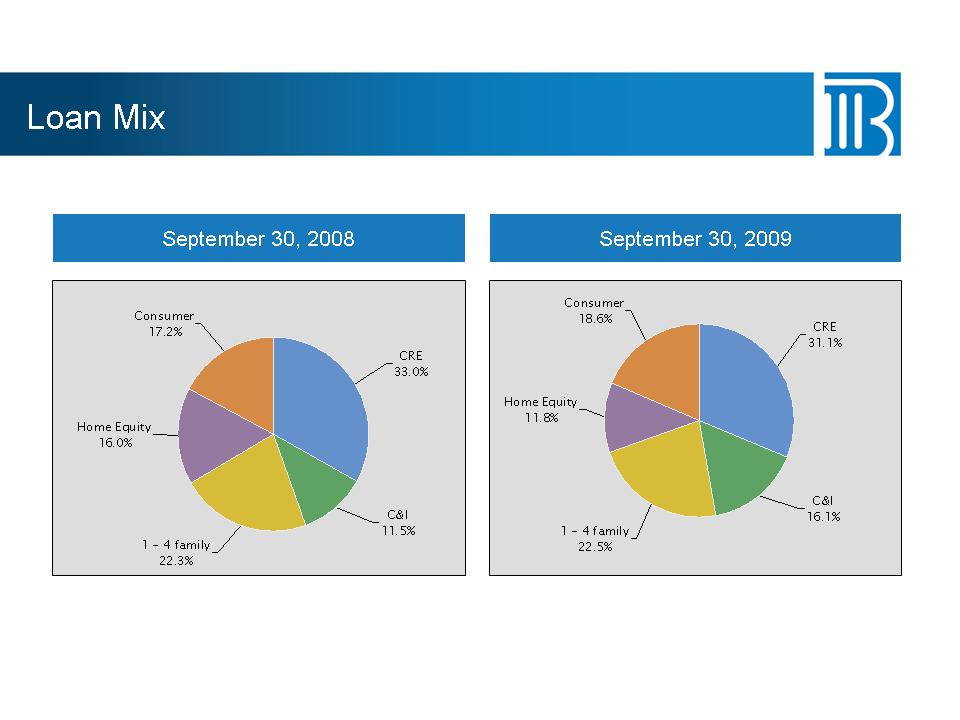
Loan Mix CRE 33.0% 1 - 4 family 22.3% Home Equity 16.0% C&I 11.5% Consumer 17.2% September 30, 2009 Consumer 18.6% C&I 16.1% Home Equity11.8% 1 - 4 family22.5% CRE 31.1% September 30, 2008
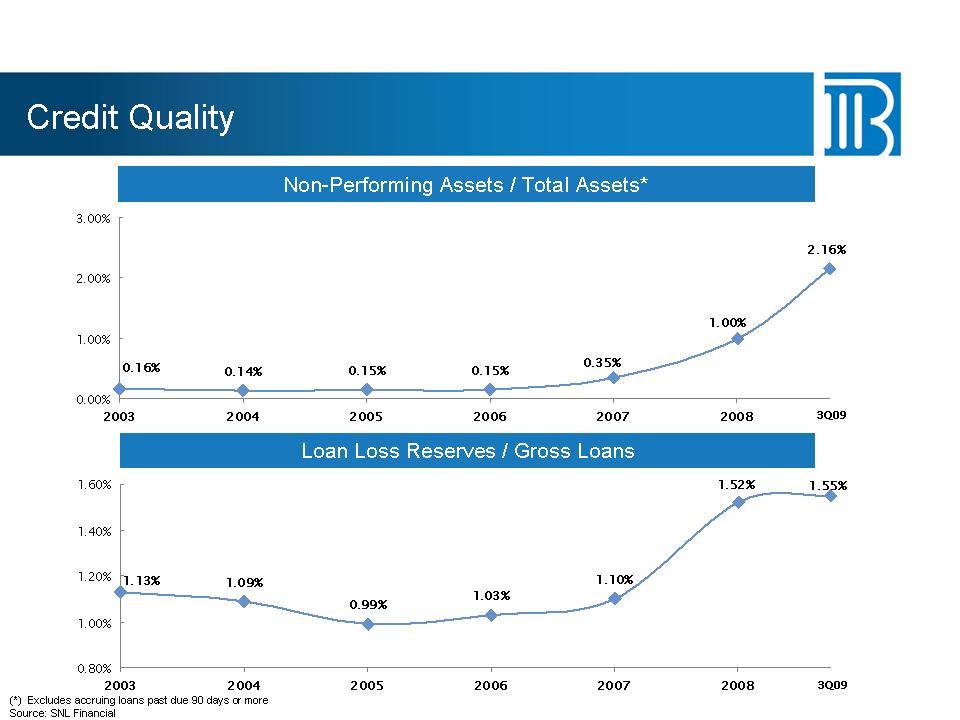
Credit Quality 0.14% 0.15% 0.15% 2.16% 1.00% 0.35% 0.16% 0.00% 1.00% 2.00% 3.00% 2003 2004 2005 2006 2007 2008 1.09% 0.99% 1.03% 1.10% 1.55% 1.52% 1.13% 0.80% 1.00% 1.20% 1.40% 1.60% 2003 2004 2005 2006 2007 2008 Non-Performing Assets / Total Assets* Loan Loss Reserves / Gross Loans 3Q09 3Q09 (*) Excludes accruing loans
past due 90 days or more Source: SNL Financial
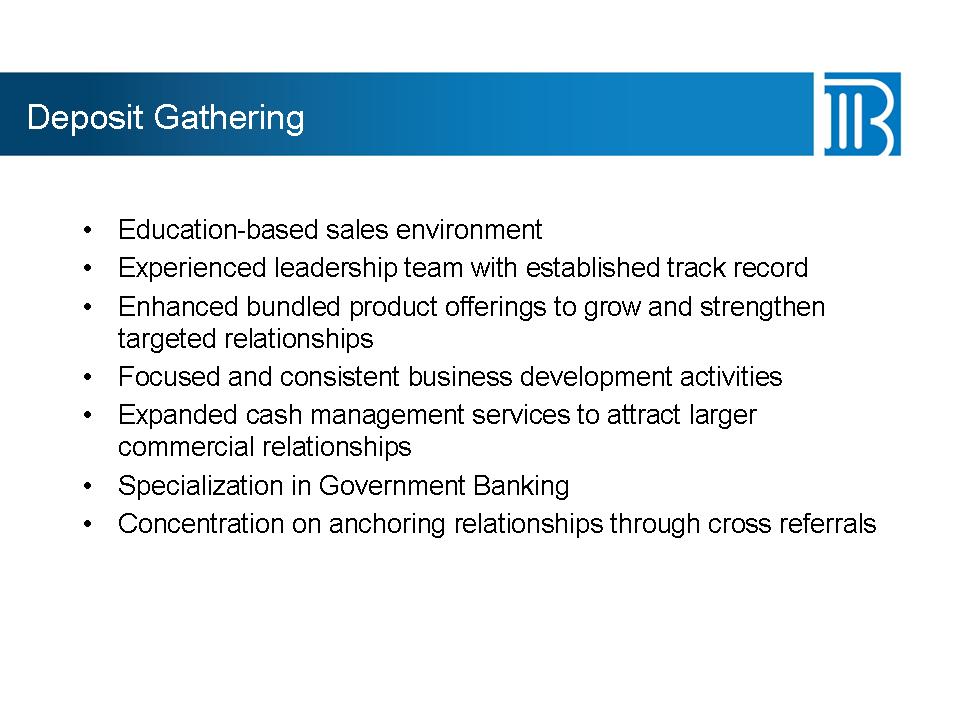
Deposit Gathering • Education-based sales environment • Experienced leadership team with established track record • Enhanced bundled product offerings to grow and strengthen targeted relationships • Focused and consistent business development activities • Expanded cash management services
to attract larger commercial relationships • Specialization in Government Banking • Concentration on anchoring relationships through cross referrals
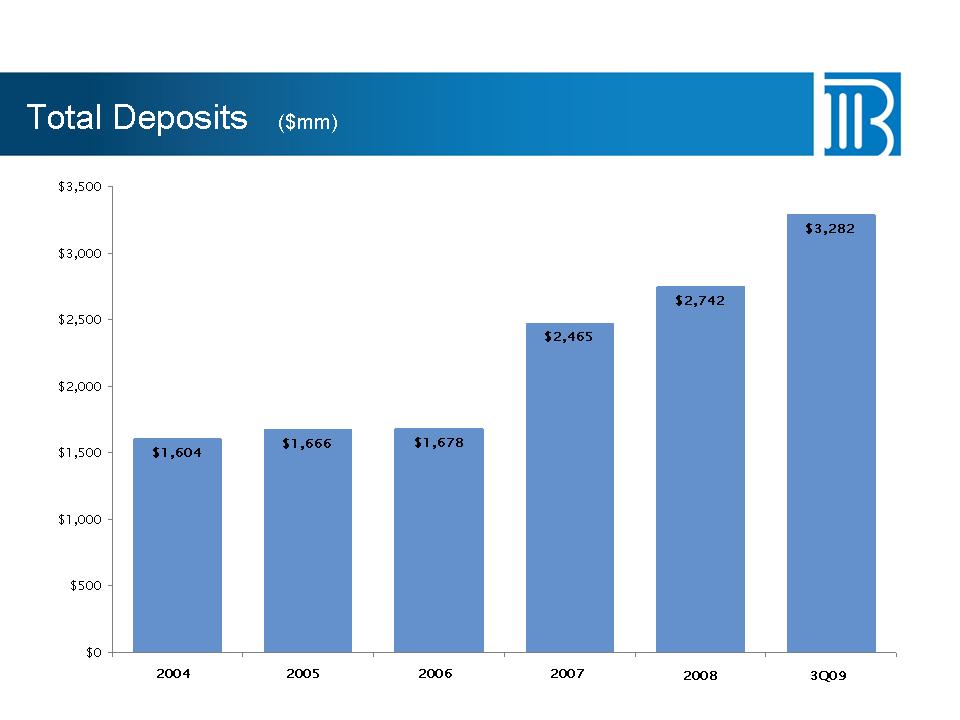
$1,666 $1,678 $2,465 $2,742 $3,282 $1,604 $0 $500 $1,000 $1,500 $2,000 $2,500 $3,000 $3,500 Total Deposits ($mm) 2004 2005 2006 2007 2008 3Q09
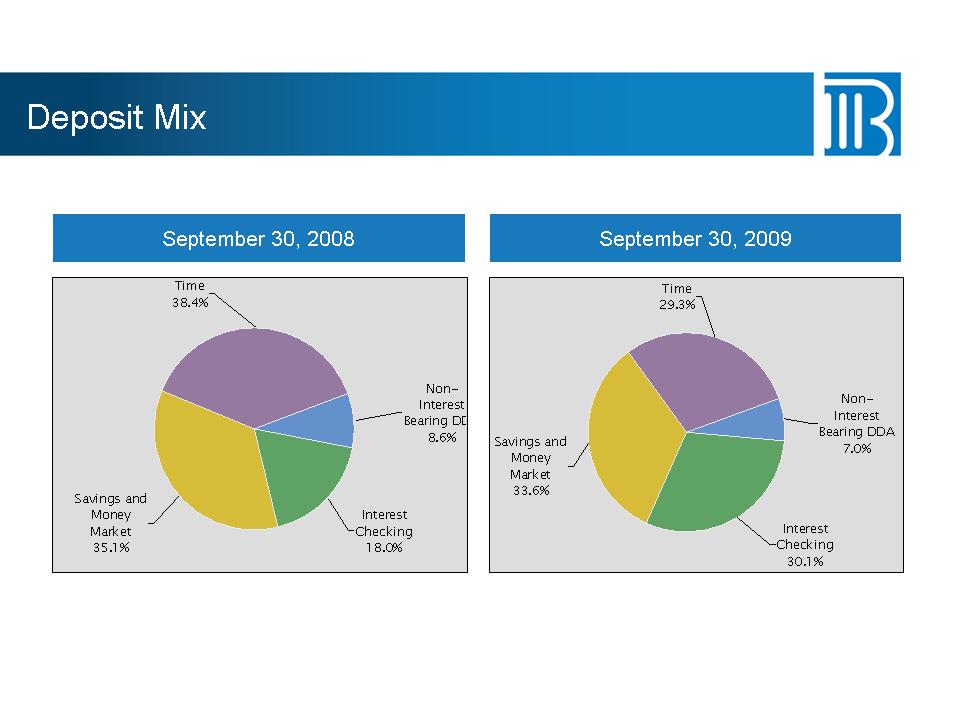
Deposit Mix Non-Interest Bearing DD 8.6% Savings and Money Market 35.1% Time 38.4% Interest Checking 18.0% Non-Interest Bearing DDA 7.0% Savings and Money Market 33.6% Time 29.3% Interest Checking 30.1% September 30, 2009September 30, 2008
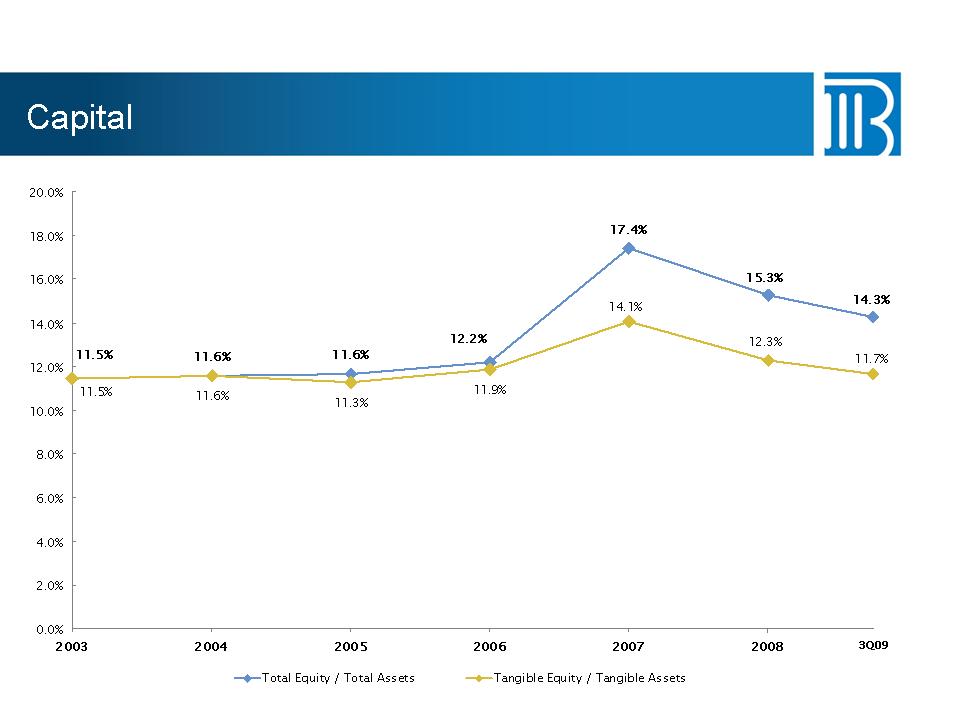
Capital 11.6% 11.6% 17.4% 11.6% 11.3% 11.9% 12.2% 14.3% 15.3% 11.5% 11.7% 12.3% 14.1% 11.5% 0.0% 2.0% 4.0% 6.0% 8.0% 10.0% 12.0% 14.0% 16.0% 18.0% 20.0% 2003 2004 2005 2006 2007 2008 Total Equity / Total Assets Tangible Equity / Tangible Assets 3Q09
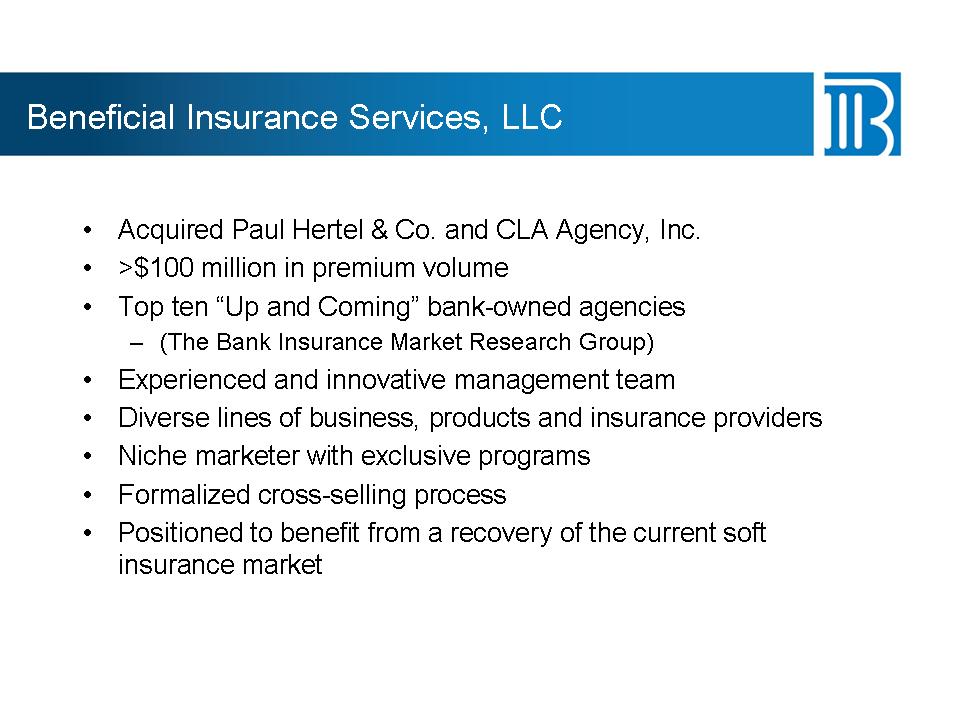
Beneficial Insurance Services, LLC
• Acquired Paul Hertel & Co. and CLA Agency, Inc.
• >$100 million in premium volume
• Top ten “Up and Coming” bank-owned agencies
– (The Bank Insurance Market Research Group)
• Experienced and innovative management team
• Diverse lines of business, products and insurance providers
• Niche marketer with exclusive programs
• Formalized cross-selling process
• Positioned to benefit from a recovery of the current soft
insurance market
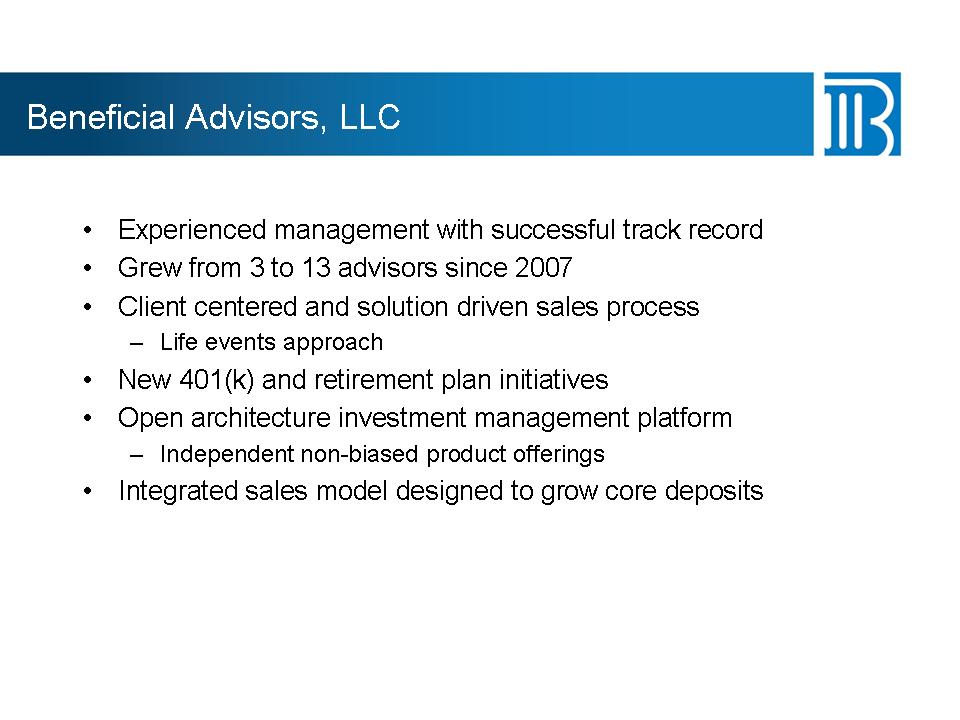
Beneficial Advisors, LLC • Experienced management with successful track record • Grew from 3 to 13 advisors since 2007 • Client centered and solution driven sales process – Life events approach • New 401(k) and retirement plan initiatives • Open architecture investment management platform
– Independent non-biased product offerings • Integrated sales model designed to grow core deposits
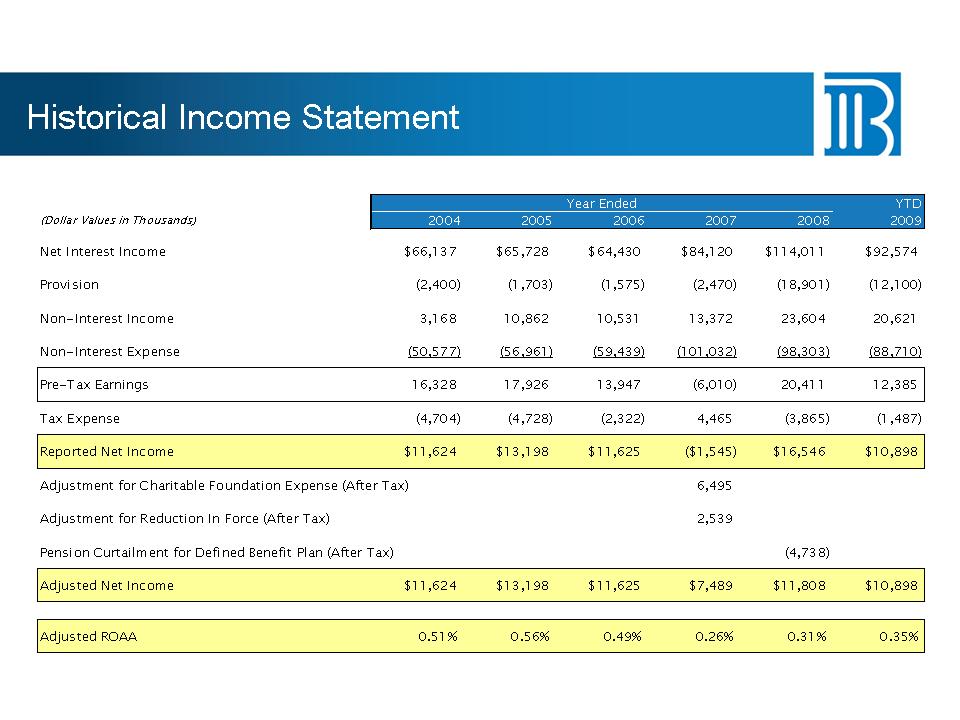
Historical Income Statement
Year Ended YTD
(Dollar Values in Thousands) 2004 2005 2006 2007 2008 2009
Net Interest Income $66,137 $65,728 $64,430 $84,120 $114,011 $92,574
Provision (2,400) (1,703) (1,575) (2,470) (18,901) (12,100)
Non-Interest Income 3,168 10,862 10,531 13,372 23,604 20,621
Non-Interest Expense (50,577) (56,961) (59,439) (101,032) (98,303) (88,710)
Pre-Tax Earnings 16,328 17,926 13,947 (6,010) 20,411 12,385
Tax Expense (4,704) (4,728) (2,322) 4,465 (3,865) (1,487)
Reported Net Income $11,624 $13,198 $11,625 ($1,545) $16,546 $10,898
Adjustment for Charitable Foundation Expense (After Tax) 6,495
Adjustment for Reduction In Force (After Tax) 2,539
Pension Curtailment for Defined Benefit Plan (After Tax) (4,738)
Adjusted Net Income $11,624 $13,198 $11,625 $7,489 $11,808 $10,898
Adjusted ROAA 0.51% 0.56% 0.49% 0.26% 0.31% 0.35%
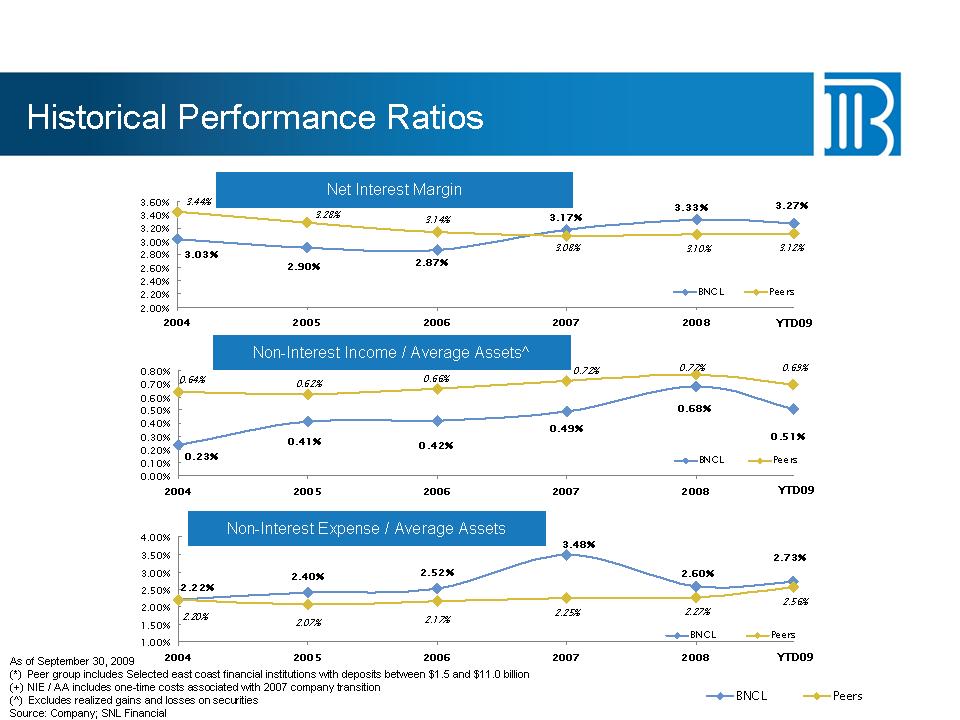
3.17% 3.27%3.33% 2.87%2.90% 3.03% 3.12%3.10% 3.28% 3.44% 3.14% 3.08% 2.00% 2.20% 2.40% 2.60% 2.80% 3.00% 3.20% 3.40% 3.60% 2004 2005 2006 2007 2008 BNCL Peers Historical Performance Ratios 0.49% 0.51% 0.68% 0.42%0.41% 0.23% 0.72% 0.69%0.77% 0.64% 0.66%0.62% 0.00% 0.10% 0.20% 0.30% 0.40% 0.50% 0.60% 0.70% 0.80% 2004 2005
2006 2007 2008 BNCL Peers Non-Interest Income / Average Assets^ 2.40% 2.52% 2.07% 2.17% 2.22% 3.48% 2.60% 2.73% 2.20% 2.27%2.25% 2.56% 1.00% 1.50% 2.00% 2.50% 3.00% 3.50% 4.00% 2004 2005 2006 2007 2008 BNCL Peers Non-Interest Expense / Average Assets As of September 30, 2009 (*) Peer group includes Selected east coast financial institutions with deposits between $1.5 and $11.0 billion (+) NIE / AA includes one-time costs associated with 2007 company transition (^) Excludes realized gains and losses on securities
Source: Company; SNL Financial Net Interest Margin BNCL Peers YTD09 YTD09 YTD09
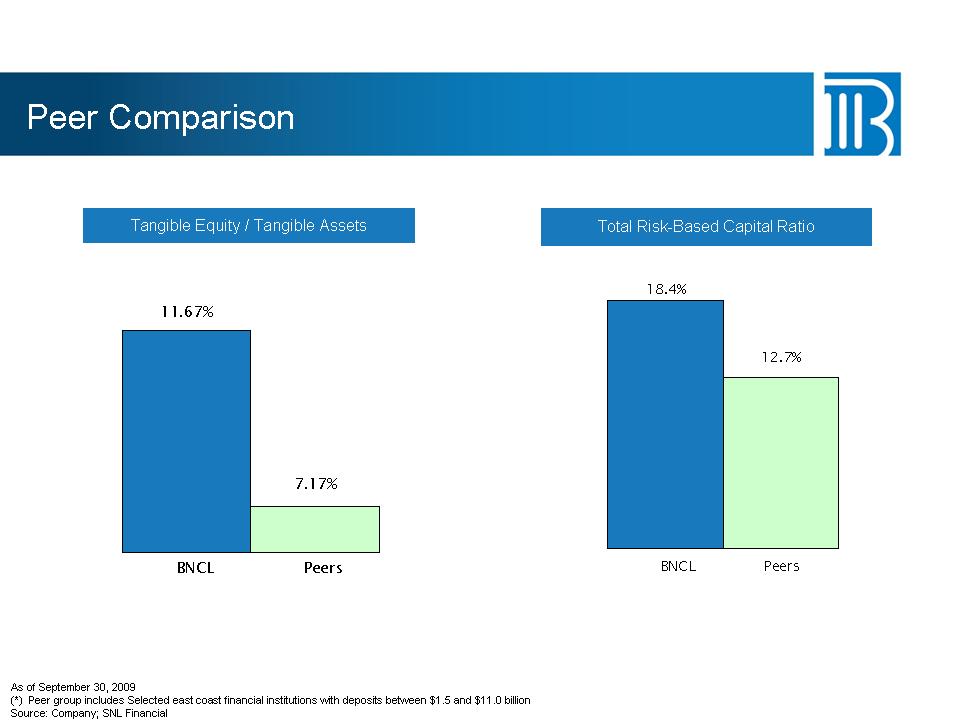
Peer Comparison Tangible Equity / Tangible Assets Total Risk-Based Capital Ratio 7.17% 11.67% BNCL Peers 12.7% 18.4% BNCL Peers As of September 30, 2009 (*) Peer group includes Selected east coast financial institutions with deposits between $1.5 and $11.0 billion Source: Company; SNL Financial
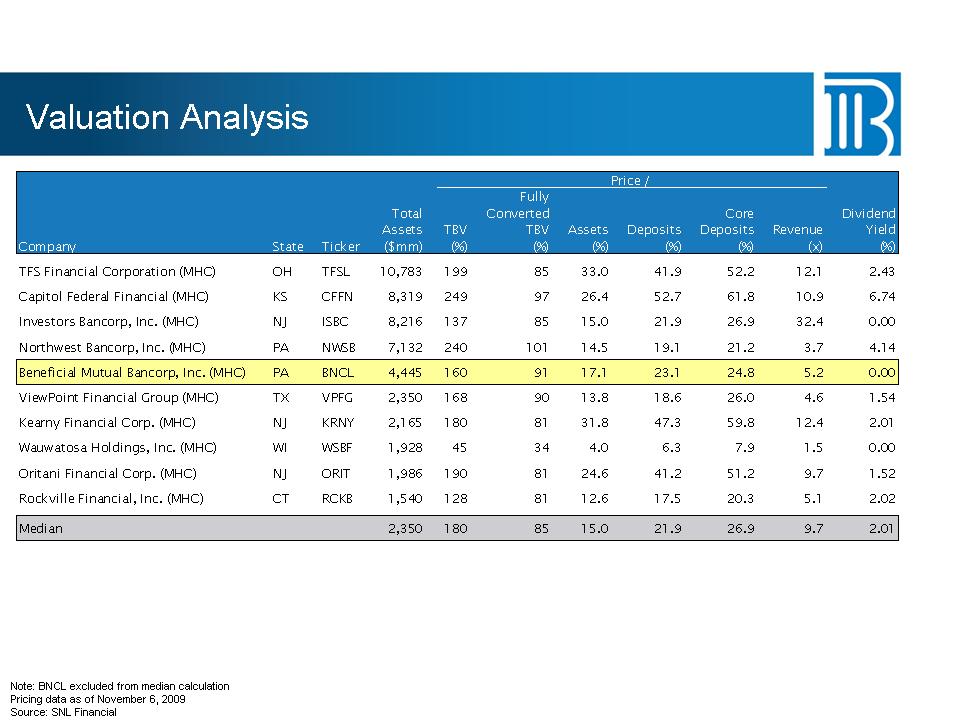
Valuation Analysis Note: BNCL excluded from median calculation Pricing data as of November 6, 2009 Source: SNL Financial Price / Fully Total Converted Core Dividend Assets TBV TBV Assets Deposits Deposits Revenue Yield Company State Ticker ($mm) (%) (%) (%) (%) (%) (x) (%) TFS Financial Corporation (MHC) OH TFSL 10,783
199 85 33.0 41.9 52.2 12.1 2.43 Capitol Federal Financial (MHC) KS CFFN 8,319 249 97 26.4 52.7 61.8 10.9 6.74 Investors Bancorp, Inc. (MHC) NJ ISBC 8,216 137 85 15.0 21.9 26.9 32.4 0.00 Northwest Bancorp, Inc. (MHC) PA NWSB 7,132 240 101 14.5 19.1 21.2 3.7 4.14 Beneficial Mutual Bancorp, Inc. (MHC) PA BNCL 4,445 160 91 17.1 23.1 24.8 5.2 0.00 ViewPoint Financial Group (MHC) TX VPFG 2,350 168 90 13.8 18.6 26.0 4.6 1.54 Kearny Financial Corp. (MHC) NJ KRNY 2,165 180 81 31.8 47.3 59.8 12.4 2.01 Wauwatosa Holdings,
Inc. (MHC) WI WSBF 1,928 45 34 4.0 6.3 7.9 1.5 0.00 Oritani Financial Corp. (MHC) NJ ORIT 1,986 190 81 24.6 41.2 51.2 9.7 1.52 Rockville Financial, Inc. (MHC) CT RCKB 1,540 128 81 12.6 17.5 20.3 5.1 2.02 Median 2,350 180 85 15.0 21.9 26.9 9.7 2.01
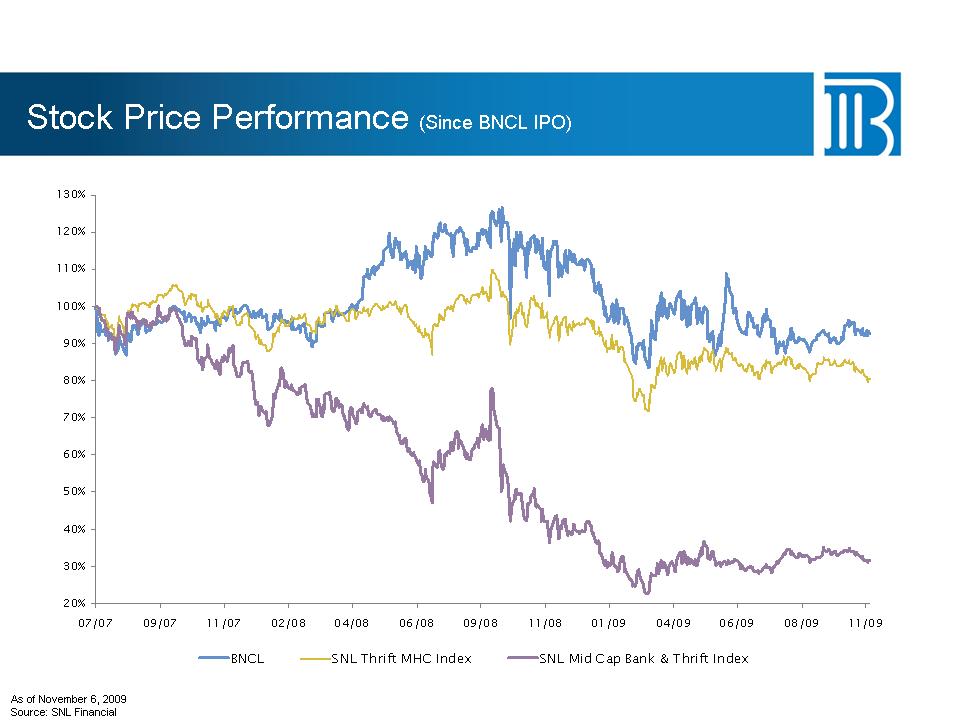
Stock Price Performance (Since BNCL IPO) 20% 30% 40% 50% 60% 70% 80% 90% 100% 110% 120% 130%07/07 09/07 11/07 02/08 04/08 06/08 09/08 11/08 01/09 04/09 06/09 08/09 11/09 BNCL SNL Thrift MHC Index SNL Mid Cap Bank & Thrift Index As of November 6, 2009 Source: SNL Financial
Stock Price Performance (Since BNCL IPO) 20% 30% 40% 50% 60% 70% 80% 90% 100% 110% 120% 130%07/07 09/07 11/07 02/08 04/08 06/08 09/08 11/08 01/09 04/09 06/09 08/09 11/09 BNCL SNL Thrift MHC Index SNL Mid Cap Bank & Thrift Index As of November 6, 2009 Source: SNL Financial
2010 Priorities • Financial Responsibility – Educating customers to do the right thing financially – Re-engineered website • Capital Allocation – Continued fundamental organic growth – Opportunistic acquisitions • Enhanced Risk Management – Centralized credit review and
approval process – Internal control self-assessment • Niche marketing – Government Banking – Alternative Energy Financing • Branch Network Optimization Opportunities