Attached files
| file | filename |
|---|---|
| 8-K - FORM 8-K - AGILYSYS INC | l38066e8vk.htm |
Exhibit 99.1

| Agilysys, Inc. (Nasdaq: AGYS) Agilysys, Inc. (Nasdaq: AGYSAgilysys, AGYS) November 2009 L38066_4 November 2009 |
| Forward looking statements and#038; non-GAAP financial information Forward-Looking Language This presentation contains certain management expectations, which may constitute forward-looking information within the meaning of Section 27A of the Securities Act of 1933, Section 21E of the Securities and Exchange Act of 1934 and the Private Securities Reform Act of 1995. Forward-looking information speaks only as to the date of this presentation and may be identified by use of words such as "may," "will," "believes," "anticipates," "plans," "expects," "estimates," "projects," "targets," "forecasts," "continues," "seeks," or the negative of those terms or similar expressions. Many important factors could cause actual results to be materially different from those in forward-looking information including, without limitation, competitive factors, disruption of supplies, changes in market conditions, pending or future claims or litigation, or technology advances. No assurances can be provided as to the outcome of cost reductions, business strategies, future financial results, unanticipated downturns to our relationships with customers, unanticipated difficulties integrating acquisitions, new laws and government regulations, interest rate changes, and unanticipated deterioration in economic and financial conditions in the United States and around the world. We do not undertake to update or revise any forward-looking information even if events make it clear that any projected results, actions, or impact, express or implied, will not be realized. Other potential risks and uncertainties that may cause actual results to be materially different from those in forward-looking information are described in the company's Annual Report on Form 10-K filed with the Securities and Exchange Commission (SEC), under Item 1A, "Risk Factors." Copies are available from the SEC or the Agilysys web site. Use of Non-GAAP Financial Information To supplement the unaudited condensed consolidated financial statements presented in accordance with U.S. GAAP in this presentation, certain non-GAAP financial measures as defined by the SEC rules are used. Management believes that such information can enhance investors' understanding of the company's ongoing operations. The non-GAAP measures included in this presentation have been reconciled to the comparable GAAP measures within an accompanying table, shown on the last page of this presentation. 2 |
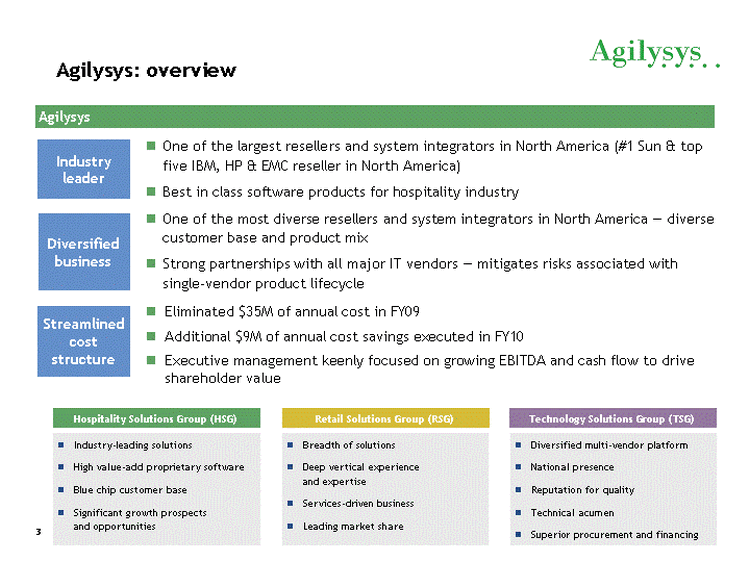
| Agilysys: overview One of the largest resellers and system integrators in North America (#1 Sun and#038; top five IBM, HP and#038; EMC reseller in North America) Best in class software products for hospitality industry Industry leader Diversified business Streamlined cost structure One of the most diverse resellers and system integrators in North America - diverse customer base and product mix Strong partnerships with all major IT vendors - mitigates risks associated with single-vendor product lifecycle Eliminated $35M of annual cost in FY09 Additional $9M of annual cost savings executed in FY10 Executive management keenly focused on growing EBITDA and cash flow to drive shareholder value Industry-leading solutions High value-add proprietary software Blue chip customer base Significant growth prospects and opportunities Breadth of solutions Deep vertical experience and expertise Services-driven business Leading market share Diversified multi-vendor platform National presence Reputation for quality Technical acumen Superior procurement and financing Technology Solutions Group (TSG) Retail Solutions Group (RSG) Hospitality Solutions Group (HSG) Agilysys 3 |
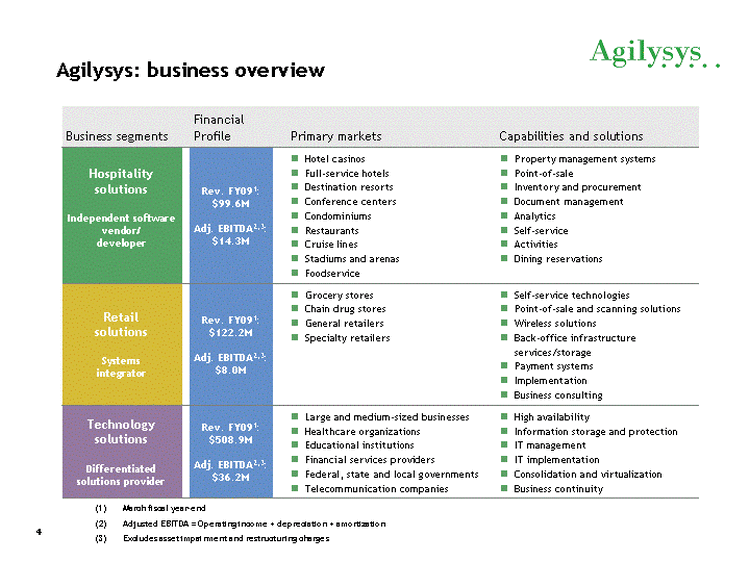
| Agilysys: business overview Business segments Financial Profile Primary markets Capabilities and solutions Hospitality solutions Independent software vendor/ developer Rev. FY091: $99.6M Adj. EBITDA2,3: $14.3M Hotel casinos Full-service hotels Destination resorts Conference centers Condominiums Restaurants Cruise lines Stadiums and arenas Foodservice Property management systems Point-of-sale Inventory and procurement Document management Analytics Self-service Activities Dining reservations Retail solutions Systems integrator Rev. FY091: $122.2M Adj. EBITDA2,3: $8.0M Grocery stores Chain drug stores General retailers Specialty retailers Self-service technologies Point-of-sale and scanning solutions Wireless solutions Back-office infrastructure services/storage Payment systems Implementation Business consulting Technology solutions Differentiated solutions provider Rev. FY091: $508.9M Adj. EBITDA2,3: $36.2M Large and medium-sized businesses Healthcare organizations Educational institutions Financial services providers Federal, state and local governments Telecommunication companies High availability Information storage and protection IT management IT implementation Consolidation and virtualization Business continuity March fiscal year-end Adjusted EBITDA = Operating income + depreciation + amortization Excludes asset impairment and restructuring charges 4 |
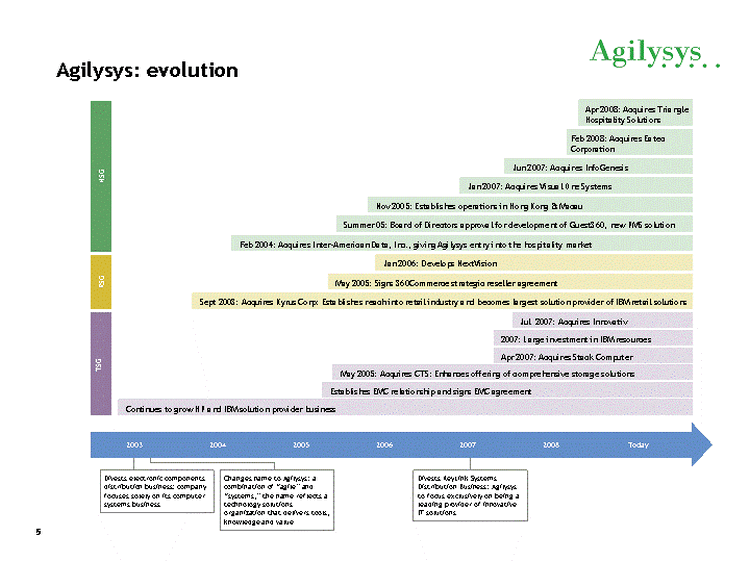
| Agilysys: evolution 2003 2004 2005 2006 2007 2008 Today TSG RSG HSG Continues to grow HP and IBM solution provider business Establishes EMC relationship and signs EMC agreement May 2005: Acquires CTS: Enhances offering of comprehensive storage solutions Apr 2007: Acquires Stack Computer Jul 2007: Acquires Innovativ Sept 2003: Acquires Kyrus Corp: Establishes reach into retail industry and becomes largest solution provider of IBM retail solutions May 2005: Signs 360Commerce strategic reseller agreement Jan 2006: Develops NextVision Feb 2004: Acquires Inter-American Data, Inc., giving Agilysys entry into the hospitality market Summer 05: Board of Directors approval for development of Guest360, new PMS solution Nov 2005: Establishes operations in Hong Kong and#038; Macau Jan 2007: Acquires Visual One Systems Jun 2007: Acquires InfoGenesis Feb 2008: Acquires Eatec Corporation Apr 2008: Acquires Triangle Hospitality Solutions Divests electronic components distribution business: company focuses solely on its computer systems business Changes name to Agilysys: a combination of "agile" and "systems," the name reflects a technology solutions organization that delivers tools, knowledge and value Divests KeyLink Systems Distribution Business: Agilysys to focus exclusively on being a leading provider of innovative IT solutions 2007: Large investment in IBM resources 5 |
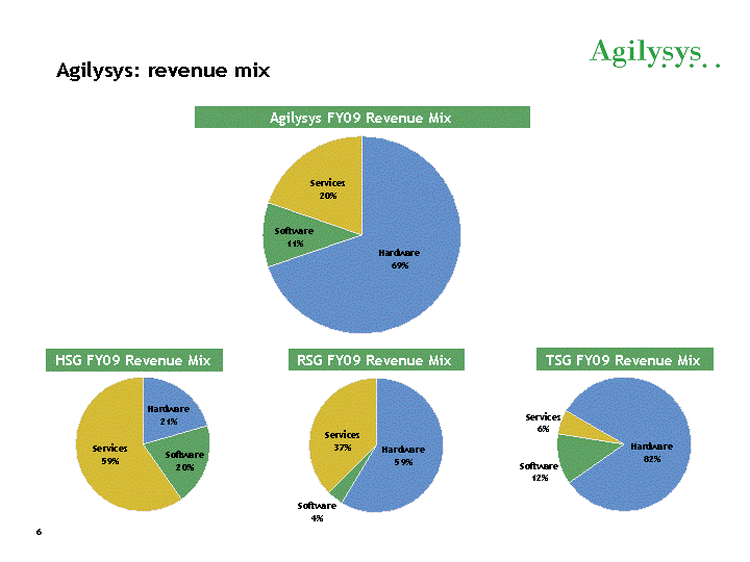
| Agilysys: revenue mix Hardware Software Services East 508.7 77 145 Hardware Software Services East 20.5 19.8 59.7 Hardware Software Services East 58.7 3.9 37.5 Hardware Software Services East 81.9 12.3 5.8 Agilysys FY09 Revenue Mix HSG FY09 Revenue Mix RSG FY09 Revenue Mix TSG FY09 Revenue Mix 6 |
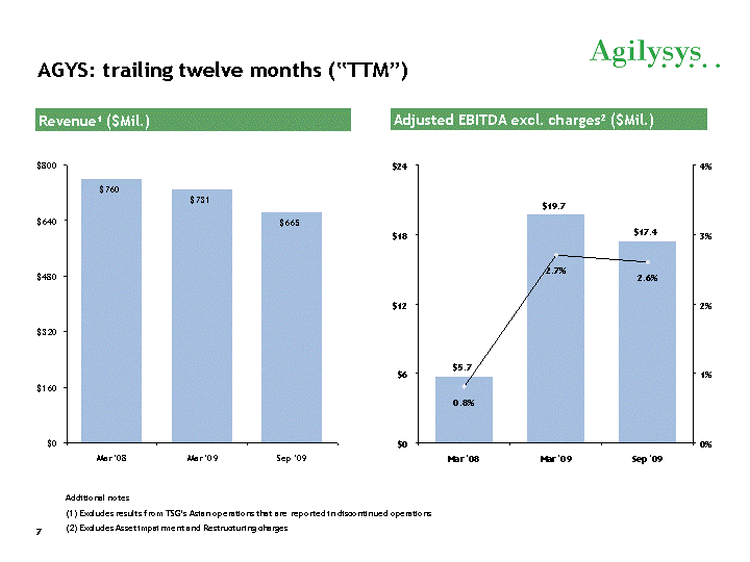
| AGYS: trailing twelve months ("TTM") Mar '08 Mar '09 Sep '09 EBITDA 5.7 19.7 17.4 EBITDA Margin 0.008 0.027 0.026 Mar '08 Mar '09 Sep '09 Organic 760 731 665 Adjusted EBITDA excl. charges2 ($Mil.) Additional notes Excludes results from TSG's Asian operations that are reported in discontinued operations Excludes Asset impairment and Restructuring charges Revenue1 ($Mil.) 7 |
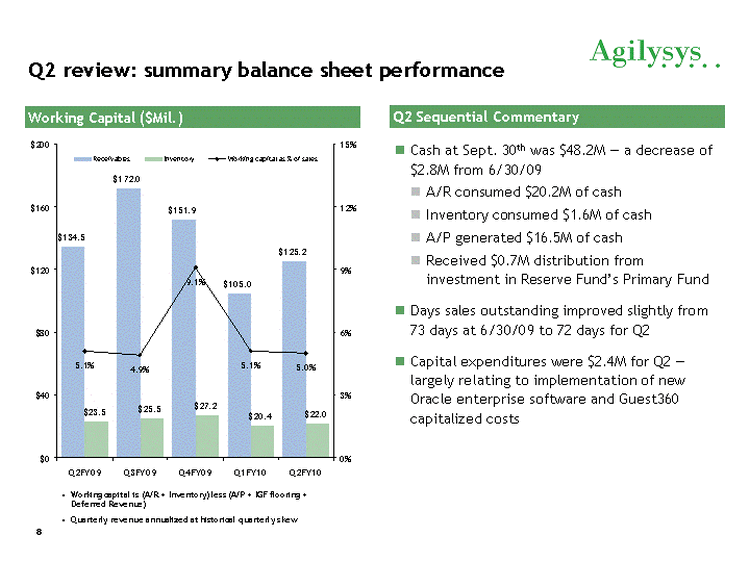
| Q2 review: summary balance sheet performance Cash at Sept. 30th was $48.2M - a decrease of $2.8M from 6/30/09 A/R consumed $20.2M of cash Inventory consumed $1.6M of cash A/P generated $16.5M of cash Received $0.7M distribution from investment in Reserve Fund's Primary Fund Days sales outstanding improved slightly from 73 days at 6/30/09 to 72 days for Q2 Capital expenditures were $2.4M for Q2 - largely relating to implementation of new Oracle enterprise software and Guest360 capitalized costs Q2 Sequential Commentary Working Capital ($Mil.) Q2FY09 Q3FY09 Q4FY09 Q1FY10 Q2FY10 Receivables 134.5 172 151.9 105 125.2 Working capital as % of sales 0.051 0.049 0.091 0.051 0.05 Inventory 23.5 25.5 27.2 20.4 22 Working capital is (A/R + Inventory) less (A/P + IGF flooring + Deferred Revenue) Quarterly revenue annualized at historical quarterly skew 8 |
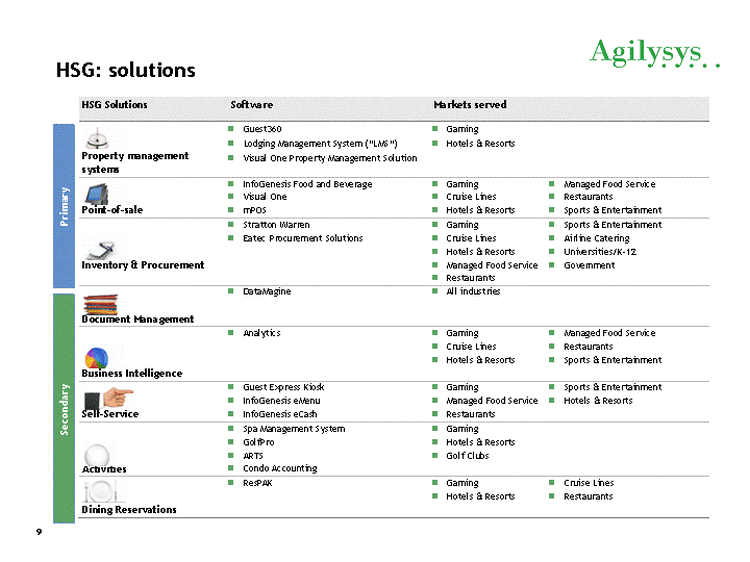
| HSG: solutions HSG: solutions HSG Solutions Software Markets served Property management Guest360 Lodging Management System (LMS) Visual One Property Management Solution Gaming Hotels Resorts p y g systems Point-of-sale InfoGenesis Food and Beverage Visual One mPOS Gaming Cruise Lines Hotels Resorts Managed Food Service Restaurants Sports Entertainment Stratton Warren Eatec Procurement Solutions Gaming Cruise Lines Sports Entertainment Airline Catering Primary Inventory and Procurement Hotels and Resorts Managed Food Service Restaurants Universities/K-12 Government Document Management DataMagine All industries Business Intelligence Analytics Gaming Cruise Lines Hotels and Resorts Managed Food Service Restaurants Sports and Entertainment Guest Express Kiosk InfoGenesis Gaming Managed Food Service Sports and Entertainment Hotels and Resorts dary Self-Service eMenu InfoGenesis eCash Restaurants Activities Spa Management System GolfPro ARTS Condo Accounting Gaming Hotels and Resorts Golf Clubs R PAK G i C i Li Second 9 Dining Reservations ResPAK Gaming Hotels and Resorts Cruise Lines Restaurants L38066_12 HSG: trailing twelve months Revenue ($ Mil.) Adjusted EBITDA1 ($ Mil.) $ $16 20% $14.3 $13.3 $12 16% $85 $100 $91 $80 100 $9.0 10.6% 14.3% 14.6% $8 $60 12% $4 4% 8% $20 $40 $0 Mar '08 Mar '09 Sep '09 $0 0% Mar '08 Mar '09 Sep '09 10 (1) Excludes asset impairment charge L38066_13 Primary Secondary 9 |
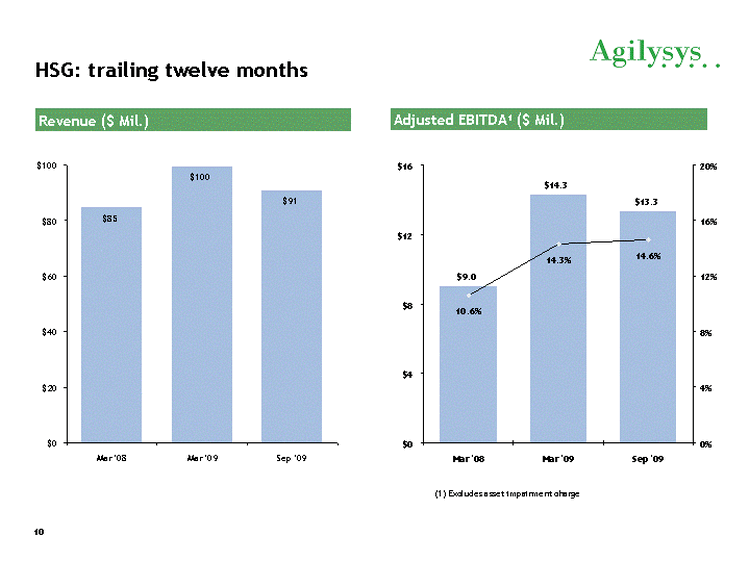
| HSG: trailing twelve months Adjusted EBITDA1 ($ Mil.) Revenue ($ Mil.) Mar '08 Mar '09 Sep '09 EBITDA 9 14.3 13.3 EBITDA Margin 0.106 0.143 0.146 Mar '08 Mar '09 Sep '09 Organic 84.8 99.6 91 (1) Excludes asset impairment charge 10 |
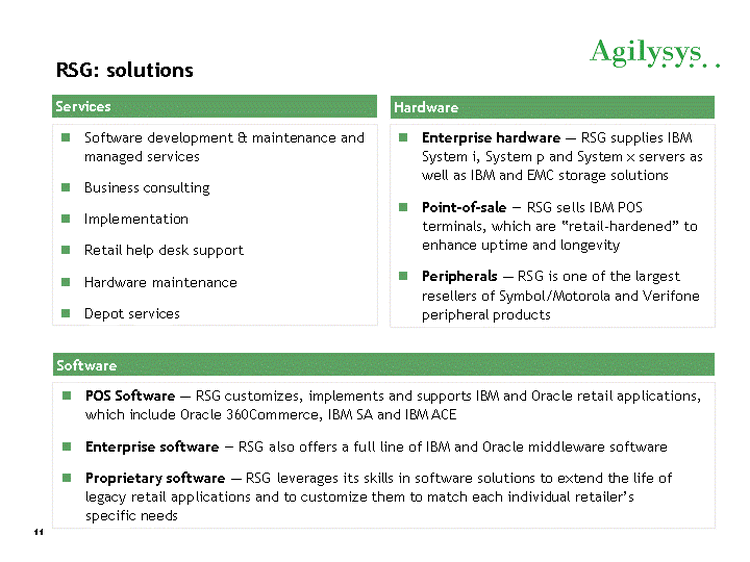
| RSG: solutions Services Enterprise hardware - RSG supplies IBM System i, System p and System x servers as well as IBM and EMC storage solutions Point-of-sale - RSG sells IBM POS terminals, which are "retail-hardened" to enhance uptime and longevity Peripherals - RSG is one of the largest resellers of Symbol/Motorola and Verifone peripheral products Software development and#038; maintenance and managed services Business consulting Implementation Retail help desk support Hardware maintenance Depot services Hardware Software POS Software - RSG customizes, implements and supports IBM and Oracle retail applications, which include Oracle 360Commerce, IBM SA and IBM ACE Enterprise software - RSG also offers a full line of IBM and Oracle middleware software Proprietary software - RSG leverages its skills in software solutions to extend the life of legacy retail applications and to customize them to match each individual retailer's specific needs 11 |
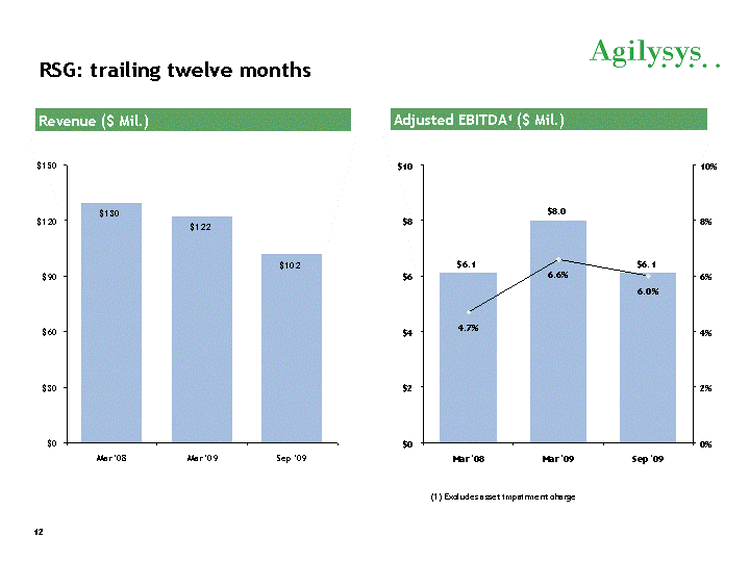
| Revenue ($ Mil.) Mar '08 Mar '09 Sep '09 EBITDA 6.1 8 6.1 EBITDA Margin 0.047 0.066 0.06 Mar '08 Mar '09 Sep '09 Organic 129.7 122.2 102 RSG: trailing twelve months Adjusted EBITDA1 ($ Mil.) (1) Excludes asset impairment charge 12 |
| TSG: solutions Enterprise class products targeted toward complex and powerful server and storage solutions Require significant investments in customer facing sales, technical solutions architects, delivery systems engineers, vendor certifications and extensive training TSG provides a broad range of industry leading products from top vendors such as Sun, HP, IBM, EMC, and Oracle Complements with resold and proprietary services and software, to create a truly differentiated and optimized IT infrastructure solution for customers TSG's portfolio of offerings includes: Assessments, solution architecture and design, implementation, migration, and full project life cycle management Business critical solutions, including identity management, enterprise solutions, infrastructure services, data management and storage, and managed and consulting services TSG focus is to grow attach rate of proprietary technical and professional services to infrastructure hardware and software from leading IT vendors 13 |
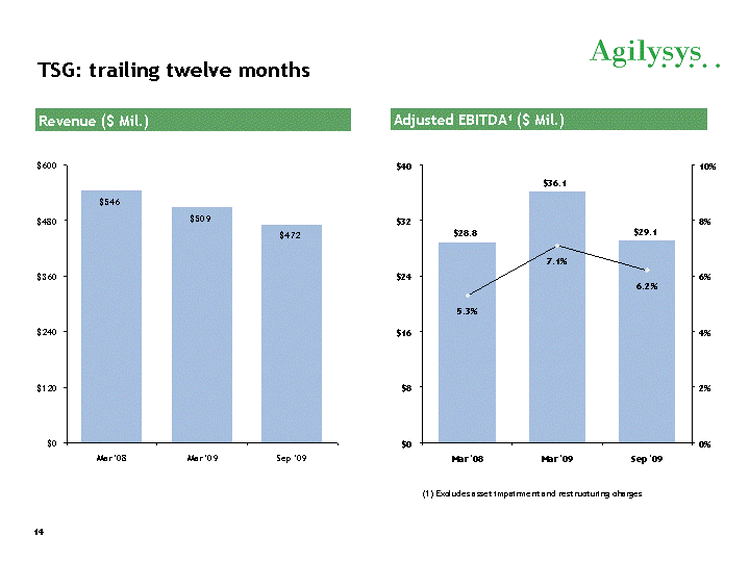
| TSG: trailing twelve months Revenue ($ Mil.) Mar '08 Mar '09 Sep '09 EBITDA 28.8 36.1 29.1 EBITDA Margin 0.053 0.071 0.062 Mar '08 Mar '09 Sep '09 Organic 545.6 508.9 472 Adjusted EBITDA1 ($ Mil.) (1) Excludes asset impairment and restructuring charges 14 |
| FY10 positioning and outlook Well Positioned for FY10 Company eliminated $44M in annualized cost in past 15 months New organization structure provides streamlined decision making and reduced overhead Cost structure is aligned with current demand outlook Debt-free with $48M cash on hand as of 9/30/09 $50M undrawn credit facility enhances strong working capital position and further increases financial flexibility Implementation of Oracle enterprise software in early 2010 will provide opportunity to further reduce overhead costs and improve working capital Outlook Company suspended guidance until visibility into IT demand improves Improved visibility for fiscal Q3 - IT capital spending environment remains uncertain for calendar year 2010 Expect sequential improvement in fiscal Q3 revenue due to seasonal IT capital spend Remain focused on managing costs and working capital to drive cash flow Expect financial performance in second half to improve versus first half of fiscal 2010 Expect to generate cash flow of approximately $10M in FY10 15 |
| Agilysys, Inc. (Nasdaq: AGYS) Financial Data |
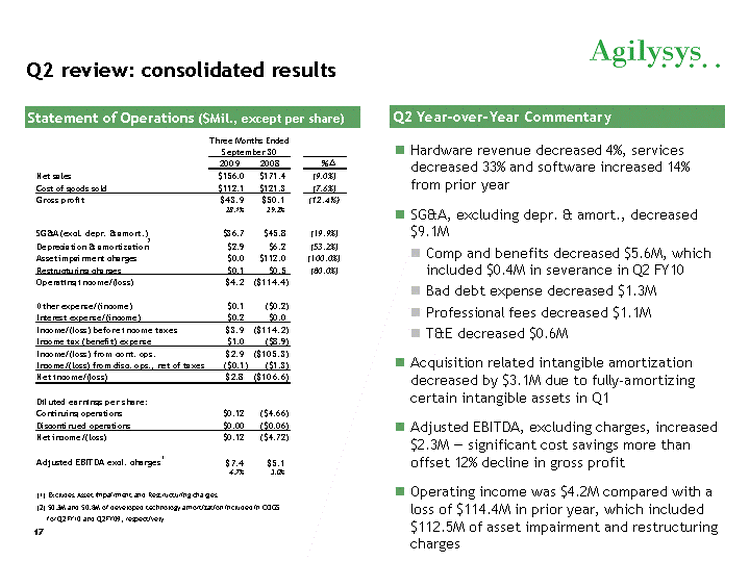
| Q2 review: consolidated results Hardware revenue decreased 4%, services decreased 33% and software increased 14% from prior year SGand#038;A, excluding depr. and#038; amort., decreased $9.1M Comp and benefits decreased $5.6M, which included $0.4M in severance in Q2 FY10 Bad debt expense decreased $1.3M Professional fees decreased $1.1M Tand#038;E decreased $0.6M Acquisition related intangible amortization decreased by $3.1M due to fully-amortizing certain intangible assets in Q1 Adjusted EBITDA, excluding charges, increased $2.3M - significant cost savings more than offset 12% decline in gross profit Operating income was $4.2M compared with a loss of $114.4M in prior year, which included $112.5M of asset impairment and restructuring charges Q2 Year-over-Year Commentary Statement of Operations ($Mil., except per share) 17 |
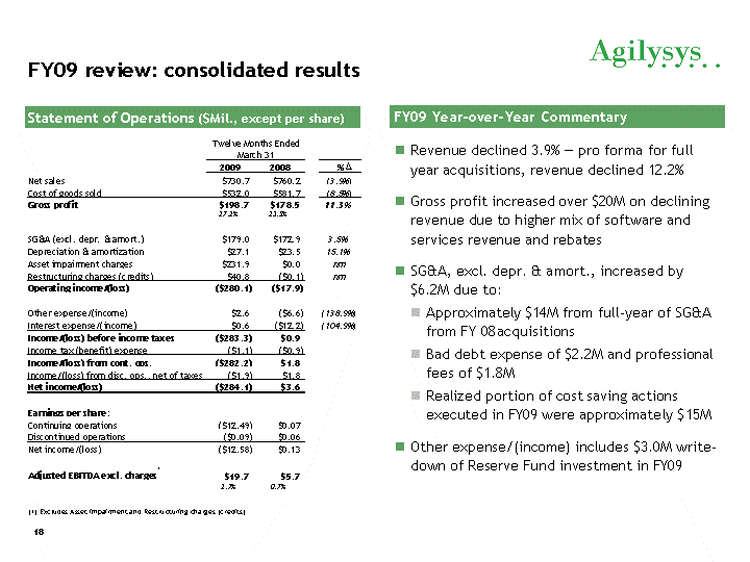
| FY09 review: consolidated results Revenue declined 3.9% - pro forma for full year acquisitions, revenue declined 12.2% Gross profit increased over $20M on declining revenue due to higher mix of software and services revenue and rebates SGand#038;A, excl. depr. and#038; amort., increased by $6.2M due to: Approximately $14M from full-year of SGand#038;A from FY 08acquisitions Bad debt expense of $2.2M and professional fees of $1.8M Realized portion of cost saving actions executed in FY09 were approximately $15M Other expense/(income) includes $3.0M write- down of Reserve Fund investment in FY09 FY09 Year-over-Year Commentary Statement of Operations ($Mil., except per share) 18 |
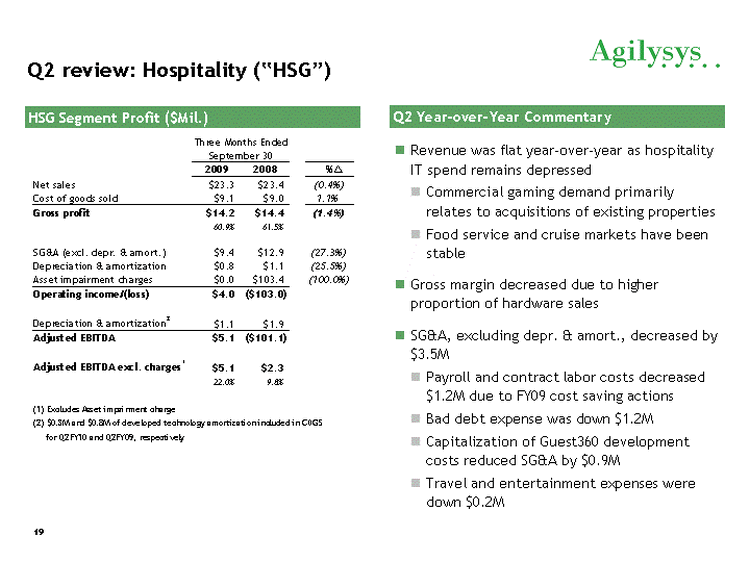
| Q2 review: Hospitality ("HSG") Revenue was flat year-over-year as hospitality IT spend remains depressed Commercial gaming demand primarily relates to acquisitions of existing properties Food service and cruise markets have been stable Gross margin decreased due to higher proportion of hardware sales SGand#038;A, excluding depr. and#038; amort., decreased by $3.5M Payroll and contract labor costs decreased $1.2M due to FY09 cost saving actions Bad debt expense was down $1.2M Capitalization of Guest360 development costs reduced SGand#038;A by $0.9M Travel and entertainment expenses were down $0.2M HSG Segment Profit ($Mil.) Q2 Year-over-Year Commentary 19 |
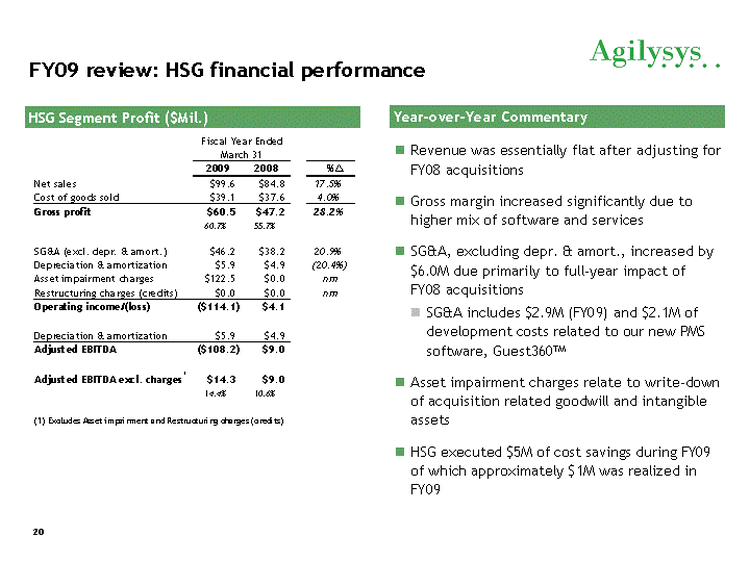
| FY09 review: HSG financial performance Revenue was essentially flat after adjusting for FY08 acquisitions Gross margin increased significantly due to higher mix of software and services SGand#038;A, excluding depr. and#038; amort., increased by $6.0M due primarily to full-year impact of FY08 acquisitions SGand#038;A includes $2.9M (FY09) and $2.1M of development costs related to our new PMS software, Guest360TM Asset impairment charges relate to write-down of acquisition related goodwill and intangible assets HSG executed $5M of cost savings during FY09 of which approximately $1M was realized in FY09 HSG Segment Profit ($Mil.) Year-over-Year Commentary 20 |
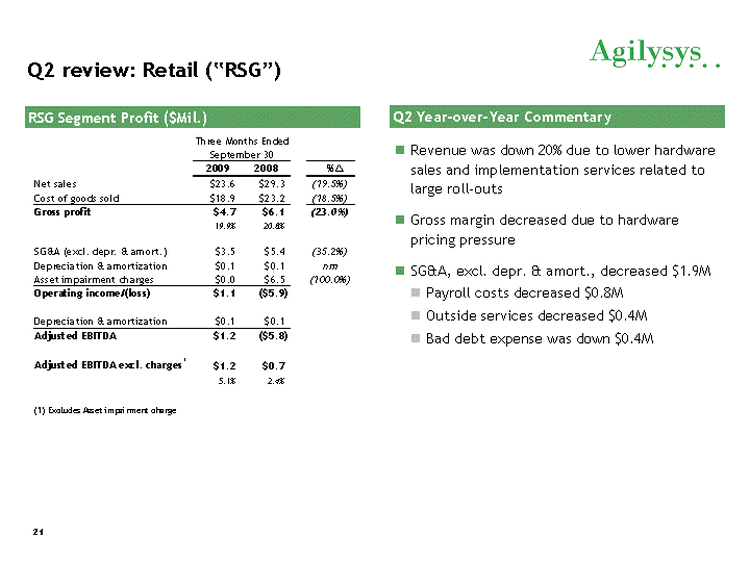
| Q2 review: Retail ("RSG") Revenue was down 20% due to lower hardware sales and implementation services related to large roll-outs Gross margin decreased due to hardware pricing pressure SGand#038;A, excl. depr. and#038; amort., decreased $1.9M Payroll costs decreased $0.8M Outside services decreased $0.4M Bad debt expense was down $0.4M RSG Segment Profit ($Mil.) Q2 Year-over-Year Commentary 21 |
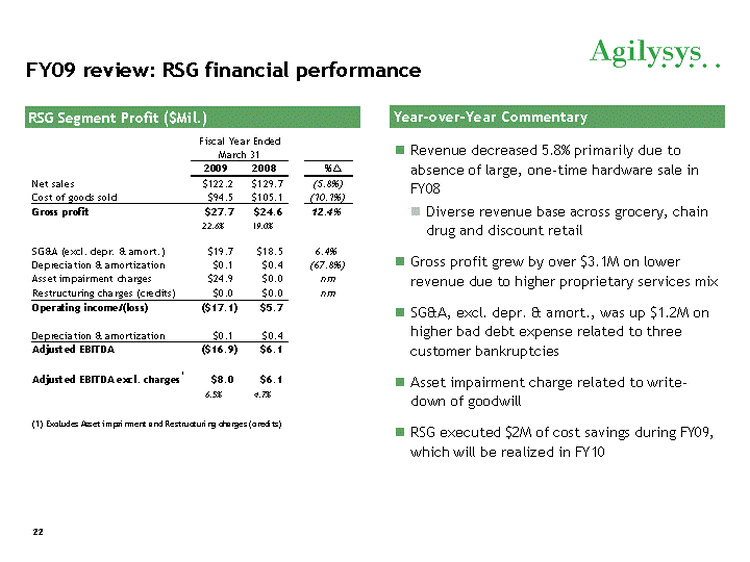
| FY09 review: RSG financial performance Revenue decreased 5.8% primarily due to absence of large, one-time hardware sale in FY08 Diverse revenue base across grocery, chain drug and discount retail Gross profit grew by over $3.1M on lower revenue due to higher proprietary services mix SGand#038;A, excl. depr. and#038; amort., was up $1.2M on higher bad debt expense related to three customer bankruptcies Asset impairment charge related to write- down of goodwill RSG executed $2M of cost savings during FY09, which will be realized in FY10 RSG Segment Profit ($Mil.) Year-over-Year Commentary FY09 review: RSG financial performance Revenue decreased 5.8% primarily due to RSG Segment Profit ($Mil.) Year-over-Year Commentary Fiscal Year Ended March 31 absence of large, one-time hardware sale in FY08 Diverse revenue base across grocery, chain drug and discount retail 2009 2008 % Net sales $122.2 $129.7 (5.8%) Cost of goods sold $94.5 $105.1 (10.1%) Gross profit $27.7 $24.6 12.4% 22.6% 19.0% Gross profit grew by over $3.1M on lower revenue due to higher proprietary services mix SGandA, excl. depr. and amort., was up $1.2M on SGandA (excl. depr. and amort.) $19.7 $18.5 6.4% Depreciation and amortization $0.1 $0.4 (67.8%) Asset impairment charges $24.9 $0.0 nm Restructuring charges (credits) $0.0 $0.0 nm Operating income/(loss) ($17.1) $5.7 higher bad debt expense related to three customer bankruptcies Asset impairment charge related to writedown Depreciation and amortization $0.1 $0.4 Adjusted EBITDA ($16.9) $6.1 Adjusted EBITDA excl. charges1 $8.0 $6.1 6.5% 4.7% down of goodwill RSG executed $2M of cost savings during FY09, which will be realized in FY10 (1) Excludes Asset impairment and Restructuring charges (credits) 22 L38066_25 22 |
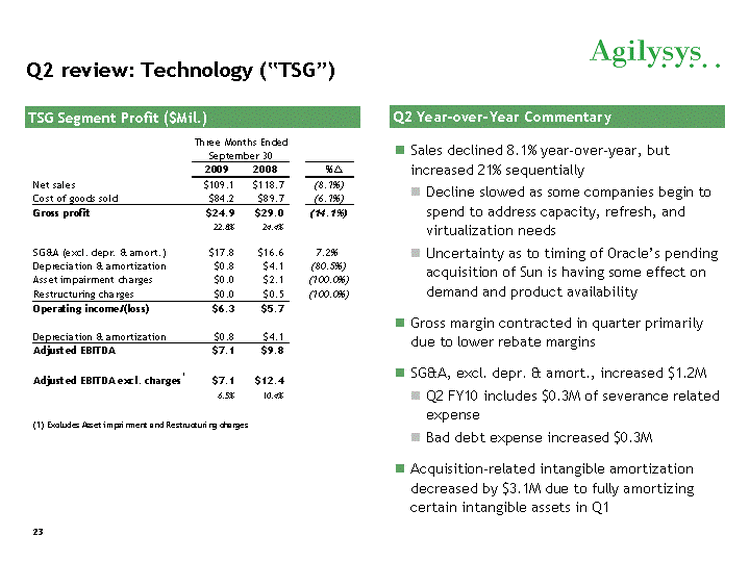
| Q2 review: Technology ("TSG") Sales declined 8.1% year-over-year, but increased 21% sequentially Decline slowed as some companies begin to spend to address capacity, refresh, and virtualization needs Uncertainty as to timing of Oracle's pending acquisition of Sun is having some effect on demand and product availability Gross margin contracted in quarter primarily due to lower rebate margins SGand#038;A, excl. depr. and#038; amort., increased $1.2M Q2 FY10 includes $0.3M of severance related expense Bad debt expense increased $0.3M Acquisition-related intangible amortization decreased by $3.1M due to fully amortizing certain intangible assets in Q1 TSG Segment Profit ($Mil.) 23 Q2 Year-over-Year Commentary |
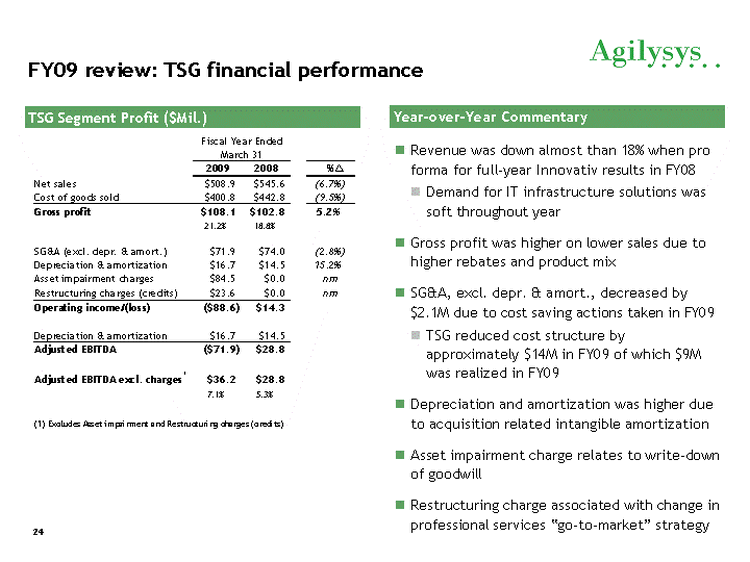
| FY09 review: TSG financial performance Revenue was down almost than 18% when pro forma for full-year Innovativ results in FY08 Demand for IT infrastructure solutions was soft throughout year Gross profit was higher on lower sales due to higher rebates and product mix SGand#038;A, excl. depr. and#038; amort., decreased by $2.1M due to cost saving actions taken in FY09 TSG reduced cost structure by approximately $14M in FY09 of which $9M was realized in FY09 Depreciation and amortization was higher due to acquisition related intangible amortization Asset impairment charge relates to write-down of goodwill Restructuring charge associated with change in professional services "go-to-market" strategy TSG Segment Profit ($Mil.) FY09 review: TSG financial performance Revenue was down almost than 18% when pro TSG Segment Profit ($Mil.) Year-over-Year Commentary Fiscal Year Ended March 31 forma for full-year Innovativ results in FY08 Demand for IT infrastructure solutions was soft throughout year Gross profit was higher on lower sales due to 2009 2008 % Net sales $508.9 $545.6 (6.7%) Cost of goods sold $400.8 $442.8 (9.5%) Gross profit $108.1 $102.8 5.2% 21.2% 18.8% higher rebates and product mix SGandA, excl. depr. and amort., decreased by $2.1M due to cost saving actions taken in FY09 SGandA (excl. depr. and amort.) $71.9 $74.0 (2.8%) Depreciation and amortization $16.7 $14.5 15.2% Asset impairment charges $84.5 $0.0 nm Restructuring charges (credits) $23.6 $0.0 nm Operating income/(loss) ($88.6) $14.3 TSG reduced cost structure by approximately $14M in FY09 of which $9M was realized in FY09 D i ti d ti ti hi h d Depreciation and amortization $16.7 $14.5 Adjusted EBITDA ($71.9) $28.8 Adjusted EBITDA excl. charges1 $36.2 $28.8 7.1% 5.3% Depreciation and amortization was higher due to acquisition related intangible amortization Asset impairment charge relates to write-down of goodwill (1) Excludes Asset impairment and Restructuring charges (credits) 24 g Restructuring charge associated with change in professional services go-to-market strategy L38066_27 24 Year-over-Year Commentary |
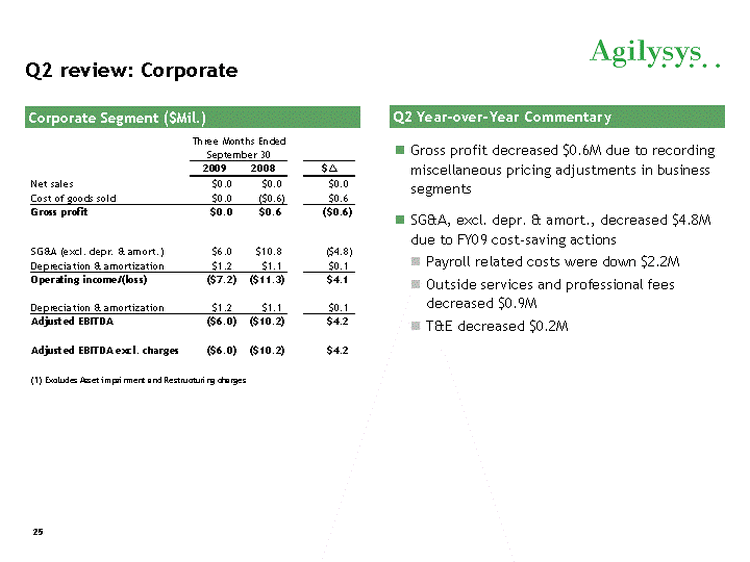
| Q2 review: Corporate Gross profit decreased $0.6M due to recording miscellaneous pricing adjustments in business segments SGand#038;A, excl. depr. and#038; amort., decreased $4.8M due to FY09 cost-saving actions Payroll related costs were down $2.2M Outside services and professional fees decreased $0.9M Tand#038;E decreased $0.2M Corporate Segment ($Mil.) Q2 review: Corpporate Gross profit decreased $0.6M due to recording Corporate Segment ($Mil.) Q2 Year-over-Year Commentary Three Months Ended September 30 miscellaneous pricing adjustments in business segments SGandA, excl. depr. and amort., decreased $4.8M due to FY09 cost-saving actions 2009 2008 $ Net sales $0.0 $0.0 $0.0 Cost of goods sold $0.0 ($0.6) $0.6 Gross profit $0.0 $0.6 ($0.6) cost Payroll related costs were down $2.2M Outside services and professional fees decreased $0.9M d d 0 2M SGandA (excl. depr. and amort.) $6.0 $10.8 ($4.8) Depreciation and amortization $1.2 $1.1 $0.1 Operating income/(loss) ($7.2) ($11.3) $4.1 Depreciation and amortization $1.2 $1.1 $0.1 Adjusted EBITDA ($6 0) ($10 2) $4 2 6.0) 10.2) 4.2 TandE decreased $0.2M Adjusted EBITDA excl. charges ($6.0) ($10.2) $4.2 (1) Excludes Asset impairment and Restructuring charges 25 L38066_28 Q2 Year-over-Year Commentary |

| Reconciliation of Q2 FY10 net income/(loss) Reconciliation of Q2 FY10 net income/(loss) to adjusted EBITDA 2009 2008 2009 2008 Net loss $ 2,836 $ ( 106,589) $ (9,560) $ ( 166,624) Plus: Six Months Ended (In thousands) September 30, Three Months Ended September 30, Interest expense, net 244 (18) 418 ( 10) Other income, net 81 (242) (390) (480) Income tax expense (benefit) 988 (8,917) 1,003 (14,080) Depreciation and amortization expense (a) 3,170 7,048 9,498 1 3,959 Loss from discontinued operations, net of tax 52 1,312 41 1,274 Adjusted EBITDA 7,371 ( 107,406) 1,010 ( 165,961) Asset impairment charges - 1 12,020 - 1 45,643 Restructuring charges 54 510 68 2 3,573 Adjusted EBITDA excluding asset impairment and restructuring charges $ 7,425 $ 5 ,124 $ 1,078 $ 3 ,255 (a) Depreciation and amortization expense excludes amortization of deferred finance costs, totaling $132 and $57 for the three months ended September 30, 2009 and 2008, respectively, and totaling $220 and $113 for the six months ended September 30, 2009 and 2008, respectively, as such costs are already included in interest expense, net. 26 L38066_29 to adjusted EBITDA |
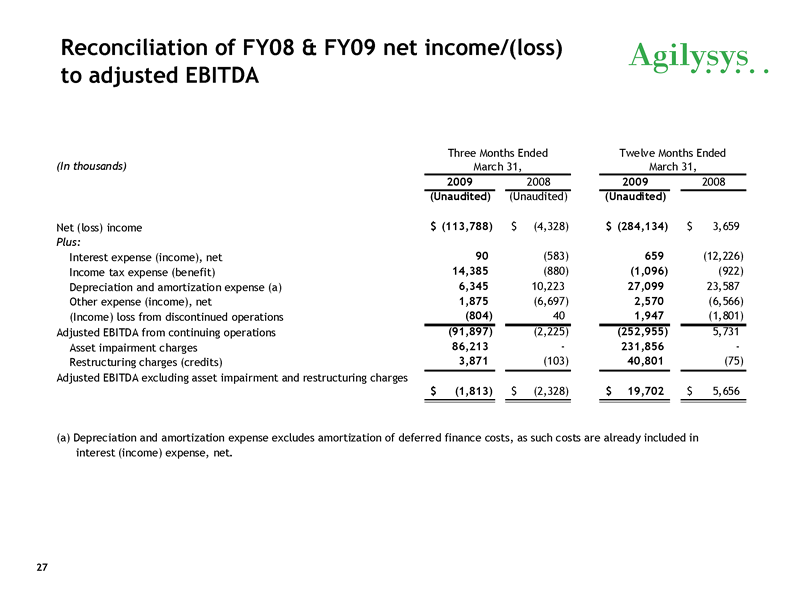
| Reconciliation of FY08 and#038; FY09 net income/(loss) Reconciliation of FY08 and FY09 net income/(loss) to adjusted EBITDA ( In thousands) Three Months Ended Twelve Months Ended March 31, March 31, 2009 2008 2009 2008 (Unaudited) (Unaudited) (Unaudited) Net (loss) income $ (113,788) $ ( 4,328) $ (284,134) $ 3,659 Plus: Interest expense (income) 90 (583) 659 ( 12 226) ) , , income), net 12,226) Income tax expense (benefit) 14,385 (880) (1,096) (922) Depreciation and amortization expense (a) 6,345 10,223 27,099 23,587 Other expense (income), net 1,875 (6,697) 2,570 (6,566) (Income) loss from discontinued operations (804) 40 1,947 (1,801) Adjusted EBITDA from continuing operations (91,897) (2,225) (252,955) 5 ,731 Asset impairment charges 86,213 - 231,856 - Restructuring charges (credits) 3,871 (103) 40,801 (75) Adjusted EBITDA excluding asset impairment and restructuring charges $ (1,813) $ ( 2,328) $ 19,702 $ 5,656 (a) Depreciation and amortization expense excludes amortization of deferred finance costs, as such costs are already included in interest (income) expense, net. 27 L38066_30 to adjusted EBITDA |
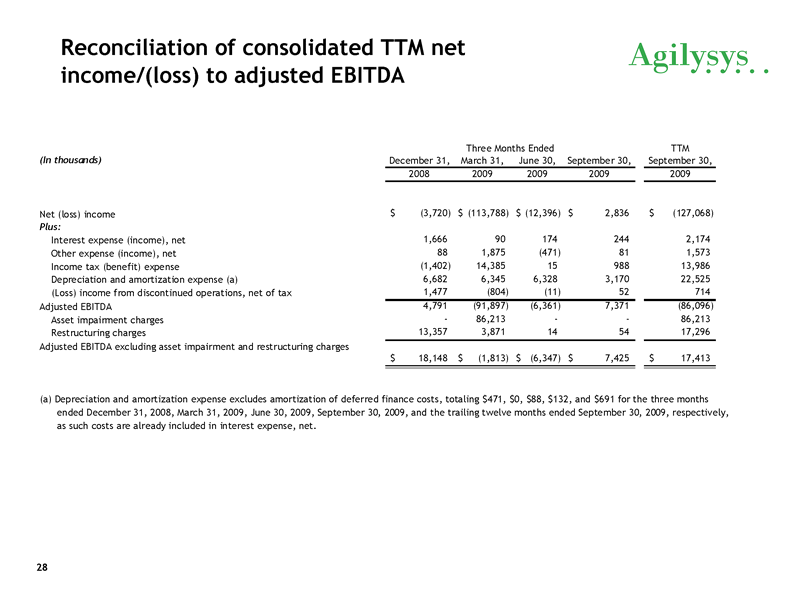
| Reconciliation of consolidated TTM net income/(loss) to adjusted ( ) justed EBITDA TTM December 31, March 31, June 30, September 30, September 30, 2008 2009 2009 2009 2009 Three Months Ended (In thousands) Net (loss) income $ (3,720) $ (113,788) $ (12,396) $ 2 ,836 $ (127,068) Plus: Interest expense (income), net 1,666 90 1 74 244 2,174 Other expense (income), net 88 1 ,875 ( 471) 81 1,573 Income tax (benefit) expense (1,402) 14,385 15 988 1 3,986 Depreciation and amortization expense (a) 6,682 6 ,345 6 ,328 3,170 2 2,525 (Loss) income from discontinued operations, net of tax 1,477 (804) (11) 52 714 Adjusted EBITDA 4,791 ( 91,897) ( 6,361) 7,371 ( 86,096) Asset impairment charges - 86,213 - - 8 6,213 Restructuring charges 13,357 3 ,871 14 54 1 7,296 Adjusted EBITDA excluding asset impairment and restructuring charges $ 1 8,148 $ ( 1,813) $ ( 6,347) $ 7 ,425 $ 17,413 (a) Depreciation and amortization expense excludes amortization of deferred finance costs, totaling $471, $0, $88, $132, and $691 for the three months ended December 31, 2008, March 31, 2009, June 30, 2009, September 30, 2009, and the trailing twelve months ended September 30, 2009, respectively, as such costs are already included in interest expense, net. 28 L38066_31 Reconciliation of consolidated TTM net income/(loss) to adjusted EBITDA |
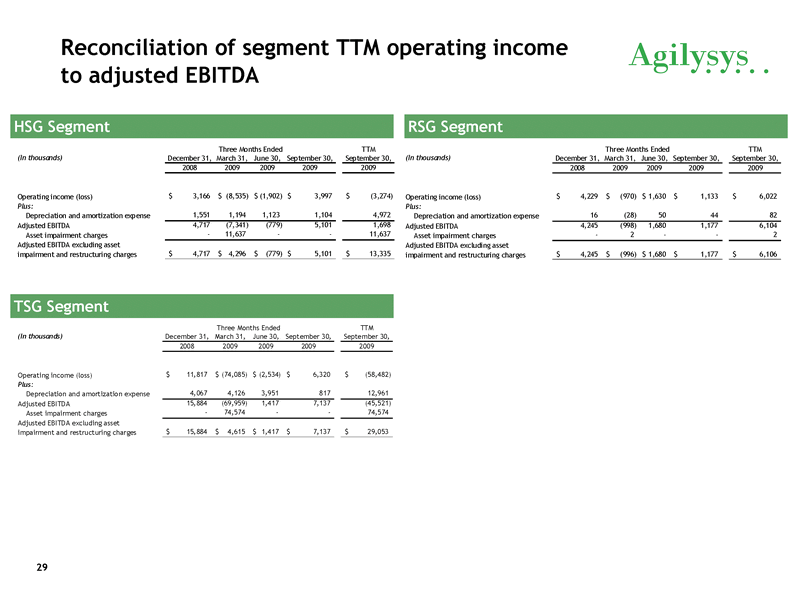
| Reconciliation of segment TTM operating income to adjusted EBITDA Reconciliation of segment TTM operating income to adjusted EBITDA HSG Segment RSG Segment TTM December 31, March 31, June 30, September 30, September 30, 2008 2009 2009 2009 2009 (In thousands) Three Months Ended TTM December 31, March 31, June 30, September 30, September 30, 2008 2009 2009 2009 2009 (In thousands) Three Months Ended Operating income (loss) $ 3,166 $ (8,535) $ (1,902) $ 3 ,997 $ ( 3,274) Plus: Depreciation and amortization expense 1,551 1,194 1,123 1,104 4,972 Adjusted EBITDA 4,717 ( 7,341) ( 779) 5,101 1,698 Asset impairment charges - 11,637 - - 1 1,637 Adjusted EBITDA excluding asset impairment and restructuring charges $ 4,717 $ 4,296 $ ( 779) $ 5 ,101 $ 13,335 Operating income (loss) $ 4,229 $ (970) $ 1,630 $ 1 ,133 $ 6 ,022 Plus: Depreciation and amortization expense 1 6 (28) 5 0 44 82 Adjusted EBITDA 4,245 ( 998) 1,680 1,177 6,104 Asset impairment charges - 2 - - 2 Adjusted EBITDA excluding asset p g g ) impairment and restructuring charges $ 4,245 $ (996) $ 1,680 $ 1 ,177 $ 6 ,106 TSG Segment TTM (In thousands) December 31, March 31, June 30, September 30, September 30, Three Months Ended 2008 2009 2009 2009 2009 Operating income (loss) $ 1 1,817 $ (74,085) $ (2,534) $ 6 ,320 $ ( 58,482) Plus: Depreciation and amortization expense 4,067 4 ,126 3,951 817 1 2,961 Adjusted EBITDA 15,884 ( 69,959) 1,417 7,137 ( 45,521) Asset impairment charges - 74,574 - - 7 4,574 Adjusted EBITDA excluding asset impairment and restructuring charges $ 1 5,884 $ 4,615 $ 1,417 $ 7 ,137 $ 29,053 29 L38066_32 HSG Segment RSG Segment TSG Segment |