As filed with the Securities and Exchange Commission on
November 10, 2009
Registration
No. 333-160417
UNITED STATES SECURITIES AND
EXCHANGE COMMISSION
Washington, D.C.
20549
Amendment No. 4
to
Form S-1
REGISTRATION STATEMENT
UNDER
THE SECURITIES ACT OF 1933
VUZIX CORPORATION
(Exact name of registrant as
specified in its charter)
| |
|
|
|
|
|
Delaware
|
|
3577
|
|
04-3392453
|
|
|
(State or other jurisdiction
of
incorporation or organization)
|
|
(Primary Standard Industrial
Classification Code Number)
|
|
(I.R.S. Employer
Identification Number)
|
75 Town Centre Drive
Rochester, NY 14623
(585) 359-5900
(Address, including
zip code, and telephone number, including area code, of
registrant’s principal executive offices)
Copies to:
| |
|
|
|
Robert F. Mechur, Esq.
Boylan, Brown, Code, Vigdor & Wilson, LLP
2400 Chase Square
Rochester, New York 14604
(585) 232-5300
|
|
Kenneth G. Sam, Esq.
Jason Brenkert, Esq.
Dorsey & Whitney LLP
370 17th Street, Suite 4700
Denver, Colorado 80202
(303) 629-3400
|
Approximate date of commencement of proposed sale to the
public: As soon as practicable after the
effective date of this registration statement.
If any of the securities being registered on this form are to be
offered on a delayed or continuous basis pursuant to
Rule 415 under the Securities Act, check the following
box. þ
If this form is filed to register additional securities for an
offering pursuant to Rule 462(b) under the Securities Act,
check the following box and list the Securities Act registration
statement number of the earlier effective registration statement
for the same
offering. o
If this form is a post-effective amendment filed pursuant to
Rule 462(c) under the Securities Act, check the following
box and list the Securities Act registration statement number of
the earlier effective registration statement for the same
offering. o
If this form is a post-effective amendment filed pursuant to
Rule 462(d) under the Securities Act, check the following
box and list the Securities Act registration number of the
earlier effective registration statement for the same
offering. o
Indicate by check mark whether the registrant is a large
accelerated filer, an accelerated filer, a non-accelerated
filer, or a smaller reporting company. See the definitions of
“large accelerated filer,” “accelerated
filer” and “smaller reporting company” in
Rule 12b-2
of the Exchange Act. (Check one):
| |
|
|
|
|
|
|
|
Large accelerated filer o
|
|
Accelerated filer o
|
|
Non-accelerated filer o
|
|
Smaller reporting company þ
|
|
|
|
|
|
(Do not check if a smaller reporting company)
|
|
|
| |
|
|
|
|
|
|
|
|
|
|
|
|
|
|
Proposed Maximum
|
|
|
Amount of
|
|
|
|
|
Aggregate
|
|
|
Registration
|
|
Title of Securities to be Registered
|
|
|
Offering Price(1)
|
|
|
Fee(6)
|
|
Units, each consisting of one share of Common Stock,
$0.001 par value, and one-half of one Common Stock Purchase
Warrant(2)
|
|
|
$
|
15,464,625.00
|
|
|
|
$
|
862.93
|
|
|
Shares of Common Stock included as part of the Units
|
|
|
|
|
|
|
|
|
|
|
|
Common Stock Purchase Warrants included as part of the Units
|
|
|
|
|
|
|
|
|
|
|
|
Shares of Common Stock underlying the Common Stock Purchase
Warrant included in the Units
|
|
|
$
|
11,598,469.00
|
(3)(5)
|
|
|
$
|
647.19
|
|
|
Agent Compensation Options(4)
|
|
|
|
|
|
|
|
|
|
|
|
Shares of Common Stock included as part of the Agent
Compensation Options
|
|
|
$
|
1,933,079.00
|
|
|
|
$
|
107.87
|
|
|
Common Stock Purchase Warrants included as part of the
Compensation Options(5)
|
|
|
|
|
|
|
|
|
|
|
|
Shares of Common Stock underlying the Common Stock Purchase
Warrants included in the Compensation Options
|
|
|
$
|
1,449,808.00
|
(3)(5)
|
|
|
$
|
80.90
|
|
|
Total
|
|
|
$
|
30,445,981.00
|
|
|
|
$
|
1698.89
|
|
|
|
|
|
|
|
|
|
|
|
|
|
|
|
|
|
(1)
|
|
Estimated solely for purposes of
calculating the registration fee in accordance with Rule 457(o)
under the Securities Act of 1933, as amended. In accordance with
Rule 457(o) under the Securities Act, the number of shares
being registered and the maximum offering price per share are
not included in this table.
|
| |
|
(2)
|
|
Public offering of units, each unit
consisting of one share of common stock, $0.001 par value,
and one-half of one common stock purchase warrant.
|
| |
|
(3)
|
|
Estimated pursuant to
Rule 457(g).
|
| |
|
(4)
|
|
Options entitling the Canadian
agents to purchase that number of shares of common stock and
warrants equal to 12.5% of the aggregate number of shares of
common stock and warrants sold under the offering, respectively,
at the offering price per share and warrant, respectively, for a
period of 12 months from the closing date.
|
| |
|
(5)
|
|
Pursuant to Rule 416, there
are also being registered such indeterminable additional
securities as may be issued as a result of any additional shares
of common stock that shall become issuable by reason of any
stock dividend, stock split, recapitalization or other similar
transaction effected without the receipt of consideration that
results in an increase in the number of the outstanding shares
of common stock.
|
| |
|
(6)
|
|
Registration fee previously paid in
connection with the initial filing of this Registration
Statement.
|
The Registrant hereby amends this Registration Statement on
such date or dates as may be necessary to delay its effective
date until the Registrant shall file a further amendment that
specifically states that this Registration Statement shall
thereafter become effective in accordance with Section 8(a)
of the Securities Act of 1933, as amended, or until the
Registration Statement shall become effective on such date as
the Commission, acting pursuant to said Section 8(a), may
determine.
EXPLANATORY
NOTES
This Registration Statement contains a prospectus relating to an
offering of shares of our common stock, warrants and common
stock acquirable upon exercise of warrants in the United States,
together with separate prospectus pages relating to an offering
of shares of our common stock, warrants and common stock
acquirable upon exercise of warrants in Canada. The
U.S. prospectus and the Canadian prospectus will be
identical in all material respects. The complete
U.S. prospectus is included herein and is followed by those
pages to be used solely in the Canadian prospectus. Each of the
alternate pages for the Canadian prospectus included in this
registration statement has been labeled “Alternate Page for
Canadian Prospectus.”
The
information in this prospectus is not complete and may be
changed. We may not sell these securities until the registration
statement filed with the Securities and Exchange Commission is
effective. This prospectus is not an offer to sell these
securities and it is not soliciting an offer to buy these
securities in any state where the offer or sale is not
permitted.
|
(Subject
to Completion) Dated November 10, 2009
PRELIMINARY PROSPECTUS
Vuzix
Corporation
Minimum Offering of
Cdn$6,000,000
Up to 50,000,000
Units
(each consisting of one share of
common stock and one half of one common stock purchase
warrant)
This is the initial public offering of our securities. We are
offering for sale up to 50,000,000 units at a price between
Cdn$0.15 and Cdn$0.25 per unit, on a best efforts basis. Each
unit consists of one share of our common stock and
one-half of
one common stock purchase warrant. Each whole warrant entitles
its holder to purchase one share of our common stock at a price
of 150% of the initial public offering price per unit at any
time for up to 36 months after the closing of this
offering. The shares of common stock and warrants underlying the
units will be issued separately. Our units are being
concurrently offered to the public in Canada by our Canadian
agents. Our agents are not purchasing any of the offered units.
The agents must sell the number of units that will result in us
receiving the minimum gross proceeds (Cdn$6,000,000) if any are
sold. The agents are required to use their best efforts to sell
the maximum number of units offered (50,000,000 units). The
funds received in payment for the units sold in this offering
will be deposited into a non-interest bearing escrow account and
held until the closing of the offering. The offering will close
as soon as practicable after the minimum gross proceeds have
been raised. If the minimum gross proceeds are not raised within
90 days of the date of this prospectus, all funds will be
returned to investors promptly without interest or deduction of
fees. There is currently no public market through which our
securities may be sold, and you may not be able to resell any
securities you purchase under this prospectus. We have
applied to list our common stock and the warrants included in
the units on the TSX Venture Exchange (TSX-V) under the symbols
“l”
and
“l”,
respectively. Listing of our common stock and warrants will be
subject to fulfilling all of the requirements of the TSX-V.
Our business and an investment in our securities involve
significant risks. These risks are described under the caption
“Risk Factors” beginning on page 8 of this
prospectus.
Neither the SEC nor any other securities commission or
regulatory authority has approved or disapproved of these
securities or has passed upon the accuracy or adequacy of this
prospectus. Any representation to the contrary is a criminal
offense.
If we raise the minimum proceeds from this offering
(Cdn$6.0 million or approximately US$5.63 million) by
selling 30,000,000 units at Cdn$0.20 per unit
(the midpoint of our estimated initial public offering
price range), we estimate that the net proceeds to us from the
offering, after agents commissions, would be approximately
Cdn$5.52 million or Cdn$0.184 per unit. If we sell the
maximum number of units we are offering (50,000,000 units)
at Cdn$0.25 per unit (the maximum of our estimated initial
public offering price range), we would receive gross proceeds of
Cdn$12.5 million (or approximately US$11.74 million)
and estimate that the net proceeds to us, after agents
commissions, would be approximately Cdn$11.5 million or
Cdn$0.23 per unit.
The public offering price for units offered in the United States
is payable in US dollars, and the public offering price for
units offered in Canada and elsewhere outside the United States
is payable in Canadian dollars, except as may otherwise be
agreed by the agents. The US dollar amount of the public
offering price will be
US$ l
(the equivalent of the Canadian dollar amount based on the
closing buying rate of the Bank of Canada on the date
immediately prior to the effective date of the registration
statement of which this prospectus forms a part) and converted
into Canadian dollar equivalents for purposes of determining
whether we have received minimum gross proceeds of Cdn$6,000,000.
The agents expect to deliver the shares of common stock and
warrants comprising the units in Toronto, Ontario, Canada on or
about ,
2009.
CANACCORD ADAMS INC.
The date of this prospectus
is ,
2009.
Through and
including ,
2009 (the 40th day after the date of this prospectus), all
dealers effecting transactions in units or shares of our common
stock, whether or not participating in this offering, may be
required to deliver a prospectus. This is in addition to a
dealer’s obligation to deliver a prospectus when acting as
an underwriter with respect to an unsold allotment or
subscription.
ii
PROSPECTUS
SUMMARY
This summary provides an overview of selected information
contained elsewhere in this prospectus and does not contain all
of the information you should consider before investing in our
securities. You should carefully read the prospectus and the
registration statement of which this prospectus is a part in
their entirety before investing in our securities, including the
information discussed under “Risk Factors” beginning
on page 7 and our financial statements and notes thereto
that appear elsewhere in this prospectus.
BUSINESS
Company
Overview
We are engaged in the design, manufacture, marketing and sale of
devices that are worn like eyeglasses and feature built-in video
screens that enable the user to view video and digital content,
such as movies, computer data, the Internet or video games. Our
products (known commercially as Video Eyewear, but also commonly
referred to as virtual displays, wearable displays, personal
viewers, personal displays, head mounted displays, or
near-to-eye
displays) are used to view high-resolution video and digital
information primarily from mobile devices (such as cell phones,
portable media players, gaming systems and laptop computers) and
from personal computers. Our products provide the user with a
virtual viewing experience that simulates viewing a large screen
television or desktop computer monitor practically anywhere,
anytime.
Our Video Eyewear products feature high performance miniature
display modules, low power electronics and related optical
systems. We produce both monocular and binocular Video Eyewear
devices that we believe are excellent solutions for many mobile
computer, mobile internet devices (MID) or video viewing
requirements, including general entertainment applications. We
focus on two markets: the consumer markets for gaming, mobile
video viewing and stereoscopic three-dimensional video viewing;
and rugged mobile displays for defense and industrial
applications. We also offer low-vision assist Video Eyewear
products that are designed to assist and improve the remaining
vision of people suffering from macular degeneration.
The development of intellectual property rights relating to our
technologies is a key aspect of our business strategy. We have
generated and continue to generate intellectual property as a
result of our ongoing performance of development contracts and
our internal research and development activities. We have also
acquired technologies developed by third parties and we may do
so in the future.
Our business is subject to numerous risks, as discussed more
fully in the section entitled “Risk Factors”
immediately following this prospectus summary. The risks we face
include the following:
|
|
|
| |
•
|
We have incurred net losses since our inception and if we
continue to incur net losses in the foreseeable future the
market price of our common stock may decline.
|
| |
| |
•
|
We have depended on defense related engineering contracts and
product orders from two customers for the majority of our sales
and our revenues would be materially reduced if we are unable to
obtain sales from government contracts or if either of our two
significant customers reduce or delay orders from us.
|
| |
| |
•
|
If management continues to own a significant percentage of our
outstanding common stock, management may prevent other
stockholders from influencing significant corporate decisions.
|
| |
| |
•
|
We do not manufacture our own microdisplays, one of the key
components of our Video Eyewear products, and we may not be able
to obtain the microdisplays we need.
|
| |
| |
•
|
If we fail to develop new products and adapt to new
technologies, our business and results of operations may be
materially adversely affected.
|
| |
| |
•
|
If microdisplay-based personal displays do not gain some
reasonable level of acceptance in the market for mobile
displays, our business strategy may fail.
|
| |
| |
•
|
We may incur substantial costs or lose important rights as a
result of litigation or other proceedings relating to our
products, patents and other intellectual property rights.
|
1
|
|
|
| |
•
|
Purchasers of our units will experience immediate and
substantial dilution as a result because their common stock will
be worth less on a net tangible book value basis than the amount
they invested.
|
Industry
Overview
Many mobile devices now allow the user to view high-resolution
full color content. We believe that typical displays currently
used on mobile devices do not work well for this purpose because
they are either too small, making it extremely difficult to view
the detail in their display images with a human eye, or too
large, making the mobile device cumbersome and difficult to use
and carry. Some mobile devices employ a touch screen with
software to magnify or zoom in on a partial image. We believe
that many consumers consider this solution unsatisfactory
because it is difficult to navigate and find information on the
portion of the page being viewed.
In contrast, our Video Eyewear products enable the user to
effectively view the entire screen on a small, eyeglass-like
device. Our products employ microdisplays that provide full
screen resolution but are smaller than one-inch diagonally, with
some as small as one-quarter of an inch. To make images on the
microdisplays viewable, our Video Eyewear products incorporate
proprietary magnifying optics that are usually designed by us.
The result is a detailed virtual image that appears to the
viewer to be similar to the image on a full size computer screen
from a normal desktop working distance or the image on a large
flat panel television from normal home TV viewing distance. For
example, when magnified through our optics, a high-resolution
0.44-inch diagonal microdisplay can provide a viewing experience
comparable to that on a
62-inch
diagonal television screen viewed at nine feet. We refer to this
as a 62-inch
virtual display.
We believe that there is growing demand for mobile access to
high-resolution content in both the consumer and industrial and
defense markets.
Our
Products
We offer products that use our proprietary technology and are
designed to meet the unique requirements of the consumer,
industrial and defense markets.
Binocular
Video Eyewear Products
Each binocular Video Eyewear product contains two microdisplay
screens, one in front of each eye, mounted in a frame attached
to eyeglass-style temples with headphones. These products enable
mobile private viewing of video content on virtual displays that
can simulate theater-sized screens. They are currently sold on
the basis of resolution and their effective virtual viewing
screen size. Our products today range from 320 × 240 pixels
(Quarter Video Graphics Array or QVGA) to 800 × 600 pixels
(Super Video Graphics Array or SVGA) resolution and provide
virtual screen sizes of 44- to
62-inch
screens viewed at nine feet. We also offer an interactive
version for PC gaming which includes our proprietary head
tracking technology, which enables the user to look around the
environment being displayed in the game by simply moving his or
her head, and a microphone to enable communication with others.
Finally, we offer a binocular Video Eyewear product that
integrates a high-resolution camera with digital magnification,
designed to assist and improve the remaining vision of persons
suffering from macular degeneration.
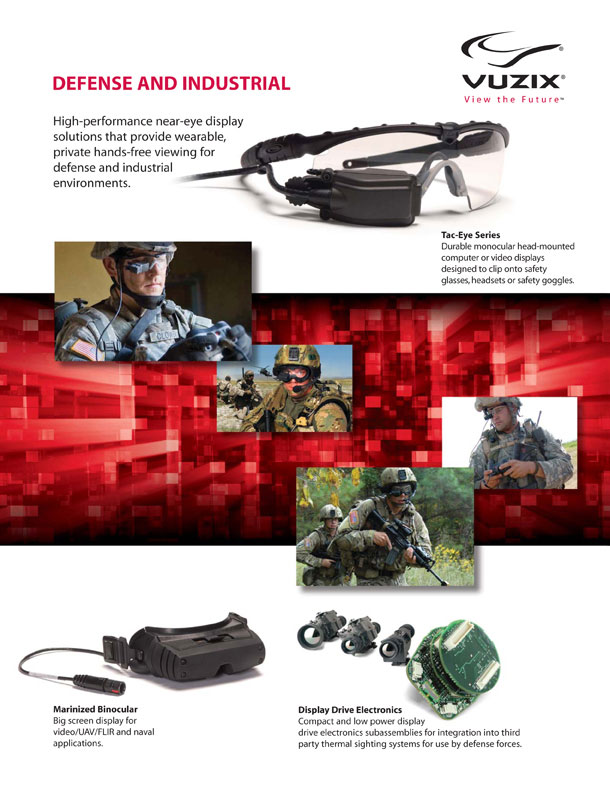
Monocular
Video Eyewear Products
Our
Tac-Eye®
monocular (single eye) Video Eyewear products are designed to
clip on to a pair of ballistic sunglasses, a head set or
conventional safety goggles. They can be used with rugged
laptops, security and night vision cameras and thermal night
vision sights, including those sights for which we currently
build the display drive electronics as a
sub-contractor
to the US Department of Defense.
Tac-Eye®
enables users to have wearable, private, hands-free and
glanceable access to high-resolution content or information
while retaining most of their real world view.
2
Defense
Sub-Assembly
and Custom Solutions
We are involved in several programs as part of contracting teams
that produce thermal night vision sights to the US Department of
Defense. We design and manufacture many of the display drive
electronic subassemblies for light, medium, and heavy weight
thermal weapon sighting systems for the US and other defense
forces. When possible, we obtain a first right of refusal to be
the volume manufacturer of our proprietary display subassemblies
as part of our contracting process for the custom design of
products.
Our
Strategy
Our strategy is to establish and maintain a leadership position
as a worldwide supplier of Video Eyewear and other virtual
display technology solutions. We intend to offer our
technologies across major markets, platforms and applications.
We will strive to be an innovator in designing virtual display
devices that enable new mobile video viewing as well as general
entertainment applications.
To maintain and enhance our position as a leading provider of
virtual display solutions, we intend to:
|
|
|
| |
•
|
improve our brand name recognition;
|
| |
| |
•
|
develop products for large markets;
|
| |
| |
•
|
broaden and develop strategic relationships and partnerships;
|
| |
| |
•
|
expand market awareness for virtual display solutions;
|
| |
| |
•
|
maintain and exploit any cost advantage our technology can
provide us;
|
| |
| |
•
|
extend our proprietary technology leadership; and
|
| |
| |
•
|
establish multiple revenue sources.
|
Company
Information
We were incorporated under the Delaware General Corporation Law
in 1997 as VR Acquisition Corp. In 1997 we changed our name to
Kaotech Corporation. In 1998 we changed our name to Interactive
Imaging Systems, Inc. In 2004 we changed our name to Vicuity
Corporation and then to Icuiti Corporation. In September 2007 we
changed our name to Vuzix Corporation.
Our principal executive offices are located at 75 Town Centre
Drive, Rochester, New York 14623. Our telephone number is
(585) 359-5900.
We maintain an Internet website at www.vuzix.com. The
information contained on, connected to or that can be accessed
via our website is not part of this prospectus. We have included
our website address in this prospectus as an inactive textual
reference only and not as an active hyperlink.
Our wholly-owned direct subsidiary is Vuzix (Europe) Limited,
which we refer to in this prospectus as Vuzix Europe. Vuzix
Europe was incorporated on April 10, 2008 pursuant to the
provisions of the Companies Act (England and Wales). The
registered and head office of Vuzix Europe is located at St.
John’s House, 5 South Parade, Summertown, Oxford OX2 7JL.
The
Offering
|
|
|
|
Securities offered by Vuzix |
|
Up to 50,000,000 units; each unit consisting of one share of our
common stock, par value $0.001 per share, and one half of one
common stock purchase warrant. |
| |
|
|
|
Up to 84,375,000 shares of our common
stock.(1) |
| |
|
|
|
Up to 25,000,000 common stock purchase warrants. Each whole
warrant will entitles its holder to purchase one share of our
common stock at a price of 150% of the initial public offering
price per unit at any time for 36 months after the closing
of this offering. If the weighted-average closing price of our
common stock on the TSX-V exceeds 250% of the initial public
offering price per unit for 20 consecutive trading days at any
time beginning 180 days after the date on which our common stock
is first traded on the TSX-V, we will have the right,
exercisable at our sole discretion, to accelerate the |
3
|
|
|
|
|
|
expiration date of the warrants by providing written notice to
each registered warrant holder within five business days and
issuing a press release to the effect that the warrants will
expire at 5:00 p.m. (Toronto time) on the date specified in
the notice and press release, provided that the accelerated
expiration date may not be less than 30 days following the date
of the notice and press release. |
| |
|
Minimum gross proceeds |
|
Cdn$6,000,000 |
|
|
|
|
Common stock to be outstanding after this offering |
|
Between 274,974,896 shares (assuming minimum gross proceeds of
Cdn$6,000,000 at the initial public offering price of Cdn$0.15
per unit) and 285,174,896 shares (assuming the sale of the
maximum number of units offered (50,000,000
units).(2) |
|
|
|
|
Agent Compensation |
|
As consideration for their services, the Canadian agents will
receive: (i) a commission equal to 8% of the gross proceeds
of the offering; (ii) options entitling the Canadian agents
to purchase that number of shares of our common stock and
warrants equal to 12.5% of the aggregate number of shares of our
common stock and warrants sold under the offering, at the
offering price per share and warrant, for a period of
12 months from the closing date; and (iii) a non-refundable
due diligence fee of Cdn$15,000. The Canadian agents will also
be reimbursed for their reasonable fees and expenses including
the reasonable legal fees and disbursements of legal counsel to
the agents. Canaccord Adams Inc. and any US selling agents that
the Canadian agents may appoint will be paid cash selling
commissions not to exceed 6% of the gross proceeds of the
offering in the United States and options entitling the US
selling agents to purchase that number of shares of our common
stock and warrants sold in the United States under the offering
equal to 8% of the aggregate number of shares of our common
stock and warrants at the initial public offering price for a
period of 12 months from the closing date. The commission paid
to US selling agents will be paid by the Canadian agents from
their commissions and the options issued to the US selling
agents will be assigned by the Canadian agents from their
options. This prospectus covers the sale of the shares of our
common stock and warrants issuable upon exercise of the
agents’ options. |
| |
|
|
|
In consideration of certain fiscal advisory services rendered by
the Canadian agents to us pursuant to a fiscal advisory fee
agreement between us and the Canadian agents, we have agreed to
issue to the Canadian agents at the closing of this offering, in
payment of a fiscal advisory fee, that number of shares of our
common stock equal to, depending on the gross proceeds of the
offering, between 1.0% and 2.0% of our common stock issued and
outstanding immediately upon the closing of the offering. The
issuance of these shares to the Canadian agents is not covered
by this prospectus. These shares will be subject to resale
restrictions under applicable United States and Canadian
securities legislation and a contractual lock-up agreement for
one year. See “Underwriting — Fiscal Advisory Fee
Agreement.” |
|
|
|
|
Use of proceeds |
|
The minimum gross proceeds to us from the offering will be
Cdn$6,000,000 (or approximately US$5.63 million) and we
estimate that the net proceeds to us from such amount, after
payment of agents’ commissions and offering-related
expenses, would be approximately Cdn$4,800,000. Assuming the
sale of the maximum number of units offered (50,000,000 units)
and an initial public offering price of Cdn$0.25 per unit (the
maximum of our estimated initial public offering price range),
we would receive gross proceeds of Cdn$12,500,000 (or
approximately US$11.74 million) and we estimate that the
net proceeds to us from such amount, after payment of |
4
|
|
|
|
|
|
agents’ commissions and offering-related expenses, would
be approximately Cdn$10,750,000. We expect to use $1,234,000 of
the net proceeds of this offering to repay outstanding
indebtedness, including accrued interest. The indebtedness to be
repaid includes $215,500 in principal amount plus interest
payable to our President and Chief Executive Officer. We intend
to use the remainder of the net proceeds from this offering new
product development and tooling expenses; for research and
development expenses; capital expenditures; selling, marketing,
general and administrative expenses; possible acquisitions of
businesses, technologies or other assets; and general corporate
purposes. For additional information see “Use of
Proceeds.” |
|
|
|
|
Risk Factors |
|
See “Risk Factors” beginning on page 8 and other
information included in this prospectus for a discussion of
factors you should carefully consider before deciding to invest
in our securities. |
|
|
|
|
(1) |
|
Consists of up to (i) 50,000,000 shares included in
the units; (ii) 25,000,000 shares issuable upon
exercise of the common stock purchase warrants included in the
units; and (iii) up to 6,250,000 shares issuable upon
exercise of the options issued to the agents as compensation and
up to an additional 3,125,000 shares issuable upon exercise
of common stock purchase warrants issuable upon exercise of the
options issued to the agents as compensation. |
|
|
|
|
(2) |
|
Includes (i) up to 5,592,246 shares issued to the agents in
payment of a fiscal advisory fee; (ii) up to 7,148,982 shares
issuable upon conversion of 168,500 outstanding shares of our
Series C 6% Convertible Preferred Stock (Series C Preferred
Stock), together with all accrued and unpaid dividends thereon
through September 30, 2009, at the rate of $0.2917 per share;
and (iii) up to 4,642,189 shares issuable upon conversion of
$575,000 in aggregate principal amount of convertible promissory
notes outstanding, together with all accrued and unpaid interest
thereon through September 30, 2009. Does not include (i) up
to 15,304,554 shares issuable upon exercise of options
granted under our 2007 Amended and Restated Stock Option Plan;
(ii) any of the shares described in footnote (1) above
other than those described in clause (i) of
footnote (1); (iii) up to 1,200,00 shares
issuable upon exercise of options under our 2009 option plan
that we intend to grant to our four new non-employee directors
at the closing of this offering; and (iv) up to 4,867,283
shares issuable upon exercise of outstanding warrants. |
5
Selected
Summary Financial Data
The following tables present our summary financial data and
should be read together with our financial statements and
accompanying notes and “Management’s Discussion and
Analysis of Financial Condition and Results of Operations”
appearing elsewhere in this prospectus. The summary financial
data for the years ended December 31, 2008, 2007 and 2006
are derived from our audited annual financial statements, which
are included elsewhere in this prospectus. The unaudited summary
financial data as of June 30, 2009 and for the three and
six months ended June 30, 2009 and 2008 have been derived
from our unaudited interim financial statements, which are
included elsewhere in this prospectus, and include all
adjustments, consisting of normal recurring adjustments,
necessary for a fair presentation of our financial position and
results of operations for these periods.
| |
|
|
|
|
|
|
|
|
|
|
|
|
|
|
|
|
|
|
|
Three Months Ended June 30,
|
|
|
Six Months Ended June 30,
|
|
|
Statement of Operations Data
|
|
2009
|
|
|
2008
|
|
|
2009
|
|
|
2008
|
|
|
|
|
(Unaudited)
|
|
|
(Unaudited)
|
|
|
(Unaudited)
|
|
|
(Unaudited)
|
|
|
|
|
(Restated)
|
|
|
(Restated)
|
|
|
(Restated)
|
|
|
(Restated)
|
|
|
|
|
Sales
|
|
$
|
2,063,733
|
|
|
$
|
3,087,338
|
|
|
$
|
5,082,087
|
|
|
$
|
4,807,982
|
|
|
Cost of Sales
|
|
|
1,390,819
|
|
|
|
1,871,661
|
|
|
|
3,221,861
|
|
|
|
3,358,739
|
|
|
|
|
|
|
|
|
|
|
|
|
|
|
|
|
|
|
|
|
Gross Margin
|
|
|
672,914
|
|
|
|
1,215,677
|
|
|
|
1,860,226
|
|
|
|
1,449,243
|
|
|
Operating Expenses
|
|
|
|
|
|
|
|
|
|
|
|
|
|
|
|
|
|
Research and development
|
|
|
428,737
|
|
|
|
1,224,265
|
|
|
|
945,897
|
|
|
|
1,960,982
|
|
|
Selling and marketing
|
|
|
520,257
|
|
|
|
483,695
|
|
|
|
976,041
|
|
|
|
933,257
|
|
|
General and administrative
|
|
|
534,142
|
|
|
|
438,831
|
|
|
|
990,729
|
|
|
|
972,630
|
|
|
Depreciation and amortization
|
|
|
167,509
|
|
|
|
123,696
|
|
|
|
306,343
|
|
|
|
247,392
|
|
|
|
|
|
|
|
|
|
|
|
|
|
|
|
|
|
|
|
|
Total operating expenses
|
|
|
1,650,645
|
|
|
|
2,270,487
|
|
|
|
3,219,010
|
|
|
|
4,114,261
|
|
|
|
|
|
|
|
|
|
|
|
|
|
|
|
|
|
|
|
|
Profit (Loss) from operations
|
|
|
(977,731
|
)
|
|
|
(1,054,810
|
)
|
|
|
(1,358,784
|
)
|
|
|
(2,665,018
|
)
|
|
Interest and other income (expense)
|
|
|
11
|
|
|
|
—
|
|
|
|
59
|
|
|
|
166
|
|
|
Foreign exchange (loss) gain
|
|
|
(3,657
|
)
|
|
|
(300
|
)
|
|
|
(4,969
|
)
|
|
|
(33
|
)
|
|
Interest expense
|
|
|
(56,711
|
)
|
|
|
(57,353
|
)
|
|
|
(122,095
|
)
|
|
|
(99,019
|
)
|
|
Tax (expense) benefit
|
|
|
(888
|
)
|
|
|
(2,897
|
)
|
|
|
(1,776
|
)
|
|
|
(3,650
|
)
|
|
|
|
|
|
|
|
|
|
|
|
|
|
|
|
|
|
|
|
Total tax and other income (expense)
|
|
|
(61,245
|
)
|
|
|
(60,550
|
)
|
|
|
(128,781
|
)
|
|
|
(102,536
|
)
|
|
|
|
|
|
|
|
|
|
|
|
|
|
|
|
|
|
|
|
Net (Loss)
|
|
$
|
(1,038,976
|
)
|
|
$
|
(1,115,360
|
)
|
|
$
|
(1,487,565
|
)
|
|
$
|
(2,767,554
|
)
|
|
|
|
|
|
|
|
|
|
|
|
|
|
|
|
|
|
|
|
Income (loss) per share:
|
|
|
|
|
|
|
|
|
|
|
|
|
|
|
|
|
|
Basic and fully diluted*
|
|
$
|
(0.0048
|
)
|
|
$
|
(0.0057
|
)
|
|
$
|
(0.0070
|
)
|
|
$
|
(0.0141
|
)
|
|
Weighted average common shares outstanding:
|
|
|
|
|
|
|
|
|
|
|
|
|
|
|
|
|
|
Basic and fully diluted*
|
|
|
220,268,927
|
|
|
|
200,424,027
|
|
|
|
219,935,594
|
|
|
|
200,015,546
|
|
6
| |
|
|
|
|
|
|
|
|
|
|
|
|
|
|
|
|
|
|
|
Year Ended December 31,
|
|
|
|
|
|
Statement of Operations Data
|
|
2008
|
|
|
2007
|
|
|
2006
|
|
|
|
|
|
|
|
(Restated)
|
|
|
(Restated)
|
|
|
(Restated)
|
|
|
|
|
|
|
|
Sales
|
|
$
|
12,489,884
|
|
|
$
|
10,146,379
|
|
|
$
|
9,538,308
|
|
|
|
|
|
|
Cost of Sales
|
|
|
8,788,905
|
|
|
|
6,783,473
|
|
|
|
5,767,550
|
|
|
|
|
|
|
|
|
|
|
|
|
|
|
|
|
|
|
|
|
|
|
|
|
Gross Margin
|
|
|
3,700,979
|
|
|
|
3,362,906
|
|
|
|
3,770,758
|
|
|
|
|
|
|
Operating Expenses
|
|
|
|
|
|
|
|
|
|
|
|
|
|
|
|
|
|
Research and development
|
|
|
3,366,518
|
|
|
|
2,365,412
|
|
|
|
1,279,239
|
|
|
|
|
|
|
Selling and marketing
|
|
|
2,128,625
|
|
|
|
1,920,164
|
|
|
|
1,191,800
|
|
|
|
|
|
|
General and administrative
|
|
|
2,299,685
|
|
|
|
1,718,627
|
|
|
|
1,560,278
|
|
|
|
|
|
|
Depreciation and amortization
|
|
|
510,133
|
|
|
|
374,078
|
|
|
|
276,989
|
|
|
|
|
|
|
|
|
|
|
|
|
|
|
|
|
|
|
|
|
|
|
|
|
Total operating expenses
|
|
|
8,304,961
|
|
|
|
6,378,281
|
|
|
|
4,308,306
|
|
|
|
|
|
|
|
|
|
|
|
|
|
|
|
|
|
|
|
|
|
|
|
|
Profit (Loss) from operations
|
|
|
(4,603,982
|
)
|
|
|
(3,015,375
|
)
|
|
|
(537,548
|
)
|
|
|
|
|
|
Interest and other income (expense)
|
|
|
188
|
|
|
|
2,549
|
|
|
|
313
|
|
|
|
|
|
|
Foreign exchange (loss) gain
|
|
|
(24,216
|
)
|
|
|
—
|
|
|
|
—
|
|
|
|
|
|
|
Interest expense
|
|
|
(260,977
|
)
|
|
|
(241,692
|
)
|
|
|
(179,019
|
)
|
|
|
|
|
|
Legal settlement
|
|
|
—
|
|
|
|
96,632
|
|
|
|
—
|
|
|
|
|
|
|
Tax (expense) benefit
|
|
|
(5,212
|
)
|
|
|
98,372
|
|
|
|
(3,700
|
)
|
|
|
|
|
|
|
|
|
|
|
|
|
|
|
|
|
|
|
|
|
|
|
|
Total tax and other income (expense)
|
|
|
(290,217
|
)
|
|
|
(44,139
|
)
|
|
|
(182,406
|
)
|
|
|
|
|
|
|
|
|
|
|
|
|
|
|
|
|
|
|
|
|
|
|
|
Net (Loss)
|
|
$
|
(4,894,199
|
)
|
|
$
|
(3,059,514
|
)
|
|
$
|
(719,954
|
)
|
|
|
|
|
|
|
|
|
|
|
|
|
|
|
|
|
|
|
|
|
|
|
|
Income (loss) per share:
|
|
|
|
|
|
|
|
|
|
|
|
|
|
|
|
|
|
Basic and fully diluted*
|
|
$
|
(0.0240
|
)
|
|
$
|
(0.0176
|
)
|
|
$
|
(0.0047
|
)
|
|
|
|
|
|
Weighted average common shares outstanding:
|
|
|
|
|
|
|
|
|
|
|
|
|
|
|
|
|
|
Basic and fully diluted*
|
|
|
207,710,498
|
|
|
|
185,263,660
|
|
|
|
173,254,715
|
|
|
|
|
|
|
|
|
|
* |
|
All outstanding warrants, options, and convertible debt are
anti-dilutive, therefore basic and diluted earnings per share
are the same for all periods. |
| |
|
|
|
|
|
|
|
|
|
|
|
|
|
|
|
|
|
|
|
|
|
|
|
Year Ended December 31,
|
|
|
Six Months Ended June 30,
|
|
|
Cash Flow Data
|
|
2008
|
|
|
2007
|
|
|
2006
|
|
|
2009
|
|
|
2008
|
|
|
|
|
|
|
|
|
|
|
|
|
|
(Unaudited)
|
|
|
(Unaudited)
|
|
|
|
|
Cash flows provided by (used in) operating activities
|
|
$
|
(1,285,449
|
)
|
|
$
|
(3,295,900
|
)
|
|
$
|
120,053
|
|
|
$
|
(476,637
|
)
|
|
$
|
(107,925
|
)
|
|
Cash flows (used in) investing activities
|
|
|
(549,804
|
)
|
|
|
(316,743
|
)
|
|
|
(479,236
|
)
|
|
|
(148,777
|
)
|
|
|
(259,193
|
)
|
|
Cash flows provided by financing activities
|
|
|
2,289,116
|
|
|
|
3,408,328
|
|
|
|
874,569
|
|
|
|
91,820
|
|
|
|
106,255
|
|
| |
|
|
|
|
|
|
|
|
|
|
|
|
|
|
|
|
|
|
|
|
|
|
|
As of December 31,
|
|
|
As of June 30,
|
|
|
Balance Sheet Data
|
|
2008
|
|
|
2007
|
|
|
2006
|
|
|
2009
|
|
|
2008
|
|
|
|
|
|
|
|
|
|
|
|
|
|
(Unaudited)
|
|
|
(Unaudited)
|
|
|
|
|
Cash and cash equivalents
|
|
$
|
818,719
|
|
|
$
|
364,856
|
|
|
$
|
569,171
|
|
|
$
|
285,126
|
|
|
$
|
103,993
|
|
|
Working Capital (deficiency)
|
|
|
(1,846,289
|
)
|
|
|
966,658
|
|
|
|
69,766
|
|
|
|
(2,808,676
|
)
|
|
|
(2,150,731
|
)
|
|
Total Assets
|
|
|
6,221,897
|
|
|
|
6,967,254
|
|
|
|
5,013,263
|
|
|
|
4,351,101
|
|
|
|
5,939,483
|
|
|
Long-Term Liabilities
|
|
|
1,754,379
|
|
|
|
2,014,476
|
|
|
|
1,980,476
|
|
|
|
1,797,680
|
|
|
|
1,606,559
|
|
|
Accumulated (deficit)
|
|
|
(14,687,276
|
)
|
|
|
(9,691,977
|
)
|
|
|
(6,531,363
|
)
|
|
|
(16,225,391
|
)
|
|
|
(12,510,081
|
)
|
|
Total Stockholders’ equity (deficit)
|
|
|
(2,089,942
|
)
|
|
|
423,236
|
|
|
|
(603,954
|
)
|
|
|
(3,253,196
|
)
|
|
|
(2,274,435
|
)
|
7
RISK
FACTORS
An investment in our securities involves a high degree of
risk. You should carefully consider the risks described below,
together with all of the other information included in this
prospectus, before making an investment decision. If any of the
following risks actually occurs, our business, financial
condition or results of operations could suffer. In that case,
the market value of our securities could decline, and you may
lose all or part of your investment.
RISKS
RELATED TO OUR BUSINESS
Because
we have a limited operating history in the Video Eyewear
industry, there is a limited amount of past experience upon
which to evaluate our business and prospects.
We were formed in 1997 to develop and sell virtual reality and
other personal display technology and products. Since our
inception the majority of our sales have been derived from the
sale of night vision display drive electronics and from research
and development contracts with suppliers to the US government
and others. In 2003, we discontinued our original virtual
reality product line to focus on Video Eyewear products. Since
that time, the market for Video Eyewear products has developed
more slowly than we anticipated. Although we sold our first
monocular Video Eyewear products in 2003 and our first binocular
Video Eyewear products in February 2005, since 2003 we have
continued to earn the majority of our revenues from defense
related engineering contracts. Accordingly, there is a limited
amount of Video Eyewear-related experience upon which to
evaluate our business and prospects, and a potential investor
should consider the challenges, expenses, delays and other
difficulties involved in the development of our business,
including the continued development of our technology and the
achievement of market acceptance for products using our
technology.
We
have incurred net losses since our inception and if we continue
to incur net losses in the foreseeable future the market price
of our common stock may decline.
We incurred annual net losses of $4,894,199 in 2008, $3,059,514
in 2007 and $719,954 in 2006 and net losses of $1,487,565 and
$2,767,554 for the six-month periods ended June 30, 2009
and 2008, respectively. We had an accumulated deficit of
$16,225,391 as of June 30, 2009.
We may not achieve or maintain profitability in the future. In
particular, we expect that our expenses relating to sales and
marketing and product development and support, as well as our
general and administrative costs, will increase, requiring us to
increase sales in order to achieve and maintain profitability.
If we do not achieve and maintain profitability, our financial
condition will be materially and adversely affected. We would
eventually be unable to continue our operations unless we were
able to raise additional capital. We may not be able to raise
any necessary capital on commercially reasonable terms or at
all. If we fail to achieve or maintain profitability on a
quarterly or annual basis within the timeframe expected by
investors, the market price of our common stock may decline.
We
have depended on defense related engineering contracts and two
customers for sales and our revenues would be materially reduced
if we are unable to continue to obtain sales from government
contracts or if either of our two significant customers reduce
or delay orders from us.
Since inception, the majority of our sales have been derived
from the sale of night vision display drive electronics to two
suppliers to the US government. Sales of night vision display
drive electronics to these customers amounted to 51%, 14% and
42% of our sales in 2008, 2007 and 2006, respectively, and 44%
and 16% for the six-month periods ended June 30, 2009 and
2008, respectively. We have no long-term contracts with these
customers. A significant reduction or delay in orders from
either of our significant customers would materially reduce our
revenue and cash flow and adversely affect our ability to
achieve or maintain profitability in the future.
The next largest source of revenues has been sales directly to
the US Department of Defense, primarily for engineering
programs. Such sales amounted to 12%, 54% and 27% of our sales
in 2008, 2007 and 2006, respectively, and 6% and 2% for the
six-month periods ended June 30, 2009 and 2008,
respectively. We have no long-term contracts with the US
government for engineering services. We plan to submit proposals
for additional
8
development contract funding. However, development contract
funding is subject to legislative authorization and, even if
funds are appropriated, such funds may be withdrawn based on
changes in government priorities.
Together, these two groups of customers accounted for 32%, 71%
and 69% of our sales in 2008, 2007 and 2006, respectively, and
for 50% and 18% of our sales in the six-month periods ended
June 30, 2009 and 2008. We may not be successful in
obtaining new government contracts or in receiving further night
vision display electronics orders. Our inability to obtain sales
from government contracts could have a material adverse effect
on our results of operations and would likely cause us to delay
or slow our growth plans, resulting in lower net sales and
adversely affect our liquidity and profitability.
Because
our US government defense contracts and subcontracts are subject
to procurement laws and regulations, we may not receive all of
the revenues we anticipate receiving under those contracts and
subcontracts.
Generally, US government contracts are subject to procurement
laws and regulations. Some of the our contracts are governed by
the Federal Acquisition Regulation (FAR), which lays out uniform
policies and procedures for acquiring goods and services by the
US government, and agency-specific acquisition regulations that
implement or supplement the FAR. For example, the Department of
Defense implements the FAR through the Defense Federal
Acquisition Regulations (DFAR).
The FAR also contains guidelines and regulations for managing a
contract after award, including conditions under which contracts
may be terminated, in whole or in part, at the government’s
convenience or for default. If a contract is terminated for the
convenience of the government, a contractor is entitled to
receive payments for its allowable costs and, in general, the
proportionate share of fees or earnings for the work done. If a
contract is terminated for default, the government generally
pays for only the work it has accepted. These regulations also
subject us to financial audits and other reviews by the
government of our costs, performance, accounting and general
business practices relating to our government contracts, which
may result in adjustment of our contract-related costs and fees.
Our US government contract and subcontract orders are funded by
government budgets that are proposed by the President of the
United States and reviewed and approved by the Congress. Funds
allocated to government agencies are administered by the
Executive Office of the President. There are two primary risks
associated with this process. First, the process may be delayed
or disrupted because of congressional schedules, negotiations
over funding levels for programs or unforeseen national or world
events. Second, funding for multi-year contracts can be changed
in future appropriations. Either of these events could affect
the allocation, timing, schedule and program content of our
government contracts and subcontracts.
Our
lack of long-term purchase orders and commitments from our
customers may lead to a rapid decline in our sales and
profitability.
All of our significant consumer division customers issue
purchase orders solely in their own discretion, often only two
to four weeks before the requested date of shipment. Our
customers are generally able to cancel orders (without penalty)
or delay the delivery of products on relatively short notice. In
addition, our customers may decide not to purchase products from
us for any reason. Any of our current customers may stop
purchasing our products in the future. If those customers do not
continue to purchase our products, our sales volume and
profitability could decline rapidly with little or no warning
whatsoever.
We cannot rely on long-term purchase orders or commitments to
protect us from the negative financial effects of a decline in
demand for our products. The limited certainty of product orders
can make it difficult for us to forecast our sales and allocate
our resources in a manner consistent with our actual sales.
Moreover, our expense levels are based in part on our
expectations of future sales and, if our expectations regarding
future sales are inaccurate, we may be unable to reduce costs in
a timely manner to adjust for sales shortfalls. Furthermore,
because we depend on a small number of customers for the vast
majority of our sales, the ramifications of these risks is
greater than if we had a greater number of customers. As a
result of our lack of long-term purchase orders and purchase
commitments, we may experience a rapid decline in our sales and
profitability.
9
If
either of the two customers on whom we depend fails to pay us
amounts owed in a timely manner, we could suffer a significant
decline in cash flow and liquidity which, in turn, could cause
us to fail to pay our liabilities and purchase adequate
inventory to sustain or expand our sales volume.
Our accounts receivable represented approximately 30%, 53% and
53% of our total current assets as of December 31, 2008,
2007 and 2006, respectively, and 20% and 11% as of June 30,
2009 and 2008, respectively. As of June 30, 2009, our two
major customers represented 17% of our total accounts
receivable. As a result of the substantial amount and
concentration of our accounts receivable, if any of our major
customers fails to pay us amounts owed in a timely manner, we
could suffer a significant decline in cash flow and liquidity
which could adversely affect our ability to pay our liabilities
and to purchase inventory to sustain or expand our current sales
volume and adversely affect our ability to continue our business.
In addition, our business is characterized by long periods for
collection from our customers and short periods for payment to
our suppliers, the combination of which may cause us to have
liquidity problems. We experience an average accounts settlement
period ranging from one month to as high as three months from
the time we deliver our products to the time we receive payment
from our customers. In contrast, we typically need to place
certain deposits and advances with our suppliers on a portion of
the purchase price. Because our payment cycle is considerably
shorter than our receivable collection cycle, we may experience
working capital shortages. Working capital management, including
prompt and diligent billing and collection, is an important
factor in our results of operations and liquidity. System
problems, industry trends, our customers’ liquidity
problems or payment practices or other issues may extend our
collection period, which would adversely impact our liquidity,
our ability to pay our liabilities and to purchase inventory to
sustain or expand our current sales volume, and adversely affect
our ability to continue our business.
Our
future growth and profitability may be adversely affected if our
marketing initiatives are not effective in generating sufficient
levels of brand awareness.
Since inception, the majority of our sales have been derived
from the sale of night vision display electronics and from
research and development contracts with suppliers to, or
directly to the US government and other customers. Our long-term
business plan contemplates that we will transition our business
so that the majority of our sales are earned from consumer
products sales. In connection with this transition, we are
engaged in a variety of marketing initiatives intended to
promote sales of our consumer products. Our future growth and
profitability from our consumer products will depend in large
part upon the effectiveness and efficiency of these marketing
efforts, including our ability to:
|
|
|
| |
•
|
create awareness of our brand and products, including general
awareness of this new Video Eyewear product category;
|
| |
| |
•
|
identify the most effective and efficient levels of spending for
marketing expenditures in our new target market;
|
| |
| |
•
|
effectively manage marketing costs (including creative and
media) in order to maintain acceptable operating margins and
return on marketing investment;
|
| |
| |
•
|
select the right markets in which to market; and
|
| |
| |
•
|
convert consumer awareness into actual product purchases.
|
Our planned marketing expenditures may not result in increased
total sales or generate sufficient levels of product and brand
name awareness. We may not be able to manage our marketing
expenditures on a cost-effective basis.
The
current decline and any future decline in general economic
conditions could lead to reduced consumer demand for our
products and otherwise have an adverse effect on our liquidity
and profitability.
We believe that purchases of our consumer Video Eyewear products
are dependent upon levels of discretionary spending by our
customers. This means that our financial performance will be
sensitive to changes in overall
10
economic conditions that affect consumer spending. Consumer
spending habits are affected by, among other things, prevailing
economic conditions, levels of employment, salaries and wage
rates, consumer confidence and consumer perception of economic
conditions. As widely reported, general worldwide economic
conditions have experienced a downturn due to, among other
things, slower economic activity, concerns about inflation,
decreased consumer confidence, reduced corporate profits and
capital spending, and adverse business conditions. This can
impact us through reduced sales, elongated selling cycles,
delays in product implementation and increased competitive
margin pressure. We are unable to accurately predict the likely
duration and severity of the current disruption in financial
markets and adverse economic conditions in the United States and
other countries. The continuation of this downturn, the further
deterioration of economic conditions in the United States or key
international economies or uncertainty as to the economic
outlook could reduce discretionary spending or cause a shift in
consumer discretionary spending to other products. Any of these
factors would likely cause us to delay or slow our growth plans,
result in lower net sales and adversely affect our liquidity and
profitability. Similarly, the tightening of credit markets may
adversely affect our supplier base and increase the potential
for one or more of our suppliers to experience financial
distress or bankruptcy, which could materially and adversely
affect our business.
If we
fail to accurately forecast seasonal demand for our consumer
Video Eyewear products, our results of operations for the entire
fiscal year may be materially adversely affected.
Historically, a high percentage of our consumer Video Eyewear
product annual sales have been attributable to the winter
holiday selling season. Like many manufacturers of consumer
electronics products, we must make merchandising and inventory
decisions for the winter holiday selling season well in advance
of actual sales. Further compounding this forecasting are other
fluctuations in demand for the consumer electronics products
that work with our Video Eyewear products, often due to the same
seasonal influences, as well as technological advances and new
models which are often introduced later in the calendar year.
Inaccurate projections of demand or deviations in the demand for
our products may cause large fluctuations in both our fourth
quarter results and could have a material adverse effect on our
results of operations for the entire fiscal year. We expect that
our fourth quarter sales of consumer products will remain
dependent on our performance during the winter holiday selling
season.
Our
Video Eyewear products require ongoing research and development
and we may experience technical problems or delays and may not
have the funds necessary to continue their development which
could lead our business to fail.
Our research and development efforts remain subject to all of
the risks associated with the development of new products based
on emerging and innovative technologies, including, for example,
unexpected technical problems or the possible insufficiency of
funds for completing development of these products. If we
experience technical problems or delays, further improvements in
our products and the introduction of future products could be
delayed, and we could incur significant additional expenses and
our business may fail.
We anticipate that we will require additional funds and further
US government engineering services contracts to maintain our
current levels of expenditure for research and development of
new products and technologies, and to obtain and maintain
patents and other intellectual property rights in these
technologies, the timing and amount of which are difficult to
forecast. Our cash on hand after the successful completion of
this offering coupled with the possibility of further negative
cash flow from operations may not be sufficient to meet all of
our future needs. We have no commitment for additional funds.
Any funds we need may not be available on commercially
reasonable terms or at all. If we cannot obtain any necessary
additional capital when needed, we might be forced to reduce our
research and development efforts which would materially and
adversely affect our business. If we attempt to raise capital in
an offering of shares of our common stock, preferred stock,
convertible securities or warrants, or if we engage in
acquisitions involving the issuance of such securities, our
then-existing stockholders’ interests will be diluted.
11
We
depend on advances in technology by other companies and if those
advances do not materialize, some of our products may not be
successfully commercialized and our anticipated new products
could be delayed or cancelled.
We rely on and will continue to rely on technologies (including
microdisplays) that are developed and produced by other
companies. The commercial success of certain of our planned
future products will depend in part on advances in these and
other technologies by other companies. We may, from time to
time, contract with and support companies developing key
technologies in order to accelerate the development of them for
our specific uses. Such activities might not result in useful
technologies or components for us.
If we
fail to develop new products and adapt to new technologies, our
business and results of operations may be materially adversely
affected.
The market for our products is characterized by rapid changes in
products, designs and manufacturing process technologies. Our
success depends to a large extent on our ability to develop and
manufacture new products and technologies to match the varying
requirements of different customers and groups in order to
establish a competitive position and become profitable.
Furthermore, we must adapt our products and processes to
technological changes and emerging industry standards and
practices on a cost-effective and timely basis. Our failure to
accomplish any of the above could harm our business and
operating results.
Consumer electronics products are subject to rapid technological
changes. Companies within the consumer electronics industry are
continuously developing new products with increased performance
and functionality. This puts pricing pressure on existing
products and constantly threatens to make them, or causes them
to be, obsolete. During the last two fiscal years, we sold one
product below cost after introducing new product models and as a
result incurred a negative gross margin of approximately 20% or
approximately $28,000 in negative margin. As our unit sales
increase, our ability to manage and mitigate future clearance
discounting activities may be harder and greater sales with
negative margins could increase. Our typical product life cycle
is relatively short, generating lower average selling prices as
the cycle matures. With cost reductions in component design and
increased manufacturing volumes we have not faced significant
margin erosion as we introduce new models of our Video Eyewear
products. If we fail to accurately anticipate the introduction
of new technologies, we may possess significant amounts of
obsolete inventory that can only be sold at substantially lower
prices and gross margins than we anticipated. In addition, if we
fail to accurately anticipate the introduction of new
technologies, we may be unable to compete effectively due to our
failure to offer products most demanded by the marketplace. If
any of these failures occur, our sales, profit margins and
profitability will be adversely affected.
If
microdisplay-based personal displays do not gain some reasonable
level of acceptance in the market for mobile displays, our
business strategy may fail.
The mobile display market is dominated by displays larger than
one-inch, based on direct view liquid crystal display
(LCD) and organic light emitting display (OLED) technology.
A number of companies have made and continue to make substantial
investments in, and are conducting research to improve
characteristics of, small direct view LCDs. Many of the leading
manufacturers of these larger direct view LCDs, including LG
Electronics, Royal Philips Electronics, Samsung Electronics Co.,
Ltd., Sony Corporation and Sharp Corporation, are large,
established companies with global marketing capabilities,
widespread brand recognition and extensive financial resources.
Advances in LCD and OLED technology or other technologies may
overcome their current limitations and permit them to remain or
become more attractive technologies for personal viewing
applications, which could limit the potential market for our
Video Eyewear technology and cause our business strategy to fail.
It is difficult to assess or predict with any certainty the
potential size, timing and viability of market opportunities for
our microdisplay-based Video Eyewear products or their market
acceptance. Market acceptance of Video Eyewear technology will
depend, in part, upon consumer acceptance of
near-to-eye
displays and upon microdisplay technology providing benefits
comparable to or greater than those provided by alternative
direct view display technology at a competitive price. If
consumers fail to accept
near-to-eye
displays in the numbers we anticipate or as soon as we
anticipate, the sales of our Video Eyewear products and our
results of operations would be adversely affected and our
business strategy may fail.
12
There
are a number of competing providers of microdisplay-based
personal display technology and we may fail to capture a
substantial portion of the personal display
market.
In addition to competing with direct view displays, we also
compete with microdisplay-based personal display technologies
that have been developed by other companies. Our primary
personal display competitors include DaeYang Co., Ltd., Ilixco
Inc., MyVu Corporation (MyVu), Carl Zeiss, Inc. (Zeiss), 5DT
Inc., eMagin Corporation (eMagin), Kopin Corporation (Kopin),
Lumus Ltd. (Lumus) and Kaiser Electro Optics Inc. (Kaiser).
Additionally, at recent technology exhibitions Sony and Brother
International Corporation have demonstrated personal display
glasses that look like sunglasses. Most of our
microdisplay-based competitors have greater financial,
marketing, distribution and technical resources than we do.
Certain of these competing microdisplay-based technologies
entered the marketplace prior to us. Moreover, our competitors
may succeed in developing new microdisplay-based personal
display technologies that are more affordable or have more or
more desirable features than our technology. If our products are
unable to capture a substantial portion of the personal display
market, our business strategy may fail.
Our
business and products are subject to government regulation and
we may incur additional compliance costs or, if we fail to
comply with applicable regulations, may incur fines or be forced
to suspend or cease operations.
Our products must comply with certain requirements of the US
Federal Communications Commission (FCC) regulating
electromagnetic radiation in order to be sold in the US and with
comparable requirements of the regulatory authorities of the
European Union (EU) and other jurisdictions in order to be sold
in those jurisdictions. We are also subject to various
governmental regulations related to toxic, volatile, and other
hazardous chemicals used in connection with parts of our
manufacturing process, including the Restriction of Certain
Hazardous Substances Directive (RoHS) issued by the EU effective
July 1, 2006. This directive restricts the distribution of
products within the EU that exceed very low maximum
concentration values of certain substances, including lead.
We believe that all our current consumer products comply with
the regulations of the jurisdictions in which they are sold. Our
failure to comply with these regulations in the future could
result in the imposition of fines or in the suspension or
cessation of our operations in the applicable jurisdictions.
Additional regulations applicable to our business may be enacted
in the United States or other jurisdictions in the future.
Compliance with regulations enacted in the future could
substantially increase our cost of doing business or otherwise
have a material adverse effect on our results of operations and
our business.
Our
products will likely experience rapidly declining unit prices
and we may not be able to offset that decline with production
cost decreases or higher unit sales.
In the markets in which we expect to compete, prices of
established products tend to decline significantly over time. In
order to maintain our profit margins over the long term, we
believe that we will need to continuously develop product
enhancements and new technologies that will either slow price
declines of our products or reduce the cost of producing and
delivering our products. While we anticipate many opportunities
to reduce production costs over time, we may not be able to
reduce our production costs. We expect to attempt to offset the
anticipated decrease in our average selling price by introducing
new products, increasing our sales volumes or adjusting our
product mix. If we fail to do so, our results of operations will
be materially and adversely affected.
If we
cannot obtain and maintain appropriate patent and other
intellectual property rights protection for our technology, our
business will suffer.
The value of our personal display and related technologies is
dependent on our ability to secure and maintain appropriate
patent and other intellectual property rights protection. We
intend to continue to aggressively pursue additional patent
protection for our new products and technology. Although we own
many patents covering our technology that have already been
issued, we may not be able to obtain additional patents that we
apply for, or that any of these patents, once issued, will give
us commercially significant protection for our technology, or
will be found valid if challenged. Moreover, we have not
obtained patent protection for some of our technology in all
foreign countries in which our products might be manufactured or
sold. In any event, the patent laws and
13
enforcement regimes of other countries may differ from those of
the United States as to the patentability of our personal
display and related technologies and the degree of protection
afforded.
Any patent or trademark owned by us may be challenged and
invalidated or circumvented. Patents may not issue from any of
our pending or future patent applications. Any claims and issued
patents or pending patent applications may not be broad or
strong enough and may not be issued in all countries where our
products can be sold or our technologies can be licensed to
provide meaningful protection against any commercial damage to
us. Further, others may develop technologies that are similar or
superior to our technologies, duplicate our technologies or
design around the patents owned by us. Effective intellectual
property protection may be unavailable or limited in certain
foreign countries. Despite our efforts to protect our
proprietary rights, unauthorized parties may attempt to copy or
otherwise use aspects of our processes and devices that we
regard as proprietary. Policing unauthorized use of our
proprietary information and technology is difficult and our
efforts to do so may not prevent misappropriation of our
technologies. In the event that our intellectual property
protection is insufficient to protect our intellectual property
rights, we could face increased competition in the market for
our products and technologies, which could have a material
adverse effect on our business, financial condition and results
of operations.
We may become engaged in litigation to protect or enforce our
patent and other intellectual property rights or in
International Trade Commission proceedings to abate the
importation of goods that would compete unfairly with our
products. In addition, we may have to participate in
interference or reexamination proceedings before the
US Patent and Trademark Office, or in opposition,
nullification or other proceedings before foreign patent
offices, with respect to our patents or patent applications. All
of these actions would place our patents and other intellectual
property rights at risk and may result in substantial costs to
us as well as a diversion of management attention. Moreover, if
successful, these actions could result in the loss of patent or
other intellectual property rights protection for the key
technologies on which our business strategy depends.
In addition, we rely in part on unpatented proprietary
technology, and others may independently develop the same or
similar technology or otherwise obtain access to our unpatented
technology. To protect our trade secrets, know-how and other
proprietary information, we require employees, consultants,
financial advisors and strategic partners to enter into
confidentiality agreements. These agreements may not provide
meaningful protection for our trade secrets, know-how or other
proprietary information in the event of any unauthorized use,
misappropriation or disclosure of those trade secrets, know-how
or other proprietary information. In particular, we may not be
able to fully or adequately protect our proprietary information
as we conduct discussions with potential strategic partners. If
we are unable to protect the proprietary nature of our
technology, it will harm our business.
Despite our efforts to protect our intellectual property rights,
intellectual property laws afford us only limited protection. A
third party could copy or otherwise obtain information from us
without authorization. Accordingly, we may not be able to
prevent misappropriation of our intellectual property or to
deter others from developing similar products or services.
Further, monitoring the unauthorized use of our intellectual
property is difficult. Litigation may be necessary to enforce
our intellectual property rights or to determine the validity
and scope of the proprietary rights of others. Litigation of
this type could result in substantial costs and diversion of
resources, may result in counterclaims or other claims against
us and could significantly harm our results of operations. In
addition, the laws of some foreign countries do not protect our
proprietary rights to the same extent as do the laws of the
United States.
As is commonplace in technology companies, we employ individuals
who were previously employed at other technology companies. To
the extent our employees are involved in research areas that are
similar to those areas in which they were involved at their
former employers, we may be subject to claims that such
employees or we have, inadvertently or otherwise, used or
disclosed the alleged trade secrets or other proprietary
information of the former employers. Litigation may be necessary
to defend against such claims. Litigation of this type could
result in substantial costs to us and divert our resources.
We also depend on trade secret protection through
confidentiality and license agreements with our employees,
subsidiaries, licensees, licensors and others. We may not have
agreements containing adequate protective provisions in every
case, and the contractual provisions that are in place may not
provide us with adequate protection in all circumstances. The
unauthorized reproduction or other misappropriation of our
intellectual property could diminish the value of our brand,
competitive advantages or goodwill and result in decreased sales.
14
We may
incur substantial costs or lose important rights as a result of
litigation or other proceedings relating to our products,
patents and other intellectual property rights.
In recent years, there has been significant litigation involving
patents and other intellectual property rights in many
technology-related industries. Until recently, patent
applications were retained in secrecy by the US Patent and
Trademark Office until and unless a patent was issued. As a
result, there may be US patent applications pending of which we
are unaware that may be infringed by the use of our technology
or a part thereof, thus substantially interfering with the
future conduct of our business. In addition, there may be issued
patents in the United States or other countries that are
pertinent to our business of which we are not aware. We and our
customers could be sued by other parties for patent infringement
in the future. Such lawsuits could subject us and them to
liability for damages or require us to obtain additional
licenses that could increase the cost of our products, which
might have an adverse affect on our sales.
In addition, in the future we may assert our intellectual
property rights by instituting legal proceedings against others.
We may not be able to successfully enforce our patents in any
lawsuits we may commence. Defendants in any litigation we may
commence to enforce our patents may attempt to establish that
our patents are invalid or are unenforceable. Any patent
litigation could lead to a determination that one or more of our
patents are invalid or unenforceable. If a third party succeeds
in invalidating one or more of our patents, that party and
others could compete more effectively against us. Our ability to
derive sales from products or technologies covered by these
patents could be adversely affected.
Whether we are defending the assertion of third party
intellectual property rights against our business as a result of
the use of our technology, or we are asserting our own
intellectual property rights against others, such litigation can
be complex, costly, protracted and highly disruptive to our
business operations by diverting the attention and energies of
management and key technical personnel. As a result, the
pendency or adverse outcome of any intellectual property
litigation to which we are subject could disrupt business
operations, require the incurrence of substantial costs and
subject us to significant liabilities, each of which could
severely harm our business.
Plaintiffs in intellectual property cases often seek injunctive
relief. Any intellectual property litigation commenced against
us could force us to take actions that could be harmful to our
business and thus to our sales, including the following:
|
|
|
| |
•
|
discontinuing selling the products that incorporate or otherwise
use technology that contains our allegedly infringing
intellectual property;
|
| |
| |
•
|
attempting to obtain a license to the relevant third party
intellectual property, which may not be available on reasonable
terms or at all; or
|
| |
| |
•
|
attempting to redesign our products to remove our allegedly
infringing intellectual property.
|
If we are forced to take any of the foregoing actions, we may be
unable to manufacture and sell products that incorporate our
technology at a profit or at all. Furthermore, the measure of
damages in intellectual property litigation can be complex, and
is often subjective or uncertain. If we were to be found liable
for infringement of proprietary rights of a third party, the
amount of damages we might have to pay could be substantial and
is difficult to predict. Decreased sales of our products
incorporating our technology would adversely affect our sales.
Any necessity to procure rights to the third party technology
might cause us to negotiate the royalty terms of the third party
license which could increase our cost of production or, in
certain cases, terminate our ability to build some of our
products entirely.
If we
fail to renew, register or otherwise protect our trademarks, the
value of our brand names may decline and we may be unable to use
those names in certain geographical areas.
We believe our copyrights and trademarks are critical to our
success. We rely on trademark, copyright and other intellectual
property laws to protect our proprietary rights. If we fail to
properly register and otherwise protect our trademarks, service
marks and copyrights, we may lose our rights, or our exclusive
rights, to them. In that case, our ability to effectively market
and sell our products and services could suffer, which could
harm our business.
15
Our
business and results of operations may suffer if there are, or
if users claim there are, negative effects on eyesight from the
long-term use of our products.
The personal display products that we currently market or may
introduce and market in the future are new and utilize new
technology. While virtual display technology has been in use
over the past 25 years, sales to the general public have
been limited. Extensive and continual viewing of any display,
including standard computer monitors, for hours each day has the
potential to negatively affect eyesight. Accordingly, it is
possible that prolonged use of our products may adversely affect
a user’s eyesight. We design our products with these
considerations in mind to attempt to minimize any potential
negative impact. We warn users that extensive daily use without
appropriate rest periods may cause eye fatigue that could result
in temporary or permanent damage (in much the same way that a
computer monitor manufacturers now warn users about long-term
computer use). Despite our efforts, we may be unable to overcome
this risk and such risk could result in claims against us by
users of our products. Any such claims, whether or not we are
ultimately held liable for them, could diminish the value of our
brand, competitive advantages or goodwill and may result in
decreased sales and we could incur significant expense in
defending against any such claims. In addition, if we are
ultimately held liable for any such claims, the resulting
liabilities may have a material adverse effect on our business,
financial condition and results of operations.
Product
liability claims, whether or not we are ultimately held liable
for them, could have a material adverse affect on our business
and results of operations.
Our business may expose us to product liability claims. Although
no such claims have been brought against us to date, and to our
knowledge no such claim is threatened or likely, we may face
liability to product users for damages resulting from the design
or manufacture of our products. Any such claims, whether or not
we are ultimately held liable for them, could diminish the value
of our brand, competitive advantages or goodwill and result in
decreased sales and we could incur significant expense in
defending against any such claims. While we plan to obtain and
maintain product liability insurance coverage, product liability
claims made against us may exceed coverage limits or fall
outside the scope of such coverage. Also, insurance may not be
available at commercially reasonable rates or at all. We do not
have any such product liability insurance in effect.
Our
results of operations may suffer if we are not able to
successfully manage our increasing exposure to foreign exchange
rate risks.
A substantial majority of our sales and cost of components are
denominated in US dollars. As our business grows both our sales
and production costs may increasingly be denominated in other
currencies. Where such sales or production costs are denominated
in other currencies, they are converted to US dollars for the
purpose of calculating any sales or costs to us. Our sales may
decrease as a result of any appreciation of the US dollar
against these other currencies. The proceeds of this offering
will be denominated in Canadian dollars and any substantial
appreciation of the US dollar against the Canadian dollar during
this offering may materially adversely affect our liquidity and
capital resources.
The majority of our current expenditures are incurred in US
dollars and many of our components come from countries that
currently peg their currency against the US dollar. If the US
dollar depreciates versus these foreign currencies, additional
US dollars will be required to fund our purchases of these
components.
Although we do not currently enter into currency option
contracts or engage in other hedging activities, we may do so in
the future. We can not assure you that we will undertake any
such hedging activities or that, if we do so, they will be
successful in reducing the risks to us of our exposure to
foreign currency fluctuations.
16
Due to
our significant level of international operations, we are
subject to international operational, financial, legal and
political risks.
A substantial part of our operations are expected to be outside
of the United States and many of our customers and suppliers
have some or all of their operations in countries other than the
United States. Risks associated with our doing business outside
of the United States include:
|
|
|
| |
•
|
compliance with a wide variety of foreign laws and regulations,
particularly labor, environmental and other laws and regulations
that govern our operations in those countries;
|
| |
| |
•
|
legal uncertainties regarding taxes, tariffs, quotas, export
controls, export licenses, import controls and other trade
barriers;
|
| |
| |
•
|
economic instability in the countries of our suppliers and
customers, particularly in the Asia-Pacific region, causing
delays or reductions in orders for their products and therefore
our sales;
|
| |
| |
•
|
political instability in the countries in which our suppliers
operate, particularly in China and Taiwan;
|
| |
| |
•
|
difficulties in collecting accounts receivable and longer
accounts receivable payment cycles; and
|
| |
| |
•
|
potentially adverse tax consequences.
|
Any of these factors could harm our own, our suppliers’ and
our customers’ international operations and businesses and
impair our and their ability to continue expanding into
international markets.
We may
lose the services of key management personnel and may not be
able to attract and retain other necessary
personnel.
Changes in our management could have an adverse effect on our
business. This is especially an issue while our staff is small.
We are dependent upon the active participation of several key
management personnel, including Paul J. Travers, our
President and Chief Executive Officer (CEO). We do not carry key
person life insurance on any of our senior management or other
key personnel other than our CEO. While we have some life
insurance coverage on our CEO, we do not believe it would be
sufficient to completely protect us against losses we may suffer
if his services were to become unavailable to us in the future.
Our Chief Financial Officer, Grant Russell, a Canadian citizen,
currently has his principal residence in Vancouver, Canada and a
second residence in Rochester, New York. If he becomes unable to
legally travel to and work in the United States, his ability to
perform some of his duties could be materially adversely
affected.
We must hire highly skilled technical personnel as employees and
as independent contractors in order to develop our products. As
of the date of this prospectus we have 52 full-time
employees. The competition for highly skilled technical,
managerial and other personnel is intense and we may not be able
to retain or recruit such personnel. Our recruiting and
retention success is substantially dependent on our ability to
offer competitive salaries and benefits to our employees. We
must compete with companies that possess greater financial and
other resources than we do and that may be more attractive to
potential employees and contractors. To be competitive, we may
have to increase the compensation, bonuses, stock options and
other fringe benefits offered to employees in order to attract
and retain such personnel. The costs of retaining or attracting
new personnel may have a material adverse effect on our business
and operating results. If we fail to attract and retain the
technical and managerial personnel we need to be successful, our
business, operating results and financial condition could be
materially adversely affected.
Our
failure to effectively manage growth could harm our
business.
We have rapidly and significantly expanded the number and types
of products we sell, and we will endeavor to further expand our
product portfolio. We must regularly introduce new products and
technologies, enhance existing products, and effectively
stimulate customer demand for new products and upgraded versions
of our existing products.
17
This expansion of our products places a significant strain on
our management, operations and engineering resources.
Specifically, the areas that are strained most by our growth
include the following:
|
|
|
| |
•
|
New Product Launch: With the growth of our
product portfolio, we experience increased complexity in
coordinating product development, manufacturing, and shipping.
As this complexity increases, it places a strain on our ability
to accurately coordinate the commercial launch of our products
with adequate supply to meet anticipated customer demand and
effective marketing to stimulate demand and market acceptance.
If we are unable to scale and improve our product launch
coordination, we could frustrate our customers and lose retail
shelf space and product sales;
|
| |
| |
•
|
Forecasting, Planning and Supply Chain
Logistics: With the growth of our product
portfolio, we also experience increased complexity in
forecasting customer demand, in planning for production, and in
transportation and logistics management. If we are unable to
scale and improve our forecasting, planning and logistics
management, we could frustrate our customers, lose product sales
or accumulate excess inventory; and
|
| |
| |
•
|
Support Processes: To manage the growth of our
operations, we will need to continue to improve our transaction
processing, operational and financial systems, and procedures
and controls to effectively manage the increased complexity. If
we are unable to scale and improve these areas, the consequences
could include: delays in shipment of product, degradation in
levels of customer support, lost sales, decreased cash flows,
and increased inventory. These difficulties could harm or limit
our ability to expand.
|
Our
facilities and information systems and those of our key
suppliers could be damaged as a result of disasters or
unpredictable events, which could have an adverse effect on our
business operations.
We operate the vast majority of our business from three
locations in the Rochester, New York area. We also rely on third
party manufacturing plants in China and third party logistics,
sales and marketing facilities in other parts of the world to
provide key components of our Video Eyewear products and
services necessary for our operations. If major disasters such
as earthquakes, fires, floods, wars, terrorist attacks, computer
viruses, transportation disasters or other events occur in any
of these locations, or our information systems or communications
network or those of any of our key component suppliers breaks
down or operates improperly as a result of such events, our
facilities or those of our key suppliers may be seriously
damaged, and we may have to stop or delay production and
shipment of our products. We may also incur expenses relating to
such damages. If production or shipment of our products or
components is stopped or delayed or if we incur any increased
expenses as a result of damage to our facilities, our business,
operating results and financial condition could be materially
adversely affected.
We
generally do not have long-term contracts with our customers and
therefore we may not be able to accurately forecast inventory
requirements and sales.
Our business is operated on the basis of short-term purchase
orders and engineering contracts that typically do not exceed
12 months in duration. We cannot guarantee that we will be
able to obtain long-term contracts in the future. The purchase
orders that we receive can often be cancelled or revised without
penalty. In the absence of a backlog of orders that can only be
canceled with penalty, we plan production on the basis of
internally generated forecasts of demand, which makes it
difficult to accurately forecast inventory requirements and
sales. Large supply line commitments and large inventories of
various components will be required to support our business and
provide reasonable order fulfillment for customers. If we fail
to accurately forecast operating requirements, our business may
suffer and the value of your investment in us may decline.
Terrorism
and the uncertainty of future terrorist attacks or war could
reduce consumer confidence which could adversely affect our
operating results.
Terrorist acts or acts of war may cause damage or disruption to
our facilities, information systems, vendors, employees and
customers, which could significantly harm our sales and results
of operations. In the future, fears of war or additional acts of
terrorism may have a negative effect on consumer confidence or
consumer discretionary spending patterns, as well as have an
adverse effect on the economy in general. This impact may be
particularly
18
harmful to our business because we expect to rely heavily on
discretionary consumer spending and consumer confidence levels.
RISKS
RELATED TO MANUFACTURING
We do
not manufacture our own microdisplays, one of the key components
of our Video Eyewear products, and we may not be able to obtain
the microdisplays we need.
We do not currently own or operate any manufacturing facilities
for microdisplays, one of the key components in our Video
Eyewear products. We currently purchase almost all of the
microdisplays used in our products from Kopin and eMagin. Kopin
accounts for approximately 95% of our microdisplays by unit
volume. We estimate that products incorporating Kopin
microdisplays will account for approximately 56% of our sales in
2009 and products incorporating eMagin microdisplays will
account for approximately 19% of our sales in 2009. Our
relationships with both Kopin and eMagin generally are on a
purchase order basis and neither supplier has a contractual
obligation to provide adequate supply or acceptable pricing on a
long-term basis. Both Kopin and eMagin could discontinue
sourcing merchandise for us at any time. If Kopin or eMagin were
to discontinue their relationships with us, or discontinue
providing specific products to us, and we are unable to contract
with a new supplier that can meet our requirements, or if Kopin
or eMagin or such other supplier were to suffer a disruption in
their production, we could experience disruption of our
inventory flow, a decrease in sales and the possible need to
redesign our products. Any such event could disrupt our
operations and have an adverse effect on our business, financial
condition and results of operations.
Certain other components and services necessary for the
manufacture of our products are available from only a limited
number of sources, and other components and services are only
available from a single source.
Our inability to obtain sufficient quantities of high quality
components or services on a timely basis could result in future
manufacturing delays, increased costs and ultimately in reduced
or delayed sales or lost orders which could materially and
adversely affect our operating results.
The
consumer electronics industry is subject to significant
fluctuations in the availability of components. If we do not
properly anticipate the need for critical components, we may be
unable to meet the demands of our customers and
end-users.
The availability of certain of the components that we require to
produce our Video Eyewear products may decrease. As the
availability of components decreases, the cost of acquiring
those components ordinarily increases. High growth product
categories have experienced chronic shortages of components
during periods of exceptionally high demand. If we do not
properly anticipate the need for or procure critical components,
we may pay higher prices for those components, our gross margins
may decrease and we may be unable to meet the demands of our
customers and end-users, which could reduce our competitiveness,
cause a decline in our market share and have a material adverse
effect on our results of operations.
Unanticipated
disruptions in our operations or slowdowns by our suppliers,
distributors and shipping companies could adversely affect our
ability to deliver our products and service our
customers.
Our ability to provide high quality customer service, process
and fulfill orders and manage inventory depends on the
efficient, timely and uninterrupted performance of our
manufacturing and distribution facilities and our management
information systems and the facilities and systems of our third
party suppliers, distributors and shipping companies.
Any material disruption or slowdown in the operation of our
manufacturing and distribution facilities or our management
information systems, or comparable disruptions or slowdowns
suffered by our principal suppliers, distributors or shippers
could cause delays in our ability to receive, process and
fulfill customer orders and may cause orders to be canceled,
lost or delivered late, goods to be returned or receipt of goods
to be refused. If any of these events occur, our sales and
operating results could be materially and adversely affected.
19
If we
acquire any companies or technologies in the future, they could
prove difficult to integrate, disrupt our business, dilute
stockholder value or have an adverse effect on our results of
operations.
We intend to expand our business primarily through internal
growth, but from time to time we may consider strategic
acquisitions. Any future acquisition would involve numerous
risks including:
|
|
|
| |
•
|
potential disruption of our ongoing business and distraction of
management;
|
| |
| |
•
|
difficulty integrating the operations and products of the
acquired business;
|
| |
| |
•
|
unanticipated expenses related to technology integration;
|
| |
| |
•
|
exposure to unknown liabilities, including litigation against
the companies we may acquire;
|
| |
| |
•
|
additional costs due to differences in culture, geographic
locations and duplication of key talent; and
|
| |
| |
•
|
potential loss of key employees or customers of the acquired
company.
|
Additionally, to finance an acquisition we may incur substantial
amounts of indebtedness, which would affect our balance sheet
and results of operations, or we may issue a substantial number
of shares of our common stock, which may be dilutive to our
stockholders. If we make acquisitions in the future,
acquisition-related accounting charges may affect our balance
sheet and results of operations. We may not be successful in
addressing these risks or any other problems encountered in
connection with any acquisitions.
RISKS
RELATING TO THIS OFFERING
There
is currently no trading market for our securities and if an
established trading market does not develop holders of our
common stock and warrants may not be able to resell their
securities at or near the offering price or at any
price.
Our securities are not currently listed or quoted on any
national securities exchange or national quotation system. We
have applied to list our common stock issuable upon exercise of
the warrants included in the units offered under this prospectus
on the TSX-V
under the symbol
“l.”
Listing of our common stock will be subject to fulfilling all of
the requirements of the
TSX-V. We
have also applied for listing of the warrants included in the
units on the
TSX-V under
the symbol
“l.”
Listing of our warrants included in the units will be subject to
fulfilling all of the requirements of the
TSX-V,
including distribution of the warrants to a minimum number of
public security holders. Neither the
TSX-V nor
any other exchange or quotation system, may not permit our
common stock to be listed and traded. Even if our common stock
or warrants are accepted for listing on the
TSX-V, the
TSX-V has
continuing listing requirements and we may not be able to comply
with those requirements and maintain our listing. If our common
stock and warrants are not listed on the
TSX-V, we
may seek to have them quoted on the OTC Bulletin Board of
the US Financial Industry Regulatory Authority, Inc. (FINRA).
The OTC Bulletin Board is an inter-dealer, over-the-counter
market that provides significantly less liquidity and
transparency than the
TSX-V.
Therefore, prices for securities traded solely on the OTC
Bulletin Board may be difficult to obtain and holders of
our common stock and warrants may be unable to resell their
securities at or near their original offering price or at
any price.
Purchasers
of our units may not be able to exercise their warrants if we
cannot maintain a current prospectus relating to the common
stock underlying the warrants.
The warrants included in the units may be exercised only if at
the time of exercise (i) a prospectus relating to the
issuance of the shares of our common stock underlying the
warrants is then current and (ii) those shares are
registered or qualified for sale or exempt from registration or
qualification under the securities laws of the states in which
the holders of the warrants reside. The issuance of the shares
of our common stock underlying the warrants is covered by this
prospectus but we may not be able to keep this prospectus or any
other prospectus we file with the SEC covering the issuance of
those shares current. We intend to apply to register or qualify
the issuance of those shares in California, Connecticut,
Delaware, Georgia, Illinois, Maryland, Massachusetts, New
Jersey, New York and Virginia but we may not be able to maintain
those registrations or qualifications. If we are not able to do
so and no exemption from registration is available, the holders
of the warrants will not able to exercise their warrants and
20
they will expire unexercised. We have no obligation to
compensate the holders if they are not able to exercise their
warrants because we have failed to maintain the effectiveness of
a registration statement filed with the SEC or the registration
or qualification filed with any state. If the warrants expire
unexercised, the purchasers of units will have effectively paid
the entire initial public offering price per unit for one share
of our common stock.
Purchasers
of our units may not be able to resell their shares of common
stock or warrants at or near the offering price because the
offering price for our units may not be indicative of their fair
market value.
The offering price range for our units was determined in the
context of negotiations between us and the agents. Accordingly,
the offering price may not be indicative of the fair market
value of our company or the fair market value of our common
stock or the warrants included in the units. We are making no
representations that the offering price of our units under this
prospectus bears any relationship to our assets, book value, net
worth or any other recognized criteria of our value. If an
established trading market for our common stock or warrants
develops, the prevailing prices in that market may be
substantially less than the original offering price.
The
market price of our common stock and warrants may decline
because of the number of shares of our common stock eligible for
future sale in the public marketplace.
The price of our common stock and warrants could decline if
there are substantial sales of our common stock in the public
market after this offering. Based on the number of shares of our
common stock outstanding as of the date of this prospectus after
pro-forma adjustments, upon completion of this offering the
number of shares of our common stock outstanding will be between
274,974,896 (assuming that we receive the minimum gross proceeds
from this offering (Cdn$6,000,000 or approximately US$5.63
million) at an initial public offering price of Cdn$0.15 (the
minimum of our estimated initial public offering price range))
and 285,174,896 (assuming that we sell the maximum number of
units offered under this prospectus). All of the shares sold in
this offering will be freely tradable without restriction or
further registration under the Securities Act, except for any of
those shares held by our “affiliates,” as that term is
defined in Rule 144 under the Securities Act, whose sales
would be subject to the volume and manner of sale limitations of
Rule 144 described below. In addition,
134,836,808 shares of our common stock currently
outstanding, or between approximately 47% and 49% of our common
stock outstanding after this offering depending on the number of
units sold, may be resold at any time, subject to the
lock-up
agreements and
TSX-V escrow
arrangements and seed share resale restrictions described below.
Our executive officers and directors currently own
82,987,672 shares, or approximately 29% of our common stock
outstanding after this offering, which are eligible for resale
subject to the volume and manner of sale limitations of
Rule 144 and subject to the
lock-up
agreements and
TSX-V escrow
arrangements described below. The remaining
2,444,447 shares of our common stock currently outstanding,
or approximately 0.9% of our common stock outstanding after this
offering, are “restricted” under Rule 144 and are
eligible for sale under the provisions of Rule 144. See
“Shares Eligible for Future Resale.”
Additionally, under our fiscal advisory fee agreement with the
Canadian agents, we are obligated to issue to the Canadian
agents at the closing of this offering, in payment of a fiscal
advisory fee, that number of shares of our common stock equal
to, depending on the gross proceeds of the offering, between
1.0% and 2.0% of our common stock issued and outstanding
immediately upon the closing of the offering. The issuance of
those shares to the Canadian agents is not covered by this
prospectus. The shares issued to our Canadian agents under the
agreement will be subject to resale restrictions in accordance
with applicable US and Canadian securities laws and contractual
resale restrictions for a period of one year following the
closing of the offering under the
lock-up
agreements described below.
After this offering and the expiration of the
lock-up
periods, the holders of an aggregate of 31,764,437 shares
of our common stock will have rights, subject to some
conditions, to require us to include their shares in
registration statements that we may file for ourselves or other
stockholders. We also intend to register for resale all shares
of common stock that we have issued and may issue under our
option plans. Once we register these shares, subject to any
lock-up
restrictions, if any, they can be freely sold in the public
market. Furthermore, our agents may, at their discretion and at
any time without notice, release all or any portion of the
securities from the restrictions on sale imposed by
lock-up
agreements. Due to these factors, sales of a substantial number
of shares of our common stock in the public market could occur
at any time.
21
These sales, or the perception in the market that the holders of
a large number of shares are able to or intend to sell shares,
could reduce the market price of our common stock. See
“Dilution.”
Purchasers
of our units may not be able to resell their shares of common
stock or warrants at or above the initial public offering price
because the market price of our common stock and warrants may be
highly volatile.
Prior to this offering, there has been no public market for our
securities. We have applied to list our common stock on the
TSX-V under the symbol
“ l .”
Listing of our common stock will be subject to fulfilling all of
the requirements of the TSX-V. We have also applied for listing
of the warrants included in the units on the TSX-V under the
symbol
“ l .”
Listing of our warrants included in the units will be subject to
fulfilling all of the requirements of the TSX-V, including
distribution of the warrants to a minimum number of public
security holders. An active trading market for our common stock
and warrants may not develop following this offering. You may
not be able to sell your common stock or warrants quickly or at
the market price if trading in our common stock or warrants is
not active.
The market for our common stock and warrants will likely be
characterized by significant price volatility when compared to
more established issuers and we expect that it will continue to
be so for the foreseeable future. The market prices of our
common stock and warrants are likely to be volatile for a number
of reasons. First, our common stock and warrants are likely to
be sporadically
and/or
thinly traded. As a consequence of this lack of liquidity, the
trading of relatively small quantities of common stock or
warrants may disproportionately influence their prices in either
direction. The price of the common stock could, for example,
decline precipitously if even a relatively small number of
shares are sold on the market without commensurate demand, as
compared to a market for shares of an established issuer which
could better absorb those sales without adverse impact on its
share price. Secondly, we are a speculative or “risky”
investment due to our small amount of sales and lack of profits
to date and uncertainty of future market acceptance for our
current and potential products or engineering services. As a
consequence of this enhanced risk, more risk-adverse investors
may, under the fear of losing all or most of their investment in
the event of negative news or lack of progress, be more inclined
to sell their common stock or warrants on the market more
quickly and at greater discounts than would be the case with the
securities of an established issuer. We cannot make any
predictions or projections as to what the prevailing market
prices for our securities will be at any time or as to what
effect the sale of our securities or the availability of our
securities for sale at any time will have on the prevailing
market price.
Purchasers
of our units will experience immediate and substantial dilution
because their securities will be worth less on a net tangible
book value basis than the amount they invested.
The price that will be paid by investors in this offering for
our units will be significantly higher than the net tangible
book value per share of our common stock. Purchasers of our
units will experience immediate and substantial dilution of
between $(0.1371) assuming that we receive the minimum gross
proceeds from this offering (Cdn$6,000,000) at an initial public
offering price of Cdn$0.15 (the minimum of our estimated initial
public offering price range) based on the sale of 40,000,000
units and $(0.2115) assuming that we sell the maximum number of
units offered under this prospectus (50,000,000 units) at an
initial public offering price of Cdn$0.25 (the maximum of our
estimated initial public offering price range). In addition, a
majority of our outstanding options, warrants, convertible debt
and convertible preferred stock may be exercised for or
converted into shares of our common stock at prices that are
below the expected purchase price paid by investors in this
offering. In connection with this offering, we will issue
warrants as part of the units and agent options exercisable to
purchase that number of shares of our common stock and warrants
equal to 12.5% of the aggregate number of shares of our common
stock and warrants sold under the offering, at the initial
public offering price per share and warrant, for a period of
12 months from the closing date. To the extent that these
outstanding options, warrants, convertible debt or convertible
preferred stock are exercised or converted, there may be further
dilution to investors. In addition, under our fiscal advisory
fee agreement with the Canadian agents, we are obligated to
issue to the Canadian agents at the closing of this offering, in
payment of a fiscal advisory fee, that number of shares of our
common stock equal to, depending on the gross proceeds of the
offering, between 1.0% and 2.0% of our common stock issued and
outstanding immediately upon the closing of the offering, which
will further dilute investors. Accordingly, in the event we are
liquidated, investors may not receive the full amount of their
investment. See “Dilution.”
22
If
management continues to own a significant percentage of our
outstanding common stock management may prevent other
stockholders from influencing significant corporate
decisions.
Our officers and directors currently own approximately 38% of
the outstanding shares of our common stock. Following the
completion of this offering, our executive officers and
directors will own between approximately 31% (assuming that we
receive the minimum gross proceeds from this offering
(Cdn$6,000,000) at an initial public offering price of Cdn$0.15
(the minimum of our estimated initial public offering price
range) and approximately 29% (assuming that we sell the maximum
number of units offered under this prospectus (50,000,000
units)) of the outstanding shares of our common stock. As a
result, our management will exercise significant control over
matters requiring stockholder approval, including the election
of our board of directors, the approval of mergers and other
extraordinary transactions, as well as the terms of any of these
transactions. This concentration of ownership could have the
effect of delaying or preventing a change in our control or
otherwise discouraging a potential acquirer from attempting to
obtain control of us, which could in turn have an adverse effect
on the fair market value of our company and our common stock.
The interests of these and other of our existing stockholders
may conflict with the interests of our other stockholders.
Management
will have broad discretion as to the use of the proceeds from
this offering and may use the proceeds for purposes different
from their current intent or not utilize the proceeds
effectively.
While we intend to use the net proceeds of this offering to fund
capital expenditures, sales and marketing efforts and research
and development, repay bank and certain other borrowings, and
for general corporate purposes, including working capital, we
will have broad discretion to adjust the application and
allocation of the net proceeds in order to address changed
circumstances and opportunities. The success of our operations
that are influenced by capital expenditures, research and
development and working capital allocations will be
substantially dependent upon the discretion and judgment of our
management with respect to the application and allocation of the
net proceeds of this offering. Our management will have broad
discretion as to the application of the net proceeds and could
use them for purposes other than those contemplated at the time
of this offering. Moreover, our management may use the net
proceeds for corporate purposes that may not lead to
profitability or increase the fair market value of our company
or our common stock.
It may
be difficult for us to attract or retain qualified officers and
directors because of the rules and regulations that we will be
subject to as a public company.
As a public company, the Sarbanes-Oxley Act of 2002
(Sarbanes-Oxley) and the related rules and regulations of the
SEC, as well as the rules and regulations of applicable Canadian
securities regulators and the rules of the
TSX-V
(if our listing application is accepted), will require us
to implement additional corporate governance practices and
adhere to a variety of reporting requirements and complex
accounting rules. Among other things, we will be subject to
rules regarding the independence of the members of our board of
directors and committees of the board and their experience in
finance and accounting matters and certain of our executive
officers will be required to provide certifications in
connection with our quarterly and annual reports filed with the
SEC and applicable Canadian securities regulators. The perceived
increased personal risk associated with these rules may deter
qualified individuals from accepting these positions.
Accordingly, we may be unable to attract and retain qualified
officers and directors. If we are unable to attract and retain
qualified officers and directors, our business and our ability
to obtain or maintain the listing of our shares of common stock
on a stock exchange could be adversely affected.
If we
fail to implement and maintain an effective system of internal
controls, we may not be able to accurately report our financial
results or prevent fraud and may fail to comply with SEC rules
and the rules and regulations of applicable Canadian securities
regulators.
We must implement and maintain effective internal financial
controls for us to provide reliable and accurate financial
reports and effectively prevent fraud. Implementation and
maintenance of effective internal financial controls will depend
on the effectiveness of our financial reporting and data systems
and controls. We expect these systems and controls to become
increasingly complex to the extent that our business grows. To
effectively manage this growth, we will need to continue to
improve our operational, financial and management controls and
our reporting systems and procedures. We cannot be certain that
these measures will ensure that we design, implement
23
and maintain adequate controls over our financial processes and
reporting in the future. Any failure to implement required new
or improved controls, or difficulties encountered in their
implementation or operation, could harm our operating results or
cause us to fail to meet our financial reporting obligations.
Inferior internal controls could also cause investors to lose
confidence in our reported financial information, which could
have a negative effect on the market price of our common stock
and our access to capital.
Rules adopted by the SEC pursuant to Section 404 of
Sarbanes-Oxley require annual assessment of our internal control
over financial reporting, and attestation of this assessment by
our independent registered public accountants. Under the SEC
rules currently in effect, both the management assessment of our
internal control over financial reporting and the attestation of
management’s assessment by our independent registered
public accountants will first apply to our annual report for the
2010 fiscal year. The standards governing management’s
assessment of internal control over financial reporting are new
and complex, and require significant documentation, testing and
possible remediation to meet the detailed standards. In
addition, the attestation process by our independent registered
public accountants is new and we may encounter problems or
delays in completing the implementation of any requested
improvements and receiving an attestation of our assessment by
our independent registered public accountants. If we cannot
assess our internal control over financial reporting as
effective, or our independent registered public accountants are
unable to provide an unqualified attestation report on such
assessment, investors could lose confidence in our reported
financial information, which could have a negative effect on the
market price of our common stock and our access to capital.
In addition, management’s assessment of internal control
over financial reporting may identify weaknesses and conditions
that need to be addressed in our internal control over financial
reporting or other matters that may raise concerns for
investors. Any actual or perceived weaknesses and conditions
that need to be addressed in our internal control over financial
reporting, disclosure of management’s assessment of our
internal control over financial reporting, or disclosure of our
independent registered public accounting firm’s attestation
to our report on management’s assessment of our internal
control over financial reporting may have a negative effect on
the market price of our common stock and our access to capital.
The
additional expenses that we will incur as a public company, and
the time our management will be required to devote to new
compliance initiatives, may have a material adverse affect on
our business and results of operations.
As a public company, we will incur significant legal, accounting
and other expenses that we did not incur as a private company.
In addition, Sarbanes-Oxley and the related rules and
regulations of the SEC, as well as the rules and regulations of
applicable Canadian securities regulators and the rules of the
TSX-V (if
our listing application is accepted), impose various
requirements on public companies, including requiring changes in
corporate governance practices. Our management and other
personnel will need to devote a substantial amount of time to
these compliance initiatives. Moreover, these rules and
regulations will increase our legal and financial compliance
costs and will make some activities more time-consuming and
costly. For example, we expect these new rules and regulations
to make it more difficult and more expensive for us to obtain
director and officer liability insurance, and we may be required
to incur substantial costs to maintain the same or similar
coverage. Compliance with Section 404 of Sarbanes-Oxley
will also require that we incur substantial accounting expenses
and expend significant management efforts.
If our
common stock is considered a “penny stock” it will be
subject to additional sale and trading regulations that may make
it more difficult to sell.
Our common stock, which is not currently listed or quoted on any
national securities exchange or national quotation system, may
be considered to be a “penny stock” if it does not
qualify for one of the exemptions from the definition of
“penny stock” under
Rule 3a51-1
under the Securities Exchange Act of 1934 (Exchange Act). Our
common stock may be a “penny stock” if it meets one or
more of the following conditions (i) the stock trades at a
price less than $5.00 per share; (ii) it is not traded on a
“recognized” national exchange; (iii) it is not
quoted on the NASDAQ Capital Market, or even if so, has a price
less than $5.00 per share; or (iv) is issued by a company
that has been in business less than three years with net
tangible assets less than $5,000,000.
24
The principal result or effect of being designated a “penny
stock” is that US securities broker-dealers participating
in sales of our common stock will be subject to the “penny
stock” regulations set forth in
Rules 15g-2
through
15g-9
promulgated under the Exchange Act. For example,
Rule 15g-2
requires broker-dealers dealing in penny stocks to provide
potential investors with a document disclosing the risks of
penny stocks and to obtain a manually signed and dated written
receipt of the document at least two business days before
effecting any transaction in a penny stock for the
investor’s account. Moreover,
Rule 15g-9
requires broker-dealers in penny stocks to approve the account
of any investor for transactions in such stocks before selling
any penny stock to that investor. This procedure requires the
broker-dealer to (i) obtain from the investor information
concerning his or her financial situation, investment experience
and investment objectives; (ii) reasonably determine, based
on that information, that transactions in penny stocks are
suitable for the investor and that the investor has sufficient
knowledge and experience as to be reasonably capable of
evaluating the risks of penny stock transactions;
(iii) provide the investor with a written statement setting
forth the basis on which the broker-dealer made the
determination in (ii) above; and (iv) receive a signed
and dated copy of such statement from the investor, confirming
that it accurately reflects the investor’s financial
situation, investment experience and investment objectives.
Compliance with these requirements may make it more difficult
and time consuming for holders of our common stock to resell
their shares to third parties or to otherwise dispose of them in
the market or otherwise.
Because
we do not intend to pay dividends on our common stock, our
stockholders will only realize a return (or recovery of a
portion of their initial investment) on their investment upon
the sale of their shares.
We have never declared or paid any cash dividends on our common
stock. We currently intend to retain our future earnings, if
any, to finance the operation and growth of our business and do
not expect to pay any cash dividends.
Our
certificate of incorporation, by-laws and Delaware law may
discourage takeovers and business combinations that our
stockholders might consider in their best
interests.
Provisions in our certificate of incorporation and by-laws may
delay, defer, prevent or render more difficult a takeover
attempt that our stockholders might consider in their best
interests. Even in the absence of a takeover attempt, the
existence of these provisions may adversely affect the market
value of our common stock if they are viewed as discouraging
takeover attempts in the future. See “Description of
Capital Stock” for additional information on the
anti-takeover measures applicable to us.
Provisions in the amended and restated certificate of
incorporation and amended and restated bylaws that will be in
effect immediately after the closing of this offering, as well
as provisions of Delaware law, could make it more difficult for
a third party to acquire us, even if doing so would benefit our
stockholders. Our proposed amended and restated certificate of
incorporation and bylaws:
|
|
|
| |
•
|
provide that the authorized number of directors may be changed
only by resolution of the board of directors;
|
|
|
|
| |
•
|
provide that all vacancies, including newly created
directorships, may, except as otherwise required by law, be
filled by the affirmative vote of a majority of directors then
in office, even if such number is less than a quorum;
|
|
|
|
| |
•
|
require that any action to be taken by our stockholders be
effected at a duly called annual or special meeting of
stockholders and not by written consent;
|
| |
| |
•
|
provide that stockholders seeking to present proposals before a
meeting of stockholders or to nominate candidates for election
as directors at a meeting of stockholders must provide notice in
writing in a timely manner, and also specify requirements as to
the form and content of a stockholder’s notice;
|
| |
| |
•
|
do not provide for cumulative voting rights, therefore allowing
the holders of a majority of the shares of our common stock
entitled to vote in any election of directors to elect all of
the directors standing for election, if they should so
choose; and
|
25
|
|
|
| |
•
|
provide that special meetings of our stockholders may be called
only by the chairman of the board, our chief executive officer
or by the board of directors pursuant to a resolution adopted by
a majority of the total number of authorized directors.
|
The amendment of any of these provisions would require approval
by the holders of at least two thirds of our voting stock then
outstanding, voting together as a single class.
In addition, we may become subject to Section 203 of the
Delaware General Corporation Law, which generally prohibits a
Delaware corporation from engaging in any of a broad range of
business combinations with an interested stockholder for a
period of three years following the date on which the
stockholder became an interested stockholder. This provision
could have the effect of delaying or preventing a change of
control, whether or not it is desired by or beneficial to our
stockholders.
If we
issue new shares of preferred stock your rights as a holder of
our common stock or warrants may be materially adversely
affected.
As of the date of this prospectus, we are authorized to issue up
to 6,745,681 shares of preferred stock. Immediately after
the closing of this offering, the number of shares of preferred
stock we are authorized to issue will be reduced to 5,000,000
shares. The designations, rights and preferences of our
preferred stock may be determined from time-to-time by our board
of directors. Accordingly, our board of directors is empowered,
without shareholder approval, to issue one or more series of
preferred stock with dividend, liquidation, conversion, voting
or other rights superior to those of the holders of our common
stock. For example, an issuance of shares of preferred stock
could:
|
|
|
| |
•
|
adversely affect the voting power of the holders of our common
stock;
|
| |
| |
•
|
make it more difficult for a third party to gain control of us;
|
| |
| |
•
|
discourage bids for our common stock;
|
| |
| |
•
|
limit or eliminate any payments that the holders of our common
stock could expect to receive upon our liquidation; or
|
| |
| |
•
|
adversely affect the market price of our common stock.
|
168,500 shares of our Series C Preferred Stock were
outstanding as of the date of this prospectus. We have agreed
with the agents to use our best efforts to cause all of the
outstanding shares of our Series C Preferred Stock,
together with all dividends accrued and unpaid thereon, to be
converted into common stock prior to the effective time of the
registration statement of which this prospectus forms a part.
Purchasers
of our units in this offering may be diluted if we raise
additional funds.
Our operations to date have consumed substantial amounts of
cash, and we expect our capital and operating expenditures to
increase in the next few years. We believe that our existing
capital resources and anticipated cash flow from planned
operations, together with the net proceeds of this offering
(assuming that we raise the minimum gross proceeds from this
offering (Cdn$6,000,000), should be adequate to satisfy our cash
requirements for the next 12 months. However, we may need
significant additional capital before that time. Any additional
required financing may not be available on acceptable terms or
at all. If we raise additional funds by issuing equity
securities or convertible debt securities, further dilution to
existing stockholders may result. If adequate funds are not
available, our business, financial condition and results of
operations and the market price of our common stock would be
materially adversely affected.
We may
not be able to meet our liquidity needs or to access capital
when necessary because of adverse capital and credit market
conditions.
We have historically relied on private placements of equity and
debt to fund our operating losses and capital expenditure.
During the past 12 months, the capital and credit markets
experienced extreme volatility and disruption. Disruptions,
uncertainty or volatility in the capital and credit markets may
limit our ability to access the capital necessary to operate and
grow our business. Adverse capital and credit market conditions
may force us to
26
delay raising capital or bear an unattractive cost of capital
which could significantly reduce our financial flexibility. Our
results of operations, financial condition, cash flows and
capital position and the market value of our common stock could
be materially adversely affected by disruptions in the financial
markets.
If we
sell additional shares of our common stock or preferred stock,
we may not be able to fully utilize our net operating loss
carryforwards and certain other tax attributes.
As of June 30, 2009, we had net operating loss carryforwards of
approximately $13,500,000 million for Federal and state
income tax purposes. Under Section 382 of the Internal
Revenue Code, if a corporation undergoes an “ownership
change,” the corporation’s ability to use its
pre-change net operating loss carryforwards and other pre-change
tax attributes to offset its post-change income may be limited.
An ownership change is defined for these purposes as a greater
than 50% change in its equity ownership by value over a
three-year period. We may also experience ownership changes in
the future as a result of this offering or subsequent changes in
our stock ownership.
GENERAL
MATTERS
All references to Vuzix, the “company,”
“we,” “us” and “our” are
references to Vuzix Corporation.
Unless otherwise indicated, all references to
“dollars,” “US$,” or “$” in this
prospectus are to United States dollars and all references to
“Cdn$” are to Canadian dollars. Unless otherwise
indicated, all Canadian dollar values have been translated to US
dollars, or vice versa, using a convenience translation of
US$1.00 = Cdn$1.0651, the closing buying rate of the Bank of
Canada on November 5, 2009.
This prospectus contains various company names, product names,
trade names, trademarks and service marks, all of which are the
properties of their respective owners.
Unless otherwise indicated, all references to “GAAP”
in this prospectus are to United States generally accepted
accounting principles.
We completed a 1-for-7 reverse stock split of our common stock
in June 2007 and an 8-for-1 split of our common stock in July
2008. All share numbers and amounts per share in this prospectus
have been retroactively adjusted to give effect to these changes.
Information contained on our websites, including www.vuzix.com,
shall not be deemed to be part of this prospectus or
incorporated herein by reference and should not be relied upon
by prospective investors for the purposes of determining whether
to purchase the units offered hereunder.
You should rely only on the information contained in this
prospectus. We have not, and the agents have not, authorized any
other person to provide you with different information. If
anyone provides you with different or inconsistent information,
you should not rely on it. We are not, and the agents are not,
making an offer to sell these securities in any jurisdiction
where the offer or sale is not permitted. You should assume that
the information appearing in this prospectus is accurate only as
of the date on the front cover of this prospectus. Our business,
financial condition, results of operations and prospects may
have changed since that date.
For investors outside the United States, neither we nor any of
our agents have done anything that would permit this offering or
possession or distribution of this prospectus in any
jurisdiction where action for that purpose is required, other
than in the United States and certain provinces of Canada. You
are required to inform yourself about and to observe any
restrictions relating to this offering and the distribution of
this prospectus.
27
USE OF
MARKET AND INDUSTRY DATA
This prospectus includes market and industry data that has been
obtained from third party sources, including industry
publications, as well as industry data prepared by our
management on the basis of its knowledge of and experience in
the industries in which we operate (including our
management’s estimates and assumptions relating to those
industries based on that knowledge). Management’s knowledge
of such industries has been developed through its experience and
participation in those industries. Although our management
believes such information to be reliable, neither we nor our
management have independently verified any of the data from
third party sources referred to in this prospectus or
ascertained the underlying economic assumptions relied upon by
such sources. In addition, the agents have not independently
verified any of the industry data prepared by management or
ascertained the underlying estimates and assumptions relied upon
by management. Furthermore, references in this prospectus to any
publications, reports, surveys or articles prepared by third
parties should not be construed as depicting the complete
findings of the entire publication, report, survey or article.
The information in any such publication, report survey or
article is not incorporated by reference in this prospectus.
FORWARD-LOOKING
STATEMENTS
This prospectus contains, in addition to historical information,
forward-looking statements. These statements are based on our
management’s beliefs and assumptions and on information
currently available to our management. The forward-looking
statements are contained principally under the headings
“Prospectus Summary,” “Risk Factors,”
“Management’s Discussion and Analysis of Financial
Condition and Results of Operations,” “Use of
Proceeds” and “Business.” Forward-looking
statements include statements concerning:
|
|
|
| |
•
|
our possible or assumed future results of operations;
|
| |
| |
•
|
our business strategies;
|
| |
| |
•
|
our ability to attract and retain customers;
|
| |
| |
•
|
our ability to sell additional products and services to
customers;
|
| |
| |
•
|
our cash needs and financing plans;
|
| |
| |
•
|
our competitive position;
|
| |
| |
•
|
our industry environment;
|
| |
| |
•
|
our potential growth opportunities;
|
| |
| |
•
|
expected technological advances by us or by third parties and
our ability to leverage them;
|
| |
| |
•
|
the effects of future regulation; and
|
| |
| |
•
|
the effects of competition.
|
All statements in this prospectus that are not historical facts
are forward-looking statements. We may, in some cases, use terms
such as “anticipates,” “believes,”
“could,” “estimates,” “expects,”
“intends,” “may,” “plans,”
“potential,” “predicts,”
“projects,” “should,” “will,”
“would” or similar expressions that convey uncertainty
of future events or outcomes to identify forward-looking
statements.
The outcome of the events described in these forward-looking
statements are subject to known and unknown risks, uncertainties
and other factors that may cause our actual results, performance
or achievements to be materially different from any future
results, performances or achievements expressed or implied by
the forward-looking statements. These important factors include
our financial performance and the other important factors we
discuss in greater detail in “Risk Factors.” You
should read these factors and the other cautionary statements
made in this prospectus as applying to all related
forward-looking statements wherever they appear in this
prospectus. Given these factors, you should not place undue
reliance on these forward-looking statements. Also,
forward-looking statements represent our management’s
beliefs and assumptions only as of the date on which the
statements are made. We undertake no obligation to publicly
update any forward-looking statements, whether as a result of
new information, future events or otherwise, except as required
by law. You should read this prospectus and the documents that
we reference in this prospectus and have filed as exhibits to
the registration statement, of which this prospectus is a part,
completely and with the understanding that our actual future
results may be materially different from what we currently
expect.
28
USE OF
PROCEEDS
This offering is subject to us raising minimum gross proceeds of
Cdn$6,000,000 (or approximately US$5.63 million). If we
raise the minimum gross proceeds from this offering we estimate
that the net proceeds to us, after payment of agents’
commissions and offering expenses, would be approximately
Cdn$4,800,000. Assuming that we sell the maximum number of
units offered (50,000,000 units) at Cdn$0.25 per unit (the
maximum of our estimated initial public offering price range),
we would receive gross proceeds of Cdn$12,500,000 (or
approximately US$11.74 million) and estimate that the net
proceeds to us, after payment of agents’ commissions and
offering expenses, would be approximately Cdn$10,750,000.
Assuming that we receive the estimated maximum amount of the
proceeds from this offering, we plan to use approximately
$1,234,000 of the net proceeds from this offering to repay the
outstanding principal amounts of and interest accrued on our
lines of credit and notes payable. The indebtedness we plan to
repay includes $215,500 in principal amount plus interest
payable to Paul J. Travers, our President and Chief Executive
Officer, under a revolving loan agreement that we entered into
with Mr. Travers in October 2008. Our indebtedness to Mr.
Travers has been incurred since October 2008 and was incurred to
fund our working capital requirements. This indebtedness bears
interest at the annual rate of 12.0% and is payable on demand.
The indebtedness under our lines of credit bears interest at
annual rates ranging from 4.25% to 7.5% and is payable on
demand. $500,000 in principal amount of the indebtedness we plan
to repay from the proceeds of the offering was due and payable
on January 31, 2009 and currently bears interest at the annual
rate of 18.0%. $200,000 in principal amount of indebtedness that
we plan to repay from the proceeds of the offering bears
interest at an annual rate of 18.0% and was due and payable on
October 31, 2009. We borrowed this $200,000 from three
individual lenders (including $50,000 from Mr. Paul Churnetski,
our Vice President of Quality Assurance and the beneficial owner
of approximately 9% of our issued and outstanding common stock)
to finance part of our working capital investment for a defense
order that is currently in process and we intend to repay those
loans out of revenues from that defense order if this offering
does not close prior to the maturity date. As of the date of
this prospectus none of these lenders has demanded payment of
these loans. Prior to the closing of this offering, we may
borrow up to an additional $200,000 from one or more individual
lenders on the same terms and conditions. We may not be able to
borrow these additional funds on the same terms, or at all. We
may not receive sufficient proceeds from this offering to repay
any of this indebtedness.
We intend to use the remainder of the net proceeds from this
offering for:
|
|
|
| |
•
|
new product development and research expenses;
|
| |
| |
•
|
capital expenditures;
|
| |
| |
•
|
selling, marketing, general and administrative expenses;
|
| |
| |
•
|
possible acquisitions of businesses, technologies or other
assets; and
|
| |
| |
•
|
general corporate purposes.
|
We intend to continue our development and tooling of new
products that leverage our advancements in our optics and
electronics technology. We believe that these new technologies,
if successfully implemented, will result in significant
performance improvements in our products and as a result
increase our overall customer demand. Assuming that we receive
the estimated maximum amount of the proceeds from this offering,
our current development plans by product line are as follows:
| |
|
|
|
New Product Development Objectives
|
|
Completion Date
|
|
|
|
Wrap Video Eyewear (consumer)
|
|
Fall 2009
|
|
Blade Video Eyewear (consumer)
|
|
Spring 2010
|
|
Blade Tac-Eye (defense)
|
|
Summer 2010
|
|
Blade low vision-assist product
|
|
Fall 2010
|
|
Blade II display engine
|
|
Spring 2011
|
29
Among the capital expenditures that we propose to finance from
the proceeds of this offering over the next 18 months are
the expansion of our manufacturing facilities and the purchase
of engineering equipment and computer hardware and software.
Among the sales and marketing expenditures that we propose to
finance from the proceeds of this offering over the next 18
months is the purchase of new point of purchase (POP) display
systems to show case our new products at retail outlets that we
expect to carry our new products as they are released. The
amounts of the proceeds from the offering that we propose to use
for the purposes described above will depend on the proceeds
from the offering. The table below sets forth the amount of the
proceeds from this offering that we propose to use for
(1) the purchase of computers and equipment; (2) new
product tooling; (3) new product engineering and design;
(4) general research and development; (5) the purchase
of POP display systems; and (6) working capital purposes
depending on the gross proceeds from the offering over the range
from Cdn$6,000,000 (or approximately US$5.63 million) (the
minimum gross proceeds of the offering) to Cdn$12,500,000 (or
approximately US$11.74 million) (the gross proceeds that we
would receive upon the sale of 50,000,000 units (the maximum
number of units offered under this prospectus) at Cdn$0.25 (the
maximum of our estimated initial public offering price range).
This table does not set forth all possibilities. Regardless of
the number of units sold, we expect to incur offering expenses
estimated at approximately Cdn$746,000 for legal, accounting,
printing, and other costs in connection with this offering. We
may not receive sufficient proceeds from this offering to
undertake all these new product development and tooling
programs, capital expenditures, sales and marketing efforts and
ongoing research and accordingly we will have to reduce the
speed and number of our new product development plans and the
number of new products under development. We may also use a
portion of the net proceeds to acquire businesses, technologies
or other assets. We have no agreements or arrangements with
respect to any acquisitions at the present time. There is no
guarantee that we will be successful at selling any of the
securities being offered in this prospectus. Accordingly, the
actual amount of proceeds we will raise in this offering, if
any, may differ.
| |
|
|
|
|
|
|
|
|
|
|
|
|
|
|
|
|
|
Gross proceeds (Cdn$)
|
|
$
|
6,000,000
|
|
|
$
|
8,000,000
|
|
|
$
|
10,000,000
|
|
|
$
|
12,500,000
|
|
|
Less offering expenses:
|
|
|
|
|
|
|
|
|
|
|
|
|
|
|
|
|
|
Selling agents’ commission (Cdn$)
|
|
|
480,000
|
|
|
|
640,000
|
|
|
|
800,000
|
|
|
|
1,000,000
|
|
|
Estimated expenses of offering (Cdn$)
|
|
|
746,000
|
|
|
|
746,000
|
|
|
|
746,000
|
|
|
|
746,000
|
|
|
|
|
|
|
|
|
|
|
|
|
|
|
|
|
|
|
|
|
Net proceeds from offering (Cdn$)
|
|
|
4,774,000
|
|
|
|
6,614,000
|
|
|
|
8,454,000
|
|
|
|
10,754,000
|
|
|
|
|
|
|
|
|
|
|
|
|
|
|
|
|
|
|
|
|
Net proceeds (US$)
|
|
|
4,482,000
|
|
|
|
6,209,000
|
|
|
|
7,937,000
|
|
|
|
10,096,000
|
|
|
Less use of net proceeds (US$):
|
|
|
|
|
|
|
|
|
|
|
|
|
|
|
|
|
|
Repayment of debt
|
|
|
1,234,000
|
|
|
|
1,234,000
|
|
|
|
1,234,000
|
|
|
|
1,234,000
|
|
|
Computers and equipment
|
|
|
150,000
|
|
|
|
200,000
|
|
|
|
300,000
|
|
|
|
400,000
|
|
|
New product tooling
|
|
|
500,000
|
|
|
|
700,000
|
|
|
|
850,000
|
|
|
|
1,000,000
|
|
|
New product engineering and design
|
|
|
250,000
|
|
|
|
350,000
|
|
|
|
400,000
|
|
|
|
550,000
|
|
|
General R&D
|
|
|
225,000
|
|
|
|
350,000
|
|
|
|
600,000
|
|
|
|
900,000
|
|
|
Marketing POPs
|
|
|
350,000
|
|
|
|
450,000
|
|
|
|
625,000
|
|
|
|
750,000
|
|
|
|
|
|
|
|
|
|
|
|
|
|
|
|
|
|
|
|
|
Total planned use of proceeds
|
|
|
2,709,000
|
|
|
|
3,284,000
|
|
|
|
4,009,000
|
|
|
|
4,834,000
|
|
|
|
|
|
|
|
|
|
|
|
|
|
|
|
|
|
|
|
|
Unallocated for general working capital
|
|
$
|
1,773,000
|
|
|
$
|
2,925,000
|
|
|
$
|
3,928,000
|
|
|
$
|
5,262,000
|
|
|
|
|
|
|
|
|
|
|
|
|
|
|
|
|
|
|
|
Although we intend to use the proceeds from the offering as set
forth above, the actual amount that we spend in connection with
each intended use of the proceeds may vary significantly from
the amounts specified above and will be dependent on a number of
factors, including those referenced under “Risk
Factors”.
Notwithstanding the foregoing, we cannot specify with certainty
the uses for the net proceeds to be received upon the completion
of this offering. Our management will have broad discretion as
to how to spend and invest between the approximately
Cdn$1,773,000 and Cdn$5,262,000 in possible unallocated general
working capital as shown in the table above. Investors will be
relying on the judgment of our management regarding the
application of these proceeds. You will not have the opportunity
to evaluate the economic, financial or other information on
which we base our decisions on how to use these proceeds. The
timing and amount of our actual expenditures will be based on
many factors, including cash flows (used for) or from
operations, available technology advances and the growth
30
of our business. The funds may not be fully used for a
significant period following the closing of the offering.
Pending the uses described above, we intend to invest the net
proceeds from this offering in short-term, investment grade,
interest bearing securities. We cannot predict whether the
proceeds invested will yield a favorable return.
We have agreed with Mr. Travers and Grant Russell, our
Executive Vice President and Chief Financial Officer, that we
will pay them deferred compensation in the aggregate amount of
$445,096, plus interest at the annual rate of 8.0%, and $209,208
in aggregate principal amount, plus interest at the annual rate
of 8.0%, in repayment of loans made to us more than five years
ago by those officers to finance our operations, either in one
lump sum on or before the first anniversary of the closing of
this offering from the proceeds of the exercise of the warrants
included in the units and the warrants issuable upon exercise of
the agents’ compensation options if and when at least 50%
of those warrants are exercised or otherwise in 12 equal monthly
installments beginning on the first anniversary of the closing
of this offering until paid in full. Any additional proceeds
from any exercise of the warrants included in the units and the
warrants issuable upon exercise of the agents’ compensation
options will be used for working capital. If all of these
warrants were to be exercised, we would receive additional funds
ranging in total of approximately Cdn$4,500,000 to
Cdn$9,375,000. These warrants may not be exercised before they
expire 36 months after the closing.
DIVIDEND
POLICY
We have never declared or paid any cash dividends on our common
stock. We currently intend to retain all available funds and any
future earnings to support our operations and finance the growth
and development of our business. We do not intend to pay cash
dividends on our common or preferred stock for the foreseeable
future. Any future determination related to dividend policy will
be made at the discretion of our board of directors.
Additionally, our lines of credit prohibit us from paying cash
dividends at any time at which any amount remains outstanding
under the lines. Although the outstanding principal amounts of
and interest accrued on our lines of credit will be paid in full
from the proceeds of this offering we expect that we will draw
down on the lines of credit from time to time after this
offering. We are not subject to any restrictions that would
prevent us from paying a dividend except for the restrictions
under our lines of credit and restrictions under
TSX-V
policies, our certificate of incorporation and bylaws and the
Delaware General Corporation Law.
31
CAPITALIZATION
The following table sets forth our cash and cash equivalents and
our capitalization as of June 30, 2009:
|
|
|
| |
•
|
on a pro forma basis assuming the conversion of
(i) 168,500 shares of our Series C Preferred
Stock outstanding immediately prior to the closing of this
offering, together with all dividends accrued and unpaid
thereon, at the conversion price of $0.2917 per share into
7,062,324 shares of our common stock; and (ii) $75,000
in aggregate principal amount of convertible promissory notes,
together with all interest accrued and unpaid thereon, at the
conversion price of $0.057089 per share into
2,251,985 shares of our common stock; and
|
|
|
|
| |
•
|
on a pro forma as adjusted basis assuming the events
described above and the sale in this offering of
(i) 40,000,000 units at an initial public offering price of
Cdn$0.15 per unit (the minimum of our estimated initial
public offering price range) resulting in gross proceeds of
Cdn$6,000,000 (or approximately US$5.63 million) (the
minimum gross proceeds to us of this offering); (ii) 40,000,000
units at an initial public offering price of Cdn$0.20 per unit
(the midpoint of our estimated initial public offering price
range) resulting in gross proceeds of Cdn$8,000,000; (iii)
50,000,000 units at an initial public offering price of Cdn$0.20
per unit (the midpoint of our estimated initial public offering
price range) resulting in gross proceeds of Cdn$10,000,000; and
(iv) the sale of 50,000,000 units (the maximum number of
units offered under this prospectus) at an initial public
offering price of Cdn$0.25 per unit (the maximum of our
estimated initial public offering price range) resulting in
gross proceeds of Cdn$12,500,000 (or approximately
US$11.74 million), after deducting estimated underwriting
commissions and offering expenses of between Cdn$1,226,000 and
$1,746,000, and the issuance of between 2,695,832 and
5,591,664 shares of our common stock to the Canadian agents
in payment of a fiscal advisory fee.
|
32
You should read the information in this table together with our
consolidated financial statements and accompanying notes and
“Management’s Discussion and Analysis of Financial
Condition and Results of Operations” appearing elsewhere in
this prospectus.
| |
|
|
|
|
|
|
|
|
|
|
|
|
|
|
|
|
|
|
|
|
|
|
|
|
|
|
|
June 30, 2009
|
|
|
|
|
Actual
|
|
|
Pro Forma
|
|
|
Pro Forma As Adjusted
|
|
|
|
|
(Unaudited)
|
|
|
|
|
|
|
|
|
|
|
|
|
|
|
|
|
|
|
|
Gross proceeds from offering (Cdn$)
|
|
|
|
|
|
|
|
|
|
$
|
6,000,000
|
|
|
$
|
8,000,000
|
|
|
$
|
10,000,000
|
|
|
$
|
12,500,000
|
|
|
Estimated net proceeds from offering (US$)
|
|
|
|
|
|
|
|
|
|
|
4,482,000
|
|
|
|
6,209,000
|
|
|
|
7,937,000
|
|
|
|
10,096,000
|
|
|
Cash and cash equivalents
|
|
$
|
285,126
|
|
|
|
|
|
|
|
4,767,126
|
|
|
|
6,494,126
|
|
|
|
8,222,126
|
|
|
|
10,381,126
|
|
|
|
|
|
|
|
|
|
|
|
|
|
|
|
|
|
|
|
|
|
|
|
|
|
|
|
|
Long-term debt (non-convertible) and related accrued interest
|
|
|
1,294,268
|
|
|
|
|
|
|
|
1,294,268
|
|
|
|
1,294,268
|
|
|
|
1,294,268
|
|
|
|
1,294,268
|
|
|
Accrued cumulative preferred dividends
|
|
|
374,849
|
|
|
|
(374,849
|
)
|
|
|
—
|
|
|
|
—
|
|
|
|
—
|
|
|
|
—
|
|
|
Convertible promissory notes and bridge loans and related
accrued interest
|
|
|
128,563
|
|
|
|
(128,563
|
)
|
|
|
—
|
|
|
|
—
|
|
|
|
—
|
|
|
|
—
|
|
|
|
|
|
|
|
|
|
|
|
|
|
|
|
|
|
|
|
|
|
|
|
|
|
|
|
|
Total long-term obligations
|
|
|
1,797,680
|
|
|
|
|
|
|
|
1,294,268
|
|
|
|
1,294,268
|
|
|
|
1,294,268
|
|
|
|
1,294,268
|
|
|
|
|
|
|
|
|
|
|
|
|
|
|
|
|
|
|
|
|
|
|
|
|
|
|
|
|
Stockholders’ Equity:
|
|
|
|
|
|
|
|
|
|
|
|
|
|
|
|
|
|
|
|
|
|
|
|
|
|
Preferred stock
|
|
|
|
|
|
|
|
|
|
|
—
|
|
|
|
—
|
|
|
|
—
|
|
|
|
—
|
|
|
Series C preferred stock ($0.001 par value),
500,000 shares authorized, 168,500 and 0 shares issued
and outstanding, actual and pro forma
|
|
|
169
|
|
|
|
(169
|
)
|
|
|
|
|
|
|
|
|
|
|
|
|
|
|
|
|
|
Common Stock
|
|
|
|
|
|
|
|
|
|
|
|
|
|
|
|
|
|
|
|
|
|
|
|
|
|
Common stock ($0.001 par value), 400,000,000 shares
authorized, 220,268,927 and 229,581,826 shares issued and
outstanding, actual and pro forma
|
|
|
220,269
|
|
|
|
9,314
|
|
|
|
274,975
|
|
|
|
274,975
|
|
|
|
285,175
|
|
|
|
285,175
|
|
|
Additional paid-in capital
|
|
|
12,979,093
|
|
|
|
494,267
|
|
|
|
17,909,968
|
(1)
|
|
|
19,636,968
|
(1)
|
|
|
21,354,768
|
(2)
|
|
|
23,513,768
|
(2)
|
|
Subscriptions receivable
|
|
|
(227,336
|
)
|
|
|
|
|
|
|
(227,336
|
)
|
|
|
(227,336
|
)
|
|
|
(227,336
|
)
|
|
|
(227,336
|
)
|
|
Accumulated deficit
|
|
|
(16,225,391
|
)
|
|
|
|
|
|
|
(16,225,391
|
)
|
|
|
(16,225,391
|
)
|
|
|
(16,225,391
|
)
|
|
|
(16,225,391
|
)
|
|
|
|
|
|
|
|
|
|
|
|
|
|
|
|
|
|
|
|
|
|
|
|
|
|
|
|
Total stockholders’ equity (deficit)
|
|
|
(3,253,196
|
)
|
|
|
|
|
|
|
1,732,216
|
|
|
|
3,459,216
|
|
|
|
5,187,216
|
|
|
|
7,346,216
|
|
|
|
|
|
|
|
|
|
|
|
|
|
|
|
|
|
|
|
|
|
|
|
|
|
|
|
|
Total capitalization
|
|
$
|
(1,170,390
|
)
|
|
|
|
|
|
$
|
7,793,610
|
|
|
$
|
11,247,610
|
|
|
$
|
14,703,610
|
|
|
$
|
19,021,610
|
|
|
|
|
|
|
|
|
|
|
|
|
|
|
|
|
|
|
|
|
|
|
|
|
|
|
|
|
|
|
|
(1)
|
|
274,974,896 shares of common
stock issued and outstanding on a pro forma as adjusted basis.
|
|
|
|
|
(2)
|
|
285,174,896 shares of common
stock issued and outstanding on a pro forma as adjusted basis.
|
The number of shares of common stock to be outstanding
immediately after this offering is based on the number of shares
outstanding as of June 30, 2009 and excludes:
|
|
|
| |
•
|
15,304,554 shares of our common stock issuable upon
exercise of then outstanding options under our 2007 option plan,
having a weighted average exercise price of $0.0999 per share;
|
| |
| |
•
|
1,200,000 shares of our common stock issuable upon exercise
of options under our 2009 option plan that we intend to grant to
our non-employee directors at the closing of this offering, each
having a per share exercise price equal to the initial public
offering price per unit; and
|
|
|
|
| |
•
|
7,069,988 shares of our common stock issuable upon exercise of
outstanding warrants, having a weighted average exercise price
of $0.1804 per share.
|
In consideration of certain fiscal advisory services rendered by
the Canadian agents to us pursuant to a fiscal advisory fee
agreement between us and the Canadian agents, we have agreed to
issue to the Canadian agents at the closing of this offering, in
payment of a fiscal advisory fee, that number of shares of our
common stock equal to, depending on the gross proceeds of the
offering, between 1.0% and 2.0% of our common stock issued and
33
outstanding immediately upon the closing of the offering. The
issuance of these shares to the Canadian agents is not covered
by this prospectus. These shares will be issued pursuant to
exemptions from the registration requirements of applicable
United States and Canadian securities laws and subject to resale
restrictions under those laws and a
lock-up
agreement for one year. See “Underwriting —
Fiscal Advisory Fee Agreement.”
Consolidated
Capitalization
Except as disclosed in the table above, there have been no
material changes in our share and loan capital since
December 31, 2008.
34
DILUTION
If you invest in our units in this offering, your ownership
interest will be diluted to the extent of the difference between
the initial public offering price per unit and the pro forma net
tangible book value per share of our common stock after this
offering. The historical net tangible book value of our common
stock as of June 30, 2009 was a deficit of approximately
$5,700,000, or $(0.0256) per share, based on the number of
shares outstanding as of June 30, 2009. Historical net
tangible book value per share is determined by dividing the
number of outstanding shares of our common stock into our total
tangible assets, or total assets less intangible assets, less
our total liabilities and less the carrying value of our total
convertible preferred stock. Investors participating in this
offering will incur immediate, substantial dilution. Our pro
forma net tangible book value as of June 30, 2009 was a
deficit of approximately $(3,500,000), or approximately
$(0.0161) per share. Pro forma net tangible book value per share
represents the amount of our total tangible assets less our
total liabilities, divided by the pro forma number of shares of
our common stock outstanding after giving effect to the
conversion of all outstanding shares of our Series C
Preferred Stock, together with all dividends accrued and unpaid
thereon, into 7,062,324 shares of our common stock and
$75,000 in aggregate principal amount of convertible promissory
notes, together with all interest accrued and unpaid thereon,
into 2,251,981 shares of our common stock upon completion
of this offering.
The following table sets forth our pro forma as adjusted net
tangible book value as of June 30, 2009 assuming the sale of
(i) 40,000,000 units at an initial public offering price of
Cdn$0.15 per unit (the minimum of our estimated initial public
offering price range) resulting in gross proceeds of
Cdn$6,000,000 (or approximately US$5.63 million) (the
minimum gross proceeds to us of this offering);
(ii) 40,000,000 units at an initial public offering price
of Cdn$0.20 per unit (the midpoint of our estimated initial
public offering price range) resulting in gross proceeds of
Cdn$8,000,000; (iii) 50,000,000 units at an initial public
offering price of Cdn$0.20 per unit (the midpoint of our
estimated initial public offering price range) resulting in
gross proceeds of Cdn$10,000,000; and (iv) the sale of
50,000,000 units (the maximum number of units offered under this
prospectus) at an initial public offering price of Cdn$0.25 per
unit (the maximum of our estimated initial public offering price
range) resulting in gross proceeds of Cdn$12,500,000 (or
approximately US$11.74 million), and after deducting
estimated underwriting commissions and offering expenses of
between Cdn$1,226,000 and Cdn$1,746,000, and the issuance of
between 2,695,832 and 5,591,664 shares of our common stock to
the Canadian agents in payment of a fiscal advisory fee:
| |
|
|
|
|
|
|
|
|
|
|
|
|
|
|
|
|
|
Assumed number of units sold in offering
|
|
|
40,000,000
|
|
|
|
40,000,000
|
|
|
|
50,000,000
|
|
|
|
50,000,000
|
|
|
Historical net tangible book value per share as of June 30,
2009
|
|
$
|
(0.0256
|
)
|
|
$
|
(0.0256
|
)
|
|
$
|
(0.0256
|
)
|
|
$
|
(0.0256
|
)
|
|
Increase in net tangible book value deficit per share
attributable to conversion of preferred stock and convertible
notes
|
|
|
0.0095
|
|
|
|
0.0095
|
|
|
|
0.0095
|
|
|
|
0.0095
|
|
|
|
|
|
|
|
|
|
|
|
|
|
|
|
|
|
|
|
|
Pro forma net tangible book value deficit per share as of
June 30, 2009
|
|
|
(0.0161
|
)
|
|
|
(0.0161
|
)
|
|
|
(0.0161
|
)
|
|
|
(0.0161
|
)
|
|
Increase in net tangible book value per share attributable to
investors participating in this offering, after offering costs
|
|
|
0.0198
|
|
|
|
0.0261
|
|
|
|
0.0318
|
|
|
|
0.0393
|
|
|
|
|
|
|
|
|
|
|
|
|
|
|
|
|
|
|
|
|
Pro forma as adjusted net tangible book value per share after
this offering
|
|
|
0.0037
|
|
|
|
0.0100
|
|
|
|
0.0157
|
|
|
|
0.0232
|
|
|
Assumed gross initial public offering price per unit (US$)
|
|
|
0.1408
|
|
|
|
0.1876
|
|
|
|
0.1876
|
|
|
|
0.2347
|
|
|
|
|
|
|
|
|
|
|
|
|
|
|
|
|
|
|
|
|
Pro forma dilution per share to investors participating in this
offering
|
|
$
|
(0.1371
|
)
|
|
$
|
(0.1778
|
)
|
|
$
|
(0.1721
|
)
|
|
$
|
(0.2115
|
)
|
|
|
|
|
|
|
|
|
|
|
|
|
|
|
|
|
|
|
The following table summarizes, on a pro forma as adjusted basis
as of June 30, 2009, the differences between the number of
shares of common stock purchased from us, the total
consideration and the average price per share paid by existing
stockholders and by investors participating in this offering,
after deducting estimated underwriting discounts and commissions
and offering expenses of between Cdn$1,226,000 and
Cdn$1,746,000, assuming the sale of the number of units at the
initial public offering prices specified below and the issuance
of the corresponding
35
number of shares of our common stock to the Canadian agents
pursuant to our fiscal advisory fee agreement with the Canadian
agents:
| |
|
|
|
|
|
|
|
|
|
|
|
|
|
|
|
|
|
|
|
|
|
|
|
Shares Purchased
|
|
|
Total Consideration
|
|
|
|
|
|
|
|
|
|
|
Percent
|
|
|
|
|
|
Percent
|
|
|
Average Price
|
|
|
|
|
Number
|
|
|
(%)
|
|
|
Amount
|
|
|
(%)
|
|
|
per Share
|
|
|
|
|
Offering of 40,000,000 units at Cdn$0.15
|
|
|
|
|
|
|
|
|
|
|
|
|
|
|
|
|
|
|
|
|
|
Existing stockholders before this offering
|
|
|
229,583,232
|
|
|
|
83.5
|
|
|
$
|
13,475,607
|
|
|
|
75.0
|
|
|
$
|
0.0587
|
|
|
Investors participating in this offering
|
|
|
40,000,000
|
|
|
|
14.5
|
|
|
|
4,482,208
|
|
|
|
25.0
|
|
|
|
0.1121
|
|
|
Agents (in payment of fiscal advisory fee)
|
|
|
5,391,664
|
|
|
|
2.0
|
|
|
|
—
|
|
|
|
0.0
|
|
|
|
0.0
|
|
|
|
|
|
|
|
|
|
|
|
|
|
|
|
|
|
|
|
|
|
|
|
|
Total
|
|
|
274,974,896
|
|
|
|
100.0
|
|
|
$
|
17,957,815
|
|
|
|
100.0
|
|
|
$
|
0.0653
|
|
|
Offering of 40,000,000 units at Cdn$0.20
|
|
|
|
|
|
|
|
|
|
|
|
|
|
|
|
|
|
|
|
|
|
Existing stockholders before this offering
|
|
|
229,583,232
|
|
|
|
83.5
|
|
|
$
|
13,475,607
|
|
|
|
68.5
|
|
|
$
|
0.0587
|
|
|
Investors participating in this offering
|
|
|
40,000,000
|
|
|
|
14.5
|
|
|
|
6,209,746
|
|
|
|
31.5
|
|
|
|
0.1552
|
|
|
Agents (in payment of fiscal advisory fee)
|
|
|
5,391,664
|
|
|
|
2.0
|
|
|
|
—
|
|
|
|
0.0
|
|
|
|
0.0
|
|
|
|
|
|
|
|
|
|
|
|
|
|
|
|
|
|
|
|
|
|
|
|
|
Total
|
|
|
274,974,896
|
|
|
|
100.0
|
|
|
$
|
19,685,352
|
|
|
|
100.0
|
|
|
$
|
0.0716
|
|
|
Offering of 50,000,000 units at Cdn$0.20
|
|
|
|
|
|
|
|
|
|
|
|
|
|
|
|
|
|
|
|
|
|
Existing stockholders before this offering
|
|
|
229,583,232
|
|
|
|
80.5
|
|
|
$
|
13,475,607
|
|
|
|
62.9
|
|
|
$
|
0.0587
|
|
|
Investors participating in this offering
|
|
|
50,000,000
|
|
|
|
17.5
|
|
|
|
7,937,283
|
|
|
|
32.1
|
|
|
|
0.1587
|
|
|
Agents (in payment of fiscal advisory fee)
|
|
|
5,591,664
|
|
|
|
2.0
|
|
|
|
—
|
|
|
|
0.0
|
|
|
|
0.0
|
|
|
|
|
|
|
|
|
|
|
|
|
|
|
|
|
|
|
|
|
|
|
|
|
Total
|
|
|
285,174,896
|
|
|
|
100.0
|
|
|
$
|
21,412,890
|
|
|
|
100.0
|
|
|
$
|
0.0751
|
|
|
Offering of 50,000,000 units at Cdn$0.25
|
|
|
|
|
|
|
|
|
|
|
|
|
|
|
|
|
|
|
|
|
|
Existing stockholders before this offering
|
|
|
229,583,232
|
|
|
|
80.5
|
|
|
$
|
13,475,607
|
|
|
|
57.2
|
|
|
$
|
0.0587
|
|
|
Investors participating in this offering
|
|
|
50,000,000
|
|
|
|
17.5
|
|
|
|
10,096,705
|
|
|
|
42.8
|
|
|
|
0.2019
|
|
|
Agents (in payment of fiscal advisory fee)
|
|
|
5,591,664
|
|
|
|
2.0
|
|
|
|
—
|
|
|
|
0.0
|
|
|
|
0.0
|
|
|
|
|
|
|
|
|
|
|
|
|
|
|
|
|
|
|
|
|
|
|
|
|
Total
|
|
|
285,174,896
|
|
|
|
100.0
|
%
|
|
$
|
23,522,311
|
|
|
|
100.0
|
|
|
$
|
0.0827
|
|
The discussion and table above assume no exercise of the
agents’ compensation options or any other options or
warrants outstanding on the date of this prospectus. If the
agents’ compensation options are exercised in full, the
number of shares of common stock held by existing stockholders
will be reduced to 78.8% of the total number of shares of common
stock to be outstanding after this offering, and the number of
shares of common stock held by investors participating in this
offering will be increased to 291,454,557 shares or 19.3% of the
total number of shares of common stock outstanding after this
offering.
In consideration of certain fiscal advisory services rendered by
the Canadian agents to us pursuant to a fiscal advisory fee
agreement between us and the Canadian agents, we have agreed to
issue to the Canadian agents at the closing of this offering, in
payment of a fiscal advisory fee, that number of shares of our
common stock equal to, depending on the gross proceeds of the
offering, between 1.0% and 2.0% of our common stock issued and
outstanding immediately upon the closing of the offering. The
table above assumes that we will issue the maximum number of
shares issuable to the Canadian agents under the fiscal advisory
fee agreement. The issuance of these shares to the Canadian
agents is not covered by this prospectus. These shares will be
issued pursuant to exemptions from the registration requirements
of applicable United States and Canadian securities laws and
subject to resale restrictions under these laws and a
lock-up
agreement for one year. See “Underwriting —
Fiscal Advisory Fee Agreement.”
The share data in the table above is based on the number of
shares outstanding as of June 30, 2009 and excludes:
|
|
|
| |
•
|
15,304,554 shares of our common stock issuable upon
exercise of options then outstanding under our 2007 option plan,
having a weighted average exercise price of $0.0999 per share;
|
36
|
|
|
| |
•
|
1,200,000 shares of our common stock issuable upon exercise
of options under our 2009 option plan that we intend to grant to
our non-employee directors at the closing of this offering, each
having a per share exercise price equal to the initial public
offering price per unit; and
|
|
|
|
| |
•
|
7,069,988 shares of common stock issuable upon exercise of
then outstanding warrants, having a weighted average exercise
price of $0.1804 per share.
|
To the extent that any of these options or warrants are
exercised, new options are issued under our equity incentive
plans or we issue additional shares of common stock in the
future, there will be further dilution to investors
participating in this offering.
Quantitative
and Qualitative Disclosures about Market Risk
Foreign
Currency Exchange Risk
In 2008, approximately 92% of our total sales were comprised of
sales to customers in the United States and 8% were comprised of
sales to customers outside the United States. Of our sales
received in 2008 from customers outside of the United States,
95% were paid in currencies other than US dollars. Therefore,
our results could be negatively affected by such factors as
changes in foreign currency exchange rates, trade protection
measures and changes in regional or worldwide economic or
political conditions. We also buy many components manufactured
in other countries in transactions denominated in US dollars.
The domestic currencies of some of those suppliers fluctuate
with the US dollar. As a result, changes in the cost of our
components can occur with each new purchase. A decrease in the
value of the US dollar against our supplier’s domestic
currencies could negatively and materially affect our
manufacturing costs. A 10% change in the value of the US dollar
relative to each of the foreign currencies in which our sales
are denominated would have resulted in a change in our sales of
no more than 2%. Historically, we have not tried to reduce our
exposure to exchange rate fluctuations by engaging in hedging
activities.
Interest
Rate Risk
At December 31, 2008, we had unrestricted cash and cash
equivalents totaling $818,719, and at December 31, 2007 we
had unrestricted cash and cash equivalents totaling $364,856.
These amounts were not held in interest-bearing accounts. The
unrestricted cash and cash equivalents were held for working
capital purposes. We do not enter into investments for trading
or speculative purposes. The interest rates on our $879,208 of
notes payable outstanding at December 31, 2008 are fixed at
a range of between 7.5% and 12.0% and a weighted average range
of approximately 10%. If market interest rates increase,
the fair value of our notes payable would decrease.
Recent
Accounting Pronouncements
In December 2007, the Financial Accounting Standards Board
(FASB) issued Statement of Financial Accounting Standard (SFAS)
No. 141(R), Business Combinations, a revision to
SFAS No. 141, Business Combinations
(SFAS No. 141(R)). SFAS No. 141(R)
provides revised guidance for recognition and measurement of
identifiable assets and goodwill acquired, liabilities assumed
and any non-controlling interest in the acquiree at fair value.
The statement also establishes disclosure requirements to enable
the evaluation of the nature and financial effects of a business
combination. SFAS No. 141(R) is required to be applied
prospectively to business combinations for which the acquisition
date is on or after January 1, 2009. The impact of the
adoption of SFAS 141(R) on our consolidated financial
position and results of operations for the first two quarters of
2009 did not have a material effect on our consolidated
financial statements. Any subsequent impact will be dependent on
the size and nature of business combinations, if any, completed
in the future.
In December 2007, the FASB issued SFAS No. 160,
Non-controlling Interests in Consolidated Financial
Statements — an amendment of ARB No. 51
(SFAS No. 160). This statement establishes
accounting and reporting standards for ownership interests in
subsidiaries held by parties other than the parent.
Specifically, SFAS No. 160 requires the presentation
of non-controlling interests as equity in the Consolidated
Balance Sheets, and separate identification and presentation in
the Consolidated Statements of Income of net income attributable
to the entity and the non-controlling interest. It also
establishes accounting and reporting standards regarding
deconsolidation and changes in a parent’s ownership
interest. SFAS No. 160 is effective as of
January 1, 2009. The provisions of
37
SFAS No. 160 are generally required to be applied
prospectively, except for the presentation and disclosure
requirements, which must be applied retrospectively. The
adoption of SFAS No. 160 did not have a material
effect on our consolidated financial statements.
In February 2008, the FASB issued FASB Staff Position (FSP)
No. FAS 157-2,
Effective Date of SFAS No. 157. This FSP delays
the effective date of SFAS No. 157 for all
non-financial assets and non-financial liabilities, except those
that are recognized or disclosed at fair value in the
consolidated financial statements on a recurring basis (at least
annually). This FSP partially deferred the effective date of
SFAS No. 157 to fiscal years beginning after
November 15, 2008, and interim periods within those fiscal
years for items within the scope of this FSP. We adopted this
FSP for our fiscal year 2009, and did not have a material impact
on our consolidated financial statements in our first two
quarters of that year.
In March 2008, the FASB issued SFAS No. 161,
Disclosures about Derivative Instruments and Hedging
Activities, an amendment of FASB Statement No. 133
(SFAS No. 161). This statement enhances the disclosure
requirements related to derivative instruments and hedging
activity to improve the transparency of financial reporting, and
is effective for fiscal years and interim periods beginning
after November 15, 2008. The adoption of
SFAS No. 161 did not have a material effect on our
consolidated financial statements.
In May 2009, the FASB issued SFAS No. 165, Subsequent
Events (FAS 165). This standard sets forth the period after
the balance sheet date during which management of a reporting
entity should evaluate events or transactions that may occur for
potential recognition or disclosure in the financial statements,
the circumstances under which an entity should recognize events
or transactions occurring after the balance sheet date in its
financial statements, and the disclosures that an entity should
make about events or transactions that occurred after the
balance sheet date. FAS 165 is effective for fiscal years
and interim periods ended after June 15, 2009. We adopted
this standard during the quarter ended June 30, 2009 and have
evaluated any subsequent events through the date of this filing.
We do not believe there are any material subsequent events which
would require further disclosure.
In June 2009, the FASB issued SFAS No. 168, The FASB
Accounting Standards Codification and the Hierarchy of Generally
Accepted Accounting Principles (FAS 168). FAS 168
replaces FASB Statement No. 162, The Hierarchy of
Generally Accepted Accounting Principles, and establishes
the FASB Accounting Standards Codification (the Codification) as
the source of authoritative accounting principles recognized by
the FASB to be applied by nongovernmental entities in the
preparation of financial statements in conformity with generally
accepted accounting principles (GAAP). FAS 168 is effective
for interim and annual periods ending after September 15,
2009. We will begin to use the new guidelines and numbering
system prescribed by the Codification when referring to GAAP
during the quarter ended September 30, 2009. The
Codification will not have an impact on our financial results.
38
SELECTED
FINANCIAL AND OTHER DATA
The following tables present our summary financial data and
should be read together with our financial statements and
accompanying notes and “Management’s Discussion and
Analysis of Financial Condition and Results of Operations”
appearing elsewhere in this prospectus. The summary financial
data for the years ended December 31, 2008, 2007 and 2006
are derived from our audited annual financial statements, which
are included elsewhere in this prospectus. The unaudited summary
financial data as of June 30, 2009 and for the three and
six months ended June 30, 2009 and 2008 have been derived
from our unaudited interim financial statements, which are
included elsewhere in this prospectus, and include all
adjustments, consisting of normal recurring adjustments,
necessary for a fair presentation of our financial position and
results of operations for these periods.
| |
|
|
|
|
|
|
|
|
|
|
|
|
|
|
|
|
|
|
|
Three Months Ended June 30,
|
|
|
Six Months Ended June 30,
|
|
|
Statement of Operations Data
|
|
2009
|
|
|
2008
|
|
|
2009
|
|
|
2008
|
|
|
|
|
(Unaudited)
|
|
|
(Unaudited)
|
|
|
(Unaudited)
|
|
|
(Unaudited)
|
|
|
|
|
(Restated)
|
|
|
(Restated)
|
|
|
(Restated)
|
|
|
(Restated)
|
|
|
|
|
Sales
|
|
$
|
2,063,733
|
|
|
$
|
3,087,338
|
|
|
|
5,082,087
|
|
|
$
|
4,807,982
|
|
|
Cost of Sales
|
|
|
1,390,819
|
|
|
|
1,871,661
|
|
|
|
3,221,861
|
|
|
|
3,358,739
|
|
|
|
|
|
|
|
|
|
|
|
|
|
|
|
|
|
|
|
|
Gross Margin
|
|
|
672,914
|
|
|
|
1,215,677
|
|
|
|
1,860,226
|
|
|
|
1,449,243
|
|
|
Operating Expenses
|
|
|
|
|
|
|
|
|
|
|
|
|
|
|
|
|
|
Research and development
|
|
|
428,737
|
|
|
|
1,224,265
|
|
|
|
945,897
|
|
|
|
1,960,982
|
|
|
Selling and marketing
|
|
|
520,257
|
|
|
|
483,695
|
|
|
|
976,041
|
|
|
|
933,257
|
|
|
General and administrative
|
|
|
534,142
|
|
|
|
438,831
|
|
|
|
990,729
|
|
|
|
972,630
|
|
|
Depreciation and amortization
|
|
|
167,509
|
|
|
|
123,696
|
|
|
|
306,343
|
|
|
|
247,392
|
|
|
|
|
|
|
|
|
|
|
|
|
|
|
|
|
|
|
|
|
Total operating expenses
|
|
|
1,650,645
|
|
|
|
2,270,487
|
|
|
|
3,219,010
|
|
|
|
4,114,261
|
|
|
|
|
|
|
|
|
|
|
|
|
|
|
|
|
|
|
|
|
Profit (Loss) from operations
|
|
|
(977,731
|
)
|
|
|
(1,054,810
|
)
|
|
|
(1,358,784
|
)
|
|
|
(2,665,018
|
)
|
|
Interest and other income (expense)
|
|
|
11
|
|
|
|
—
|
|
|
|
59
|
|
|
|
166
|
|
|
Foreign exchange (loss) gain
|
|
|
(3,657
|
)
|
|
|
(300
|
)
|
|
|
(4,969
|
)
|
|
|
(33
|
)
|
|
Interest expense
|
|
|
(56,711
|
)
|
|
|
(57,353
|
)
|
|
|
(122,095
|
)
|
|
|
(99,019
|
)
|
|
Tax (expense) benefit
|
|
|
(888
|
)
|
|
|
(2,897
|
)
|
|
|
(1,776
|
)
|
|
|
(3,650
|
)
|
|
|
|
|
|
|
|
|
|
|
|
|
|
|
|
|
|
|
|
Total tax and other income (expense)
|
|
|
(61,245
|
)
|
|
|
(60,550
|
)
|
|
|
(128,781
|
)
|
|
|
(102,536
|
)
|
|
|
|
|
|
|
|
|
|
|
|
|
|
|
|
|
|
|
|
Net (Loss)
|
|
$
|
(1,038,976
|
)
|
|
$
|
(1,115,360
|
)
|
|
|
(1,487,565
|
)
|
|
$
|
(2,767,554
|
)
|
|
|
|
|
|
|
|
|
|
|
|
|
|
|
|
|
|
|
|
Income (loss) per share:
|
|
|
|
|
|
|
|
|
|
|
|
|
|
|
|
|
|
Basic and fully diluted*
|
|
|
(0.0048
|
)
|
|
|
(0.0057
|
)
|
|
|
(0.0070
|
)
|
|
$
|
(0.0141
|
)
|
|
Weighted average common shares outstanding:
|
|
|
|
|
|
|
|
|
|
|
|
|
|
|
|
|
|
Basic and fully diluted*
|
|
|
220,268,927
|
|
|
|
200,424,027
|
|
|
|
219,935,594
|
|
|
|
200,015,546
|
|
39
| |
|
|
|
|
|
|
|
|
|
|
|
|
|
|
|
Year Ended December 31,
|
|
|
Statement of Operations Data
|
|
2008
|
|
|
2007
|
|
|
2006
|
|
|
|
|
(Restated)
|
|
|
(Restated)
|
|
|
(Restated)
|
|
|
|
|
Sales
|
|
$
|
12,489,884
|
|
|
$
|
10,146,379
|
|
|
$
|
9,538,308
|
|
|
Cost of Sales
|
|
|
8,788,905
|
|
|
|
6,783,473
|
|
|
|
5,767,550
|
|
|
|
|
|
|
|
|
|
|
|
|
|
|
|
|
Gross Margin
|
|
|
3,700,979
|
|
|
|
3,362,906
|
|
|
|
3,770,758
|
|
|
Operating Expenses
|
|
|
|
|
|
|
|
|
|
|
|
|
|
Research and development
|
|
|
3,366,518
|
|
|
|
2,365,412
|
|
|
|
1,279,239
|
|
|
Selling and marketing
|
|
|
2,128,625
|
|
|
|
1,920,164
|
|
|
|
1,191,800
|
|
|
General and administrative
|
|
|
2,299,685
|
|
|
|
1,718,627
|
|
|
|
1,560,278
|
|
|
Depreciation and amortization
|
|
|
510,133
|
|
|
|
374,078
|
|
|
|
276,989
|
|
|
|
|
|
|
|
|
|
|
|
|
|
|
|
|
Total operating expenses
|
|
|
8,304,961
|
|
|
|
6,378,281
|
|
|
|
4,308,306
|
|
|
|
|
|
|
|
|
|
|
|
|
|
|
|
|
Profit (Loss) from operations
|
|
|
(4,603,982
|
)
|
|
|
(3,015,375
|
)
|
|
|
(537,548
|
)
|
|
Interest and other income (expense)
|
|
|
188
|
|
|
|
2,549
|
|
|
|
313
|
|
|
Foreign exchange (loss) gain
|
|
|
(24,216
|
)
|
|
|
—
|
|
|
|
—
|
|
|
Interest expense
|
|
|
(260,977
|
)
|
|
|
(241,692
|
)
|
|
|
(179,019
|
)
|
|
Legal settlement
|
|
|
—
|
|
|
|
96,632
|
|
|
|
—
|
|
|
Tax (expense) benefit
|
|
|
(5,212
|
)
|
|
|
98,372
|
|
|
|
(3,700
|
)
|
|
|
|
|
|
|
|
|
|
|
|
|
|
|
|
Total tax and other income (expense)
|
|
|
(290,217
|
)
|
|
|
(44,139
|
)
|
|
|
(182,406
|
)
|
|
|
|
|
|
|
|
|
|
|
|
|
|
|
|
Net (Loss)
|
|
$
|
(4,894,199
|
)
|
|
$
|
(3,059,514
|
)
|
|
$
|
(719,954
|
)
|
|
|
|
|
|
|
|
|
|
|
|
|
|
|
|
Income (loss) per share:
|
|
|
|
|
|
|
|
|
|
|
|
|
|
Basic and fully diluted*
|
|
$
|
(0.0240
|
)
|
|
$
|
(0.0176
|
)
|
|
$
|
(0.0047
|
)
|
|
Weighted average common shares outstanding:
|
|
|
|
|
|
|
|
|
|
|
|
|
|
Basic and fully diluted*
|
|
|
207,710,498
|
|
|
|
185,263,660
|
|
|
|
173,254,715
|
|
|
|
|
|
* |
|
All outstanding warrants, options, and convertible debt are
anti-dilutive, therefore basic and diluted earnings per share
are the same for all periods. |
| |
|
|
|
|
|
|
|
|
|
|
|
|
|
|
|
|
|
|
|
|
|
|
|
Year Ended December 31,
|
|
|
Six Months Ended June 30,
|
|
|
Cash Flow Data
|
|
2008
|
|
|
2007
|
|
|
2006
|
|
|
2009
|
|
|
2008
|
|
|
|
|
|
|
|
|
|
|
|
|
|
(Unaudited)
|
|
|
(Unaudited)
|
|
|
|
|
Cash flows provided by (used in) operating activities
|
|
$
|
(1,285,449
|
)
|
|
$
|
(3,295,900
|
)
|
|
$
|
120,053
|
|
|
$
|
(476,637
|
)
|
|
$
|
(107,925
|
)
|
|
Cash flows (used in) investing activities
|
|
|
(549,804
|
)
|
|
|
(316,743
|
)
|
|
|
(479,236
|
)
|
|
|
(148,777
|
)
|
|
|
(259,193
|
)
|
|
Cash flows provided by financing activities
|
|
|
2,289,116
|
|
|
|
3,408,328
|
|
|
|
874,569
|
|
|
|
91,820
|
|
|
|
106,255
|
|
| |
|
|
|
|
|
|
|
|
|
|
|
|
|
|
|
|
|
|
|
|
|
|
|
As of December 31,
|
|
|
As of June 30,
|
|
|
Balance Sheet Data
|
|
2008
|
|
|
2007
|
|
|
2006
|
|
|
2009
|
|
|
2008
|
|
|
|
|
|
|
|
|
|
|
|
|
|
(Unaudited)
|
|
|
(Unaudited)
|
|
|
|
|
Cash and cash equivalents
|
|
$
|
818,719
|
|
|
$
|
364,856
|
|
|
$
|
569,171
|
|
|
$
|
285,126
|
|
|
$
|
103,993
|
|
|
Working Capital (deficiency)
|
|
|
(1,846,289
|
)
|
|
|
966,658
|
|
|
|
69,766
|
|
|
|
(2,808,676
|
)
|
|
|
(2,150,731
|
)
|
|
Total Assets
|
|
|
6,221,897
|
|
|
|
6,967,254
|
|
|
|
5,013,263
|
|
|
|
4,351,101
|
|
|
|
5,939,483
|
|
|
Long-Term Liabilities
|
|
|
1,754,379
|
|
|
|
2,014,476
|
|
|
|
1,980,476
|
|
|
|
1,797,680
|
|
|
|
1,606,559
|
|
|
Accumulated (deficit)
|
|
|
(14,687,276
|
)
|
|
|
(9,691,977
|
)
|
|
|
(6,531,363
|
)
|
|
|
(16,225,391
|
)
|
|
|
(12,510,081
|
)
|
|
Total Stockholders’ equity (deficit)
|
|
|
(2,089,942
|
)
|
|
|
423,236
|
|
|
|
(603,954
|
)
|
|
|
(3,253,196
|
)
|
|
|
(2,274,435
|
)
|
40
MANAGEMENT’S
DISCUSSION AND ANALYSIS OF
FINANCIAL CONDITION AND RESULTS OF OPERATIONS
You should read the following discussion and analysis of
financial condition and results of operations in conjunction
with the “Selected Financial and Other Data” and our
financial statements and related notes appearing elsewhere in
this prospectus. In addition to historical information, the
following discussion and analysis includes forward looking
statements that involve risks, uncertainties and assumptions.
Our actual results and the timing of events could differ
materially from those anticipated in these forward looking
statements as a result of a variety of factors, including those
discussed in “Risk Factors” and elsewhere in this
prospectus. See the discussion under “Forward Looking
Statements” beginning on page 24 of this
prospectus.
Overview
We are engaged in the design, manufacture, marketing and sale of
devices that are worn like eyeglasses and feature built-in video
screens that enable the user to view video and digital content,
such as movies, computer data, the Internet or video games. Our
products (known commercially as Video Eyewear, but also commonly
referred to as virtual displays, wearable displays, personal
viewers, head mounted displays, or near-to-eye displays) are
used to view high-resolution video and digital information
primarily from mobile electronic devices (such as cell phones,
portable media players, gaming systems and laptop computers) and
from desktop computers. Our products provide the user a viewing
experience that simulates viewing a large screen television or a
desktop computer monitor.
Our Video Eyewear products feature high performance miniature
display modules, low power electronics and related optical
systems. We produce both monocular and binocular Video Eyewear
devices that we believe are excellent solutions for many mobile
computer or video viewing requirements. We focus on two markets:
the consumer markets for gaming and mobile video and rugged
mobile displays for defense and industrial applications. We also
offer low-vision assist Video Eyewear products that are designed
to assist and improve the remaining vision of many people
suffering from macular degeneration.
Since our inception in 1997, we have derived the majority of our
sales from fees paid to us under research and development
contracts and related volume manufacturing services primarily of
night vision display electronics as a sub-contractor to defense
suppliers to the US government. Since 2005, we have devoted
significant resources to the development and commercial launch
of our industrial and consumer products. During 2008 and 2007,
we derived 35.6 and 32.4%, respectively, of our sales from our
consumer Video Eyewear products.
We believe our intellectual property portfolio gives us a
leadership position in microdisplay electronics, ergonomics,
packaging, motion tracking and optical systems.
Critical
Accounting Policies and Significant Developments and
Estimates
The discussion and analysis of our financial condition and
results of operations are based on our financial statements and
related notes appearing elsewhere in this prospectus. The
preparation of these statements in conformity with generally
accepted accounting principles requires the appropriate
application of certain accounting policies, many of which
require us to make estimates and assumptions about future events
and their impact on amounts reported in our financial
statements, including the statement of operations, balance
sheet, cash flow and related notes. Since future events and
their impact cannot be determined with certainty, the actual
results will inevitably differ from our estimates. Such
differences could be material to the financial statements.
We believe that our application of accounting policies, and the
estimates inherently required therein, are reasonable. These
accounting policies and estimates are periodically reevaluated,
and adjustments are made when facts and circumstances dictate a
change. Historically, we have found our application of
accounting policies to be appropriate, and actual results have
not differed materially from those determined using necessary
estimates.
Our accounting policies are more fully described in the notes to
our financial statements included in this prospectus. In reading
our financial statements, you should be aware of the factors and
trends that our management
41
believes are important in understanding our financial
performance. The critical accounting policies, judgments and
estimates that we believe have the most significant effect on
our financial statements are:
|
|
|
| |
•
|
valuation of inventories;
|
| |
| |
•
|
carrying value of long-lived assets;
|
| |
| |
•
|
valuation of intangible assets;
|
| |
| |
•
|
revenue recognition;
|
| |
| |
•
|
product warranty;
|
| |
| |
•
|
stock-based compensation; and
|
| |
| |
•
|
income taxes.
|
Valuation
of Inventories
Inventory is stated at the lower of cost or market, with cost
determined on a
first-in,
first-out method. Inventory includes purchased parts and
components, work in process and finished goods. Provisions for
excess, obsolete or slow moving inventory are recorded after
periodic evaluation of historical sales, current economic
trends, forecasted sales, estimated product lifecycles and
estimated inventory levels. Purchasing practices, electronic
component obsolescence, accuracy of sales and production
forecasts, introduction of new products, product lifecycles,
product support and foreign regulations governing hazardous
materials are the factors that contribute to inventory valuation
risks. Exposure to inventory valuation risks is managed by
maintaining safety stocks, minimum purchase lots, managing
product and end-of-life issues brought on by aging components or
new product introductions, and by utilizing certain inventory
minimization strategies such as vendor-managed inventories. The
accounting estimate related to valuation of inventories is
considered a “critical accounting estimate” because it
is susceptible to changes from period-to-period due to the
requirement for management to make estimates relative to each of
the underlying factors, ranging from purchasing, to sales, to
production, to after-sale support. If actual demand, market
conditions or product lifecycles differ from estimates,
inventory adjustments to lower market values would result in a
reduction to the carrying value of inventory, an increase in
inventory write-offs and a decrease to gross margins.
Carrying
Value of Long-Lived Assets
If facts and circumstances indicate that a long-lived asset,
including a products’ mold tooling and equipment, may be
impaired, the carrying value is reviewed. If this review
indicates that the carrying value of the asset will not be
recovered as determined based on projected undiscounted cash
flows related to the asset over its remaining life, the carrying
value of the asset is reduced to its estimated fair value. To
date, no impairment on long-lived assets has been booked.
Impairment losses in the future will be dependent on a number of
factors such as general economic trends and major technology
advances, and thus could be significantly different than
historical results.
Valuation
of Intangible Assets
We perform a valuation of intangible assets when events or
circumstances indicate their carrying amounts may be
unrecoverable. We have not impaired the value of certain
intellectual property, such as patents and trademarks, which
were valued (net of accumulated amortization) at $715,958 as of
June 30, 2009, because management believes that its value
is recoverable.
Revenue
Recognition
Revenue from product sales is recognized in accordance with the
SEC Staff Accounting Bulletin No. 104, Revenue
Recognition Product sales represent the majority
of our revenue. We recognize revenue from these product sales
when persuasive evidence of an arrangement exists, delivery has
occurred or services have been provided, the sale price is fixed
or determinable, and collectability is reasonably assured.
Additionally, we sell our products on terms which transfer title
and risk of loss at a specified location, typically shipping
point. Accordingly,
42
revenue recognition from product sales occurs when all factors
are met, including transfer of title and risk of loss, which
typically occurs upon shipment by us. If these conditions are
not met, we will defer the revenue recognition until such time
as these conditions have been satisfied. We collect and remit
sales taxes in certain jurisdictions and report revenue net of
any associated sales taxes. We also sell certain products
through distributors who are granted limited rights of return
for stock balancing against purchases made within a prior
90 day period, including price adjustments downwards on any
existing inventory. The provision for product returns and price
adjustments is assessed for adequacy both at the time of sale
and at each quarter end and is based on recent historical
experience and known customer claims.
Revenue from any engineering consulting and other services is
recognized at the time the services are rendered. For our
longer-term development contracts, which to date have all been
firm, fixed-priced contracts, we recognize revenue on the
percentage-of-completion method. Under this method income is
recognized as work on contracts progresses, but estimated losses
on contracts in progress are charged to operations immediately.
To date, all of our longer-term development contracts have been
less than one calendar year in duration. We generally submit
invoices for our work under these contracts on a monthly basis.
The percentage-of-completion is determined using the
cost-to-cost method.
The accounting estimate related to revenue recognition is
considered a “critical accounting estimate” because
terms of sale can vary, and judgment is exercised in determining
whether to defer revenue recognition. Such judgments may
materially affect net sales for any period. Judgment is
exercised within the parameters of GAAP in determining when
contractual obligations are met, title and risk of loss are
transferred, sales price is fixed or determinable and
collectability is reasonable assured.
Product
Warranty
Warranty obligations are generally incurred in connection with
the sale of our products. The warranty period for these products
is generally one year, but can be 24 months in certain
countries if required by law, such as in Europe. Warranty costs
are accrued, to the extent that they are not recoverable from
third party manufacturers, for the estimated cost to repair or
replace products for the balance of the warranty periods. We
provide for the costs of expected future warranty claims at the
time of product shipment or over-builds to cover replacements.
The adequacy of the provision is assessed at each quarter end
and is based on historical experience of warranty claims and
costs. The costs incurred to provide for these warranty
obligations are estimated and recorded as an accrued liability
at the time of sale. Future warranty costs are estimated based
on historical performance rates and related costs to repair
given products. The accounting estimate related to product
warranty is considered a “critical accounting
estimate” because judgment is exercised in determining
future estimated warranty costs. Should actual performance rates
or repair costs differ from estimates, revision to the estimated
warranty liability would be required.
Stock-Based
Compensation
Our board of directors approves grants of stock options to
employees to purchase our common stock. Under
SFAS No. 123 (revised 2004), Share-Based
Payment, stock compensation expense, is recorded based upon
the estimated fair value of the stock option at the date of
grant. The accounting estimate related to stock-based
compensation is considered a “critical accounting
estimate” because estimates are made in calculating
compensation expense including expected option lives, forfeiture
rates and expected volatility. The fair market value of our
common stock on the date of each option grant was determined
based on the most recent cash sale of common stock in an
arm’s length transaction with an unrelated third party. We
engaged in at least one such transaction during each of our last
four fiscal years. Expected option lives are estimated using
vesting terms and contractual lives. Expected forfeiture rates
and volatility are calculated using historical information.
Actual option lives and forfeiture rates may be different from
estimates and may result in potential future adjustments which
would impact the amount of stock-based compensation expense
recorded in a particular period.
Income
Taxes
We account for income taxes in accordance with
SFAS No. 109, Accounting for Income Taxes.
Accordingly, we provide deferred income tax assets and
liabilities based on the estimated future tax effects of
differences between
43
the financial and tax bases of assets and liabilities based on
currently enacted tax laws. A valuation allowance is established
for deferred tax assets in amounts for which realization is not
considered more likely than not to occur. The accounting
estimate related to income taxes is considered a “critical
accounting estimate” because judgment is exercised in
estimating future taxable income, including prudent and feasible
tax planning strategies, and in assessing the need for any
valuation allowance. To date we have determined a 100% valuation
allowance is required and accordingly no amounts have been
reflected in our consolidated financial statements. In the event
that it should be determined that all or part of a deferred tax
asset in the future is in excess of the nil amount currently
recorded, an adjustment of the valuation allowance would
increase income to be recognized in the period such
determination was made.
In addition, the calculation of our tax liabilities involves
dealing with uncertainties in the application of complex tax
regulations. As a result of the implementation of Interpretation
No. 48, Accounting for Uncertainty in Income Taxes- an
interpretation of FASB Statement No. 109, we recognize
liabilities for uncertain tax positions based on the two-step
process prescribed within the interpretation. The first step is
to evaluate the tax position for recognition by determining if
the weight of available evidence indicates that it is more
likely than not that the position will be sustained on audit,
including resolution of related appeals or litigation processes,
if any. The second step requires us to estimate and measure the
tax benefit as the largest amount that is more than 50% likely
of being realized upon ultimate settlement. It is inherently
difficult and subjective to estimate such amounts, as this
requires us to determine the probability of various possible
outcomes. We re-evaluate these uncertain tax positions on a
quarterly basis. This evaluation is based on factors including,
but not limited to, changes in facts or circumstances, changes
in tax law, effectively settled issues under audit and new audit
activity. Such a change in recognition or measurement would
result in the recognition of a tax benefit or an additional
charge to the tax provision in the period.
Finally, any future recorded value of our deferred tax assets
will be dependent upon our ability to generate future taxable
income in the jurisdictions in which we operate. These assets
consist of research credit carry-forwards, capital and net
operating loss carry-forwards and the future tax effect of
temporary differences between balances recorded for financial
statement purposes and for tax return purposes. It will require
future pre-tax earnings in excess of $13,500,000 in order to
fully realize the value of our unrecorded deferred tax assets.
If we were to sustain future net losses, it may be necessary to
record valuation allowances against such deferred tax assets in
order to recognize impairments in their estimated future
economic value.
Key
Performance Indicators
We believe that a key indicator for our business is the trend
for the volume of orders received from customers, especially
those orders related to night-vision electronic modules. During
weak economic periods, customers’ ability to forecast their
requirements deteriorates causing delays in the placement of
orders. Forward-looking visibility on customer orders is at an
all time low. Our major night-vision electronics modules
customers (Kopin and DRS Technologies, Inc.) are placing orders
for product only when they have orders in hand from their
governmental customer. Total shipments of night vision
electronics module customers in 2008 amounted to $6,068,449,
compared to $1,418,249 in 2007.
Comparison
of Fiscal Years Ended December 31, 2008 and
December 31, 2007
Sales. Our sales were $12,489,884 for the year
ended December 31, 2008 compared to $10,146,379 for the
year ended December 31, 2007. This represents a 23.1%
increase for the year 2008 over the year 2007. Our sales from
defense products increased to $6,397,221 or 51.2% of our total
sales in 2008 versus $1,418,249 or 14.0% of total sales in 2007,
an increase of $4,978,972 or 351.1%. The increase resulted
primarily from new orders of night vision drive electronics from
prime contractors and the introduction of our
Tac-Eye®
display product line in the fourth quarter of 2008. Sales from
our defense-related engineering programs decreased to $1,548,703
or 12.4% of total sales versus $5,445,375 or 53.7% of total
sales in 2007. The large decrease in fiscal 2008 was the result
of the start and completion of a $4,300,000 engineering program
in late 2007. Consumer Video Eyewear product sales increased to
$4,451,121 or 35.64% of total sales for the year ended
December 31, 2008 compared to $3,282,755 for our
2007 year or 32.4% of 2007’s total sales. This 35.6%
sales dollar increase resulted from a broader Video Eyewear
product line and increased distribution in the
United Kingdom and Japan. Low-vision assist sales,
44
consisting mainly of sales of low-vision assist products, were
$92,839 or 0.7% of total sales in fiscal 2008 versus none in
fiscal 2007.
Cost of Sales and Gross Margin. Gross margin
increased to $3,700,979 for fiscal 2008 from $3,362,906 for
fiscal 2007, an increase of $338,073 or 10.1%. As a percentage
of net sales, gross margin decreased to 29.6% for fiscal 2008
compared to 33.1% for fiscal 2007. This reduction was the result
of changes in our revenue mix and related margins. Generally, we
earn a higher gross margin on engineering only programs as
compared to the gross margin on products, in which we incur cost
of goods or volume production costs. Engineering services
revenues decreased to 12.4% as a percentage of total sales in
2008 versus 53.7% of total sales in 2007, resulting in the
majority of the reduction in overall gross margin in 2008 versus
fiscal 2007.
Research and Development. Our research and
development expenses in 2008 increased by $1,001,106, or 42.3%,
to $3,366,518 in fiscal 2008 versus $2,365,412 in 2007. This was
due to increased internal development activities and less direct
support of our research under government funded engineering
programs. Expenses we incur under government funded engineering
programs are included in costs of goods sold.
Selling and Marketing. Selling and marketing
expenses were $2,128,625 for fiscal 2008 as compared to
$1,920,164 for fiscal 2007, an increase of $208,461 or 10.9%.
Despite the increase in absolute dollars, as a percentage of
total sales, the selling and marketing expenses decreased to
17.0% of sales for fiscal 2008 as compared to 18.9% for fiscal
2007. The absolute dollar increase was primarily due to
increased advertising expenses along with increased marketing
support paid out to our expanded consumer products resellers and
the introduction of in-store point of purchase displays with US
resellers.
General and Administrative. General and
administrative expenses were $2,299,685 for fiscal 2008 as
compared to $1,718,627 for fiscal 2007, an increase of $581,058
or 33.8%. The higher general and administrative related to
increases in staff and personnel costs, and increased legal
expenses.
Depreciation and Amortization. Our
depreciation and amortization expense increased by $136,055, or
36.4%, to $510,133 in 2008 versus $374,078 in 2007. The increase
was related to increased depreciation on new capital
expenditures in 2008 and 2007.
Other Income (Expense). Total other expenses,
consisting primarily of interest expense, was $(285,005) in 2008
versus $(142,511) for 2007. The increase in expenses was
primarily attributable to an offsetting legal settlement
received during 2007 in the amount of $96,632.
Provision (Benefit) for Income Taxes. The
provision for income taxes for the year ended December 31,
2008 was $5,212 versus a net benefit of ($98,372) in 2007.
The 2007 net benefit includes our accrual of $130,130 in
New York State tax credits for our research and development
activities. The balance of each year’s tax provision was
primarily for franchise taxes payable to the State of Delaware,
our state of incorporation. These taxes were $5,212 for 2008 and
$31,758 for 2007. This decrease was a result of the
8-for-1
split of our common stock in July 2008.
Net (Loss) and (Loss) per Share. Our net loss
was $(4,894,199) or $(0.0240) per share in 2008, an increased
loss of $(1,834,685), or (60.0)%, from $(3,059,514) or $(0.0176)
per share in 2007.
Comparison
of Fiscal Years Ended December 31, 2007 and
December 31, 2006
Sales. Our sales were $10,146,379 for the year
ended December 31, 2007 compared to $9,538,308 for the year
ended December 31, 2006. This represents a 6.4% increase
for the year 2007 over the year 2006. Our sales from defense
products decreased to $1,418,249 or 14.0% of total sales in 2007
versus $4,888,243 or 51.2% of total sales in 2006, a decrease of
$(3,469,994). The decrease resulted from reduced orders from the
prime defense contractor caused by technical problems in other
areas of their supply chain. Sales from our defense related
engineering programs increased to 53.7% of total sales or
$5,445,375 versus $2,627,442 or 27.5% of total sales in 2006.
This large increase was the result of a new $4,300,000
government research and development program in 2007. Consumer
Video Eyewear product sales increased to $3,282,755 or 32.4% of
total sales for the year ended December 31, 2007 compared
to $2,022,623 or 21.2% of sales for our 2006 fiscal year. This
62.3% increase in dollar sales resulted from the introduction of
three new Video Eyewear models in 2007 and the commencement of
our European sales activities in late 2007.
45
Cost of Sales and Gross Margin. Gross margin
decreased to $3,362,906 for fiscal 2007 from $3,770,758 for
fiscal 2006, a decrease of $(407,852) or (10.8)%. As a
percentage of net sales, gross margin decreased to 33.1% for
fiscal 2007 compared to 39.5% for fiscal 2006. This reduction
was the result of changes in our revenue mix and related
margins. Generally, we earn a higher gross margin on our defense
products as compared to the gross margin on consumer products,
and with the introduction of three new consumer Video Eyewear
products our margins decreased. As defense product sales as a
percentage of our total sales decreased to 14.0% in 2008 versus
51.2% in 2006 our overall margins decreased.
Research and Development. Our research and
development expenses in 2007 increased by $1,086,173 or 84.9%,
to $2,365,412 in fiscal 2007 versus $1,279,239 in 2006. This was
due to increases in the number of our research and development
personnel and the lease of additional space dedicated to this
function.
Selling and Marketing. Selling and marketing
expenses were $1,920,164 for fiscal 2007 as compared to
$1,191,800 for fiscal 2006, an increase of $728,364 or 61.1%.
The increase resulted from the preparatory marketing and
advertising launch expenses by three new consumer Video Eyewear
products, the establishment of our first print advertising
programs and increased trade show costs to promote our new Video
Eyewear products.
General and Administrative. General and
administrative expenses were $1,718,627 for fiscal 2007 as
compared to $1,560,278 for fiscal 2006, an increase of $158,349
or 10.1%. The increase was mainly attributable to increased
staffing and legal expenses.
Depreciation and Amortization. Our
depreciation and amortization expense increased by $97,089, or
35.1%, to $374,078 in 2007 versus $276,989 in 2006. The increase
was related to increased depreciation provisions on new capital
expenditures in 2007 and full year’s provision on our 2006
additions.
Other Income (Expense). Total other expenses,
consisting primarily of interest expense, was $(142,511) in 2007
versus $(178,706) in 2006. Our borrowing costs were $62,673
higher in 2007 than in 2006 but our 2007 borrowing costs were
offset by $96,632 in miscellaneous income related to the
settlement of a legal dispute.
Provision (Benefit) for Income Taxes. The
provision for income taxes for the year ended December 31,
2007 was a net benefit of $(98,372) versus an expense of $3,700
for 2006. The 2007 benefit includes our accrual of $130,130 in
New York State tax credits for our research and development
activities. The balance of each year’s tax provision was
primarily attributable to franchise taxes payable to the State
of Delaware, our state of incorporation. These taxes were
$31,758 for 2007 and $3,700 for 2006. The large increase was a
direct result of the
7-for-1
reverse stock split that took place in 2007.
Net (Loss) and (Loss) per Share. Our net loss
was $(3,059,514) or $(0.0176) per share in 2007, an increase of
$(2,339,560) from $(719,954) or $(0.0047) per share in 2006.
Comparison
of Three Months Ended June 30, 2009 and June 30,
2008
Sales. Our sales were $2,063,733 for the three
months ended June 30, 2009 compared to $3,087,338 for the
three months ended June 30, 2008. This represents a (33.2%)
decrease for the 2009 period over the comparable 2008 period.
Our sales from defense production programs decreased to
$1,179,146 or 57.1% of total sales for the 2009 period from
$2,442,817 or 79.1% of sales in the comparable 2008 period, a
decrease of $(1,263,672) or (51.7%). The decrease resulted
directly from our early completion during the three months ended
March 31, 2009 of a large order and fewer resulting follow on
sales versus the prior year when a production order spanned most
of the same second quarterly period. These orders are normally
completed in 90 to 120 days once deliveries commence, so any
given calendar quarter can contain anywhere from zero to three
months of shipments resulting in substantial revenue variations.
Sales from our defense related engineering services programs
decreased slightly to $116,865 or 5.7% of sales for the 2009
period versus $127,006 or 4.1% of total sales in the comparable
2008 period. Engineering services were slower in 2009 as we were
still in transition between new major programs. Consumer Video
Eyewear product sales increased to $764,629 or 37.1% of total
sales for the three months ended June 30, 2009 compared to
$516,214 or 16.7% of total sales for the same period in 2008.
This 48.1% increase in revenues was primarily due to our
increased sales of Video Eyewear products in Europe and Japan as
compared to 2008. Low-vision assist sales for the three months
ended June 30, 2009 were $3,094 versus $1,301 in the prior
year’s period and were in both periods less than 0.1% of
revenues.
46
Cost of Sales and Gross Margin. Gross margin
decreased to $672,914 for the three-months ended June 30,
2009 from $1,215,677 for three months ended June 30, 2008,
a decrease of $(542,763) or (44.6%). As a percentage of net
sales, gross margin decreased to 32.6% for 2009 period compared
to 39.4% for the comparable 2008 period. Gross margins for the
2008 period were higher than for the similar period in 2009 due
to increased margins earned on defense product sales which were
79.1% of sales and only 57.1% in the 2009 period. This change in
our revenue mix and their related lower gross margins on
Consumer Video Eyewear resulted in the decrease in the 2009
margin as we generally earn a higher gross margin on engineering
services and our defense product sales as compared to the gross
margin on products.
Research and Development. Our research and
development expenses in the three months ended June 30,
2009 were $428,737 versus $1,224,265 in the comparable 2008
period, a decrease of $(795,528) or (65.0)%. This decrease was
due to lower staffing levels and a decreased use of external
contractors for development work versus 2008.
Selling and Marketing. Selling and marketing
expenses were $520,257 for the three months ended June 30, 2009
as compared to $483,695 for the comparable 2008 period, an
increase of just $36,562. As a percentage of total sales, the
selling and marketing expenses increased to 25.1% of sales for
the three month period in 2009 as compared to 15.5% for same
period in fiscal 2008 which is reflective of our previously
mentioned change in revenue mix and decreased total sales
between the comparable quarters. Consumer Video Eyewear sales
require higher sales and marketing expenses over defense product
sales consisting primarily of night vision display electronics.
General and Administrative. General and
administrative expenses were $534,142 for the three months ended
June 30, 2009 as compared to $438,831 for the comparable
2008 period, an increase of $95,311 or 21.7%. The higher general
and administrative expenses are attributable to increases in
accounting fees related to our commencement of external
accountant reviews of our quarterly results and increased wage
costs as compared to same quarterly period in 2008.
Depreciation and Amortization. Our
depreciation and amortization expense increased by $43,813, or
35.4%, to $167,509 in the three months ended June 30, 2009
versus $123,696 in the comparable 2008 period. The increase is
attributable to increased depreciation provisions on new capital
expenditures and patent investments made in fiscal 2008.
Other Income (Expense). Interest expense, net
of interest income and foreign exchange adjustments, was
$(60,357) in the three months ended June 30, 2009 versus
$(57,653) for the comparable 2008 period. The increase
represents increased borrowings and higher interest rates on a
note payable.
Provision (Benefit) for Income Taxes. The
provision for income taxes was for franchise taxes to Delaware,
our state of incorporation. Such income taxes for the three
months ended June 30, 2009 were $888 and $2,897 for the
comparable 2008 period.
Net (Loss) and (Loss) per Share. Our net loss
was $(1,038,976) (or $(0.0048) per share) in the three months
ended June 30, 2009, a decrease from an overall loss of
$(1,115,360) or $(0.0057) per share for the same quarter in 2008.
Comparison
of Six Months Ended June 30, 2009 and June 30,
2008
Sales. Our sales were $5,082,087 for the six
months ended June 30, 2009 compared to $4,807,982 for the six
months ended June 30, 2008. This represents a 5.7% increase
for the 2009 period over the comparable 2008 period. Our sales
from defense production programs were $2,633,300 or 51.8% of
total sales for the 2009 period versus $3,300,428 and 68.6% of
total sales in the comparable 2008 period, a decrease of
$(667,128). As a percentage of total revenues this category of
product sales was 51.8% of sales for the first six months of
2009 versus 68.6% of sales for the same period in 2008. The
decrease resulted directly from decreased orders for our night
vision display drive electronics customer due to timing issues,
which as explained previously can vary significantly from
quarter to quarter. Offsetting this reduction was a continued
strengthening of our Tac-Eye product line, which had minimal
sales in the comparable 2008 period. Sales from our defense
related engineering service programs increased to $565,355 or
11.1% of total sales for the 2009 period versus $317,994 in the
comparable 2008 period. The majority of this $247,361 increase
occurred in the first quarter of 2009 over the same period in
2008. Overall engineering
47
program revenues rose to 11.1% of total sales as compared to
6.6% in the first six months of 2008. Consumer Video Eyewear
product sales increased to $1,865,815 or 36.7% of total sales
for the six months ended June 30, 2009 as compared to $1,182,859
or 24.6% of total sales for the same period in 2008. This 57.7%
increase was entirely due to increased sales in Europe and Japan
as compared to the same period in 2008. Low-vision assist sales
for the six months ended June 30, 2009 were $17,617 versus
just $6,701 for the same period in 2008, both less than 0.3% of
our overall revenues in each year’s period.
Cost of Sales and Gross Margin. Gross margin
increased to $1,860,226 for the six-month ended June 30, 2009
from $1,449,243 for six months ended June 30, 2008, an
increase of $410,983 or 28.4%. As a percentage of total net
sales, overall gross margin increased to 36.6% for 2009 period
compared to 30.1% for the comparable 2008 period. Gross margins
for the 2008 period were lower than for the similar period in
2009 due to product clearance activities, when an older product
model was being phased out and larger reseller discounts were
being offered to assist its sales. Additionally, our cost
reductions improved margins for the 2009 period.
Research and Development. Our research and
development expenses in the six months ended June 30, 2009
were $945,897 versus $1,960,982 in the comparable 2008 period, a
decrease of $(1,015,085) or (51.8%). This was due to staff
reductions made in late 2008 and a decreased use of external
contractors in the 2009 period versus 2008.
Selling and Marketing. Selling and marketing
expenses were $976,041 for the six months ended June 30,
2009 as compared to $933,257 for the comparable 2008 period, an
increase of $42,784. As a percentage of total sales, the selling
and marketing expenses decreased slightly to 19.2% of sales for
the six month period in 2009 as compared to 19.4% for same
period in fiscal 2008.
General and Administrative. General and
administrative expenses were $990,729 for the six months ended
June 30, 2009 as compared to $972,630 for the comparable
2008 period, an increase of $18,099 or 1.9%. The higher expenses
are attributable to increased accounting and audit services
involved in our changeover of audit firms, external accountant
reviews of our quarterly results and higher wage costs against
the same period in 2008.
Depreciation and Amortization. Our
depreciation and amortization expense increased by $58,951, or
23.8%, to $306,343 in the six months ended June 30, 2009
versus $247,392 in the comparable 2008 period.
Other Income (Expense). Interest expense, net
of interest income and foreign exchange adjustments, was
$(127,005) in the six months ended June 30, 2009 versus
$(98,886) for the comparable 2008 period. The increase
represents increased borrowings and higher interest rates on a
note payable.
Provision (Benefit) for Income Taxes. The
provision for income taxes was for franchise taxes to Delaware,
our state of incorporation. Such income taxes for the six months
ended June 30, 2009 were $1,776 and $3,650 for the
comparable 2008 period.
Net (Loss) and (Loss) per Share. Our net loss
was $(1,487,565) (or $(0.0070) per share) in the six months
ended June 30, 2009, an improvement of $1,279,988, or
46.2%, from the larger loss of $(2,767,554) or $(0.0141) per
share in the comparable 2008 period.
Liquidity
and Capital Resources
As of June 30, 2009, we had cash and cash equivalents of
$285,126, a decrease of $533,593 from $818,719 as of
December 31, 2008.
Our cash requirements are primarily for research and
development, product tooling, and working capital. Historically,
we have met these requirements through capital generated from
the sale and issuance of our common equity securities,
convertible debt and notes payable to private investors, cash
flow provided by operations and our revolving bank lines of
credit.
Operating Activities. Cash (used in) operating
activities was $(1,285,449) in fiscal 2008 and $(3,295,900) in
fiscal 2007. Changes in operating assets and liabilities,
excluding cash, provided (used) cash were $2,785,425 in fiscal
2008 and $(800,177) in fiscal 2007. The decreases in our
accounts receivable by December 31, 2008 of $1,494,613
along with a $733,691 increase in accounts payable and customer
deposits of $683,040 primarily resulted in this cash flow
improvement in 2008 over 2007. Our reduced accounts receivable
year over year was due to the completion of a
48
defense product production program in December 2008,
whereas in 2007 a similar program was in mid-stream at
December 31, 2007 along with the larger receivables from
the final deliveries and billings on a large 2007 engineering
program, including the programs holdback. To accelerate our cash
collections we offer early payment allowances to certain
customers on our defense production programs. Those early
payment discounts offer a 2% discount off the original invoice
amount for payment within 7 days. As our normal payment
terms average 35 days on this program, the customer’s
taking of these discounts, reduced their average accounts
receivable balance to us by approximately $800,000 in the middle
of this program. Our 2008 discount expense related to this
program was approximately $75,000 in 2008 and $14,000 in 2007.
We intend to continue to offer early payment discounts as long
as we continue to operate with a working capital deficit. Cash
(used in) operating activities was $(476,637) and $(107,925) for
the six-month periods ended June 30, 2009 and 2008,
respectively. Changes in operating assets and liabilities,
excluding cash, provided cash were $614,521 and $2,322,088 for
the six-month periods ended June 30, 2009 and 2008,
respectively. In both these periods, the reductions in accounts
receivable from the seasonally higher
December 31st
balances were the major providers of cash. The 2009
period’s reduction versus the same period in 2008 resulted
mainly from a $(1,089,159) decrease in accounts payable since
December 31, 2008, a direct result of the normal seasonal
slow-down in parts of our business. Offsetting this decrease was
an increase in customer deposits of $451,399 over those as at
December 31, 2008 attributable to the advance component
purchasing requirements for a large order for special night
vision electronics that commenced production in September 2009.
We normally request an advance from customers placing large
orders for special goods. If in the future we are unable to
obtain such advance deposits, our liquidity and ability to
support large orders would decrease.
Investing Activities. Cash used in investing
activities was $549,804 in fiscal 2008 and $316,743 in fiscal
2007 and $148,777 and $259,193 for the six-month periods ended
June 30, 2009 and 2008, respectively. Cash used for
investing activities in fiscal 2008 related primarily to
production tooling and computer software equipment additions of
$424,166 and in the six-month period ended June 30, 2009
related primarily to tooling acquisitions of $81,837 versus
$193,126 for the same 6 month period in 2008. The costs of
registering our intellectual property rights, included in the
investing activities totals described above were $125,638 in
fiscal 2008 and $136,433 in fiscal 2007 and $66,940 and $66,067
for the six-month periods ended June 30, 2009 and 2008,
respectively.
Financing Activities. Cash provided by
financing activities was $2,289,116 in fiscal 2008 and
$3,408,328 in fiscal 2007 and $91,820 and $106,255 for the
six-month periods ended June 30, 2009 and 2008,
respectively. We sold shares of our common stock for aggregate
gross proceeds of $2,138,646 in 2008 and $3,792,362 in 2007 and
$300,000 in the six-month period ended June 30, 2009 in
private placements offerings. In the six-month period ended
June 30, 2008 we sold shares of our common stock for
aggregate gross proceeds of $16,697 upon exercise of stock
options and received $13,586 from the exercise of warrants.
Capital Resources. As of December 31,
2008, we had a cash balance of $818,719. As of June 30,
2009, we had a cash balance of $285,126. We had $123,952
available under our bank lines of credit (total drawings as of
June 30, 2009 were $88,548). The credit lines are with two
banks, are payable on demand and secured by the personal
guarantee of our President and Chief Executive Officer, Paul J.
Travers. The bank credit agreements contain various restrictions
on indebtedness, liens, guarantees, redemptions, mergers,
acquisitions or sale of assets, loans, transactions with any
affiliates, and investments. They also prohibit us from
declaring and paying cash dividends without the bank’s
prior consent.
On September 19, 2006, we borrowed $500,000 from an
individual lender and issued a convertible promissory note in
the principal amount of $500,000 in evidence of the loan.
Interest on the outstanding principal amount of the note accrues
at the annual rate of 10.0%. The outstanding principal amount of
the note, together with all accrued and unpaid interest thereon,
is convertible at the option of the holder into shares of our
common stock at the rate of $0.2333 per share. The outstanding
principal amount of the note together with all unpaid accrued
interest thereon was due and payable on January 31, 2009.
As of January 31, 2009, the interest accrued and unpaid on
the note was $118,493. Since January 31, 2009 interest on the
principal amount of the note has accrued at the annual rate of
18.0% and we have made monthly payments of interest only. As of
the date of this prospectus, no demand for immediate payment of
the principal amount of the note has been made. Such a demand
would have a negative impact on our liquidity and ongoing
operations. As the conversion price of the note is greater than
our expected maximum offering price, we intend to pay the
outstanding principal amount of the note in full, together with
all interest accrued and unpaid thereon, from the proceeds of
this offering.
49
In August and September 2009, we borrowed an aggregate amount of
$200,000 from three individual lenders, including $50,000 from
Mr. Paul Churnetski, our Vice President of Quality Assurance and
the beneficial owner of approximately 9% of our issued and
outstanding common stock. These loans bear interest at an annual
rate of 18.0% and they were due and payable on October 31,
2009. We borrowed these funds to finance part of our working
capital investment for a defense order in process. We are
negotiating to borrow an additional $200,000 from one or more
individual lenders on the same terms and conditions. We intend
to repay all these loans from revenues from the receivables
collections from that order or out of the proceeds from this
offering if the closing occurs prior to the maturity date.
Our cash requirements depend on numerous factors, including new
product development activities, our ability to commercialize our
products, their timely market acceptance, selling prices and
gross margins, and other factors. We expect to carefully devote
capital resources to continue our development programs, hire and
train additional staff, expand our research and development
activities, new product marketing and increased inventory
levels. Assuming we are able to continue to increase our sales
and maintain our planned gross margins, we anticipate that we
will also experience growth in our operating expenses for the
foreseeable future. Our future net operating losses, product
tooling expenses, and related working capital investments will
be the principal use of our cash. In particular, we expect that
potentially significant amounts of working capital investments
in accounts receivable and inventories that are not offset by
corresponding increases in accounts payable will use cash with
our planned growth.
In June 2009, when preparing our financial statements for the
year ended December 31, 2008, we determined that there was
no substantial uncertainty regarding our ability to continue as
a going concern through December 31, 2009 notwithstanding
our history of operating at a loss, our reliance on extensions
of credit from three of our major suppliers and our ongoing
default under the $500,000 convertible promissory note due on
January 31, 2009 as described above. At that time we made
that determination, we had almost six months of (unaudited)
operating results for fiscal 2009 to take into consideration.
Our results of operations (unaudited) for the six months ended
June 30, 2009 were gross profit of $1,860,226 on net
revenues of $5,082,087 and net income before tax of
$(1,487,565). Our operating budget for the six months ended
June 30, 2009 forecast gross profit of $2,251,320 on net
revenues of $6,460,869 and net income before tax of $(747,785).
After adding back depreciation to our losses for the six months
ended June 30, 2009, our cash flow for the six months ended
June 30, 2009 was $(1,091,157) versus $(2,430,013) for the
same period in 2008 or a $1,338,856 improvement. Our budgeted
operating cash flow for the six months ended June 30, 2009
was $(459,488). Our improved results of operations for the six
months ended June 30, 2009 were largely attributable to the
cost reduction program we implemented in November 2008. Under
that program we reduced our work force by 20% and reduced costs
in most areas of the company, including slightly greater
reductions in research and development and smaller reductions in
revenue-generating areas such as sales and marketing. We also
reduced our use of external consultants for development work. As
a result, we achieved a 32% reduction in research and
development expenses and a 10% reduction in general and
administrative expense in the first quarter of 2009 compared to
the first quarter of 2008. We believed that we would be able to
maintain these savings throughout 2009 and estimated that they
would result in an aggregate reduction in expenses of $1,500,000
for 2009 as compared to 2008, without adversely affecting our
sales.
Our improved results of operations for the six months ended
June 30, 2009 were also attributable to increased revenues.
Our sales were $5,082,087 for the six months ended June 30,
2009 compared to $4,807,982 for the six months ended
June 30, 2008. This represented a 5.7% increase for the
2009 period over the comparable 2008 period. Our increased sales
were primarily attributable to increased orders for defense
products from our night vision display drive electronics
customer and increased distribution of our consumer Video
Eyewear products in the United Kingdom and Japan. We believed
these increases would continue through 2009, due in part to the
fact that our business is seasonal, with our greatest revenues
occurring during the third and fourth quarters, and that it was
therefore reasonable to expect further increases in sales for
the third and fourth quarters of 2009. Accordingly we then
believed that we were on target to achieve positive cash flow
from operations in the three months ending December 31,
2009 as we planned in our operating budget for 2009.
Our operating budget for 2009 assumed that our major suppliers
would continue to extend credit to us consistently with their
past practice and that the holder of the $500,000 convertible
promissory note due on January 31, 2009 under which we were
in default would not demand immediate payment of the note. When
preparing our financial statements for the 2008 fiscal year, we
considered each of those assumptions and determined
50
that they were still reasonable. The major suppliers on which
we have relied for extensions of credit are either stockholders
or wholly-owned by one of our stockholders. One of those
suppliers, Kopin Corporation, is a publicly traded company and
files reports with the SEC. Accordingly, in June 2009 we were
able to review its financial condition and determined that Kopin
would be able to continue to extend credit to us in manner
consistent with its past practice. We also believed that Kopin
would continue to take advantage of our early payment discounts
as they have done in the past. The other two suppliers on which
we have relied for extensions of credit are private companies
and we had no direct access to information regarding their
financial condition. However, our management has longstanding
relationships with the individuals who own those suppliers.
Based on conversations with those individuals and our course of
dealing with those companies, we concluded that they would be
willing and able to continue to extend credit to us in manner
consistent with their past practice. As of June 2009, all three
of these suppliers had continued to extend credit to us
consistently with their past practice.
The $500,000 convertible promissory note due on January 31,
2009 is payable to Sally Hyde Burdick Prior to the maturity of
the note, we approached Ms. Burdick to negotiate an
extension of the maturity of the note. Although the note was not
formally extended, Ms Burdick orally agreed not to demand
immediate repayment of the note, provided that we make monthly
interest payments on the principal amount of the note at the
annual rate of 18%, to which we agreed. As of June 2009, we had
made the required monthly interest payments for four consecutive
months and we believed that we would continue to be able to make
these interest payments for the foreseeable future from our
budgeted cash flows from operations. Based upon our long
relationship with Ms. Burdick and her statements regarding
her personal financial position, we believed Ms. Burdick
was unlikely to demand payment so long as she was receiving the
return that we had agreed upon.
We also believed that if Ms. Burdick demanded payment of
the note, or if we required additional capital for any other
reason, our management would be able to raise the funds
necessary either from their personal resources or those of other
stockholders who had provided financial resources to us in the
past. Since December 2000, we have raised $11,858,000 in equity
and debt financing through private placements. We have also
borrowed an additional $1,626,000 (in addition to the loan from
Ms. Burdick), of which $650,000 was borrowed from current
management and stockholders. Our Chief Executive Officer and
Chief Financial Officer loaned us an aggregate of $209,208 more
than five years ago; in October 2008, our Chief Executive
Officer loaned us an additional $215,500 under a revolving loan
agreement; in August 2009, we borrowed $200,000 from three
stockholders (including $50,000 from our Vice President of
Quality Assurance, the beneficial owner of approximately 9% of
our issued and outstanding common stock). Based on our knowledge
of the financial resources of our management and these
stockholders, we concluded that, if necessary, they would be
able to continue to loan money to us to finance our operations
in a manner consistent with their past practice.
We anticipate, based on our internal forecast and assumptions
relating to our operations (including, among others, assumptions
regarding our working capital requirements, the progress of our
research and development efforts and Video Eyewear product sales
and gross margins) that, taking into account the minimum
anticipated proceeds of the sale of our securities pursuant to
this prospectus, we will have sufficient cash to meet our
working capital and other cash flow requirements for at least
the next 12 months. In the event we do not close this
offering in the near future, we will have to make adjustments in
our operating plans and scale back on new product development as
our net operating activities still are consuming cash. Many of
our proposed new products would be placed on hold and staff
reductions across the company would be required. In parallel
with such spending reductions, management would begin an active
search for private sources of financing, including debt and
equity offerings to reduce our working capital deficiency. If
we were unsuccessful in obtaining alternative financing by
December 31, 2009, management would have to reassess its
operating plans for fiscal 2010.
The recent global economic crisis has caused disruptions and
extreme volatility in global financial markets, increased rates
of default and bankruptcy, and has impacted consumer spending
levels. These macroeconomic developments could adversely affect
our business, operating results or financial condition. Current
or potential customers, including suppliers to the US
government, may delay or decrease spending on our products and
services as their business
and/or
budgets are impacted by economic conditions. The inability of
current
and/or
potential customers to pay us for our products and services may
adversely affect our earnings and cash flows.
51
Current
Financial Position
As of September 30, 2009 we had approximately $181,197 in
cash and cash equivalents and we had $28,210 in available bank
credit lines. In August and September 2009 we borrowed an
aggregate amount of $200,000 from three individual lenders,
including $50,000 from Mr. Paul Churnetski, our Vice
President of Quality Assurance and the beneficial owner of
approximately 9% of our issued and outstanding common stock.
These loans bear interest at an annual rate of 18.0% and were
due and payable on October 31, 2009. We borrowed these funds to
finance part of our working capital investment for a defense
order in process. We are negotiating to borrow an additional
$200,000 from one or more individual lenders, on the same terms
and conditions. As of the date of this prospectus none of the
lenders has demanded payment of these loans. We intend to repay
all these loans from revenues from the receivables collections
from that order or out of the proceeds from this offering if the
closing occurs prior to the maturity date.
We had a working capital deficit of $2,808,676 as of
June 30, 2009 and this deficit will increase by a further
amount since that date due to our expected operating losses in
our third quarter of fiscal 2009. Our operating budget for the
nine months ended September 30, 2009 provided for gross
profit of $3,023,035 on net revenues of $8,983,253 and net
income before tax of $(1,787,865). Our estimated actual results
of operations (unaudited) for the nine months ended
September 30, 2009 were gross profit of approximately
$2,892,000 on net revenues of approximately $7,691,000 and net
loss before tax of approximately $(1,785,000). Through
September 30, 2009 and to date, our major suppliers have
continued to extend credit to us consistently with their past
practice and the holder of the $500,000 convertible promissory
note due on January 31, 2009 under which we are in default
has not demand immediate payment of the note. Our ability to
continue as a going concern depends on those suppliers
continuing to extend credit to us consistently with their past
practice and the holder of that promissory note continuing not
to demand immediate payment of the note. We regularly consider
the reasonableness of our assumption that they will continue to
do so. We intend to pay the outstanding principal amount of the
note in full, together with all interest accrued and unpaid
thereon, from the proceeds of this offering. In the event the
note holder or a major trade supplier demanded repayment of
their overdue accounts payable before the closing of this
offering, management would be forced to look immediately for
other sources of financing. We have no commitment for any such
financing, and such financing may not be available to us on
acceptable terms or on any terms. If we cannot obtain such when
necessary, our management would have to consider restructuring
the company, reducing our operations and/or the sale of a
portion or all of the company’s assets. Accordingly,
without the successful closing of this offering our future as an
operating entity would be jeopardy.
In May 2009, we were awarded a contract to deliver our
Tac-Eye
LT®
display system to the Air Force’s Battlefield Airman
Program. The system has been developed over the last five years
with support from various US military commands including the Air
Force Research Laboratory, Natick Soldier Center and US Special
Operations Command (USSOCOM). If the Air Force exercises all of
its options under the contract, our revenues under the contract
could equal $2,000,000 over the next 19 months.
In October 2008, we received approval of a $640,000 government
engineering program. We anticipate that the contract relating to
this award will be executed and our work on the program will
commence in fall 2009. We expect the program to be completed in
nine months.
As of September 30, 2009 we had approximately $1,287,000 in
purchase orders for our defense-related products and night
vision drive electronics. Those purchase orders are generally
non-cancelable. Backorders for our consumer Video Eyewear
products as of September 30, 2009 were $197,000, which is
normal for this time of the year for our consumer product sales
along with customer anticipation regarding are fall new product
releases. We had orders totaling $334,000 for our Tac-Eye Video
Eyewear products as of September 30, 2009. We have an
engineering program in progress with eventual gross billings of
$336,000 which is expected to be completed by November 2009.
Since June 30, 2009, our inventory and accounts payable
have not changed materially but we expect them to increase
during the remainder of 2009 as a result of the seasonal ramp-up
for our consumer products, subject to the continued extended
support of our suppliers.
We believe that if we succeed in raising the minimum gross
proceeds from this offering, we will achieve additional growth
in sales of our consumer Video Eyewear products and that our
defense products should contribute to revenue growth for the
remainder of 2009 and beyond. Subject to the closing of this
offering, we also anticipate that we will continue to experience
increases in our sales and marketing, and general operating
expenses throughout the remainder of 2009 and in 2010 but that
they should not grow as a percentage of overall sales.
52
BUSINESS
Company
Overview
We are engaged in the design, manufacture, marketing and sale of
devices that are worn like eyeglasses and feature built-in video
screens that enable the user to view video and digital content,
such as movies, computer data, the Internet or video games. Our
products (known commercially as Video Eyewear but also commonly
referred to as virtual displays, wearable displays, personal
viewers, head mounted displays, or near-to-eye displays) are
used to view high-resolution video and digital information from
mobile electronic devices, such as cell phones, portable media
players, gaming systems and laptop computers. Our products
provide the user with a viewing experience that simulates
viewing a large screen television or a desktop computer monitor
that can be viewed practically anywhere, anytime.
Our Video Eyewear products feature high performance miniature
display modules, low power electronics and related optical
systems. We produce both monocular and binocular Video Eyewear
devices that we believe are excellent solutions for uses
including many mobile computer, mobile internet devices
(MID) or video viewing requirements, including general
entertainment applications. We focus on two markets: the
consumer markets for gaming and mobile video and rugged mobile
displays for defense and industrial applications. We also offer
low-vision assist Video Eyewear products that are designed to
assist and improve the remaining vision of many people suffering
from macular degeneration.
Owners of mobile display devices increasingly want to use them
to view high-resolution, full color content. The displays
currently used in these mobile devices do not work well for this
purpose because they are either too small, which makes it
extremely difficult for the human eye to view the detail of the
images that they display, or they are too large, making the
device heavier, larger and difficult to carry. Recently, some
mobile devices, like the iPhone, have employed a touch screen
with software capable of magnifying or zooming in on a small
portion of the image. We believe that many consumers consider
this solution unsatisfactory because it is not like their
desktop computer viewing experience and they find it difficult
to navigate touch screens and to find information on the portion
of the image being viewed.
In contrast, our Video Eyewear products enable users of many
mobile devices to effectively view the entire screen on a small,
eyeglass-like device. They can be used as a wearable replacement
for any television or desktop computer monitor in almost any
environment. Our products employ microdisplays that are smaller
than one-inch diagonally, with some as small as one-quarter of
an inch. They can display an entire, detailed image with
resolution of up to 1280×720 pixels (High Definition or
HD). The images on the microdisplay are viewed through
proprietary magnifying optics that are usually designed by us
and incorporated into our Video Eyewear products. Using these
optics and displays, our Video Eyewear products provide a
virtual image that appears to be similar to the image on a full
size computer screen from a normal desktop working distance or
the image on a large flat panel television from normal home TV
viewing distance. For example, when magnified through our
optics, a high-resolution 0.44-inch diagonal microdisplay can
provide a viewing experience comparable to that on a
62-inch
diagonal television screen viewed at nine feet.
Overall
Strategy
Our goal is to establish and maintain a leadership position as a
worldwide supplier of Video Eyewear and virtual imaging
technology solutions. We intend to offer our technologies across
major markets, platforms and applications. We will strive to be
an innovator in designing virtual display devices that enable
new mobile video viewing and general entertainment applications.
To maintain and enhance our position as a leading provider of
virtual display solutions, we intend to:
|
|
|
| |
•
|
improve brand name recognition;
|
| |
| |
•
|
provide excellent products and service;
|
| |
| |
•
|
develop products for large markets;
|
| |
| |
•
|
broaden and develop strategic relationships and partnerships;
|
53
|
|
|
| |
•
|
promote and enhance development of third party software that can
take advantage of our products;
|
| |
| |
•
|
expand market awareness for Video Eyewear, including use for
Virtual Reality and Augmented Reality;
|
| |
| |
•
|
obtain and maintain market leadership and expand customer base;
|
| |
| |
•
|
maintain and exploit cost advantage;
|
| |
| |
•
|
extend our proprietary technology leadership;
|
| |
| |
•
|
enhance and protect our intellectual property portfolio;
|
| |
| |
•
|
establish multiple revenue sources;
|
| |
| |
•
|
continue to invest in highly qualified personnel;
|
| |
| |
•
|
build and maintain strong design capabilities; and
|
| |
| |
•
|
leverage our outsourcing model.
|
The
Market
We believe that there is growing demand for mobile access to
high-resolution content in several major markets. Our business
focuses on the consumer mobile entertainment and gaming markets
and the industrial and defense markets. The demand for personal
displays in these markets is being driven by such factors as:
|
|
|
| |
•
|
Increasing use of the Internet in all aspects of society and
business, which is increasing demand for Internet access
“anywhere, anytime”.
|
| |
| |
•
|
Low cost wireless networks, with significantly increased
bandwidths and improved compression of digital media, continue
to evolve. They now allow users to view television or access the
Internet on mobile devices. However, the relatively lower
resolution and larger size of the displays currently used in
these mobile devices do not allow the users to take full
advantage of the high-resolution content available to them. We
believe that our Video Eyewear products are well suited for this
purpose.
|
| |
| |
•
|
Increased spending by consumers on mobile entertainment devices
such as iPods and cellular telephones. We expect that
full-featured, cellular handsets with video capabilities will
become more widely available and that a single handset will
replace today’s separate telephone, PDA, digital camera,
handheld game player and MP3 music player. Our Video Eyewear
products can provide viewable high-resolution mobile displays
for users of these merged devices, with better viewing
capability and higher detailed resolution than the small screens
on existing mobile devices.
|
| |
| |
•
|
Industrial, defense and security sectors are employing mobile
communications, sensors and surveillance devices that are light,
durable and easy to use but require displaying their
high-resolution content on an external device and often in a
hands-free way. Our wearable Video Eyewear products can be ideal
for this and will allow a user their physical mobility.
|
| |
| |
•
|
Video gaming on PCs and consoles continues to grow in North
America and around the world. We believe that our Virtual
Display technologies will significantly increase user
satisfaction with gaming applications by engaging the user
through the use of stereoscopic imagery and interactive head
tracking. Our Virtual Reality and Augmented Reality Video
Eyewear are designed to provide this capability.
|
| |
| |
•
|
The widening distribution of new three dimensional (3D) movies
and other 3D content in North America is creating a need for a
method to play this content outside movie theaters. We believe
that Video Eyewear, with its inherent dual display design, is
well suited for the playback of 3D content. Stereoscopic 3D
video playback on Video Eyewear also avoids many of the negative
issues commonly encountered by shutter, polarized or color
anaglyph glasses used in competing technologies and allows the
user to view 3D content without purchasing new computer or
television equipment.
|
| |
| |
•
|
People with low-vision problems require devices to magnify and
capture images that they wish to see and to display them in a
manner that they can view with their remaining vision. Our Video
Eyewear, with the
|
54
|
|
|
| |
|
addition of a camera and digital signal processing in a single
device, can provide this capability to many people suffering
from certain types of vision problems.
|
Target
Markets
Our target markets and applications by major sector are:
Consumer
Entertainment and Internet. We believe
that there is an increasing demand for convenient,
high-resolution, 3D displays to view content such as movies,
entertainment and the Internet in a mobile environment.
Gaming. We believe that there is a need
for high-resolution, interactive, stereoscopic 3D display
devices for use with desktop computers, consoles and other
gaming products. We believe that gaming on modern mobile devices
with small, direct view screen is not a satisfactory experience
for many consumers. Our Video Eyewear products are designed to
significantly enhance a consumer’s experience by providing
larger, high-resolution images with stereoscopic 3D
capabilities. We believe that there is also a demand for display
devices that enable the user to simulate and experience movement
within a three-dimensional environment when using either gaming
consoles or mobile devices. We anticipate that Virtual Reality
(VR) (which allows a user to interact with a computer-simulated
environment, whether that environment is a simulation of the
real world or an imaginary world) and Augmented Reality (AR)
(which combines real-world and computer-generated data in real
time) will become increasingly popular entertainment
applications. Both VR and AR are difficult to implement using
traditional desktop computer monitors and televisions.
Industrial
and Defense
The US government requires display devices for mobile and
hands-free viewing of computer and mapping information, remote
viewing of sensor data, and remote viewing of transmissions from
targeting systems. These applications currently include:
|
|
|
| |
•
|
Night vision and thermal sighting systems;
|
| |
| |
•
|
Unmanned vehicle and robotic systems; and
|
| |
| |
•
|
Training and simulation systems, including AR Video Eyewear.
|
These systems typically are required to provide detailed,
high-resolution images, with limited power consumption and low
external light emission, and to be durable.
Our Video Eyewear products are also used for a number of
industrial applications, including as remote camera displays and
wearable computer displays, for viewing of industrial thermal
signature systems and for providing hands-free access to manuals
and other required information in remote and in-field
maintenance servicing.
Low-vision
Assist
We believe that our Video Eyewear products may provide solutions
for patients suffering from certain types of visual handicaps.
Our low-vision assist products are designed to assist patients
suffering from macular degeneration by signal processing and
re-focusing an integrated camera image into the areas of the
retina that are not affected by the patient’s macular
degeneration.
In the United States, macular degeneration in older people is
the leading cause of loss of sight. As an indication of the size
of the low-vision assist market, according to US National Eye
Institute, there are currently over 1,800,000 Americans
suffering from some form of degenerative low-vision disease with
an additional 200,000 being diagnosed annually.
55
Products
We believe we provide the broadest range of consumer Video
Eyewear product offerings available in the market and that our
products contain the most advanced electronics and optics for
their target markets and uses. Our products include:
Binocular
Video Eyewear Products
The features of our binocular Video Eyewear products, including
their resolution and apparent display size, microphones,
tracking devices and support of three-dimensional viewing are
designed to suit consumer applications. Our binocular Video
Eyewear products contain two microdisplays, a separate display
for each eye, typically mounted in a frame attached to eyeglass
style-temples. These products enable mobile and hands-free
private viewing of video content on screens that simulate home
theater-sized screens. Headphones are built into the temples so
that users can listen to accompanying audio in full stereo. They
can be employed as mobile high-resolution displays with products
such as portable DVD players, laptop computers, MIDs, cellular
phones with video output capability, and personal digital
media/video players (video iPods).
For the consumer markets, we currently produce four binocular
Video Eyewear products, all of which support 3D applications.
Each has a different apparent display size and native
resolution. They are:
|
|
|
| |
•
|
AV230 XL — QVGA (320x240 three-color pixels)
resolution and simulating a
44-inch
screen at nine feet.
|
| |
| |
•
|
AV310 widescreen — WQVGA (420x240 three-color pixels)
resolution and simulating a
52-inch
screen at nine feet.
|
| |
| |
•
|
AV920 — VGA (640x480 three-color pixels) resolution
and simulating a
62-inch
screen at nine feet.
|
| |
| |
•
|
VR920 — VGA (640x480 three-color pixels) resolution,
simulating a
62-inch
screen at nine feet, designed to plug into a computer’s USB
and video ports, and containing our proprietary three degrees of
freedom head tracking technology, which enables the user to look
around the environment being displayed by simply moving his or
her head. A microphone allows the user to communicate with
others. We expect those features to be of particular interest to
users playing games using the VR920, but they also can be used
in commercial 3D applications and for exploring Internet virtual
worlds like Second Life. The VR920 is currently compatible with
over 80 titles that work with it out of the box, including
popular games such as Microsoft’s Flight Simulator X and
World of Warcraft. We currently have over 1000 software
developers’ kits being used in applications from college
research programs to commercial developers to develop additional
titles for the VR920. With the addition of a clip-on camera
which we are currently tooling the VR920 can also used in AR
applications.
|
We sell our current binocular products into the consumer
marketplace under the brand
iWear®.
At the Consumer Electronics show in January 2009 we introduced
our first sunglass styled Video Eyewear product that we will be
selling under the
Wraptm
brand. We plan to introduce two versions of our Wrap optics,
including one that will both allow the user to see through to
the real world when the display is off or be just partially
transparent when the display is on. The first version will not
be see-through and we expect it will be introduced by October
2009. We anticipate that by spring 2010 we will be offering a
second version with see-through optics and a higher display
native resolution that will accept HD inputs and support AR
applications and at the same time be backwards compatible to all
the VR920 gaming applications already written. We also
anticipate that by spring 2010 we will be offering our six
degrees of freedom tracking technology, which is currently still
in development. That technology is being designed to both
accurately track an object’s and the user’s position
in 3D virtual space and to combine that tracking capability with
translational information about the three rotational axes (roll,
yaw, pitch). The addition of this translational information will
allow the device to report information about its X, Y and Z
position as it moves. This will expand the realism and accuracy
for users interacting in a VR or AR environment. We anticipate
that our six degrees of freedom tracking technology will be
available both separately as an accessory and as a built-in
feature of many of our Video Eyewear products.
We anticipate that future generations of our Video Eyewear
products will have form factors that should be even more
appealing to consumers, with appearances and sizes that are more
like ordinary sunglasses, and be more
56
ergonomic and fashionable. We intend to sell our binocular
products into the defense markets and have developed and
delivered prototypes of a rugged version for marine
applications. We also intend to sell our binocular products for
industrial applications that are similar to those in the defense
markets and with our new
Wraptm
line of Video Eyewear we anticipate advanced applications from
training and tools for maintenance and repair to interactive
product design and development.
Monocular
Video Eyewear Products
Our
Tac-Eye®
monocular (single eye) high-resolution Video Eyewear models are
designed to clip onto a pair of ballistic sunglasses, a head set
or conventional safety goggles. They can be used with the large
installed base of rugged laptops, security and night vision
cameras and thermal night vision sights, including those systems
that we currently act as a sub-contractor of display drive
electronics to the US defense department.
Tac-Eye®
enables users to have wearable, private and hands-free access to
high-resolution content or information. They enable the viewing
of material that is difficult or impossible to accurately view
on the lower-resolution direct view screens that are standard on
many of these devices without extensive zooming in or panning
across the screen.
Most of our
Tac-Eye®
products have an SVGA display and afford a 28 degree field of
view, the equivalent of a
20-inch
computer screen at three feet. They are also designed to be
durable and suitable for defense field use and industrial
applications.
Defense
Sub-Assembly and Custom Solutions
We are involved in two programs as part of contracting teams
that produce display drive electronic subassemblies for light,
medium, and heavy weight thermal weapon systems for US and other
defense forces. We produce the display drive electronics as part
of these night-vision systems and over the last five years we
have delivered over 107,000 systems. These products have
accounted for over 50% of our sales in the last two years.
We also have provided full optics systems, including head
mounted devices, wrist worn displays, human computer interface
devices, and wearable computers as prototypes under several
armed services test programs. These are being tested in
applications such as the remote control of unmanned vehicles.
When possible, we obtain a first right of refusal to be the
volume manufacturer of our proprietary display subassemblies as
part of our contracting process for the custom design of
products.
Low-vision
Assist Products
We offer two Video Eyewear products specifically for low-vision
assist applications. The first is a bundle of our AV920 Video
Eyewear with an external handheld camera that magnifies written
information to help a user to read small print. The second
consists of binocular Video Eyewear that incorporates a camera
and digital signal processor that uses our proprietary digital
signal processing algorithms to increase contrast,
magnification, color correction, edge detection, histogram
flattening, and using other video processing techniques. The
image received by the camera is processed, enhanced and
transmitted to the displays within the Video Eyewear to be
viewed by a user suffering from macular degeneration. These
devices are designed to permit many users suffering from macular
degeneration to perform a number of normal daily functions, such
as reading or signing a check, that they could not perform
unaided.
Technology
We believe that it is important to make substantial investments
in research and development to maintain our competitive
advantage. The development and procurement of intellectual
property rights relating to our technologies is a key aspect of
our business strategy. Near-to-eye virtual displays and their
components use relatively new technologies. We believe that it
is technologically feasible to improve the weight, ergonomics,
optical performance, luminance, power efficiency, design
compactness, field of view and resolution of the current
generation of virtual displays and display components. We expect
to continue to improve our products through our ongoing research
and development and advancements made by our third party
suppliers of key components. We also develop intellectual
property through our ongoing performance under engineering
service contracts for the US Government. During our fiscal years
ended December 31, 2008, December 31, 2007 and
December 31, 2006, we spent $3,366,518,
57
$2,365,412 and $1,279,239, respectively, on research and
development activities. We expect to continue to increase our
research and development expenditures in the future. We have
also acquired technologies developed by third parties and we may
do so in the future.
We believe that the range of our proprietary technologies gives
us a significant competitive advantage. Our technologies include
motion tracking systems; stereoscopic display assemblies; optic
systems; display backlights; mobile and wearable computing
devices and user interface technology; low-power electronics;
software drivers; and software applications. Our technologies
enable us to provide low-cost, small form factor,
high-resolution Video Eyewear products. To protect our
technologies, we have developed a patent portfolio which
consists of:
|
|
|
| |
•
|
44 total patents issued worldwide;
|
| |
| |
•
|
27 US patents issued (12 non-provisional, 15 design);
|
| |
| |
•
|
12 US patents pending (3 design, 7 non-provisional, 2
provisional);
|
| |
| |
•
|
17 international (non-US) patents issued (15 design, 2
non-provisional);
|
| |
| |
•
|
11 international (non-US) patents pending (3 design, 5
non-provisional, 3 applications under the Patent Cooperation
Treaty); and
|
| |
| |
•
|
5 applications in preparation but not yet filed, covering our
virtual display technology.
|
Our US patents expire on various dates from May 7, 2010
until September 23, 2024. Our international patents expire
on various dates from May 30, 2015 until May 30, 2030.
Major technologies that we employ in our products include:
Hardware
Technology
Virtual
Display Technology (including Lens Technology and Optics
Assemblies)
Microdisplay optics represents a significant cost of goods for
both us and our competitors. Driving this cost is the
significant trade off between the physical size of the
microdisplay and the cost of the supporting optics. Smaller
displays require larger and more sophisticated optics, while
larger displays require less magnification and less complex
optics. The smaller a microdisplay is, the less it costs to
produce. But the smaller a microdisplay is, the more difficult
it is to make optics systems that have no user adjustments,
large fields of view and very low distortion specifications. To
improve our Video Eyewear’s fashion and ergonomics we are
developing thin and lightweight optics that can be integrated
with display engines that match conventional eyewear frames in
size and weight and provide what we believe are significantly
improved ergonomics compared to competing wearable virtual
displays.
Vuzix Quantum Optic: We believe we have
developed revolutionary “first surface” optics
assemblies that include lenses, microdisplays, and backlights,
all assembled into a single sub-assembly. This technology
permits the production of inexpensive microdisplay engines that
provide low-distortion and large field of view images. We expect
that this technology will also enable us to produce
sunglass-styled Video Eyewear products that will allow the user
to see through the display to the real world. We expect to
introduce the first of these products in the fourth quarter of
2009 under the
Wraptm
brand. We have both issued and pending patents with respect to
this technology.
Vuzix Blade Optic: We are developing an
optical display engine that uses a blade of glass or plastic as
a wave guide, which we refer to as the
Bladetm.
The Blade uses a “projected” image from a conventional
microdisplay that is “squeezed” into a thin blade of
glass or plastic and, using a proprietary light guide expander,
the image exits from the glass in front of the user’s eye.
We expect this display engine will provide a large field of view
from a very thin lens system. The Blade can also function in
see-through applications. Unlike competing wearable virtual
displays, a see-through display does not obstruct the
wearer’s vision or reduce his awareness of what is
happening around him. Video Eyewear employing this display
engine will be closer to conventional sunglasses than currently
available products in comfort, size, weight and ergonomics. We
have filed patent applications with respect to this technology.
Holographic Display Engine: We have numerous
patents and patents pending on our new Holographic Display
Engine (HSE). The HSE incorporates both a display subsystem and
associated optics in a single monolithic design. The image is
projected into the edge of a slim piece of glass where it is
internally reflected and directed out
58
through a holographic element where it appears as a large
virtual screen to the user. To date we have successfully
prototyped a monochrome version of this display engine in our
design lab. If our continued research is successful we believe
we should ultimately have a low cost very high-resolution
display engine that by price, resolution, weight, form factor
and power consumption all should far exceed existing
microdisplay technology.
Low Power — LCD Drive
Electronics: We believe that our numerous
successful designs for the defense market demonstrate that we
can design and successfully implement very low-power
microdisplay electronics modules. The electronics required to
drive advanced microdisplays are a complex and costly piece of a
virtual display system. We may develop application-specific
integrated circuits (ASICs) to further reduce the cost, number
of components, and size of our electronics package while
improving the performance with various input sources. While
costly and complicated to develop, we believe these ASICs could
be critical to the success of our cost reduction programs and,
once completed, should also create barriers to entry for
competitors.
Position Tracking: Our tracking system
incorporates patented, multi-axis, “source-less”
tracking technology to track the rotational orientation of the
user’s head. Using the earth’s magnetic field and
gravity as references, a silicon sensor supplies the yaw
information and a silicon-based tilt sensor supplies pitch and
roll, as well as error correction. We have significantly reduced
the cost of tracking with our patented technology as compared to
competitive alternative solutions available today. We have also
begun development on our 6 degrees of freedom tracker that adds
translational tracking about the three rotational axes (roll,
yaw, pitch). We believe that cost-effective tracking technology
is fundamental to any Virtual and Augmented Reality Video
Eyewear system’s success and will help create a significant
barrier to entry for the competition.
3D
Content Delivery
Vuzix Automated 3D Watermark: In response to
the proliferation of large-screen, HD home entertainment
systems, the motion picture industry has recently begun to
invest in stereoscopic 3D technologies to attract theater
viewers. Over 5,000 North American movie theaters are being
converted to both digital projection and full 3D and production
of 3D motion pictures is increasing. Video Eyewear, with its
immersive environment and two separate displays, is well suited
for viewing 3D content and avoids many of the negative issues
typically encountered by shutter, polarized or color anaglyph
glasses used in competing technologies such as video color
distortion, noticeable flicker, decreased contrast and
bleed-through. Currently, in order to effectively display 3D
content, the viewer must manually switch the projection system
or display device to 3D mode as required by the content. We have
developed and have patents pending on a system that does this
automatically for the viewer. Using our system, a
“watermark” is embedded into the video stream that
identifies it as being 3D content. Our Video Eyewear can decode
the watermark and reconfigure the Video Eyewear to view the
content in 3D without any involvement by the viewer. If the
content is not in 3D, the Video Eyewear remains functioning in
two-dimensional mode. Our technology can be used with both
legacy and advanced Digital Rights Managed (DRM) delivery
systems.
Vuzix 3D Stereoscopic USB Drivers: We have
developed a USB driver that will allow most 3D titles to work in
3D stereoscopic mode with our PC based Video Eyewear. This
driver allows 3D titles that have been and are being created
utilizing Microsoft’s Direct X 3D graphics drivers and Open
GL, industry standards for entertainment and other 3D graphic
applications, to be viewed in stereoscopic 3D using our Video
Eyewear. We release support for the 3D titles using
“Monitor Software” on a
title-by-title
basis, typically coincident with added tracking capabilities.
General
Eyewear Technology
Vuzix Ergonomics and Industrial Designs: We
have developed ergonomic technologies that make head-worn
displays easier to use in a wide variety of applications. For
example, we are currently one of the only producers of Video
Eyewear solutions that offers focus adjustment on our products
that accommodate many of our users that need glasses for vision
correction and at the same time we offer the ability to
accommodate glasses for those that need them. We generally file
design patents on our more advanced solutions.
Software/Firmware
Technology
We believe that our substantial software portfolio provides a
competitive advantage. We have developed an extensive set of
Windows XP/Vista 32 and 64 bit drivers, Mac through to WIN CE
and .NET drivers and core code
59
capability that allows us to efficiently add new feature sets
centered around our hardware and their related software
products. We anticipate that this software technology will be
the foundation for some of our future products. Additionally, we
have a base of embedded microprocessor and field-programmable
gate array (FPGA) code related to microdisplay drive
electronics. We also have a large library of internally
developed, copyright-protected software that is used throughout
our products. Usable software applications and add-on accessory
hardware drivers can greatly increase customer value of our
Video Eyewear products.
Patents
and other Intellectual Property
We have a comprehensive intellectual property policy which has
as its objectives: (i) the development of new intellectual
property both to ensure and further our intellectual property
position in relation to personal display technology; and
(ii) the maintenance of our valuable trade secrets and
know-how. We seek to further achieve these objectives through
the commencement of more education and training of our
engineering staff and the adoption of appropriate systems and
procedures for the creation, identification and protection of
intellectual property.
Our general practice is to file patent applications for our
technology in the United States, Europe and Japan, while
inventions which are considered to have the greatest potential
are further protected by the filing of patent applications in
additional countries, including Canada, Russia and China. We
file and prosecute our patent applications in pursuit of the
most extensive protection including, where appropriate, the
applications of the relevant technology to the broader display
industry.
We believe that our intellectual property portfolio, coupled
with our key supplier relationships and accumulated experience
in the personal display field, gives us an advantage over
potential competitors. We also believe our copyrights,
trademarks, trade secrets, and patents are critical to our
success, and we intend, directly or indirectly, to maintain and
protect these. We also rely on proprietary technology, trade
secrets, and know-how, which are not patented. To protect our
rights in these areas, we require all employees and, where
appropriate, contractors, consultants, advisors and
collaborators to enter into confidentiality, invention
assignment and non-competition agreements.
In addition to our various patents, Vuzix currently has 11
registered US trademarks and a total of 27 trademark
registrations worldwide.
Competitors
and Competitive Advantage
The personal display industry in which we operate is highly
competitive. We compete against both direct view display
technology and against near-eye display technology. We believe
that the principal competitive factors in the personal display
industry include image size, image quality, image resolution,
power efficiency, manufacturing cost, weight and dimension,
feature implementation, ergonomics and finally the interactive
capabilities of the overall display system.
Most of our competitors’ products are based on direct view
display systems, in which the user views the display device, or
screen, directly without magnification. These products have
several disadvantages compared to virtual displays and our Video
Eyewear products. If the screens are large enough to read as
conventional internet page or HD video without external
magnification or image zooming, the products must be large and
bulky, such as laptops, personal computers or portable DVD
players. If the displays are small, such as those incorporated
in cellular phones and PDA-like devices, the screens are
difficult to read when displaying higher resolution content.
Despite the limitations of direct view personal displays,
advanced multi-media enabled or smart cellular phones are being
produced in ever increasing volumes by a number of
manufacturers, including Motorola, Inc., Nokia Corporation, Sony
Ericsson Mobile Communications AB, Research In Motion Limited,
Samsung Electronics Co., Ltd., LG Electronics and Apple Inc.
(Apple). We expect that these large and well-funded companies,
as well as newer entrants into the marketplace, will make
products that seek to compete with ours based on improvements to
their existing direct view display technologies or on new
technologies.
We also have competitors who produce near eye personal displays
or Video Eyewear. However, most of our competitors’ current
products lack one of more of the following critical features:
advanced optics, video up-scanning, 3D stereoscopic support,
on-screen video controls, and tracking. Furthermore, we believe
that most of our
60
competitors’ near eye products have inferior optics,
marginal electronics and poor industrial design and that, as a
result, our Video Eyewear products are superior to those of our
competitors in both visual performance and ergonomics. They are
lightweight and provide high-resolution images. They have
convenient and easy to use controls that enable the user to
control the display. Our systems are also typically more
power-efficient than those of our competitors. We believe that
tracking technology is a critical component of any VR or AR
system and that our patented tracking technology gives us a
competitive advantage in the markets for those systems.
Competition —
Consumer Products
A number of major companies, such as Sony, Olympus Corporation
and Canon Inc., produced head worn video display products for
the consumer market in the late 1990s. These products were not
well accepted by consumers and were ultimately discontinued. We
believe that these products were not well accepted because they
were ergonomically unsatisfactory and provided only low
resolution images and because, at that time, there was little
demand for mobile Video Eyewear. When these products were
available, video content was generally stored on video tape and
could only be viewed by playing the videotape on a videotape
recorder connected to a television. Currently there are a number
of smaller companies that have products which compete with our
Video Eyewear products. Our major competitors are MyVu, Zeiss,
i-O Display Systems, LLC, DaeYang Co., Ltd., Cybermind
Interactive Nederland, Mirage Innovations, Ltd., Lumus, Shenzhen
Oriscape Electronic Co., Ltd., Microvision Corporation
(Microvision) and Kopin.
Kopin began offering QVGA and VGA binocular display modules
(BDM) complete with drive electronics to original equipment
manufacturers (OEMs) in 2006. Those modules are designed for
easy customization by OEMs and include microdisplays,
backlights, optics and drive electronics. The availability of
those BDMs has greatly reduced the investment required for new
competitors to enter the business. To date, the Kopin products
have been primarily used by Asian-based Video Eyewear
manufacturers. Kopin does not currently compete with Vuzix at
the retail level. Kopin is our primary supplier of microdisplays.
In addition to numerous Asian-based companies using Kopin BDMs,
we currently have two principal competitors in the consumer
Video Eyewear market: MyVu and Zeiss.
|
|
|
| |
•
|
MyVu has based its most recent product line on an optic design
that results in relatively small virtual image sizes. While this
allows for a smaller form factor, it does not provide the large
virtual image that we believe consumers desire from Video
Eyewear products. Images on our Video Eyewear products appear as
much as four times larger than those on MyVu products. MyVu
products also do not currently support 3D, VGA video from a PC
or tracking. Finally, MyVu does not have a Video Eyewear product
designed specifically for the gaming market.
|
| |
| |
•
|
Zeiss introduced its first Video Eyewear product in the spring
of 2008. This product is bigger and bulkier than ours and we
believe it will be less acceptable in the mobile markets. And
while Zeiss does provide some level of 3D video support, it does
not currently offer PC products nor does it support the tracking
technology that would allow its products to be interactive.
|
There are also several Chinese manufacturers offering Video
Eyewear products that have one or more of the deficiencies
described above.
Competition —
Industrial and Defense
Although several companies produce monocular Video Eyewear, we
believe that opportunities for sales of their products to date
have been limited. So far, the market opportunity outside of the
night vision products has been limited primarily to trial tests,
rather than commercial volume purchases for defense and
industrial applications. We are aware of only very limited
commercial volume purchases in the defense and industrial
markets. Our current competitors in these markets are Liteye
Systems, Inc., Lumus, Shimadzu Corporation, Microvision, Kopin,
Creative Display Systems, LLC, OASYS Technology, LLC, Rockwell
Collins, Inc. and its subsidiary Kaiser. Some of these companies
are currently shipping product and others have only introduced
prototypes
and/or are
offering only limited sample quantities. We expect that we will
encounter competition in the future from major
61
suppliers of imaging and information products for defense
application, including DRS Technologies, Inc. (DRS), Insight
Technology Incorporated, Raytheon Company and BAE Systems, Inc.
There is competition in all classes of products manufactured by
us, including from divisions of the large companies, as well as
many small companies. Our sales do not represent a significant
share of the industry’s market for any class of its
products. The principal points of competition for electronic
products of both a defense and industrial nature include, among
other factors: price, product performance, the experience of the
particular company and history of its dealings in such products.
We, as well as other companies engaged in supplying equipment
for military use, are subject to various risks, including,
without limitation, dependence on US and foreign government
appropriations and program allocations, the competition for
available military business, and government termination of
orders for convenience.
We believe that most of the monocular Video Eyewear products
offered by our competitors are inferior to ours because they are
bulky, have small image sizes with poor optics
and/or are
currently priced higher than our products.
Competition —
Low-Vision Assist
The majority of competitors in the low-vision assist market
offer magnification systems that consist of a large desktop
television or computer screen that displays a magnified version
of an image captured by a hand scanner or stationary camera.
Over 30 companies currently offer such vision tools. The
largest providers are Enhanced Vision Inc. (Enhanced Vision)
(which markets its product under the Merlin brand name),
MagniSight, Inc., Optelec Holding B.V., REHAN Electronics Ltd.
(which markets it product under the Affinity brand name),
Beirley Associates, Inc., Telesensory Corporation and eSight
Corporation. Although the products offered by these companies
can provide effective low-vision assistance to many users, they
are not mobile and they are often difficult to use. They
generally require the user to sit in front of the large screen
to view the image. Recently, some companies, including Enhanced
Vision, have introduced mobile digital magnifiers that include a
camera and an integrated six-inch LCD screen. Enhanced
Vision’s product is marketed under the Amigo brand. We do
not believe that any of these competitive products offers the
flexibility of usage, portability and some of the advanced
digital video signal processing capabilities of our LV920.
Moreover, the utility of all of the other competitive tools is
generally limited to reading, whereas the LV920, which employs a
wearable camera and is mobile, can also be used for many other
normal vision applications.
In the wearable low-vision assist market, our competitors are
manufacturers of optical loops and head worn optical systems and
one manufacturer of a digital magnifying system similar to our
LV920. The optical loops are usually worn by dentists, doctors,
and jewelry makers for their fine work, and have gained limited
use in the low-vision assist market due to their lack of signal
processing and image brightness issues. The competitive digital
magnifier is manufactured by Enhanced Vision and is sold under
the Jordy and Maxport brand names. While the Enhanced Vision
product has been sold for several years now, its market
penetration has been limited. We believe our low-vision assist
product is more ergonomic and offers more advanced digital video
signal processing techniques than those manufactured by Enhanced
Vision.
Sales and
Marketing
Sales
Our sales strategy is to introduce our products to the widest
possible audience within our target markets. We focus today on
the consumer and industrial and defense markets. Historically,
most of our sales efforts were directed toward obtaining
contracts to provide custom engineering solutions and products
for the defense and industrial markets. However, in 2005, as our
products and technology evolved, we began to also sell standard
Video Eyewear products for the consumer markets. In fall 2008,
we began offering products for the low-vision assist market.
We have separate marketing and sales strategies for each of our
target markets. We have an internal sales force of five people.
We regularly attend industry trade shows in our markets and have
begun establishing some level of separate branding for both of
our divisions. The consumer division sells under the Vuzix name
and the industrial and defense division under the
Tac-Eye®
name.
62
During the years 2008 and 2007, 63.6% and 67.7% of our sales
were derived from providing goods and services to the US
government, directly and indirectly. Of those amounts, 81.4% in
fiscal 2008 and 20.7% in 2007 were derived from subcontracts
with Kopin and DRS, and we are dependent upon continuing to be
engaged as a subcontractor to them. We derived 35.6% of our
sales from consumer Video Eyewear products in fiscal 2008 and
32.4% and 21.2% in fiscal 2007 and 2006 respectively.
—
|
|
|
—
|
|
|
|
66,227
|
|
|
|
—
|
|
|
|
—
|
|
|
|
—
|
|
|
|
—
|
|
|
|
66,227
|
|
|
Stock Compensation Expense
|
|
|
—
|
|
|
|
—
|
|
|
|
180,298
|
|
|
|
—
|
|
|
|
—
|
|
|
|
—
|
|
|
|
—
|
|
|
|
180,298
|
|
|
2008 Net Loss
|
|
|
—
|
|
|
|
—
|
|
|
|
—
|
|
|
|
(4,894,199
|
)
|
|
|
—
|
|
|
|
—
|
|
|
|
—
|
|
|
|
(4,894,199
|
)
|
|
|
|
|
|
|
|
|
|
|
|
|
|
|
|
|
|
|
|
|
|
|
|
|
|
|
|
|
|
|
|
|
|
|
|
Balance — December 31, 2008
|
|
|
218,268,927
|
|
|
$
|
218,269
|
|
|
$
|
12,700,413
|
|
|
$
|
(14,687,276
|
)
|
|
|
168,500
|
|
|
$
|
169
|
|
|
$
|
(321,517
|
)
|
|
$
|
(2,089,942
|
)
|
|
|
|
|
|
|
|
|
|
|
|
|
|
|
|
|
|
|
|
|
|
|
|
|
|
|
|
|
|
|
|
|
|
|
|
Exercise of Options
|
|
|
—
|
|
|
|
—
|
|
|
|
—
|
|
|
|
—
|
|
|
|
—
|
|
|
|
—
|
|
|
|
—
|
|
|
|
—
|
|
|
Issuance of Common Stock
|
|
|
2,000,000
|
|
|
|
2,000
|
|
|
|
298,000
|
|
|
|
—
|
|
|
|
—
|
|
|
|
—
|
|
|
|
—
|
|
|
|
300,000
|
|
|
Exercise of Stock Warrants
|
|
|
—
|
|
|
|
—
|
|
|
|
—
|
|
|
|
—
|
|
|
|
—
|
|
|
|
—
|
|
|
|
—
|
|
|
|
—
|
|
|
Stock Issued for Services
|
|
|
—
|
|
|
|
—
|
|
|
|
—
|
|
|
|
—
|
|
|
|
—
|
|
|
|
—
|
|
|
|
—
|
|
|
|
—
|
|
|
Repurchase of Fractional Shares
|
|
|
—
|
|
|
|
—
|
|
|
|
(2
|
)
|
|
|
|
|
|
|
—
|
|
|
|
—
|
|
|
|
—
|
|
|
|
(2
|
)
|
|
Dividends
|
|
|
—
|
|
|
|
—
|
|
|
|
—
|
|
|
|
(50,550
|
)
|
|
|
—
|
|
|
|
—
|
|
|
|
—
|
|
|
|
(50,550
|
)
|
|
Warrants Issued for Services
|
|
|
—
|
|
|
|
—
|
|
|
|
—
|
|
|
|
—
|
|
|
|
—
|
|
|
|
—
|
|
|
|
—
|
|
|
|
—
|
|
|
Stock Compensation Expense (Restated)
|
|
|
—
|
|
|
|
—
|
|
|
|
90,065
|
|
|
|
—
|
|
|
|
—
|
|
|
|
—
|
|
|
|
—
|
|
|
|
90,065
|
|
|
Direct IPO Associated Expense
|
|
|
—
|
|
|
|
—
|
|
|
|
(96,248
|
)
|
|
|
|
|
|
|
—
|
|
|
|
—
|
|
|
|
—
|
|
|
|
(96,248
|
)
|
|
Adjustment of Subscriptions Receivable (Restated)
|
|
|
—
|
|
|
|
—
|
|
|
|
(13,135
|
)
|
|
|
—
|
|
|
|
—
|
|
|
|
—
|
|
|
|
94,181
|
|
|
|
81,046
|
|
|
Net Loss for the 6 months ended June 30, 2009
|
|
|
—
|
|
|
|
—
|
|
|
|
—
|
|
|
|
(1,487,565
|
)
|
|
|
—
|
|
|
|
—
|
|
|
|
—
|
|
|
|
(1,487,565
|
)
|
|
|
|
|
|
|
|
|
|
|
|
|
|
|
|
|
|
|
|
|
|
|
|
|
|
|
|
|
|
|
|
|
|
|
|
Balance — June 30, 2009
(Unaudited) (Restated)
|
|
|
220,268,927
|
|
|
$
|
220,269
|
|
|
$
|
12,979,093
|
|
|
$
|
(16,225,391
|
)
|
|
|
168,500
|
|
|
$
|
169
|
|
|
$
|
(227,336
|
)
|
|
$
|
(3,253,196
|
)
|
|
|
|
|
|
|
|
|
|
|
|
|
|
|
|
|
|
|
|
|
|
|
|
|
|
|
|
|
|
|
|
|
|
|
The accompanying notes are an integral part of these
consolidated financial statements.
F-5
| |
|
|
|
|
|
|
|
|
|
|
|
|
|
|
|
For Years Ended
|
|
|
|
|
December 31,
|
|
|
|
|
2008
|
|
|
2007
|
|
|
2006
|
|
|
|
|
(Restated)
|
|
|
(Restated)
|
|
|
(Restated)
|
|
|
|
|
Sales of Products
|
|
$
|
10,941,181
|
|
|
$
|
4,701,004
|
|
|
$
|
6,910,866
|
|
|
Sales of Engineering Services
|
|
|
1,548,703
|
|
|
|
5,445,375
|
|
|
|
2,627,442
|
|
|
|
|
|
|
|
|
|
|
|
|
|
|
|
|
Total Sales
|
|
|
12,489,884
|
|
|
|
10,146,379
|
|
|
|
9,538,308
|
|
|
Cost of Sales — Products
|
|
|
7,769,916
|
|
|
|
3,407,340
|
|
|
|
4,269,908
|
|
|
Cost of Sales — Engineering Services
|
|
|
1,018,989
|
|
|
|
3,376,133
|
|
|
|
1,497,642
|
|
|
|
|
|
|
|
|
|
|
|
|
|
|
|
|
Total Cost of Sales
|
|
|
8,788,905
|
|
|
|
6,783,473
|
|
|
|
5,767,550
|
|
|
|
|
|
|
|
|
|
|
|
|
|
|
|
|
Gross Profit
|
|
|
3,700,979
|
|
|
|
3,362,906
|
|
|
|
3,770,758
|
|
|
Operating Expenses:
|
|
|
|
|
|
|
|
|
|
|
|
|
|
Research and Development
|
|
|
3,366,518
|
|
|
|
2,365,412
|
|
|
|
1,279,239
|
|
|
Selling and Marketing
|
|
|
2,128,625
|
|
|
|
1,920,164
|
|
|
|
1,191,800
|
|
|
General and Administrative
|
|
|
2,299,685
|
|
|
|
1,718,627
|
|
|
|
1,560,278
|
|
|
Depreciation and Amortization
|
|
|
510,133
|
|
|
|
374,078
|
|
|
|
276,989
|
|
|
|
|
|
|
|
|
|
|
|
|
|
|
|
|
Total Operating Expenses
|
|
|
8,304,961
|
|
|
|
6,378,281
|
|
|
|
4,308,306
|
|
|
Loss from Operations
|
|
|
(4,603,982
|
)
|
|
|
(3,015,375
|
)
|
|
|
(537,548
|
)
|
|
|
|
|
|
|
|
|
|
|
|
|
|
|
|
Other Income (Expense)
|
|
|
|
|
|
|
|
|
|
|
|
|
|
Interest and Other (Expense) Income
|
|
|
188
|
|
|
|
2,549
|
|
|
|
313
|
|
|
Foreign Exchange Gain (Loss)
|
|
|
(24,216
|
)
|
|
|
|
|
|
|
|
|
|
Legal Settlement
|
|
|
—
|
|
|
|
96,632
|
|
|
|
—
|
|
|
Interest Expenses
|
|
|
(260,977
|
)
|
|
|
(241,692
|
)
|
|
|
(179,019
|
)
|
|
|
|
|
|
|
|
|
|
|
|
|
|
|
|
Total Other Income (Expense)
|
|
|
(285,005
|
)
|
|
|
(142,511
|
)
|
|
|
(178,706
|
)
|
|
|
|
|
|
|
|
|
|
|
|
|
|
|
|
Loss Before Provision for Income Taxes
|
|
|
(4,888,987
|
)
|
|
|
(3,157,886
|
)
|
|
|
(716,254
|
)
|
|
Provision (Benefit) for Income Taxes (Note 13)
|
|
|
5,212
|
|
|
|
(98,372
|
)
|
|
|
3,700
|
|
|
|
|
|
|
|
|
|
|
|
|
|
|
|
|
Net Loss
|
|
$
|
(4,894,199
|
)
|
|
$
|
(3,059,514
|
)
|
|
$
|
(719,954
|
)
|
|
|
|
|
|
|
|
|
|
|
|
|
|
|
|
Basic and Diluted Loss per Share
|
|
$
|
(0.0240
|
)
|
|
$
|
(0.0176
|
)
|
|
$
|
(0.0047
|
)
|
|
Weighted-average Shares
Outstanding — Basic and Diluted
|
|
|
207,710,498
|
|
|
|
185,263,660
|
|
|
|
173,254,715
|
|
The accompanying notes are an integral part of these
consolidated financial statements.
F-6
| |
|
|
|
|
|
|
|
|
|
|
|
|
|
|
|
|
|
|
|
For Three Months
|
|
|
For Six Months
|
|
|
|
|
Ended June 30,
|
|
|
Ended June 30,
|
|
|
|
|
2009
|
|
|
2008
|
|
|
2009
|
|
|
2008
|
|
|
|
|
(Unaudited)
|
|
|
(Unaudited)
|
|
|
(Unaudited)
|
|
|
(Unaudited)
|
|
|
|
|
(Restated)
|
|
|
(Restated)
|
|
|
(Restated)
|
|
|
(Restated)
|
|
|
|
|
Sales of Products
|
|
$
|
1,946,868
|
|
|
$
|
2,960,332
|
|
|
|
4,516,732
|
|
|
|
4,489,988
|
|
|
Sales of Engineering Services
|
|
|
116,865
|
|
|
|
127,006
|
|
|
|
568,355
|
|
|
|
317,994
|
|
|
|
|
|
|
|
|
|
|
|
|
|
|
|
|
|
|
|
|
Total Sales
|
|
|
2,063,733
|
|
|
|
3,087,338
|
|
|
|
5,082,087
|
|
|
|
4,807,982
|
|
|
Cost of Sales — Products
|
|
|
1,324,063
|
|
|
|
1,795,529
|
|
|
|
2,915,596
|
|
|
|
3,144,031
|
|
|
Cost of Sales — Engineering Services
|
|
|
66,756
|
|
|
|
76,132
|
|
|
|
306,265
|
|
|
|
214,708
|
|
|
|
|
|
|
|
|
|
|
|
|
|
|
|
|
|
|
|
|
Total Cost of Sales
|
|
|
1,390,819
|
|
|
|
1,871,661
|
|
|
|
3,221,861
|
|
|
|
3,358,739
|
|
|
|
|
|
|
|
|
|
|
|
|
|
|
|
|
|
|
|
|
Gross Profit
|
|
|
672,914
|
|
|
|
1,215,677
|
|
|
|
1,860,226
|
|
|
|
1,449,243
|
|
|
Operating Expenses:
|
|
|
|
|
|
|
|
|
|
|
|
|
|
|
|
|
|
Research and Development
|
|
|
428,737
|
|
|
|
1,224,265
|
|
|
|
945,897
|
|
|
|
1,960,982
|
|
|
Selling and Marketing
|
|
|
520,257
|
|
|
|
483,695
|
|
|
|
976,041
|
|
|
|
933,257
|
|
|
General and Administrative
|
|
|
534,142
|
|
|
|
438,831
|
|
|
|
990,729
|
|
|
|
972,630
|
|
|
Depreciation and Amortization
|
|
|
167,509
|
|
|
|
123,696
|
|
|
|
306,343
|
|
|
|
247,392
|
|
|
|
|
|
|
|
|
|
|
|
|
|
|
|
|
|
|
|
|
Total Operating Expenses
|
|
|
1,650,645
|
|
|
|
2,270,487
|
|
|
|
3,219,010
|
|
|
|
4,114,261
|
|
|
|
|
|
|
|
|
|
|
|
|
|
|
|
|
|
|
|
|
Loss from Operations
|
|
|
(977,731
|
)
|
|
|
(1,054,810
|
)
|
|
|
(1,358,784
|
)
|
|
|
(2,665,018
|
)
|
|
|
|
|
|
|
|
|
|
|
|
|
|
|
|
|
|
|
|
Other Income (Expense)
|
|
|
|
|
|
|
|
|
|
|
|
|
|
|
|
|
|
Interest and Other (Expense) Income
|
|
|
11
|
|
|
|
|
|
|
|
59
|
|
|
|
166
|
|
|
Foreign Exchange Gain (Loss)
|
|
|
(3,657
|
)
|
|
|
(300
|
)
|
|
|
(4,969
|
)
|
|
|
(33
|
)
|
|
Interest Expenses
|
|
|
(56,711
|
)
|
|
|
(57,353
|
)
|
|
|
(122,095
|
)
|
|
|
(99,019
|
)
|
|
|
|
|
|
|
|
|
|
|
|
|
|
|
|
|
|
|
|
Total Other Income (Expense)
|
|
|
(60,357
|
)
|
|
|
(57,653
|
)
|
|
|
(127,005
|
)
|
|
|
(98,886
|
)
|
|
|
|
|
|
|
|
|
|
|
|
|
|
|
|
|
|
|
|
Loss Before Provision for Income Taxes
|
|
|
(1,038,088
|
)
|
|
|
(1,112,463
|
)
|
|
|
(1,485,789
|
)
|
|
|
(2,763,904
|
)
|
|
Provision (Benefit) for Income Taxes (Note 13)
|
|
|
888
|
|
|
|
2,897
|
|
|
|
1,776
|
|
|
|
3,650
|
|
|
|
|
|
|
|
|
|
|
|
|
|
|
|
|
|
|
|
|
Net Loss
|
|
|
(1,038,976
|
)
|
|
$
|
(1,115,360
|
)
|
|
|
(1,487,565
|
)
|
|
|
(2,767,554
|
)
|
|
|
|
|
|
|
|
|
|
|
|
|
|
|
|
|
|
|
|
Basic and Diluted Loss per Share
|
|
$
|
(0.0048
|
)
|
|
$
|
(0.0057
|
)
|
|
|
(0.0070
|
)
|
|
|
(0.0141
|
)
|
|
Weighted-average Shares Outstanding — Basic and Diluted
|
|
|
220,268,927
|
|
|
|
200,424,027
|
|
|
|
219,935,594
|
|
|
|
200,015,546
|
|
The accompanying notes are an integral part of these
consolidated financial statements.
F-7
| |
|
|
|
|
|
|
|
|
|
|
|
|
|
|
|
|
|
|
|
|
|
|
|
For Six Months Ended
|
|
|
For Years Ended
|
|
|
|
|
June 30,
|
|
|
December 31,
|
|
|
|
|
2009
|
|
|
2008
|
|
|
2008
|
|
|
2007
|
|
|
2006
|
|
|
|
|
(Unaudited)
|
|
|
(Unaudited)
|
|
|
|
|
|
(As restated)
|
|
|
|
|
|
|
|
Cash Flows from Operating Activities
|
|
|
|
|
|
|
|
|
|
|
|
|
|
|
|
|
|
|
|
|
|
Net Loss
|
|
$
|
(1,487,565
|
)
|
|
$
|
(2,767,554
|
)
|
|
$
|
(4,894,199
|
)
|
|
$
|
(3,059,514
|
)
|
|
$
|
(719,954
|
)
|
|
Non-Cash Adjustments
|
|
|
|
|
|
|
|
|
|
|
|
|
|
|
|
|
|
|
|
|
|
Depreciation and Amortization
|
|
|
306,343
|
|
|
|
247,392
|
|
|
|
510,133
|
|
|
|
374,078
|
|
|
|
276,989
|
|
|
Stock-Based Compensation Expense
|
|
|
90,065
|
|
|
|
90,149
|
|
|
|
180,298
|
|
|
|
111,438
|
|
|
|
18,418
|
|
|
Stock Issued for Services
|
|
|
—
|
|
|
|
—
|
|
|
|
66,667
|
|
|
|
—
|
|
|
|
—
|
|
|
Warrants Issued for Services
|
|
|
—
|
|
|
|
—
|
|
|
|
66,227
|
|
|
|
78,275
|
|
|
|
—
|
|
|
(Increase) Decrease in Operating Assets
|
|
|
|
|
|
|
|
|
|
|
|
|
|
|
|
|
|
|
|
|
|
Accounts Receivable
|
|
|
822,986
|
|
|
|
2,420,928
|
|
|
|
1,494,613
|
|
|
|
(931,121
|
)
|
|
|
(1,226,116
|
)
|
|
Inventories
|
|
|
377,002
|
|
|
|
1,574,230
|
|
|
|
(322,856
|
)
|
|
|
(826,732
|
)
|
|
|
(362,118
|
)
|
|
Prepaid Income Taxes
|
|
|
—
|
|
|
|
—
|
|
|
|
|
|
|
|
(130,130
|
)
|
|
|
—
|
|
|
Prepaid Expenses and Other Assets
|
|
|
(20,351
|
)
|
|
|
(67,989
|
)
|
|
|
67,135
|
|
|
|
(106,025
|
)
|
|
|
4,919
|
|
|
Increase (Decrease) in Operating Liabilities
|
|
|
|
|
|
|
|
|
|
|
|
|
|
|
|
|
|
|
|
|
|
Accounts Payable
|
|
|
(1,089,560
|
)
|
|
|
(1,205,909
|
)
|
|
|
733,691
|
|
|
|
1,580,255
|
|
|
|
1,496,609
|
|
|
Accrued Expenses
|
|
|
64,077
|
|
|
|
9,988
|
|
|
|
14,088
|
|
|
|
(175,574
|
)
|
|
|
289,124
|
|
|
Customer Deposits
|
|
|
451,399
|
|
|
|
269,484
|
|
|
|
683,040
|
|
|
|
(78,947
|
)
|
|
|
(117,722
|
)
|
|
Income Taxes Payable
|
|
|
(34,636
|
)
|
|
|
3,650
|
|
|
|
5,187
|
|
|
|
31,225
|
|
|
|
3,192
|
|
|
Accrued Commissions
|
|
|
—
|
|
|
|
—
|
|
|
|
—
|
|
|
|
(266,475
|
)
|
|
|
266,475
|
|
|
Accrued Compensation
|
|
|
—
|
|
|
|
—
|
|
|
|
—
|
|
|
|
|
|
|
|
135,000
|
|
|
Accrued Interest
|
|
|
43,303
|
|
|
|
54,348
|
|
|
|
110,527
|
|
|
|
103,347
|
|
|
|
55,237
|
|
|
|
|
|
|
|
|
|
|
|
|
|
|
|
|
|
|
|
|
|
|
|
|
Net Cash Flows (Used in) Provided From Operating
Activities
|
|
|
(476,637
|
)
|
|
|
(107,925
|
)
|
|
|
(1,285,449
|
)
|
|
|
(3,295,900
|
)
|
|
|
120,053
|
|
|
|
|
|
|
|
|
|
|
|
|
|
|
|
|
|
|
|
|
|
|
|
|
Cash Flows from Investing Activities
|
|
|
|
|
|
|
|
|
|
|
|
|
|
|
|
|
|
|
|
|
|
Purchases of Tooling and Equipment
|
|
|
(81,837
|
)
|
|
|
(193,126
|
)
|
|
|
(424,166
|
)
|
|
|
(180,310
|
)
|
|
|
(370,188
|
)
|
|
Investments in Patents and Trademarks
|
|
|
(66,940
|
)
|
|
|
(66,067
|
)
|
|
|
(125,638
|
)
|
|
|
(136,433
|
)
|
|
|
(109,048
|
)
|
|
|
|
|
|
|
|
|
|
|
|
|
|
|
|
|
|
|
|
|
|
|
|
Net Cash Used in Investing Activities
|
|
|
(148,777
|
)
|
|
|
(259,193
|
)
|
|
|
(549,804
|
)
|
|
|
(316,743
|
)
|
|
|
(479,236
|
)
|
|
|
|
|
|
|
|
|
|
|
|
|
|
|
|
|
|
|
|
|
|
|
|
Cash Flows from Financing Activities
|
|
|
|
|
|
|
|
|
|
|
|
|
|
|
|
|
|
|
|
|
|
Net Change in Lines of Credit
|
|
|
(113,742
|
)
|
|
|
120,765
|
|
|
|
123,890
|
|
|
|
(13,837
|
)
|
|
|
(115,138
|
)
|
|
Issuance of Common Stock
|
|
|
300,000
|
|
|
|
—
|
|
|
|
2,138,646
|
|
|
|
3,792,362
|
|
|
|
—
|
|
|
Issuance of Preferred Stock
|
|
|
—
|
|
|
|
—
|
|
|
|
—
|
|
|
|
—
|
|
|
|
407,650
|
|
|
Repayment of Capital Leases
|
|
|
(79,236
|
)
|
|
|
(44,793
|
)
|
|
|
(98,702
|
)
|
|
|
(168,947
|
)
|
|
|
(121,135
|
)
|
|
Prepayment of Long-Term Debt
|
|
|
—
|
|
|
|
—
|
|
|
|
—
|
|
|
|
(206,980
|
)
|
|
|
(22,328
|
)
|
|
Exercise of Stock Options
|
|
|
—
|
|
|
|
16,697
|
|
|
|
16,696
|
|
|
|
5,730
|
|
|
|
520
|
|
|
Exercise of Stock Warrants
|
|
|
—
|
|
|
|
13,586
|
|
|
|
13,586
|
|
|
|
—
|
|
|
|
—
|
|
|
Direct IPO Associated Costs
|
|
|
(92,248
|
)
|
|
|
|
|
|
|
|
|
|
|
|
|
|
|
|
|
|
Adjustment of Subscription Receivable
|
|
|
81,046
|
|
|
|
|
|
|
|
|
|
|
|
|
|
|
|
|
|
|
Proceeds from Long-Term Debt
|
|
|
—
|
|
|
|
—
|
|
|
|
95,000
|
|
|
|
—
|
|
|
|
725,000
|
|
|
|
|
|
|
|
|
|
|
|
|
|
|
|
|
|
|
|
|
|
|
|
|
Net Cash Flows Provided by Financing Activities
|
|
|
91,820
|
|
|
|
106,255
|
|
|
|
2,289,116
|
|
|
|
3,408,328
|
|
|
|
874,569
|
|
|
|
|
|
|
|
|
|
|
|
|
|
|
|
|
|
|
|
|
|
|
|
|
Net Increase (Decrease) in Cash and Cash Equivalents
|
|
|
(533,594
|
)
|
|
|
(260,863
|
)
|
|
|
453,863
|
|
|
|
(204,315
|
)
|
|
|
515,386
|
|
|
Cash and Cash Equivalents — Beginning of Year
|
|
|
818,719
|
|
|
|
364,856
|
|
|
|
364,856
|
|
|
|
569,171
|
|
|
|
53,785
|
|
|
|
|
|
|
|
|
|
|
|
|
|
|
|
|
|
|
|
|
|
|
|
|
Cash and Cash Equivalents — End of Year
|
|
$
|
285,126
|
|
|
$
|
103,993
|
|
|
$
|
818,719
|
|
|
$
|
364,856
|
|
|
$
|
569,171
|
|
|
|
|
|
|
|
|
|
|
|
|
|
|
|
|
|
|
|
|
|
|
|
|
Supplemental Disclosures
|
|
|
|
|
|
|
|
|
|
|
|
|
|
|
|
|
|
|
|
|
|
Interest Paid
|
|
|
78,892
|
|
|
|
41,889
|
|
|
|
149,214
|
|
|
|
138,345
|
|
|
|
179,019
|
|
|
Income Taxes Paid
|
|
|
36,412
|
|
|
|
425
|
|
|
|
425
|
|
|
|
3,725
|
|
|
|
1,950
|
|
|
|
|
|
|
|
|
|
|
|
|
|
|
|
|
|
|
|
|
|
|
|
|
Non-Cash Investing Transactions
|
|
|
|
|
|
|
|
|
|
|
|
|
|
|
|
|
|
|
|
|
|
Equipment Acquired Under Capital Lease
|
|
|
—
|
|
|
|
—
|
|
|
|
89,833
|
|
|
|
221,633
|
|
|
|
317,932
|
|
|
Equipment Acquired Through Assumption of Long-Term Debt
|
|
|
—
|
|
|
|
—
|
|
|
|
—
|
|
|
|
—
|
|
|
|
62,010
|
|
|
Dividends Declared but Not Paid
|
|
|
50,550
|
|
|
|
50,550
|
|
|
|
101,100
|
|
|
|
101,100
|
|
|
|
93,186
|
|
|
Debt Converted to Equity
|
|
|
—
|
|
|
|
—
|
|
|
|
—
|
|
|
|
200,000
|
|
|
|
|
|
|
|
|
|
|
|
|
|
|
|
|
|
|
|
|
|
|
|
|
|
|
|
The accompanying notes are an integral part of these
consolidated financial statements.
F-8
VUZIX
CORPORATION AND SUBSIDIARY
(Amounts
and disclosures at and for the three and six months ended
June 30, 2009 and 2008 are unaudited)
Note 1 —
Basis of Presentation
The unaudited Consolidated Financial Statements of Vuzix
Corporation and Subsidiary (the “Company”) for the
three months ending June 30, 2009 and 2008 have been
prepared in accordance with generally accepted accounting
principles in the United States of America for interim financial
information. Accordingly, the Consolidated Financial Statements
do not include all of the information and footnotes required by
generally accepted accounting principles for complete financial
statements. In the opinion of management, all adjustments
considered necessary for a fair presentation have been included.
The results for the interim periods are not necessarily
indicative of the results to be expected for the year. The
accompanying Consolidated Financial Statements should be read in
conjunction with the audited Consolidated Financial Statements
of the Company as of December 31, 2008, as included with
these consolidated financial statements.
Note 2 —
Nature of Business and Summary of Significant Accounting
Policies
The
Company
Vuzix Corporation (the Company) was formed in 1997 under the
laws of the State of Delaware and maintains its corporate
offices in Rochester, New York. The Company changed its name to
Vuzix Corporation in September 2007, being previously known as
Icuiti Corporation. The Company is engaged in the design,
manufacture, marketing and sale of devices that are worn like
eyeglasses and which feature built-in video screens that enable
the user to view video and digital content, such as movies,
computer data, the Internet or video games. Our products (known
commercially as “Video Eyewear”) are used to view high
resolution video and digital information from portable devices,
such as cell phones, portable media players, gaming systems and
laptop computers and from personal computers. Our products
provide the user with a virtual viewing experience that emulates
viewing a large screen television or desktop computer monitor
practically anywhere, anytime.
Segment
Data, Geographic Information and Significant
Customers
The Company is not organized by market and is managed and
operated as one business. A single management team that reports
to the chief operating decision maker comprehensively manages
the entire business. The Company does not operate any material
separate lines of business or separate business entities.
Accordingly, the Company does not accumulate discrete
information, other than product revenue and material costs, with
respect to separate product lines and does not have separately
reportable segments as defined by Statement of Financial
Accounting Standards (SFAS) No. 131, “Disclosures
about Segments of an Enterprise and Related Information.”
Shipments to customers outside of the United States approximated
20%, 12% and 5% of sales in 2008, 2007 and 2006, respectively.
No single international country represented more than 10% of
revenues. The Company does not maintain significant amounts of
long-lived assets outside of the United States other than
tooling held by its third party manufacturers, primarily in
China.
The Company has at times had a concentration of sales to the
U.S. government and they amounted to approximately 12% and
54% of sales in 2008 and 2007, respectively. Accounts receivable
from the U.S. government accounted for 31% and 19% of
accounts receivable at 2008 and 2007, respectively. Another
customer, who is also a minority stockholder, represented 20%
and 17% of sales in 2008 and 2007, respectively.
Principles
of Consolidation
The consolidated financial statements include the accounts of
the Company and its wholly owned subsidiary, Vuzix Europe. All
significant inter-company transactions have been eliminated.
F-9
VUZIX
CORPORATION AND SUBSIDIARY
NOTES TO
CONSOLIDATED FINANCIAL
STATEMENTS — (Continued)
Foreign
Currency Translation
The U.S. dollar is the functional currency of the
Company’s foreign subsidiary. Monetary assets and
liabilities are re-measured at year-end exchange rates.
Non-monetary assets and liabilities are re-measured at
historical rates. Revenues, expenses, gains and losses are
re-measured using the rates on which those elements were
recognized during the period.
Use of
Estimates
The preparation of the consolidated financial statements in
conformity with accounting principles generally accepted in the
United States requires management to make estimates and
assumptions that affect the reported amounts of assets and
liabilities and disclosure of contingent assets and liabilities
at year end and the reported amounts of revenue and expenses
during the reporting period. Actual results could differ from
those estimates.
Concentration
of Credit Risk
The Company performs ongoing credit evaluations of its
customers’ financial condition and maintains an allowance
for uncollectible accounts receivable based upon the expected
collectability of all accounts receivable. As of
December 31, 2008, one customer, represented 31% of net
accounts receivable and was subsequently received during 2009.
For cash management purposes, the Company concentrates its cash
holdings in two accounts at the JP Morgan Chase Bank. The
balance in these accounts may exceed the federally insured limit
of $250,000 per customer by the Federal Deposit Insurance
Corporation in case of bank failure. At December 31, 2008
and 2007, the Company had $462,808 and $250,851 in excess of the
insurance limit at this bank.
Cash
and Cash Equivalents
The Company’s cash received is applied against its two
revolving lines of credit on a periodic basis based projected
monthly cash flows, reducing interest expense. Cash and cash
equivalents can include highly liquid investments with original
maturities of three months or less.
Fair
Value of Financial Instruments
The Company’s financial instruments primarily consists of
cash and cash equivalents, accounts receivable, inventories,
prepaid income taxes, prepaid expenses and other assets,
accounts payable, lines of credit, current portion of long-term
debt and capital leases, customer deposits, accrued expenses,
and income taxes payable.
As of the consolidated balance sheet date, the estimated fair
values of the financial instruments were not materially
different from their carrying values as presented due to the
short maturities of these instruments and that the interest
rates on the borrowing approximate those that would have been
available for loans for similar remaining maturity and risk
profiles at respective year ends.
Allowance
for Doubtful Accounts
The Company establishes an allowance for uncollectible trade
accounts receivable based on the age of outstanding invoices and
management’s evaluation of collectability of outstanding
balances. These provisions are established when the aging of
outstanding amounts exceeds allowable terms and are re-evaluated
at each quarter end for adequacy. In determining the adequacy of
the provision, the Company considers known uncollectible or at
risk receivables.
F-10
VUZIX
CORPORATION AND SUBSIDIARY
NOTES TO
CONSOLIDATED FINANCIAL
STATEMENTS — (Continued)
Provision
for Future Warranty Costs
Warranty costs are accrued, to the extent that they are not
recoverable from third party manufacturers, for the estimated
cost to repair or replace products for the balance of the
warranty periods. The Company’s products are covered by
standard warranty plans that extend normally 12 months to
24 months from the date of product shipment. The Company
provides for the costs of expected future warranty claims at the
time of product shipment or over-builds to cover replacements.
The adequacy of the provision is assessed at each quarter end
and is based on historical experience of warranty claims and
costs. As of December 31, 2008, the Company’s
provision for future warranty claims was $106,865 compared to
$73,064 as of December 31, 2007, with the increase
attributable primarily to increased revenue from product
shipments.
Inventories
Inventories are valued at the lower of cost, or market using the
first-in,
first-out method. The Company does not include any direct
overheads costs in its inventory valuation costing, as such
amounts have been immaterial in its current and prior fiscal
years. The Company records provisions for excess, obsolete or
slow moving inventory based on changes in customer demand,
technology developments or other economic factors. The
Company’s products have product life cycles that range on
average from two to three years currently. At both the product
introduction and product discontinuation stage, there is a
higher degree of risk of inventory obsolescence. The provision
for obsolete and excess inventory is evaluated for adequacy at
each quarter end. The estimate of the provision for obsolete and
excess inventory is partially based on expected future product
sales, which are difficult to forecast for certain products.
Revenue
Recognition
The Company recognizes revenue from product sales in accordance
with the SEC Staff Accounting Bulletin No. 104,
“Revenue Recognition.” Product sales represent
the majority of the Company’s revenue. The Company
recognizes revenue from these product sales when persuasive
evidence of an arrangement exists, delivery has occurred or
services have been provided, the sale price is fixed or
determinable, and collectability is reasonably assured.
Additionally, the Company sells its products on terms which
transfer title and risk of loss at a specified location,
typically shipping point. Accordingly, revenue recognition from
product sales occurs when all factors are met, including
transfer of title and risk of loss, which typically occurs upon
shipment by the Company. If these conditions are not met, the
Company will defer revenue recognition until such time as these
conditions have been satisfied. The Company collects and remits
sales taxes in certain jurisdictions and reports revenue net of
any associated sales taxes. The Company also sells certain
products through distributors who are granted limited rights of
return for stock balancing against purchases made within a prior
90 day period, including price adjustments downwards that
the Company implements on any existing inventory. The provision
for product returns and price adjustments is assessed for
adequacy both at the time of sale and at each quarter end and is
based on recent historical experience and known customer claims.
Revenue from any engineering consulting and other services is
recognized at the time the services are rendered. The Company
accounts for its longer-term development contracts, which to
date have all been firm fixed-priced contracts, on the
percentage-of-completion
method, whereby income is recognized as work on contracts
progresses, but estimated losses on contracts in progress are
charged to operations immediately. The
percentage-of-completion
is determined using the
cost-to-cost
method. Amounts are generally billed on a monthly basis. To date
all such contracts have been less than one calendar year in
duration.
F-11
VUZIX
CORPORATION AND SUBSIDIARY
NOTES TO
CONSOLIDATED FINANCIAL
STATEMENTS — (Continued)
Tooling
and Equipment
Tooling and equipment are stated at cost. Depreciation of
tooling and equipment is provided for using the straight-line
method over the following estimated useful lives:
| |
|
|
|
|
|
Computers and Software
|
|
|
3 years
|
|
|
Manufacturing Equipment
|
|
|
5 years
|
|
|
Tooling
|
|
|
3 years
|
|
|
Furniture and Equipment
|
|
|
5 years
|
|
Repairs and maintenance costs are expensed as incurred. Asset
betterments are capitalized.
Patents
and Trademarks
The Company capitalizes the costs of obtaining its patents and
registration of Trademarks. Such costs are accumulated and
capitalized during the filing periods, which can take several
years to complete. Successful applications that result in the
granting of a patent or trademark are then amortized over
15 years on a straight-line basis. Unsuccessful
applications are written off and expensed in the fiscal period
where application is abandoned or discontinued.
Long-Lived
Assets
The Company regularly assesses all of its long-lived assets for
impairment when events or circumstances indicate their carrying
amounts may not be recoverable, in accordance with
SFAS No. 144, “Accounting for the Impairment or
Disposal of Long-Lived Assets.”
Research
and Development
Research and development costs, are expensed as incurred and
include employee related costs, office expenses, third party
design and engineering services, and new product prototyping
costs.
Shipping
and Handling Costs
Amounts charged to customers and costs incurred by the Company
related to shipping and handling are included in net sales and
cost of goods sold, respectively, in accordance with EITF Issue
No. 00-10,
“Accounting for Shipping and Handling Fees and Costs.”
Advertising
Advertising costs are expensed as incurred and recorded in
“Selling and marketing” in the Consolidated Statements
of Operations. Advertising expense amounted to $1,009,992,
$893,973 and $291,800 for 2008, 2007 and 2006, respectively.
Income
Taxes
The Company accounts for income taxes in accordance with
SFAS No. 109. Accordingly, the Company provides
deferred income tax assets and liabilities based on the
estimated future tax effects of differences between the
financial and tax bases of assets and liabilities based on
currently enacted tax laws. A valuation allowance is established
for deferred tax assets in amounts for which realization is not
considered more likely than not to occur.
The Company reports any interest and penalties accrued relating
to uncertain income tax positions as a component of the income
tax provision.
F-12
VUZIX
CORPORATION AND SUBSIDIARY
NOTES TO
CONSOLIDATED FINANCIAL
STATEMENTS — (Continued)
Earnings
Per Share
Basic earnings per share is computed by dividing the net (loss)
income less accrued dividends on the Series C preferred
stock by the weighted average number of common shares
outstanding for the period. Diluted earnings per share
calculations reflect the assumed exercise of all dilutive
employee stock options applying the treasury stock method and
the conversion of any outstanding convertible preferred shares
or notes payable that
are-in-the-money,
applying the as-if-converted method. However, the assumed
exercise of stock options and warrants and the conversion of
preferred shares or notes payable are anti-dilutive, therefore
basic and diluted earnings per share are the same for all
periods. All share and per-share amounts in the accompanying
consolidated financial statements and notes to the consolidated
financial statements have been adjusted to apply the effect of
the reverse stock split
(one-for-seven)
in 2007 and the forward stock split
(eight-for-one)
in 2008.
Stock-Based
Employee Compensation
Effective January 1, 2006, the provisions of
SFAS No. 123 (revised 2004), “Share-Based
Payment,” and related interpretations were adopted.
SFAS No. 123(R) requires that compensation expense be
recognized in the consolidated financial statements for
share-based awards based on the grant-date fair value of those
awards. The Company elected to not adopt
SFAS No. 123(R) for any stock options granted prior to
December 31, 2005 which had unrecognized compensation
expense at January 1, 2006, and has instead applied it to
only new share-based awards granted subsequent to
December 31, 2005, based on the grant-date fair value
estimated in accordance with the provisions of
SFAS No. 123(R). In all cases the Company used the
fair market value of our common stock on the date of each option
grant was determined based on last most recent cash sale of
common stock in an arm’s length transaction with an
unrelated third party. During each of the last four fiscal
years, we engaged in at least one such transaction that was used
to determine the fair market value of stock-based compensation
in each year. Stock-based compensation expense includes an
estimate for pre-vesting forfeitures and is recognized over the
requisite service periods of the awards on a straight-line or
graded vesting basis, which is generally commensurate with the
vesting term. As a result of the adoption of
SFAS No. 123(R), stock-based compensation expense
associated with stock option grants of $180,298, $111,438 and
$18,418 was recorded in 2008, 2007 and 2006, respectively.
The Company issues new shares upon stock option exercises.
Please refer to Note J, Stock-based Compensation
Expense, for further information.
Fair
Value Measurements
In September 2006, the Financial Accounting Standards Board
(“FASB”) issued SFAS No. 157, “Fair
Value Measurements” (“SFAS No. 157”).
SFAS No. 157 defines fair value, establishes a
framework for measuring fair value in accordance with accounting
principles generally accepted in the United States, and expands
disclosures about fair value measurements. The Company has
adopted the provisions of SFAS No. 157 as of
January 1, 2008 for financial instruments. This standard
defines fair value, establishes a framework for measuring fair
value in generally accepted accounting principles, and expands
disclosures about fair value measurements. Further, the Company
has taken into consideration the guidance promulgated in FASB
Staff Position
No. FAS 157-3,
“Determining the Fair Value of a Financial Asset When the
Market for that Asset is Not Active,” in estimating the
fair value of its financial instruments. The adoption of
SFAS 157 was not material to the Company’s
consolidated financial statements or results of operations.
SFAS No. 157 establishes a fair value hierarchy which
prioritizes the inputs to valuation techniques used to measure
fair value. Level 1 inputs are quoted prices in active
markets for identical assets or liabilities. Level 2 inputs
are inputs other than quoted prices included in Level 1
that are directly or indirectly observable for the asset or
liability. Such inputs include quoted prices in active markets
for similar assets and liabilities, quoted prices for identical
or similar assets or liabilities in markets that are not active,
inputs other than quoted prices that are observable for the
asset or liability, or inputs derived principally from or
corroborated by observable market data by
F-13
VUZIX
CORPORATION AND SUBSIDIARY
NOTES TO
CONSOLIDATED FINANCIAL
STATEMENTS — (Continued)
correlation or other means. Level 3 inputs are unobservable
inputs for the asset or liability. Such inputs are used to
measure fair value when observable inputs are not available.
Recent
Accounting Pronouncements
In December 2007, the FASB issued SFAS No. 141(R),
“Business Combinations,” a revision to
SFAS No. 141, “Business Combinations.”
SFAS No. 141(R) provides revised guidance for
recognition and measurement of identifiable assets and goodwill
acquired, liabilities assumed and any non-controlling interest
in the acquiree at fair value. The Statement also establishes
disclosure requirements to enable the evaluation of the nature
and financial effects of a business combination.
SFAS No. 141(R) is required to be applied
prospectively to business combinations for which the acquisition
date is on or after January 1, 2009. The impact of the
adoption of SFAS 141(R) on our consolidated financial
position and results of operations will be dependent on the size
and nature of business combinations, if any, completed after the
adoption of this Statement.
In December 2007, the FASB issued SFAS No. 160,
“Non-controlling Interests in Consolidated Financial
Statements — an amendment of ARB No. 51.”
This Statement establishes accounting and reporting standards
for ownership interests in subsidiaries held by parties other
than the parent. Specifically, SFAS No. 160 requires
the presentation of non-controlling interests as equity in the
Consolidated Balance Sheets, and separate identification and
presentation in the Consolidated Statements of Income of net
income attributable to the entity and the non-controlling
interest. It also establishes accounting and reporting standards
regarding deconsolidation and changes in a parent’s
ownership interest. SFAS No. 160 is effective as of
January 1, 2009. The provisions of SFAS No. 160
are generally required to be applied prospectively, except for
the presentation and disclosure requirements, which must be
applied retrospectively. We do not expect the adoption of SFAS
No. 160 to have a material effect on our consolidated
financial statements.
In February 2008, the FASB issued FSP
FAS 157-2,
which delays the effective date of SFAS No. 157 for all
non-financial assets and non-financial liabilities, except those
that are recognized or disclosed at fair value in the
consolidated financial statements on a recurring basis (at least
annually). This FSP partially deferred the effective date of
SFAS No. 157 to fiscal years beginning after
November 15, 2008, and interim periods within those fiscal
years for items within the scope of this FSP. This FSP will be
adopted by the Company in the first quarter of fiscal year 2009,
and is not expected to have a material impact on its
consolidated financial statements.
In March 2008, the FASB issued SFAS No. 161,
“Disclosures about Derivative Instruments and Hedging
Activities, an amendment of FASB Statement No. 133.”
This statement enhances the disclosure requirements related to
derivative instruments and hedging activity to improve the
transparency of financial reporting, and is effective for fiscal
years and interim periods beginning after November 15,
2008. We do not expect the impact of adoption of SFAS
No. 161 will have a material effect on our consolidated
financial statements.
Note 3 —
Accounts Receivable, Net
Accounts receivable consisted of the following:
| |
|
|
|
|
|
|
|
|
|
December 31,
|
|
2008
|
|
|
2007
|
|
|
|
|
Accounts Receivable
|
|
$
|
1,417,870
|
|
|
$
|
2,908,224
|
|
|
Less: Allowance for Doubtful Accounts
|
|
|
(4,259
|
)
|
|
|
—
|
|
|
|
|
|
|
|
|
|
|
|
|
Net
|
|
$
|
1,413,611
|
|
|
$
|
2,908,224
|
|
|
|
|
|
|
|
|
|
|
|
F-14
VUZIX
CORPORATION AND SUBSIDIARY
NOTES TO
CONSOLIDATED FINANCIAL
STATEMENTS — (Continued)
Note 4 —
Inventories, Net
Inventories consisted of the following:
| |
|
|
|
|
|
|
|
|
|
December 31,
|
|
2008
|
|
|
2007
|
|
|
|
|
Purchased Parts and Components
|
|
$
|
2,091,734
|
|
|
$
|
1,656,093
|
|
|
Work in Process
|
|
|
130,351
|
|
|
|
197,413
|
|
|
Finished Goods
|
|
|
539,883
|
|
|
|
211,994
|
|
|
Less: Reserve for Obsolescence
|
|
|
(454,647
|
)
|
|
|
(81,035
|
)
|
|
|
|
|
|
|
|
|
|
|
|
Net
|
|
$
|
2,307,321
|
|
|
$
|
1,984,465
|
|
|
|
|
|
|
|
|
|
|
|
Note 5 —
Tooling and Equipment, Net
Tooling and equipment consisted of the following:
| |
|
|
|
|
|
|
|
|
|
December 31,
|
|
2008
|
|
|
2007
|
|
|
|
|
Tooling and Manufacturing Equipment
|
|
$
|
1,567,537
|
|
|
$
|
1,247,402
|
|
|
Computers and Software
|
|
|
522,274
|
|
|
|
463,847
|
|
|
Furniture and Equipment
|
|
|
360,695
|
|
|
|
315,091
|
|
|
|
|
|
|
|
|
|
|
|
|
|
|
$
|
2,450,506
|
|
|
$
|
2,026,340
|
|
|
Less: Accumulated Depreciation and Amortization
|
|
|
(1,624,582
|
)
|
|
|
(1,169,170
|
)
|
|
|
|
|
|
|
|
|
|
|
|
Net
|
|
$
|
825,924
|
|
|
$
|
857,170
|
|
|
|
|
|
|
|
|
|
|
|
Total depreciation expense for tooling and equipment for 2008,
2007 and 2006 was $455,412, $326,752, and $237,592, respectively.
Note 6 —
Patents and Trademarks, Net
| |
|
|
|
|
|
|
|
|
|
December 31,
|
|
2008
|
|
|
2007
|
|
|
|
|
Patents and Trademarks
|
|
$
|
899,952
|
|
|
$
|
774,314
|
|
|
Less: Amortization
|
|
|
(215,150
|
)
|
|
|
(160,430
|
)
|
|
|
|
|
|
|
|
|
|
|
|
Net
|
|
$
|
684,802
|
|
|
$
|
613,884
|
|
|
|
|
|
|
|
|
|
|
|
Total amortization expense for patents and trademarks for 2008,
2007 and 2006 was $54,720, $47,326, and $39,397, respectively.
The estimated aggregate amortization expense for each of the
next five fiscal years is $57,175.
Note 7 —
Lines of Credit
The Company has available a $100,000 line of credit secured by
the personal guarantee of an officer of the Company with
interest payable at the bank’s prime rate plus 4.24%. The
outstanding balance on the line of credit amounted to $96,040
and $78,400 at December 31, 2008 and 2007, respectively.
The prime rate at 2008 was 3.25%.
The Company also has available a $112,500 line of credit with
interest payable at the bank’s prime rate plus 1%. The line
is unsecured and personally guaranteed by an officer of the
Company. The outstanding balance on the line of credit amounted
to $106,250 and $0 at December 31, 2008 and 2007,
respectively.
F-15
VUZIX
CORPORATION AND SUBSIDIARY
NOTES TO
CONSOLIDATED FINANCIAL
STATEMENTS — (Continued)
Note 8 —
Customer Deposits
Customer deposits represents money the Company received in
advance of providing a product or engineering services to a
customer. Such deposits are short term in nature as the Company
delivers the product or engineering services to the customer
before the end of its next annual fiscal period.
Note 9 —
Accrued Expenses
Accrued expenses consisted of the following:
| |
|
|
|
|
|
|
|
|
|
December 31,
|
|
2008
|
|
|
2007
|
|
|
|
|
Accrued Wages and Related Costs
|
|
$
|
25,478
|
|
|
$
|
65,194
|
|
|
Accrued Professional Services
|
|
|
40,000
|
|
|
|
27,500
|
|
|
Accrued Warranty Obligations
|
|
|
106,865
|
|
|
|
73,064
|
|
|
Other Accrued Expenses
|
|
|
13,617
|
|
|
|
6,114
|
|
|
|
|
|
|
|
|
|
|
|
|
Total
|
|
$
|
185,960
|
|
|
$
|
171,872
|
|
|
|
|
|
|
|
|
|
|
|
The Company has warranty obligations in connection with the sale
of certain of its products. The warranty period for its products
is generally one year except in European countries where it is
two years. The costs incurred to provide for these warranty
obligations are estimated and recorded as an accrued liability
at the time of sale. The Company estimates its future warranty
costs based on product-based historical performance rates and
related costs to repair. The changes in the Company’s
accrued warranty obligations for 2008, 2007 and 2006 were as
follows:
| |
|
|
|
|
|
Accrued Warranty Obligations at January 1, 2006
|
|
$
|
15,361
|
|
|
Actual Warranty Experience
|
|
|
(28,317
|
)
|
|
Warranty Provisions
|
|
|
55,431
|
|
|
|
|
|
|
|
|
Accrued Warranty Obligations at December 31, 2006
|
|
$
|
42,475
|
|
|
Actual Warranty Experience
|
|
|
(48,710
|
)
|
|
Warranty Provisions
|
|
|
79,299
|
|
|
|
|
|
|
|
|
Accrued Warranty Obligations at December 31, 2007
|
|
$
|
73,064
|
|
|
Actual Warranty Experience
|
|
|
(71,244
|
)
|
|
Warranty Provisions
|
|
|
105,045
|
|
|
|
|
|
|
|
|
Accrued Warranty Obligations at December 31, 2008
|
|
$
|
106,865
|
|
|
|
|
|
|
|
Note 10 —
Accrued Compensation
Accrued compensation represents amounts owed to officers of the
Company for services rendered prior to 2007 that remain
outstanding. The principal is not subject to a fixed repayment
schedule, and interest on the outstanding balance is payable at
8% per annum. Interest expense related to accrued compensation
amounts to $35,608, $35,608 and $24,808 for the years ended
December 31, 2008, 2007 and 2006, respectively. Total
accrued interest on the accrued compensation was $154,753 and
$119,145 as of December 31, 2008 and 2007, respectively and
these amounts are included in Accrued Interest, under the
Long-Term Liabilities portion of the consolidated balance sheet.
F-16
VUZIX
CORPORATION AND SUBSIDIARY
NOTES TO
CONSOLIDATED FINANCIAL
STATEMENTS — (Continued)
Note 11 —
Long-Term Debt
Long-term debt consisted of the following at December 31:
| |
|
|
|
|
|
|
|
|
|
December 31,
|
|
2008
|
|
|
2007
|
|
|
|
|
Note payable to an officer of the Company. The principal is not
subject to a fixed repayment schedule, bears interest at 8% per
annum and is secured by all of the assets of the Company
|
|
$
|
209,208
|
|
|
$
|
209,208
|
|
|
During October 2008, entered into an agreement with an officer
of the Company, whereby the officer agrees to make loans from
time to time to the Company through December 31, 2010,
accruing interest on the outstanding balance at 12%, secured by
all of the assets of the Company
|
|
|
95,000
|
|
|
|
—
|
|
|
Bridge loans in the original amount of $15,000 to stockholders
of the Company with no fixed date of repayment, accruing
interest at 7.5% and are unsecured. The Company has granted
holders the same conversion terms as the $60,000 in notes below
|
|
|
15,000
|
|
|
|
15,000
|
|
|
Convertible promissory notes in the original amount of $60,000.
These notes bear interest at 8% and are unsecured. There is no
set date of repayment
|
|
|
60,000
|
|
|
|
60,000
|
|
|
Convertible Notes payable bearing interest at 10% and is secured
by all the assets of the Company
|
|
|
500,000
|
|
|
|
500,000
|
|
|
|
|
|
|
|
|
|
|
|
|
|
|
$
|
879,208
|
|
|
$
|
784,208
|
|
|
Less: Amount Due Within One Year
|
|
|
500,000
|
|
|
|
—
|
|
|
|
|
|
|
|
|
|
|
|
|
Amount Due After One Year
|
|
$
|
379,208
|
|
|
$
|
784,208
|
|
|
|
|
|
|
|
|
|
|
|
The aggregate maturities for all long-term borrowings as of
December 31, 2008 are as follows:
| |
|
|
|
|
|
|
|
|
|
|
|
|
|
|
|
|
|
|
|
|
|
|
|
|
|
|
|
2009
|
|
|
2010
|
|
|
2011
|
|
|
2012
|
|
|
2013
|
|
|
Thereafter
|
|
|
Total
|
|
|
|
|
$
|
500,000
|
|
|
$
|
95,000
|
|
|
$
|
—
|
|
|
$
|
—
|
|
|
$
|
—
|
|
|
$
|
284,208
|
|
|
$
|
879,208
|
|
|
|
|
|
|
|
|
|
|
|
|
|
|
|
|
|
|
|
|
|
|
|
|
|
|
|
|
|
Include above are convertible promissory notes and bridge loans
that the Company has issued. The notes and loans may be
converted into the Company’s common stock at $0.0571 per
share. Unpaid, accrued interest on these notes and loans amounts
to $48,717 and $40,085 at December 31, 2008 and 2007,
respectively. The total potential conversions of these notes and
loans along with accrued interest amounted to 2,144,522 and
2,013,078 shares at December 31, 2008 and 2007,
respectively.
Included above is a $500,000 convertible note payable due to a
related party. The note may be converted into the Company’s
common stock at $0.2333 per share. Unpaid accrued interest on
this note amounted to $114,247 and $64,110 at December 31,
2008 and 2007, respectively. The total potential note conversion
along with accrued interest amounted to 2,632,454 and
2,417,584 shares at December 31, 2008 and 2007,
respectively. This note was due January 31, 2009 and was
still outstanding as of June 30, 2009. The interest rate
has changed to 18% onwards and the note principal is now being
rolled-over on a month to month basis.
F-17
VUZIX
CORPORATION AND SUBSIDIARY
NOTES TO
CONSOLIDATED FINANCIAL
STATEMENTS — (Continued)
Note 12 —
Capital Lease Obligations
The Company maintains equipment held under capital lease
obligations due in monthly installments ranging from $95 to
$2,811 including interest at rates ranging from 0.00% to 20.08%.
The related equipment is collateral to the leases. Final
payments are due through September, 2011.
| |
|
|
|
|
|
|
|
|
|
December 31,
|
|
2008
|
|
|
2007
|
|
|
|
|
Total Principal Payments
|
|
$
|
320,128
|
|
|
$
|
418,830
|
|
|
Less: Amount Due Within One Year
|
|
|
(139,800
|
)
|
|
|
(171,778
|
)
|
|
|
|
|
|
|
|
|
|
|
|
Amount Due After One Year
|
|
$
|
180,328
|
|
|
$
|
247,052
|
|
|
|
|
|
|
|
|
|
|
|
Annual requirements for retirement of the capital lease
obligations are as follows:
| |
|
|
|
|
|
December 31,
|
|
Amount
|
|
|
|
|
2009
|
|
$
|
244,610
|
|
|
2010
|
|
|
109,498
|
|
|
2011
|
|
|
30,301
|
|
|
2012
|
|
|
—
|
|
|
2013
|
|
|
—
|
|
|
|
|
|
|
|
|
Total Minimum Lease Payments
|
|
$
|
384,409
|
|
|
Less: Amount Representing Interest
|
|
|
(64,281
|
)
|
|
|
|
|
|
|
|
Present Value of Minimum Lease Payments
|
|
$
|
320,128
|
|
|
|
|
|
|
|
The following is a summary of assets held under capital leases:
| |
|
|
|
|
|
|
|
|
|
December 31,
|
|
2008
|
|
|
2007
|
|
|
|
|
Tooling and Manufacturing Equipment
|
|
$
|
390,940
|
|
|
$
|
313,657
|
|
|
Computers and Software
|
|
|
315,591
|
|
|
|
303,042
|
|
|
Furniture and Equipment
|
|
|
112,648
|
|
|
|
112,648
|
|
|
|
|
|
|
|
|
|
|
|
|
|
|
$
|
819,179
|
|
|
|
729,347
|
|
|
Less: Accumulated Depreciation
|
|
|
(490,866
|
)
|
|
|
(286,127
|
)
|
|
|
|
|
|
|
|
|
|
|
|
Net
|
|
$
|
328,313
|
|
|
$
|
443,220
|
|
|
|
|
|
|
|
|
|
|
|
Depreciation expense related to the assets under capital lease
amounted to $204,739, $175,114, and $98,043 for years ended
December 31, 2008, 2007, and 2006, respectively.
Note 13 —
Income Taxes
The Company files U.S. federal, and U.S. state tax
returns. At December 31, 2008, the Company had unrecognized
tax benefits totaling $2,962,000, of which would have a
favorable impact on our tax provision (benefit), if recognized.
Pre-tax earnings consisted of the following for the years ended
December 31, 2008, 2007 and 2006:
| |
|
|
|
|
|
|
|
|
|
|
|
|
|
December 31,
|
|
2008
|
|
|
2007
|
|
|
2006
|
|
|
|
|
Total Pre-Tax (Loss) Earnings
|
|
$
|
(4,888,987
|
)
|
|
$
|
(3,157,886
|
)
|
|
$
|
(716,254
|
)
|
|
|
|
|
|
|
|
|
|
|
|
|
|
|
F-18
VUZIX
CORPORATION AND SUBSIDIARY
NOTES TO
CONSOLIDATED FINANCIAL
STATEMENTS — (Continued)
The provision (benefit) for income taxes was as follows:
| |
|
|
|
|
|
|
|
|
|
|
|
|
|
December 31,
|
|
2008
|
|
|
2007
|
|
|
2006
|
|
|
|
|
Current Income Tax Provision (Benefit)
|
|
|
|
|
|
|
|
|
|
|
|
|
|
Federal
|
|
$
|
—
|
|
|
$
|
—
|
|
|
$
|
—
|
|
|
State
|
|
|
5,212
|
|
|
|
(98,372
|
)
|
|
|
3,700
|
|
|
Net Change in Liability for Unrecognized Tax Benefits
|
|
|
—
|
|
|
|
—
|
|
|
|
—
|
|
|
|
|
$
|
5,212
|
|
|
$
|
(98,372
|
)
|
|
$
|
3,700
|
|
|
Deferred Provision (Benefit)
|
|
|
—
|
|
|
|
—
|
|
|
|
—
|
|
|
|
|
|
|
|
|
|
|
|
|
|
|
|
|
Total Provision (Benefit)
|
|
$
|
5,212
|
|
|
$
|
(98,372
|
)
|
|
$
|
3,700
|
|
|
|
|
|
|
|
|
|
|
|
|
|
|
|
A reconciliation of the statutory U.S. federal income tax
rate to the effective rates is as follows:
| |
|
|
|
|
|
|
|
|
|
|
|
|
|
December 31,
|
|
2008
|
|
|
2007
|
|
|
2006
|
|
|
|
|
Federal Income Tax at Statutory Rate
|
|
|
34.0
|
%
|
|
|
34.0
|
%
|
|
|
34.0
|
%
|
|
State Tax Provision, Net of Federal Benefit
|
|
|
—
|
|
|
|
(0.3
|
)%
|
|
|
(0.2
|
)%
|
|
Meals and Entertainment
|
|
|
(0.30
|
)%
|
|
|
(0.3
|
)%
|
|
|
(0.8
|
)%
|
|
Stock Compensation Expense
|
|
|
(1.3
|
)%
|
|
|
(1.2
|
)%
|
|
|
(0.9
|
)%
|
|
Research and Development Credits
|
|
|
(2.1
|
)%
|
|
|
(2.5
|
)%
|
|
|
(6.2
|
)%
|
|
Other
|
|
|
—
|
|
|
|
—
|
|
|
|
(0.2
|
)%
|
|
|
|
|
|
|
|
|
|
|
|
|
|
|
|
Effective Tax Rate
|
|
|
30.3
|
%
|
|
|
29.7
|
%
|
|
|
25.7
|
%
|
|
Change in Valuations Allowance
|
|
|
(30.3
|
)%
|
|
|
(29.7
|
)%
|
|
|
(25.7
|
)%
|
|
|
|
|
|
|
|
|
|
|
|
|
|
|
|
Net Effective Tax Rate
|
|
|
0.0
|
%
|
|
|
0.0
|
%
|
|
|
0.0
|
%
|
|
|
|
|
|
|
|
|
|
|
|
|
|
|
F-19
VUZIX
CORPORATION AND SUBSIDIARY
NOTES TO
CONSOLIDATED FINANCIAL
STATEMENTS — (Continued)
Deferred tax assets (liabilities) consist of the following:
| |
|
|
|
|
|
|
|
|
|
December 31,
|
|
2008
|
|
|
2007
|
|
|
|
|
Assets
|
|
|
|
|
|
|
|
|
|
Current
|
|
|
|
|
|
|
|
|
|
Inventory and Inventory Related Items
|
|
$
|
68,000
|
|
|
$
|
12,000
|
|
|
Bad Debt and Note Receivable Reserves
|
|
|
1,000
|
|
|
|
—
|
|
|
Non-Current
|
|
|
|
|
|
|
|
|
|
Net Operating Loss Carryforwards
|
|
|
1,825,000
|
|
|
|
1,235,000
|
|
|
Stock Compensation Expense
|
|
|
—
|
|
|
|
—
|
|
|
Tax Credit Carryforwards
|
|
|
946,000
|
|
|
|
656,000
|
|
|
Depreciation
|
|
|
—
|
|
|
|
—
|
|
|
Other
|
|
|
122,000
|
|
|
|
102,000
|
|
|
|
|
|
|
|
|
|
|
|
|
Total Gross Deferred Tax Assets
|
|
$
|
2,962,000
|
|
|
$
|
2,005,000
|
|
|
Valuation Allowance — 100%
|
|
|
(2,962,000
|
)
|
|
|
(2,005,000
|
)
|
|
|
|
|
|
|
|
|
|
|
|
Total Net Deferred Tax Assets
|
|
$
|
—
|
|
|
$
|
—
|
|
|
|
|
|
|
|
|
|
|
|
|
Liabilities
|
|
|
|
|
|
|
|
|
|
Current
|
|
|
|
|
|
|
|
|
|
New York State Refund
|
|
$
|
(19,000
|
)
|
|
$
|
—
|
|
|
|
|
|
|
|
|
|
|
|
|
Total Gross Deferred Tax Liabilities
|
|
|
(19,000
|
)
|
|
|
—
|
|
|
Valuation Allowance — 100%
|
|
|
19,000
|
|
|
|
—
|
|
|
|
|
|
|
|
|
|
|
|
|
Total Net Deferred Tax Liability
|
|
$
|
—
|
|
|
$
|
—
|
|
|
|
|
|
|
|
|
|
|
|
|
Net Deferred Tax
|
|
$
|
—
|
|
|
$
|
—
|
|
|
|
|
|
|
|
|
|
|
|
| |
|
|
|
|
|
|
|
|
|
December 31,
|
|
2008
|
|
|
2007
|
|
|
|
|
Net Current Deferred Tax Assets
|
|
$
|
—
|
|
|
$
|
—
|
|
|
Net Long-Term Deferred Tax Assets
|
|
$
|
—
|
|
|
$
|
—
|
|
|
|
|
|
|
|
|
|
|
|
In 2008 and 2007, the Company generated federal and state net
operating losses for income tax purposes. These federal and
state net operating loss carryforwards, which total
approximately $12,200,000 at December 31, 2008 and begin to
expire in 2018, if not utilized. Of the Company’s tax
credit carryforwards, $946,000 expire between 2017 and 2018, if
not utilized.
Deferred tax assets, including carryforwards and other
attributes, are reviewed for expected realization and a
valuation allowance is established when appropriate to reduce
the assets to their estimated net realizable value. Expected
realization of deferred tax assets is dependent upon sufficient
taxable income in the appropriate jurisdiction and period that
is also of the appropriate character. The Company has evaluated
the availability of such taxable income, the nature of its
deferred tax assets and the relevant tax laws in determining the
net realizable value of its deferred tax assets.
In addition, the calculation of our tax liabilities involves
dealing with uncertainties in the application of complex tax
regulations. As a result of the implementation of FASB
Interpretation No. 48, “Accounting for Uncertainty in
Income Taxes” (FIN 48), we recognize liabilities for
uncertain tax positions based on the two-step process prescribed
within the interpretation. The first step is to evaluate the tax
position for recognition by determining if the weight of
available evidence indicates that it is more likely than not
that the position will be sustained on audit, including
resolution of related appeals or litigation processes, if any.
The second step requires us
F-20
VUZIX
CORPORATION AND SUBSIDIARY
NOTES TO
CONSOLIDATED FINANCIAL
STATEMENTS — (Continued)
to estimate and measure the tax benefit as the largest amount
that is more than 50% likely of being realized upon ultimate
settlement. It is inherently difficult and subjective to
estimate such amounts, as this requires us to determine the
probability of various possible outcomes. We re-evaluate these
uncertain tax positions on a quarterly basis. This evaluation is
based on factors including, but not limited to, changes in facts
or circumstances, changes in tax law, effectively settled issues
under audit and new audit activity. Such a change in recognition
or measurement would result in the recognition of a tax benefit
or an additional charge to the tax provision in the period.
The following table summarizes the activity in the valuation
allowance account for 2008 and 2007:
| |
|
|
|
|
|
Balance, January 1, 2007
|
|
$
|
1,682,700
|
|
|
|
|
|
|
|
|
Additions Relating to Uncertain Future Realization of
|
|
|
|
|
|
Net Operating Losses
|
|
|
245,500
|
|
|
State Research and Development Tax Credits
|
|
|
76,800
|
|
|
|
|
|
|
|
|
Balance, December 31, 2007
|
|
$
|
2,005,000
|
|
|
|
|
|
|
|
|
Additions Relating to Uncertain Future Realization of
|
|
|
|
|
|
Net Operating Losses
|
|
|
855,000
|
|
|
State Research and Development Tax Credits
|
|
|
102,000
|
|
|
|
|
|
|
|
|
Balance, December 31, 2008
|
|
$
|
2,962,000
|
|
|
|
|
|
|
|
Note 14 —
Preferred Stock
Series A
Preferred Stock par value $0.001 (Authorized 725,000;
0 shares issued and outstanding)
Series A preferred stockholders do not have the right to
vote on any matter submitted to the stockholders of the Company
for vote, consent, or approval. The Company may at any time
redeem all or any portion of Series A preferred stock
outstanding at a price per share equal to the liquidation value.
The holders of Series A preferred stock may elect to
require the Company to redeem on or after November 20, 2007
at the liquidation value of all of the then outstanding shares
of Series A preferred Stock.
Series B
Preferred Stock par value $0.001 (Authorized 1,020,681;
0 shares issued and outstanding)
Holders of Series B preferred stock shall have voting
rights for all matters voted on by stockholders of the Company.
Each Series B preferred stockholder shall have that number
of votes equal to the number of whole common shares into which
the stockholder’s Series B preferred stock could be
converted on that date. Each share of Series B preferred
stock shall be convertible, at the option of the holder, into
fully paid and non-assessable shares of common stock at the
Conversion Ratio, as defined in the Articles of Incorporation.
The initial conversion price of Series B preferred stock
was $0.10.
Series C
Preferred Stock par value $0.001 (Authorized 500,000;
168,500 shares issued and outstanding)
Holders of Series C preferred stock shall have voting
rights for all matters voted on by stockholders of the Company.
Each Series C preferred stockholder shall have that number
of votes equal to the number of whole common shares into which
the stockholder’s Series C preferred stock could be
converted on that date. Each share of 6% Cumulative
Series C preferred stock shall be convertible, at the
option of the holder, into 34.29 shares of common stock.
The Series C preferred stock is redeemable at the option of
the Company at any time after June 30, 2007 for $10 per
share plus accrued, unpaid dividends.
F-21
VUZIX
CORPORATION AND SUBSIDIARY
NOTES TO
CONSOLIDATED FINANCIAL
STATEMENTS — (Continued)
Preferred
stock
Shares of undesignated preferred stock may be issued in one or
more series. The balance of undesignated preferred stock is
4,500,000 as at December 31, 2008. The Board of Directors
is authorized to establish and designate the different series
and to fix and determine the voting powers and other special
rights and qualifications.
Preferred
dividends
Cumulative preferred dividends on the Series C series
totaled $324,299 as of December 31, 2008 and $223,199 as of
December 31, 2007. These cumulative dividends in arrears
represented an average $1.92 per share as of December 31,
2008 and an average of $1.32 per share as of December 31,
2007. As of June 30, 2009 total accrued dividends were
$349,574 or an average of $2.07 per share.
Note 15 —
Stock Split
Effective July 16, 2008, the Company effected a stock split
of its common stock whereby each one share of Common Stock, par
value $0.001 per share, of the Company’s outstanding stock
were reclassified and changed into eight shares of Common Stock,
par value $0.001 per share.
Effective June 28, 2007 the Company effected a reverse
stock split of its common stock whereby each seven shares of
Common Stock, par value $0.001 per share, of the Company’s
outstanding stock were reclassified and changed into one share
of Common Stock, par value $0.001 per share.
Both the stock split and reverse share consolidation affected
the shares outstanding and pricing for convertible debt, stock
subscriptions, incentive stock options, stock warrants and
stockholders’ equity disclosures. All share and per-share
amounts in the accompanying consolidated financial statements
and notes to the consolidated financial statements have been
adjusted to apply the effect of the reverse stock split
(one-for-seven)
in 2007 and the forward stock split
(eight-for-one)
in 2008.
Note 16 —
Stock Warrants
During 2007, the Company issued warrants to purchase
2,521,656 shares, respectively, of common stock to the
parties who helped secure financing. The exercise price was
$0.20 per share.
In exchange for services performed by vendors who worked at a
reduced rate, warrants were issued during to purchase 380,699
and 317,032 shares in 2008 and 2007, respectively, of
common stock. The exercise prices range from $0.00875 to $0.20
per share.
During 2008, 1,552,936 warrants were exercised at a price of
$.00875 per share.
The following table shows the various changes in warrants for
the years December 31, 2008 and 2007.
| |
|
|
|
|
|
|
|
|
|
December 31,
|
|
2008
|
|
|
2007
|
|
|
|
|
Warrants Outstanding, Beginning of Year
|
|
|
6,171,008
|
|
|
|
3,509,456
|
|
|
Exercised During the Year
|
|
|
(1,552,936
|
)
|
|
|
(177,136
|
)
|
|
Issued During the Year
|
|
|
380,699
|
|
|
|
2,838,688
|
|
|
Forfeited During the Year
|
|
|
—
|
|
|
|
—
|
|
|
|
|
|
|
|
|
|
|
|
|
Warrants Outstanding, End of Year
|
|
|
4,998,771
|
|
|
|
6,171,008
|
|
|
|
|
|
|
|
|
|
|
|
The outstanding warrants as of December 31, 2008 expire
from August 10, 2010 to December 31, 2013. The
weighted average remaining contractual term on the warrants is
2.7 years. The weighted average exercise price is $0.1401
per share.
F-22
VUZIX
CORPORATION AND SUBSIDIARY
NOTES TO
CONSOLIDATED FINANCIAL
STATEMENTS — (Continued)
During 2006, pursuant to a convertible note payable, a warrant
was issued that would only be exercisable if the note holder
converted their note along with any unpaid accrued interest. The
exercise price if this warrant came into effect would be $0.35
per share and the warrant would have to be exercised within
three years of the conversion date. Excluding accrued interest,
the conversion of the principal of the note and exercise of the
resulting warrant would result in the issuance of up to
1,071,444 shares. This warrant is not included in the
totals above.
Note 17 —
Stock Option Plans
The Company has an Incentive Stock Option Plan (the
“Plan”) that allows for the granting of both Qualified
and Non-Qualified Stock Options as defined under the Internal
Revenue Code regulations. The total authorized number of shares
under the plan is 45,714,286. For Non-Qualified Stock Options,
the Company may grant options that provide for the issuance of
Common Shares of $0.001 at prices below fair market value at the
date of grant. For Qualified Options grants, the option issuance
price may not be less than fair market value at the date of
grant. The Plan gives the Board of Directors of the Company the
ability to determine vesting periods for all options granted
under the Plan, and allows option terms to be up to ten years
from the original grant date. Employees’ incentive stock
options must vest at a minimum rate of 20% per year over a five
year period, commencing on the date of grant. Most vest ratably
over four years commencing on the date of the option grant. In
the case of directors, such options are granted annually and
they expire ten years after the date of their grant and vest
ratably, on a monthly basis, over the next 12 months.
Advisors or consultants can have vesting range from
100 percent of the option grants vesting immediately to
ratably, on a monthly basis, over the next a period of up to
48 months.
The following table summarizes stock option activity for the
three years ended December 31, 2008:
| |
|
|
|
|
|
|
|
|
|
|
|
|
|
|
|
|
|
|
Weighted
|
|
|
|
|
|
|
|
Number of
|
|
|
Average
|
|
|
Exercise Price
|
|
|
|
|
Shares
|
|
|
Exercise Price
|
|
|
Range
|
|
|
|
|
Outstanding at January 1, 2006
|
|
|
11,783,648
|
|
|
$
|
0.02916
|
|
|
$
|
0.0061 – $ 0.2334
|
|
|
Granted
|
|
|
1,601,800
|
|
|
$
|
0.2318
|
|
|
$
|
0.2275 – $ 0.2334
|
|
|
Exercised
|
|
|
(22,857
|
)
|
|
$
|
0.02275
|
|
|
|
$0.02275
|
|
|
Expired or Forfeited
|
|
|
—
|
|
|
|
—
|
|
|
|
$ —
|
|
|
|
|
|
|
|
|
|
|
|
|
|
|
|
|
Outstanding at December 31, 2006
|
|
|
13,362,591
|
|
|
$
|
0.05266
|
|
|
$
|
0.0061 – $ 0.2334
|
|
|
Granted
|
|
|
1,772,584
|
|
|
$
|
0.2189
|
|
|
$
|
0.2000 – $ 0.2334
|
|
|
Exercised
|
|
|
(402,483
|
)
|
|
$
|
0.01137
|
|
|
$
|
0.0087 – $0.02889
|
|
|
Expired or Forfeited
|
|
|
(185,742
|
)
|
|
$
|
0.02889
|
|
|
|
$0.02889
|
|
|
|
|
|
|
|
|
|
|
|
|
|
|
|
|
Outstanding at December 31, 2007
|
|
|
14,546,950
|
|
|
$
|
0.07254
|
|
|
$
|
0.0061 – $ 0.2334
|
|
|
Granted
|
|
|
1,917,288
|
|
|
$
|
0.1846
|
|
|
$
|
0.15 – $ 0.20
|
|
|
Exercised
|
|
|
(2,450,888
|
)
|
|
$
|
0.00694
|
|
|
$
|
0.0.6123 – $ 008750
|
|
|
Expired or Forfeited
|
|
|
(934,336
|
)
|
|
$
|
0.1949
|
|
|
$
|
0.20 – $ 0.2334
|
|
|
|
|
|
|
|
|
|
|
|
|
|
|
|
|
Outstanding at December 31, 2008
|
|
|
13,079,014
|
|
|
$
|
0.0914
|
|
|
$
|
0.0061 – $ 0.2334
|
|
|
|
|
|
|
|
|
|
|
|
|
|
|
|
As of December 31, 2008, there were 9,582,619 options that
were fully vested and exercisable at weighted average exercise
price of $0.0594 per share. The weighted average remaining
contractual term on the vested options is 5.7 years.
The unvested balance of 3,496,395 options as of
December 31, 2008, vest ratably over less than the next
46 months.
F-23
VUZIX
CORPORATION AND SUBSIDIARY
NOTES TO
CONSOLIDATED FINANCIAL
STATEMENTS — (Continued)
The following tables summarizes stock option information at
December 31, 2008:
| |
|
|
|
|
|
|
|
|
|
|
|
|
|
Total Options Outstanding
|
|
|
|
|
|
|
|
Weighted average
|
|
|
|
|
|
|
|
|
|
|
remaining life
|
|
|
Weighted average
|
|
|
Range of exercise price
|
|
Shares
|
|
|
(yrs)
|
|
|
exercise price
|
|
|
|
|
$0.0062 to $0.0087
|
|
|
2,995,192
|
|
|
|
3.58
|
|
|
$
|
0.0076
|
|
|
$0.0227 to $0.0289
|
|
|
5,105,291
|
|
|
|
6.07
|
|
|
$
|
0.0257
|
|
|
$0.1500 to $0.2000
|
|
|
2,644,152
|
|
|
|
9.66
|
|
|
$
|
0.1889
|
|
|
$0.2100 to $0.2334
|
|
|
2,334,379
|
|
|
|
8.10
|
|
|
$
|
0.2323
|
|
|
|
|
|
|
|
|
|
|
|
|
|
|
|
|
|
|
|
13,079,014
|
|
|
|
6.59
|
|
|
$
|
0.0914
|
|
|
|
|
|
|
|
|
|
|
|
|
|
|
|
| |
|
|
|
|
|
|
|
|
|
|
|
|
|
Exercisable Options Outstanding
|
|
|
|
|
|
|
|
Weighted average
|
|
|
|
|
|
|
|
|
|
|
remaining life
|
|
|
Weighted average
|
|
|
Range of exercise price
|
|
Shares
|
|
|
(yrs)
|
|
|
exercise price
|
|
|
|
|
$0.0062 to $0.0087
|
|
|
2,995,192
|
|
|
|
3.58
|
|
|
$
|
0.0076
|
|
|
$0.0227 to $0.0289
|
|
|
4,653,140
|
|
|
|
5.98
|
|
|
$
|
0.0255
|
|
|
$0.1500 to $0.2000
|
|
|
551,296
|
|
|
|
9.39
|
|
|
$
|
0.1935
|
|
|
$0.2100 to $0.2334
|
|
|
1,382,991
|
|
|
|
7.90
|
|
|
$
|
0.2322
|
|
|
|
|
|
|
|
|
|
|
|
|
|
|
|
|
|
|
|
9,582,619
|
|
|
|
5.70
|
|
|
$
|
0.0594
|
|
|
|
|
|
|
|
|
|
|
|
|
|
|
|
| |
|
|
|
|
|
|
|
|
|
|
|
|
|
Unvested Options Outstanding
|
|
|
|
|
|
|
|
Weighted average
|
|
|
|
|
|
|
|
|
|
|
remaining life
|
|
|
Weighted average
|
|
|
Range of exercise price
|
|
Shares
|
|
|
(yrs)
|
|
|
exercise price
|
|
|
|
|
$0.0062 to $0.0087
|
|
|
—
|
|
|
|
—
|
|
|
$
|
—
|
|
|
$0.0227 to $0.0289
|
|
|
452,151
|
|
|
|
7.00
|
|
|
$
|
0.1350
|
|
|
$0.1500 to $0.2000
|
|
|
2,092,856
|
|
|
|
9.73
|
|
|
$
|
0.1876
|
|
|
$0.2100 to $0.2334
|
|
|
951,388
|
|
|
|
8.41
|
|
|
$
|
0.2324
|
|
|
|
|
|
|
|
|
|
|
|
|
|
|
|
|
|
|
|
3,496,395
|
|
|
|
9.02
|
|
|
$
|
0.1930
|
|
|
|
|
|
|
|
|
|
|
|
|
|
|
|
The weighted average fair value of options granted during 2008
was $0.182842 with an aggregate value of $192,632. The weighted
average fair value of options granted during 2007 was $0.215918
with an aggregate total value of $224,020. The weighted average
fair value of options granted during 2006 was $0.231794 with an
aggregate total value of $246,214. There were no dividends in
any of the periods.
The number of options for our securities remaining for future
issuance (excluding options reflected above —
13,079,014 as of December 31, 2008) is 29,759,011.
Cash received from option exercises in 2008, 2007, and 2006,
amounted to $16,696, $5,730, and $520, respectively. All of the
shares issued out of common stock.
For the six month period ended June 30, 2009, new options
to purchase a total of 2,335,940 shares were granted with
an exercise price of $0.15 cents per share, all subject to
vesting over four years. During the six-month period ended
June 30, 2009, options to purchase a total of
110,400 shares were forfeited and no options were exercised.
F-24
VUZIX
CORPORATION AND SUBSIDIARY
NOTES TO
CONSOLIDATED FINANCIAL
STATEMENTS — (Continued)
With respect to any non-qualified stock options and incentive
stock options that are exercised and held for less than one
year, the Company recognizes a tax benefit upon exercise in an
amount equal to the tax effect of the difference between the
option price and the fair market value of the common stock on
the exercise date.
Note 18 —
Stock-based Compensation Expense
The table below summarizes the impact of outstanding stock
options on the results of operations for the years ended
December 31, 2008, 2007 and 2006 under the provisions of
SFAS No. 123(R):
| |
|
|
|
|
|
|
|
|
|
|
|
|
|
December 31,
|
|
2008
|
|
|
2007
|
|
|
2006
|
|
|
|
|
Stock-Based Compensation Expense:
|
|
|
|
|
|
|
|
|
|
|
|
|
|
Stock Options
|
|
$
|
180,298
|
|
|
$
|
111,438
|
|
|
$
|
18,418
|
|
|
Income Tax Benefit
|
|
|
—
|
|
|
|
—
|
|
|
|
—
|
|
|
|
|
|
|
|
|
|
|
|
|
|
|
|
|
Net Decrease in Net Income
|
|
$
|
180,298
|
|
|
$
|
111,438
|
|
|
$
|
18,418
|
|
|
|
|
|
|
|
|
|
|
|
|
|
|
|
|
Decrease in Earnings Per Share:
|
|
|
|
|
|
|
|
|
|
|
|
|
|
Basic and Diluted
|
|
$
|
0.0008
|
|
|
$
|
0.0006
|
|
|
$
|
0.0001
|
|
|
|
|
|
|
|
|
|
|
|
|
|
|
|
The Black-Scholes-Merton option pricing model was used to
estimate the fair value of share-based awards under
SFAS No. 123(R) as well as for pro forma disclosures
under SFAS No. 123. The Black-Scholes-Merton option pricing
model incorporates various and highly subjective assumptions,
including expected term and expected volatility. For valuation
purposes, stock option awards were categorized into two groups,
stock option grants to employees and stock option grants to
members of the Board of Directors.
The expected term of options granted was estimated to be the
average of the vesting term, historical exercise and forfeiture
rates, and the contractual life of the option. The expected
volatility at the grant date is estimated using historical stock
prices based upon the expected term of the options granted. The
risk-free interest rate assumption is determined using the rates
for U.S. Treasury zero-coupon bonds with maturities similar
to those of the expected term of the award being valued. Cash
dividends have never been paid and are not anticipated to be
paid in the foreseeable future. Therefore, the assumed expected
dividend yield is zero.
The following table shows the detailed assumptions used to
compute the fair value of stock options granted during 2008,
2007 and 2006:
| |
|
|
|
|
|
|
|
|
|
|
|
|
|
December 31,
|
|
2008
|
|
|
2007
|
|
|
2006
|
|
|
|
|
Expected Term (Years)
|
|
|
6.25 years
|
|
|
|
6.25 years
|
|
|
|
6.25 years
|
|
|
Volatility
|
|
|
60.9%
|
|
|
|
63.7%
|
|
|
|
63.7%
|
|
|
Risk Free Interest Rate
|
|
|
4.39%
|
|
|
|
4.39%
|
|
|
|
4.49%
|
|
|
|
|
|
|
|
|
|
|
|
|
|
|
|
SFAS No. 123(R) requires pre-vesting option
forfeitures at the time of grant to be estimated and
periodically revised in subsequent periods if actual forfeitures
differ from those estimates. Stock-based compensation expense is
recorded only for those awards expected to vest using an
estimated forfeiture rate based on historical pre-vesting
forfeiture data.
Unrecognized stock-based compensation expense was approximately
$360,612 as of December 31, 2008, relating to a total of
3,496,396 unvested stock options under the Company’s stock
option plans. This stock-based compensation expense is expected
to be recognized over a weighted average period of approximately
3.8 years.
Stock-based compensation expense for the six months ending
June 30, 2009 and 2008 was $90,065 and $90,149,
respectively.
F-25
VUZIX
CORPORATION AND SUBSIDIARY
NOTES TO
CONSOLIDATED FINANCIAL
STATEMENTS — (Continued)
Note 19 —
Stock Subscriptions Receivable
During the year ended December 31, 2002, the Company’s
Board of Directors authorized to make loans to certain senior
employees to allow them to participate in a rights offering and
purchase 32,537,135 shares of common stock at a price of
$0.0085 per share. While the loans were initially due September,
2007, the due date was extended to December 2012. The loans bear
interest at 6% and are shown as stock subscriptions receivable
in the accompanying consolidated financial statements. In the
interim period a stock subscription inclusive of gross interest
to maturity totaling $94,181 were forgiven. During 2009 a stock
subscription inclusive of gross interest to maturity totaling
$94,181 was forgiven. An adjustment to subscription receivables
of $94,181 was made along with a $81,046 non-cash wage expense
and a reduction of $13,145 in Additional Paid-In Capital to
reduce the unearned gross interest that was previously accrued.
Note 20 —
Commitments
The Company leases office space under an operating lease
expiring in December, 2008 requiring monthly payments of $4,200
plus insurance, taxes and common charges.
The Company leases office space under an operating lease
expiring in May, 2009 requiring monthly payments of $3,819 plus
insurance, taxes and common charges.
On June 1, 2007 the Company acquired an operating lease for
additional office space. The lease expires on June 30, 2010
and requires monthly payments of $3,973 plus insurance, taxes
and common charges.
Rent expense for the years ended December 31, 2008, 2007,
and 2006 totaled $178,657, $161,410, and $95,539, respectively.
Future minimum payments required under operating lease
obligations are as follows:
| |
|
|
|
|
|
|
|
|
|
|
|
|
|
|
|
Total Minimum
|
|
2009
|
|
2010
|
|
Lease Payments
|
|
|
|
$
|
66,765
|
|
|
$
|
23,835
|
|
|
$
|
90,600
|
|
For the lease agreements described above, the Company is
required to pay the pro rata share of the real property taxes
and assessments, expenses and other charges associated with
these facilities.
Note 21 —
Employee Benefit Plans
The Company has a Section 401(k) Savings Plan which covers
employees who meet certain age and length of service
requirements. To date the plan is comprised of 100% employee
deferrals.
Note 22 —
Litigation
The Company is not subject to any legal proceedings or claims at
the current time. The Company indemnifies its directors and
officers who are, or were, serving at the Company’s request
in such capacities. The fair value of the indemnifications that
the Company issued during 2008 was not material to the
Company’s financial position, results of operations or cash
flows.
F-26
VUZIX
CORPORATION AND SUBSIDIARY
NOTES TO
CONSOLIDATED FINANCIAL
STATEMENTS — (Continued)
Note 23 —
Product Revenue
The following table represents the Company’s total sales
for 2008, 2007 and 2006 classified by product category:
| |
|
|
|
|
|
|
|
|
|
|
|
|
|
December 31,
|
|
2008
|
|
|
2007
|
|
|
2006
|
|
|
|
|
(Restated)
|
|
|
|
|
|
|
|
|
|
|
Consumer Video Eyewear
|
|
$
|
4,451,121
|
|
|
$
|
3,282,755
|
|
|
$
|
2,022,623
|
|
|
Defense Products
|
|
|
6,397,221
|
|
|
|
1,418,249
|
|
|
|
4,888,243
|
|
|
Engineering Services
|
|
|
1,548,703
|
|
|
|
5,445,375
|
|
|
|
2,627,442
|
|
|
Low Vision Products
|
|
|
92,839
|
|
|
|
—
|
|
|
|
—
|
|
|
|
|
|
|
|
|
|
|
|
|
|
|
|
|
Total
|
|
$
|
12,489,884
|
|
|
$
|
10,146,379
|
|
|
$
|
9,538,308
|
|
|
|
|
|
|
|
|
|
|
|
|
|
|
|
The following table represents the Company’s total sales
for the three and six months ending June 30, 2008 and 2007
classified by product category:
| |
|
|
|
|
|
|
|
|
|
|
|
|
|
|
|
|
|
|
|
Three Months Ended June 30,
|
|
|
Six Months Ended June 30,
|
|
|
|
|
2009
|
|
|
2008
|
|
|
2009
|
|
|
2008
|
|
|
|
|
(Restated)
|
|
|
(Restated)
|
|
|
(Restated)
|
|
|
(Restated)
|
|
|
|
|
Consumer Video Eyewear
|
|
$
|
764,629
|
|
|
$
|
516,214
|
|
|
$
|
1,865,815
|
|
|
$
|
1,192,859
|
|
|
Defense Products
|
|
|
1,179,146
|
|
|
|
2,442,817
|
|
|
|
2,633,300
|
|
|
|
3,300,428
|
|
|
Engineering Services
|
|
|
116,864
|
|
|
|
127,006
|
|
|
|
565,355
|
|
|
|
317,994
|
|
|
Low Vision Products
|
|
|
3,094
|
|
|
|
1,301
|
|
|
|
17,617
|
|
|
|
6,701
|
|
|
|
|
|
|
|
|
|
|
|
|
|
|
|
|
|
|
|
|
Total
|
|
$
|
2,063,733
|
|
|
$
|
3,087,338
|
|
|
$
|
5,082,087
|
|
|
$
|
4,807,982
|
|
|
|
|
|
|
|
|
|
|
|
|
|
|
|
|
|
|
|
Note 24 —
Concentrations
For 2008, 2007, and 2006, one customer accounted for
approximately 20%, 17% and 42% of sales, respectively and sales
to the U.S. government accounted for approximately 12% 54%,
and 27%, respectively.
Accounts receivable from the U.S. government accounted for
31% and 19% of accounts receivable at December 31, 2008 and
2007, respectively and the other one customer mentioned above
represented 6% and 39% of accounts receivable at
December 31, 2008 and 2007, respectively.
Note 25 —
Related Party Transactions
During 2008, $2,472,824 and $827,307 of revenues and purchases,
respectively were derived from a minority stockholder (less than
5%) of the Company who also represented $90,606 of the accounts
receivable balance and $— nil of the accounts payable
balance at December 31, 2008.
During 2007, $1,737,285 and $2,009,500 of revenues and
purchases, respectively were derived from a minority stockholder
(less than 5%) of the Company who also represented $1,145,472 of
the accounts receivable balance and $1,493,956 of the accounts
payable balance at December 31, 2007.
During 2006, $4,006,324 and $620,727 of revenues and purchases,
respectively were derived from a minority stockholder (less than
5%) of the Company who also represented $359,068 of the accounts
receivable balance and $164,510 of the accounts payable balance
at December 31, 2006.
Included in long-term debt is a note payable to an officer of
the Company. Interest expense related to the note payable amount
to $16,737 for the years ended December 31, 2008 and 2007.
Total accrued interest on the note payable was $100,449 as of
December 31, 2008. See Note 11 for details.
F-27
VUZIX
CORPORATION AND SUBSIDIARY
NOTES TO
CONSOLIDATED FINANCIAL
STATEMENTS — (Continued)
Included in long-term debt are bridge loans payable and
convertible notes payable to related parties, minority
stockholders owning less than 1% of the Company. Interest
expense related to these loans payable amounted to $48,717,
$40,085, and $32,056 for the years ended December 31, 2008,
2007 and 2006, respectively.
The Company has accrued compensation owed to officers of the
Company. Interest expense related to accrued compensation
amounts to $35,608, $35,608 and $24,808 for the years ended
December 31, 2008, 2007 and 2006, respectively. Total
accrued interest on the accrued compensation was $154,753 as of
December 31, 2008. See Note 10 for details.
Note 26 —
Current and Prior-Period Restatements and
Reclassifications
The accompanying consolidated financials for 2008 and the
interims periods ending June 30, 2009 and 2008 have been
restated after their initial release to reclass recorded sales
discounts. These reclasses only affected the reported sales and
cost of sales numbers for those periods and had no overall
effect on the net losses reported or any other of the financial
statements. The sales numbers in Note 23 have been restated
by the same amounts. The changes were as follows:
| |
|
|
|
|
|
|
|
|
|
|
|
|
|
|
|
|
|
|
|
|
|
|
|
Year
|
|
|
3 Months
|
|
|
3 Months
|
|
|
6 Months
|
|
|
6 Months
|
|
|
|
|
Ending
|
|
|
Ending
|
|
|
Ending
|
|
|
Ending
|
|
|
Ending
|
|
|
|
|
December 31,
|
|
|
June 30,
|
|
|
June 30,
|
|
|
June 30,
|
|
|
June 30,
|
|
|
|
|
2008
|
|
|
2009
|
|
|
2008
|
|
|
2009
|
|
|
2008
|
|
|
|
|
Sales (decreases)
|
|
$
|
(74,603
|
)
|
|
$
|
(11,675
|
)
|
|
$
|
(30,171
|
)
|
|
$
|
(37,315
|
)
|
|
$
|
(30,442
|
)
|
|
Cost of Sales (decreases)
|
|
$
|
(74,603
|
)
|
|
$
|
(11,675
|
)
|
|
$
|
(30,171
|
)
|
|
$
|
(37,315
|
)
|
|
$
|
(30,442
|
)
|
|
Gross Margin — no change
|
|
|
Nil
|
|
|
|
Nil
|
|
|
|
Nil
|
|
|
|
Nil
|
|
|
|
Nil
|
|
The accompanying consolidated financials for the 2008, 2007 and
2006 and the interim periods ending June 30, 2009 and 2008
have been restated after their initial release to correct an
error in the calculation the Weighted Average Number of Common
Shares Outstanding and the reported Net Loss Per Common
Share. This had no effect on the reported net loss for any of
the periods.
| |
|
|
|
|
|
|
|
|
|
|
|
|
|
|
|
|
|
|
|
|
|
|
|
|
|
|
|
|
Weighted-
|
|
|
|
|
|
|
|
Basic and
|
|
|
Weighted-
|
|
|
average
|
|
|
|
|
Basic and
|
|
|
Diluted
|
|
|
average
|
|
|
Shares
|
|
|
|
|
Diluted
|
|
|
Loss per Share
|
|
|
Shares
|
|
|
Outstanding
|
|
|
|
|
Loss per Share
|
|
|
(As Originally
|
|
|
Outstanding
|
|
|
(As Originally
|
|
|
|
|
(Restated)
|
|
|
Reported)
|
|
|
(Restated)
|
|
|
Reported)
|
|
|
|
|
Year ending Dec 31, 2008
|
|
$
|
(0.0240
|
)
|
|
$
|
(0.0229
|
)
|
|
|
207,710,948
|
|
|
|
218,268,927
|
|
|
Year ending Dec 31, 2007
|
|
$
|
(0.0176
|
)
|
|
$
|
(0.0160
|
)
|
|
|
185,263,660
|
|
|
|
197,973,139
|
|
|
Year ending Dec 31, 2006
|
|
$
|
(0.0047
|
)
|
|
$
|
(0.0047
|
)
|
|
|
173,254,715
|
|
|
|
173,268,048
|
|
|
3 Months ending June 30, 2009
|
|
$
|
(0.0048
|
)
|
|
$
|
(0.0048
|
)
|
|
|
220,268,927
|
|
|
|
220,268,927
|
|
|
3 Months ending June 30, 2008
|
|
$
|
(0.0057
|
)
|
|
$
|
(0.0057
|
)
|
|
|
200,424,027
|
|
|
|
201,976,963
|
|
|
6 Months ending June 30, 2009
|
|
$
|
(0.0070
|
)
|
|
$
|
(0.0070
|
)
|
|
|
219,935,594
|
|
|
|
220,268,927
|
|
|
6 Months ending June 30, 2008
|
|
$
|
(0.0141
|
)
|
|
$
|
(0.0140
|
)
|
|
|
200,015,546
|
|
|
|
201,976,963
|
|
The accompanying consolidated statement of changes in
stockholders equity for the interim period ending June 30,
2009 has been restated after its initial release correct typos
with incorrect amounts. These errors had no overall effect on
the reported net loss or any other of the financial statements.
The corrections were as follows:
|
|
|
| |
•
|
Stock Compensation Expense — the amount of $90,065 was
not added correctly across the columns
|
|
|
|
| |
•
|
Adjustment of Subscription Receivable — now reflects a
($13,135) reduction in paid up capital and correctly adds across
as previously the total was missing,
|
F-28
VUZIX
CORPORATION AND SUBSIDIARY
NOTES TO
CONSOLIDATED FINANCIAL
STATEMENTS — (Continued)
|
|
|
| |
•
|
Balance — June 30, 2009 — The ending
amount of Additional Paid-In Capital has been reduced by $1 to
$12,979,093 to correct an addition error and the ending total of
Subscription Receivable has the correct total of $227,336.
|
The accompanying consolidated balance sheet as at June 30,
2008 has been restated to correct an error recognized after its
initial release. The change involves a typographical error in
the
sub-total
line item, Total Long-Term Liabilities. The amount was revised
to $1,606,559.
The accompanying consolidated financials for 2007 have been
restated to correct errors recognized after their initial
release. These changes include the correction of the warranty
reserve of $73,064; a reduction of depreciation expense of
$15,346; and the accrual of an income tax benefit from research
and development tax credits of $130,130. The effect of these
restatements is an overall decrease in the net loss in the
amount of $72,412 for 2007. There was also a reclassification of
expenses of $499,237 between the cost of sales and operating
expense classifications for consistency across the periods. This
had no effect on the reported net loss.
The accompanying Notes to the consolidated financial statements
have been restated to correct errors recognized after their
initial release. By Note number they are:
|
|
|
| |
•
|
Note 11 — The conversion price of the $500,000
Note Payable has been corrected to $0.2333 per share.
|
|
|
|
| |
•
|
Note 11 — The total number of common shares that
would be potentially issued on conversion as of
December 31, 2008 and 2007 has been corrected to 2,632,454
and 2,417,584 respectively.
|
|
|
|
| |
•
|
Note 16 — The warrant exercise termination date
was incorrectly listed as September 31, 2009 but instead
this warrant, if it came into effect would be exercisable at
$0.35 per share for 36 months after the date of conversion.
|
|
|
|
| |
•
|
Note 16 — The number of shares that could be
issued upon the conversion of the principal of the note and the
exercise of the resulting warrants has been corrected to
1,071,444 (previously 1,071,225).
|
F-29
Up to
50,000,000 Units
Minimum Offering of
Cdn$6,000,000
PROSPECTUS
Until ,
2009, all dealers that effect transactions in these securities,
whether or not participating in this offering, may be required
to deliver a prospectus. This requirement is in addition to the
dealers’ obligation to deliver a prospectus when acting as
agents and with respect to their unsold allotments or
subscriptions.
,
2009
Alternate page for Canadian Prospectus
Amended and
restated preliminary base PREP prospectus amending and restating
the amended and restated preliminary base PREP prospectus dated
September 4, 2009, which amended and restated the
preliminary prospectus dated June 30, 2009.
A copy of
this amended and restated preliminary base PREP prospectus has
been filed with the securities regulatory authorities in each of
the provinces of Canada other than Québec but has not yet
become final for the purpose of the sale of securities.
Information contained in this amended and restated preliminary
base PREP prospectus may not be complete and may have to be
amended. The securities may not be sold until a receipt for the
prospectus is obtained from the securities regulatory
authorities.
This
prospectus has been filed under procedures in each of the
provinces of Canada other than Québec that permit certain
information about these securities to be determined after the
prospectus has become final and that permit the omission of that
information from this prospectus. The procedures require the
delivery to purchasers of a supplemented PREP prospectus
containing the omitted information within a specified period of
time after agreeing to purchase any of these securities. All
disclosure contained in a supplemented PREP prospectus that is
not contained in the base PREP prospectus will be incorporated
by reference into the base PREP prospectus as of the date of the
supplemented PREP prospectus.
This prospectus constitutes a
public offering of these securities only in those jurisdictions
where they may be lawfully offered for sale and therein only by
persons permitted to sell such securities. No securities
regulatory authority has expressed an opinion about these
securities and it is an offence to claim otherwise. Vuzix
Corporation has filed a registration statement on
Form S-1
with the United States Securities and Exchange Commission under
the United States Securities Act of 1933, as amended, with
respect to these securities. See “Plan of
Distribution”.
AMENDED AND RESTATED PRELIMINARY BASE PREP PROSPECTUS
|
|
| Initial
Public
Offering
|
October 16,
2009
|
VUZIX CORPORATION
A Maximum Offering of
$12,500,000
A Minimum Offering of
$6,000,000
Up to 50,000,000
Units
(each Unit consisting of one share of common stock and
one-half of one common stock purchase warrant)
This prospectus qualifies the
distribution (the “Offering”) of a maximum of
Cdn$12,500,000 worth of units (the “Units”) in
the capital of Vuzix Corporation (“Vuzix”,
the “Company”, “us” or “we”)
(the “Maximum Offering”) and a minimum of
Cdn$6,000,000 worth of Units (the “Minimum Offering”),
at a price of
Cdn$ l
per Unit (the “Offering Price”). Each Unit is
comprised of one share of our common stock, with a par value of
US$0.001 per share (each, a “Share” and collectively,
the “Shares”) and one-half of one common stock
purchase warrant (each whole warrant being a
“Warrant”). The Warrants will be created and issued
pursuant to the terms of a warrant indenture (the “Warrant
Indenture”) dated as of the closing date between us and
Computershare Trust Company of Canada, as warrant agent
thereunder. Each Warrant will entitle its holder to purchase one
share of our common stock at a price per share equal to 150% of
the Offering Price at any time for 36 months after the
closing date of the Offering (the “Warrant Expiry
Time”), provided that if at any time the market price of
the shares of our common stock issuable exceeds 250% of the
Offering Price, the Company shall have the right and option,
exercisable at its sole discretion, to accelerate the Warrant
Expiry Time. The Units are being offered concurrently in each of
the provinces of Canada other than Québec pursuant to this
prospectus and in the United States pursuant to a registration
statement on
Form S-1
(the “U.S. Prospectus”) filed with the United States
Securities and Exchange Commission. The full text of the U.S.
Prospectus is included in and forms a part of this prospectus.
We have engaged Canaccord Capital Corporation and Bolder
Investment Partners, Ltd. (collectively,
the “Agents”) to act as our agents in connection
with the sale of the Units on a best efforts basis. Subject to
compliance with applicable laws, the Offering Price of the
Units will be determined by negotiation between us and the
Agents. In connection with the Offering, the Agents may
over-allot or effect transactions which stabilize or maintain
the market price of the shares at levels other than those which
may otherwise exist in the open market.
See “Plan of Distribution”.
There is currently no market
through which the Units or the Shares and Warrants comprising
the Units may be sold and purchasers may not be able to resell
the Shares or Warrants purchased under this prospectus. This may
affect the pricing of the securities in the secondary market,
the transparency and availability of trading prices, the
liquidity of the securities and the extent of issuer regulation.
An investment in the Units is subject to a number of risks that
should be considered by a prospective purchaser. Investors
should carefully consider the risk factors described under
“Risk Factors” in the U.S. Prospectus before
purchasing the Units. We have applied to list the shares of our
common stock (including the Shares) and Warrants on the TSX
Venture Exchange (the
“TSX-V”).
Listing of the shares (including the Shares) and Warrants will
be subject to us fulfilling all of the listing requirements of
the TSX-V
and, in the case of the Warrants, distribution to a minimum
number of public security holders.
PRICE
CDN$ l
PER UNIT
| |
|
|
|
|
|
|
|
|
|
Price to the
Public(1)
|
|
Agents’
Commissions(3),(4)
|
|
Net Proceeds to
Vuzix(5)
|
|
Per Unit
|
|
Cdn$ l (2)
|
|
Cdn$ l
|
|
Cdn$ l
|
|
Maximum Offering
|
|
Cdn$12,500,000
|
|
Cdn$1,000,000
|
|
Cdn$11,500,000
|
|
Minimum Offering
|
|
Cdn$6,000,000
|
|
Cdn$480,000
|
|
Cdn$5,520,000
|
Notes
|
|
| (1)
|
Based on negotiation with the Agents, the Company anticipates
offering the Units at a price between Cdn$0.15 and Cdn$0.25.
|
| |
| (2)
|
For the Company’s purposes,
Cdn$ l
of the Offering Price for each Unit will be allocated to each
Share and
Cdn$ l
of the Offering Price for each Unit will be allocated to each
half Warrant
(Cdn$ l
for each whole Warrant).
|
| |
| (3)
|
We have retained the Agents to solicit subscriptions for the
Units on a best efforts basis. As consideration for their
services, the Agents will receive: (i) a commission equal
to 8% of the gross proceeds of the Offering; (ii) options
(the “Compensation Options”) entitling the Agents to
purchase that number of Shares and Warrants equal to 12.5% of
the aggregate number of Shares and Warrants sold under the
Offering, at the Offering Price per Share and Warrant, for a
period of 12 months from the closing date; and (iii) a
due diligence fee of Cdn$15,000. The Agents will also be
reimbursed for their reasonable fees and expenses including the
reasonable legal fees and disbursements of legal counsel to the
Agents. This prospectus also qualifies the distribution of that
number of Compensation Options entitling the Agents to acquire
up to 10% of the Shares and Warrants sold under the Offering.
The distribution of the balance of the Compensation Options
(entitling the Agents to acquire up to 2.5% of the number of
Shares and Warrants sold under the Offering) is not qualified
under this prospectus and such securities will be issued to the
Agents pursuant to exemptions from the prospectus and
registration requirements of applicable securities legislation
and will be subject to resale restrictions under applicable
securities legislation.
|
| |
| (4)
|
In consideration of certain fiscal advisory services rendered by
the Agents to us pursuant to a fiscal advisory fee agreement
between us and the Agents dated June 29, 2009 (the
“Fiscal Advisory Fee Agreement”), we have agreed to
issue to the Agents that number of shares of our common stock
equal to, depending on the gross proceeds of the Offering,
between 1.0% and 2.0% of the number of issued and outstanding
shares of our common stock outstanding on the closing of the
Offering. The distribution of these shares to the
|
(Continued on the next
page)
Alternate page for Canadian Prospectus
(Continued from previous
page)
Agents pursuant to the Fiscal Advisory Fee Agreement is not
qualified by this prospectus. Such shares will be issued
pursuant to exemptions from the prospectus and registration
requirements of applicable securities legislation and will be
subject to resale restrictions under applicable securities
legislation. See “Material Contracts”.
|
|
| (5) |
Before deducting the expenses of the Offering estimated at
Cdn$546,000 which, together with the Agents’ commission and
fees, will be paid by us out of the proceeds of the Offering.
|
As of the date hereof, we are an “IPO Venture Issuer”
(defined under National Instrument
41-101 as an
issuer that does not have any of its securities listed or
quoted, has not applied to list or quote any of its securities,
and does not intend to apply to list or quote any of its
securities, on the Toronto Stock Exchange, a U.S. marketplace,
or a marketplace outside of Canada and the United States of
America other than the Alternative Investment Market of the
London Stock Exchange or the PLUS markets operated by PLUS
Markets Group plc.). See “Risk Factors” in the U.S.
Prospectus. In connection with this Offering, the Agents may,
subject to applicable laws, over-allot or effect transactions
that stabilize or maintain the price of the Shares at levels
other than those which otherwise might prevail on the open
market. See “Plan of Distribution”.
The following table summarizes the options granted by us to the
Agents pursuant to the Offering:
| |
|
|
|
|
|
|
|
|
|
Maximum Number of
|
|
|
|
|
|
Agents’ Position
|
|
Securities Held
|
|
Exercise Period
|
|
Exercise Price
|
|
|
|
Compensation
Options(1)
|
|
12.5% of the number of
|
|
12 months from the
|
|
$ l per
Unit
|
|
|
|
Shares and Warrants sold
|
|
closing of the Offering
|
|
|
|
|
|
under the Offering
|
|
|
|
|
|
|
|
|
|
|
|
|
|
Total Securities under Option
|
|
l
|
|
|
|
|
Notes
|
|
| (1) |
This prospectus also qualifies the distribution of that number
of Compensation Options entitling the Agents to acquire up to
10% of the Shares and Warrants sold under the Offering. The
distribution of the balance of the Compensation Options
(entitling the Agents to acquire up to 2.5% of the number of
Shares and Warrants sold under the Offering) is not qualified
under this prospectus and such portion of the Compensation
Options will be issued to the Agents pursuant to exemptions from
the prospectus and registration requirements of applicable
securities legislation and will be subject to resale
restrictions under applicable securities legislation.
|
The Agents, as agents on behalf of the Company, conditionally
offer the Units qualified under this prospectus, subject to
prior sale, if, as and when issued by us and accepted by the
Agents in accordance with the conditions contained in the agency
agreement referred to under “Plan of Distribution” and
subject to the approval of certain legal matters on our behalf
by Wildeboer Dellelce LLP as to certain matters of Canadian law
and Boylan, Brown, Code, Vigdor & Wilson, LLP as to
certain matters of U.S. law and on behalf of the Agents by
McCullough O’Connor Irwin LLP as to certain matters of
Canadian law and Dorsey & Whitney LLP as to certain
matters of U.S. law. The Agents may offer the Units at prices
lower than stated above. See “Plan of Distribution”.
The financial statements included in this prospectus have not
been prepared in accordance with Canadian generally accepted
accounting principles and may not be comparable to financial
statements of a Canadian issuer. See “Notice to Investors
Regarding GAAP”.
Pursuant to an escrow agreement among us, Canaccord Capital
Corporation
and l ,
as escrow agent, the funds received in payment for the Units
sold in this Offering will be deposited into a non-interest
bearing escrow account and held until the closing of the
Offering. The Offering will close as soon as practicable after
gross proceeds in respect of the Minimum Offering have been
raised and deposited in the escrow account. If the Minimum
Offering is not completed on or before 90 days after the
issuance of a receipt for the final prospectus in respect of
this Offering or such other time as may be consented to by
persons who subscribed within that period, all subscription
funds will be returned to subscribers without interest or
deduction, unless the subscribers have otherwise instructed the
Agents.
Subscriptions will be received subject to rejection or allotment
in whole or in part, and the Agents reserve the right to close
the subscription books at any time without notice. It is
expected that the closing of the Offering will occur on or
about l ,
2009 or such other date as the Company and the Agents may agree,
which in any event shall not be later
than l ,
2009. One or more book-entry only certificates representing the
Shares and the Warrants, respectively, to be issued or sold in
this Offering will be issued in registered form to The Canadian
Depository for Securities Limited (“CDS”), or to its
nominee, and will be deposited with CDS on the date of closing.
A purchaser of the Units will receive only a customer
confirmation from the registered dealer through which the Units
are purchased.
Vuzix is incorporated, continued or otherwise organized under
the laws of a foreign jurisdiction. Although we have appointed
Wildeboer Dellelce Corporate Services Inc. as our agent for
service of process in Toronto, Ontario, it may not be possible
for investors to enforce judgments obtained in Canada against
us. See “Enforcement of Legal Rights”.
Unless the context requires otherwise, references to the
“Company”, “Vuzix”, “we”,
“us”, or “our” refer to Vuzix Corporation
and its subsidiary.
CDN-2
Alternate page for Canadian Prospectus
TABLE OF
CONTENTS
| |
|
|
|
|
|
Page
|
|
|
|
|
|
CDN-3
|
|
|
|
CDN-3
|
|
|
|
CDN-3
|
|
|
|
CDN-4
|
|
|
|
CDN-4
|
|
|
|
CDN-7
|
|
|
|
CDN-7
|
|
|
|
CDN-10
|
|
|
|
CDN-11
|
|
|
|
CDN-11
|
|
|
|
CDN-12
|
|
|
|
CDN-12
|
|
|
|
CDN-12
|
|
|
|
CDN-C-1
|
|
|
|
CDN-C-2
|
CURRENCY
AND EXCHANGE RATE DATA
We measure and report our financial results in U.S.
dollars. The following table sets forth, for the periods
indicated, the high, low, average and period-end noon buying
rates of exchange for one U.S. dollar in Canadian dollars
published by the Bank of Canada. Although obtained from sources
believed to be reliable, the data is provided for informational
purposes only, and the Bank of Canada does not guarantee the
accuracy or completeness of the data. No representation is made
that the U.S. dollar amounts have been, could have been or could
be converted into Canadian dollars at the noon buying rate on
such dates or any other dates.
| |
|
|
|
|
|
|
|
|
|
|
|
|
|
|
|
|
|
|
|
|
|
|
|
|
|
|
Six Month Period
|
|
|
|
|
Year Ended December 31
|
|
|
Ended June 30
|
|
|
|
|
2008
|
|
|
2007
|
|
|
2006
|
|
|
2009
|
|
|
2008
|
|
|
|
|
Highest rate during period
|
|
$
|
1.2969
|
|
|
$
|
1.1853
|
|
|
$
|
1.1726
|
|
|
$
|
1.3066
|
|
|
$
|
1.0369
|
|
|
Lowest rate during period
|
|
|
0.9719
|
|
|
|
0.9170
|
|
|
|
1.0990
|
|
|
|
1.0789
|
|
|
|
0.9711
|
|
|
Average rate during period
|
|
|
1.0660
|
|
|
|
1.0748
|
|
|
|
1.1342
|
|
|
|
1.2062
|
|
|
|
1.0070
|
|
|
Rate at the end of period
|
|
|
1.2246
|
|
|
|
0.9881
|
|
|
|
1.1653
|
|
|
|
1.1630
|
|
|
|
1.0186
|
|
On October 15, 2009, the noon buying rate of the Bank of
Canada was U.S.$1.00 = Cdn$1.0303. Unless otherwise
indicated, all Canadian dollar values have been translated to
U.S. dollars, or vice versa, using a convenience translation of
U.S.$1.00 = Cdn$1.0424, the noon buying rate of the Bank of
Canada on October 8, 2009. Unless otherwise specified, all
references to “dollars”, “U.S.$” or
“$” in this prospectus are to United States dollars
and references to “Cdn$” in this prospectus are to
Canadian dollars.
NOTICE TO
INVESTORS REGARDING GAAP
The financial statements included in this prospectus have been
prepared in accordance with U.S. generally accepted accounting
principles which differ in certain material respects from
Canadian generally accepted accounting principles. As we will
become an “SEC issuer” (as such term is defined in
National Instrument
52-107 of
the Canadian Securities Administrators), we are not required to
provide, and have not provided, a reconciliation of our
financial statements to Canadian generally accepted accounting
principles.
CONTINUOUS
DISCLOSURE
Upon the filing of the final prospectus with the securities
regulatory authorities in each of the provinces of Canada other
than Québec we will become a reporting issuer under the
securities laws of such jurisdictions that provide for a
reporting issuer regime. Pursuant to the rules of the securities
regulatory authorities of such jurisdictions, we (or, in the
case of insider reporting, our insiders) will be required to
satisfy the requirements
CDN-3
Alternate page for Canadian Prospectus
of the laws of such jurisdictions relating to continuous
disclosure, proxy solicitation and insider reporting. These laws
generally permit us to comply with certain informational
requirements applicable in the United States instead of the
continuous disclosure requirements normally applicable in such
Canadian jurisdictions, provided that the relevant documents are
filed with the securities regulatory authorities in the relevant
Canadian jurisdictions and are provided to security holders in
Canada to the extent and in the manner and within the time
required by applicable U.S. requirements.
ENFORCEMENT
OF LEGAL RIGHTS
We are incorporated under the laws of the State of Delaware in
the United States of America and, accordingly, the rights and
remedies generally available to shareholders under Canadian
corporate statutes will not be available to investors who
purchase under this prospectus. In addition, substantially all
of our assets are located outside of Canada. Although we have
appointed Wildeboer Dellelce Corporate Services Inc. as our
agent for service of process in Ontario, it may not be possible
for investors to collect from the Company judgments obtained in
courts in Canada predicated on the civil liability provisions of
applicable securities legislation in Canada.
In addition, a majority of our directors and officers and
certain of the experts named in this prospectus reside outside
of Canada. Furthermore, substantially all of the assets of such
persons may also be located outside of Canada. It may not be
possible for investors to effect service of process within
Canada upon these directors and officers and experts referred to
above. In addition, it may not be possible to enforce against
the Company’s directors and officers or certain of the
experts named in this prospectus judgments obtained in Canadian
courts predicated upon the civil liability provisions of
applicable securities legislation in Canada.
CERTAIN
CANADIAN FEDERAL INCOME TAX CONSIDERATIONS
The following is, as of the date hereof, a summary of the
principal Canadian federal income tax considerations generally
applicable to a holder of Shares and Warrants:
|
|
|
| |
•
|
who is or is deemed to be a resident of Canada,
|
| |
| |
•
|
who deals at arm’s length with us,
|
| |
| |
•
|
who is not affiliated with us,
|
| |
| |
•
|
an interest in which would not be a “tax shelter
investment” under the Income Tax Act (Canada) (the
“Tax Act”),
|
| |
| |
•
|
who is not a “financial institution” or other taxpayer
to which the “mark to market” rules in the Tax Act
apply,
|
| |
| |
•
|
who holds all Shares and Warrants solely as capital property,
|
| |
| |
•
|
who does not determine its “Canadian tax results” in a
“functional currency”, each as defined in the Tax Act,
and
|
| |
| |
•
|
for whom we are not at any material time a “foreign
affiliate” for the purposes of the Tax Act,
|
at all material times for the purposes of the Tax Act.
A Share or a Warrant will generally be considered capital
property of a holder unless the holder holds the Share or
Warrant in the course of carrying on a business of buying and
selling shares or warrants, or acquired the Shares or Warrants
in a transaction or transactions considered to be an adventure
in the nature of trade.
This summary is of a general nature only and is not
exhaustive of all Canadian federal income tax considerations
that may be relevant to a particular holder. It is not, and
should not be construed as, legal or tax advice to any
particular holder. Consequently each holder is urged to consult
the holder’s own tax advisers with respect to the legal and
tax consequences applicable to the holder’s
circumstances.
CDN-4
Alternate page for Canadian Prospectus
This summary is based on the current provisions of the Tax Act
and regulations thereunder in force as at the date hereof, all
specific proposals to amend the Tax Act and regulations
thereunder (the “Proposed Amendments”), publicly
announced by or on behalf of the Minister of Finance (Canada)
prior to the date hereof, and counsel’s understanding of
the current published administrative policies and assessing
practices of the Canada Revenue Agency (the “CRA”).
This summary assumes that the Proposed Amendments will be
enacted as currently proposed, and that there will be no other
material change to any relevant law or administrative practice,
although no assurance can be given in these respects.
Except as otherwise indicated, this summary does not take into
account or anticipate any change in any applicable law, and does
not take into account any provincial, territorial or foreign tax
law nor any income or other tax treaty, any of which may give
rise to considerations that differ significantly from the
Canadian federal income tax considerations discussed herein.
Currency
For the purposes of the Tax Act, each amount relating to a
share, including dividends, adjusted cost bases and proceeds of
disposition, must be expressed in Canadian dollars. Any relevant
amount denominated in U.S. dollars generally must be converted
into Canadian dollars based on the prevailing U.S. dollar
exchange rate at the relevant time. Holders may therefore
realize additional income, gains or losses by virtue of changes
in foreign currency exchange rates.
Acquisition
of Shares and Warrants
The total Offering Price of a Unit to a holder must be allocated
on a reasonable basis between the Share and the one-half of one
Warrant to determine the cost of each for purposes of the Tax
Act. For our purposes, we intend to allocate
Cdn$ l
of the Offering Price of each Unit as consideration for the
issue of each Share and
Cdn$ l
of the issue price of each Unit for the issue of each one-half
of one Warrant. Although we believe that this allocation is
reasonable, it is not binding on the CRA or the holder. The
holder’s adjusted cost base of each Share comprising a part
of each Unit will be determined by averaging the cost allocated
to the Shares acquired pursuant to the offering with the
adjusted cost base to the holder of all Shares owned by the
holder immediately prior to such acquisition.
Exercise
of Warrants
No gain or loss will be realized by a holder upon the exercise
of a Warrant. When a Warrant is exercised, the holder’s
cost of the share of common stock acquired thereby will be the
aggregate of the holder’s adjusted cost base of such
Warrant and the exercise price paid for the share of our common
stock. The holder’s adjusted cost base of the common stock
so acquired will be determined by averaging such cost with the
adjusted cost base to the holder of all shares of our common
stock owned by the holder immediately prior to such acquisition.
Disposition
and Expiry of Warrants
A disposition or deemed disposition by a holder of a Warrant
(other than upon the exercise thereof) will generally give rise
to a capital gain (or capital loss) equal to the amount by which
the proceeds of disposition, net of any reasonable costs of
disposition, are greater (or less) than such holder’s
adjusted cost base of the Warrants. In the event of the expiry
of an unexercised Warrant, the holder will realize a capital
loss equal to the holder’s adjusted cost base of such
Warrant. The tax treatment of capital gains and capital losses
is discussed in greater detail below under the subheading
“Capital Gains and Capital Losses”.
Disposition
of Shares
A holder who disposes or is deemed to dispose of a share of our
common stock generally will realize a capital gain (or capital
loss) equal to the amount by which the proceeds of disposition
of the share, less reasonable costs of disposition, exceed (or
are less than) the adjusted cost base of such share to the
holder. The tax treatment of capital gains and capital losses is
discussed in greater detail below under the subheading
“Capital Gains and Capital Losses”.
CDN-5
Alternate page for Canadian Prospectus
Capital
Gains and Capital Losses
The holder must include one half of any capital gain
(“taxable capital gain”) realized by a holder in
income, and may deduct one half of any capital loss
(“allowable capital loss”) against taxable capital
gains realized by a holder in the same year subject to the
detailed rules in the Tax Act limiting the deduction of capital
losses . The holder may deduct any excess of allowable capital
losses against any net taxable capital gains realized in any of
the three preceding taxation years or any subsequent taxation
year, to the extent and under the circumstances permitted in the
Tax Act. A holder resident in Canada who realizes a capital gain
on the disposition of the Shares and pays United States tax as a
result of the disposition may be eligible to claim a foreign tax
credit or deduction under the Tax Act in respect of the United
States tax payable to the extent and under the circumstances
described in the Tax Act.
A holder that is a “Canadian-controlled private
corporation” for the purposes of the Tax Act may be liable
to pay an additional refundable tax of
62/3%
on its “aggregate investment income” for the year,
which will include any net taxable capital gains. Capital gains
realized by a holder who is an individual (including most
trusts) may be subject to alternative minimum tax.
Dividends
on Shares
A holder will be required to include in income the gross amount
of any dividend, including amounts deducted for any United
States or other foreign withholding tax that may be levied on
the dividend, that the holder receives, or is deemed to receive,
on a share of common stock. The holder, if an individual
(including a trust), will not be entitled to the
gross-up and
dividend tax credit rules normally applicable to dividends
received by individuals from taxable Canadian corporations. If
the holder is a corporation, the holder will not be entitled to
deduct the amount of the dividend in computing its taxable
income.
The holder will, subject to the detailed rules in the Tax Act
governing foreign tax credits and deductions in respect of
foreign taxes, generally be entitled to claim a foreign tax
credit against federal Canadian income tax, or a deduction in
computing income, or both a foreign tax credit and a deduction,
in respect of any United States or other foreign withholding tax
levied on any such dividend.
Holders are advised to consult their own tax advisers with
respect to the availability of a foreign tax credit or deduction
in respect of any dividend received or deemed to be received on
a share of common stock.
A holder that is a “Canadian-controlled private
corporation” for the purposes of the Tax Act may be liable
to pay an additional refundable tax of
62/3%
on its “aggregate investment income” for the year,
which will include dividends on the common stock.
Foreign
Property Information Reporting
The Tax Act imposes information reporting requirements on most
Canadian residents who hold “specified foreign
property” having an aggregate cost amount of Cdn$100,000 at
any time in a taxation year or fiscal period. The Shares will be
specified foreign property for these purposes. Each holder
should consult the holder’s own tax advisers to determine
whether the holder is or may be subject to these reporting
requirements.
Proposals Regarding
Foreign Investment Entities
The Proposed Amendments contain provisions that relate to the
taxation of certain interests held by Canadian residents in
certain non-resident entities, applicable for taxation years
commencing after 2006 (the “FIE Proposals”),
notwithstanding that they have yet to be passed into law.
However, the January 27, 2009 Federal Budget announced that
the Government of Canada will review the existing FIE Proposals
in light of submissions that it has received before proceeding
with measures in the area.
Under the FIE Proposals, where a Canadian resident holds an
interest such as a Share or rights to acquire shares (such as
the Warrants), other than an “exempt interest”, in a
corporation that is a “foreign investment entity”
(a “FIE”) at the corporation’s taxation
year-end (as each of such terms is defined in the FIE
Proposals), the Canadian resident generally will be required to
include in computing income for the Canadian resident’s
taxation year that includes such year-end an amount in respect
of such interest computed in one of three ways: (a) an
imputed return
CDN-6
Alternate page for Canadian Prospectus
calculated as a prescribed percentage of the holder’s
“designated cost” of such interest; (b) in
certain circumstances, the annual accrued increase or decrease
in the fair market value of the holder’s interest; or
(c) in certain other limited circumstances, a proportionate
share of the FIE’s income or loss for the year calculated
using Canadian tax rules as specified in the FIE Proposals. For
most holders, the method described in (a) would be
applicable.
We will not, however, be a FIE at the end of a taxation year
provided that either: (a) at such time, the “carrying
value” of all of our “investment property” will
not be greater than one-half of the “carrying value”
of all our property; or (b) throughout the relevant
taxation year, our principal undertaking will have been the
carrying on of a business that is not an “investment
business”. No assurances can be given that we will not be a
FIE at the end of any of our taxation years or at any other
times.
Even if we were a FIE for purposes of the FIE Proposals at the
end of a taxation year, if the Shares or Warrants qualified as
“exempt interests” for a particular holder at that
time, the FIE Proposals would not apply in respect of such
holder’s Shares or Warrants, respectively. Generally, under
the FIE Proposals, the Shares or Warrants would be an
“exempt interest” to a particular Holder at the end of
a particular taxation year if: (a) it was reasonable to
conclude that the holder had no “tax avoidance motive”
in respect of the Shares or Warrants, respectively, at that
time; (b) throughout such period the Shares or Warrants,
respectively, were an “arm’s length interest” of
the holder; and (c) throughout such period either
(i) the Shares or Warrants, respectively, were listed on a
designated stock exchange for the purposes of the Tax Act (which
currently includes the
TSX-V) or
(ii) we were governed by and existed under the laws of a
state of the United States and were a resident of the United
States for the purposes of the
Canada-United
States Tax Convention (1980).
Holders should consult their own tax advisors regarding the FIE
Proposals generally in respect of the Shares and Warrants,
including the determination of whether or not they have a
“tax avoidance motive” and whether or not the Shares
or Warrants may at any time constitute an “exempt
interest” to a holder.
If we were a FIE, the FIE Proposals include complex provisions
to relieve against double taxation of dividend received and
amounts included in income under the FIE Proposals. Holders
should consult their own tax advisors in this regard.
AUDITORS,
TRANSFER AGENTS & REGISTRARS
Our auditors are EFP Rotenberg, LLP, an independent registered
public accounting firm, located in Rochester, New York.
The main transfer agent and registrar for our common stock is
Computershare Trust Company, N.A. at its principal office
located in Golden, Colorado. The co-transfer agent and registrar
for our common stock is Computershare Investor Services, Inc. at
its principal office located in Toronto, Ontario. The warrant
agent for our Warrants is Computershare Trust Company of Canada
at its principal office located in Toronto, Ontario.
PLAN OF
DISTRIBUTION
We will enter into an agency agreement with the Agents with
respect to the Units being offered by us (the “Agency
Agreement”). For a description of the terms of the Agency
Agreement, see “Underwriting” in the U.S. Prospectus.
This section supplements the disclosure contained under
“Underwriting” in the U.S. Prospectus.
Pursuant to the Agency Agreement, the Company has appointed the
Agents as its exclusive agent to offer Units for sale to the
public, on a best efforts basis, at a price of
Cdn$ l
per Unit, for minimum gross proceeds of Cdn$6,000,000 and
maximum gross proceeds of Cdn$12,500,000, subject to the terms
and conditions in the Agency Agreement.
Provided the Minimum Offering has been subscribed for, it is
expected that the closing will take place on or
about l ,
2009, subject to postponement, as the Agents and the Company may
agree, to a date not later than 90 days from the date of receipt
for the (final) prospectus, or such later date as may be agreed
to by the Company and the Agents with the consent of applicable
securities regulatory authorities.
CDN-7
Alternate page for Canadian Prospectus
The Agents must sell the number of Units that will result in us
achieving the Minimum Offering (Cdn$6,000,000) if any are sold.
The Agents are required to use their best efforts to sell the
maximum number of Units offered (50,000,000 units). Pursuant to
an escrow agreement among us, Canaccord Capital Corporation
and l ,
as escrow agent, the funds received in payment for the Units
sold in this Offering will be deposited into a non-interest
bearing escrow account and held until the closing of the
Offering. No funds shall be released to us until such a time as
gross proceeds in respect of the Minimum Offering are raised and
deposited in the escrow account. If the Minimum Offering is not
completed on or before 90 days after the issuance of a receipt
for the final prospectus in respect of this Offering or such
other time as may be consented to by persons who subscribed
within that period, all subscription funds will be returned to
subscribers without interest or deduction, unless the
subscribers have otherwise instructed the Agents.
The obligations of the Agents may be terminated at their
discretion on the basis of their assessment of the state of the
financial markets and may also be terminated upon the occurrence
of certain stated events.
The Offering is being made concurrently in the United States and
each of the provinces of Canada other than Québec. The
Units will be offered in the United States through those Agents
who are registered to offer the Units for sale in the United
States, either directly or indirectly through their U.S.
broker-dealer affiliates, or such other registered dealers as
may be designated by the Agents. The Units will be offered in
each of the provinces of Canada other than Québec through
those Agents who are registered to offer the Units for sale in
such provinces. Subject to applicable law, the Agents may offer
the Units outside of the United States and Canada.
Pursuant to policy statements of certain Canadian provincial
securities commissions and the Universal Market Integrity Rules
for Canadian Marketplaces, the Agents may not, throughout the
period of distribution, bid for or purchase Shares or Warrants
except in accordance with certain permitted transactions,
including market stabilization and passive market making
activities. Subject to the foregoing, the Agents may engage in
stabilizing transactions, which involve making bids for,
purchasing and selling the Shares or Warrants in the open market
for the purpose of preventing or retarding a decline in the
market price of our Shares or Warrants while the Offering is in
progress. These stabilizing transactions may include making
naked short sales of the Units or Shares, which involve the sale
by the Agents of a greater number of the Shares or Warrants than
are being sold in the Offering. A naked short position is more
likely to be created if the Agents are concerned that there may
be downward pressure on the price of the Shares or Warrants in
the open market that could adversely affect investors who
purchase in the Offering. To the extent that the Agents create a
naked short position, they will purchase the Shares or Warrants
in the open market to cover the position. These activities may
have the effect of raising or maintaining the market price of
the Shares or Warrants or preventing or retarding a decline in
the market price of the Shares or Warrants, and, as a result,
the price of the Shares or Warrants may be higher than the price
that otherwise might exist in the open market. Such
transactions, if commenced, may be discontinued at any time. The
Agents may carry out these transactions on the
TSX-V, in
the over the counter market or otherwise.
A purchaser who acquires Shares or Warrants forming part of the
Agents’ over-allocation position acquires those Shares and
Warrants under this prospectus, regardless of whether the
over-allocation position is ultimately filled through secondary
market purchases.
There is no current market through which the Shares or
Warrants may be sold and purchasers may not be able to resell
securities purchased under this prospectus. See “Risk
Factors” in the U.S. Prospectus. We have applied to
list the Shares and Warrants distributed under this prospectus
on the
TSX-V. The
listing of the Company’s shares (including the Shares) and
Warrants is subject to the Corporation fulfilling all the
listing requirements of the
TSX-V and,
in the case of the Warrants, distribution of the Warrants to a
minimum number of public security holders.
As of the date hereof, we are an “IPO Venture Issuer”
(defined under National Instrument
41-101 as an
issuer that does not have any of its securities listed or
quoted, has not applied to list or quote any of its securities,
and does not intend to apply to list or quote any of its
securities, on the Toronto Stock Exchange, a U.S. marketplace,
or a marketplace outside of Canada and the United States of
America other than the Alternative Investment Market of the
London Stock Exchange or the PLUS markets operated by PLUS
Markets Group plc.).
CDN-8
Alternate page for Canadian Prospectus
As consideration for their services, the Agents will receive:
(i) a commission equal to 8% of the gross proceeds of the
Offering; (ii) Compensation Options entitling the Agents to
purchase that number of Shares and Warrants equal to 12.5% of
the aggregate number of Shares and Warrants sold under the
Offering, at the Offering Price per Share and Warrant, for a
period of 12 months from the closing date; and (iii) a
due diligence fee of Cdn$15,000. The Agents will also be
reimbursed for their reasonable fees and expenses including the
reasonable legal fees and disbursements of legal counsel to the
Agents.
This prospectus also qualifies the distribution of that number
of Compensation Options entitling the Agents to acquire up to
10% of the Shares and Warrants sold under the Offering. The
distribution of the balance of the Compensation Options
(entitling the Agents to acquire up to 2.5% of the number of
Shares and Warrants sold under the Offering) is not qualified
under this prospectus and such portion of the Compensation
Options will be issued to the Agents pursuant to exemptions from
the prospectus and registration requirements of applicable
securities legislation and will be subject to resale
restrictions under applicable securities legislation.
In consideration of certain fiscal advisory services rendered by
the Agents to us pursuant to the Fiscal Advisory Fee Agreement,
we have agreed to issue to the Agents that number of shares of
our common stock equal to, depending on the gross proceeds of
the Offering, between 1.0% and 2.0% of the number of issued and
outstanding shares of our common stock outstanding on the
closing of the Offering. The distribution of these shares of our
common stock to the Agents pursuant to the Fiscal Advisory Fee
Agreement is not qualified by this prospectus. Such shares will
be issued pursuant to exemptions from the prospectus and
registration requirements of applicable securities legislation
and will be subject to resale restrictions under applicable
securities legislation. See “Material Contracts”.
Warrants
The Warrants will be issued in registered form under and be
governed by the terms of the Warrant Indenture. The Company
will appoint the principal transfer office of Computershare
Trust Company of Canada in Toronto, Ontario as the location at
which the Warrants may be surrendered for exercise, transfer or
exchange. The Warrant Indenture will, among other things,
include provisions for the appropriate adjustment in the class,
number and price of the shares of our common stock to be issued
upon exercise of the Warrants upon the occurrence of certain
events, including any subdivision, consolidation or
reclassification of the shares of common stock, the payment of
stock dividends and any amalgamation.
Each Warrant will entitle its holder to purchase one share of
our common stock at a price per share equal to 150% of the
Offering Price at any time until the Warrant Expiry Time,
provided that if at any time the weighted average price of the
shares of our common stock exceeds 250% of the Offering Price
for 20 consecutive days, the Company shall have the right
and option, exercisable at its sole discretion, to accelerate
the Warrant Expiry Time by providing written notice to each
registered holder of Warrants within five (5) business days and
issuing a press release to the effect that the Warrants will
expire at 5:00 p.m. (Toronto time) on the date specified in such
notice and press release, provided that such date shall not be
less than 30 days following the date of such notice and press
release.
The shares of our common stock issuable upon exercise of the
Warrants, when issued upon exercise of a Warrant, will be fully
paid and non-assessable.
The Company is not required to issue fractional shares upon the
exercise of a Warrant and the holder may not exercise one-half
of one Warrant or any other fraction thereof. The holder of a
Warrant will not possess any rights as a shareholder until the
holder exercises the Warrant.
A Warrant may be exercised upon surrender of the Warrant
certificate on or before the Warrant Expiry Time at the
principal transfer office of Computershare Trust Company of
Canada in Toronto, Ontario, with the exercise form found on the
back of the Warrant certificate completed and executed as
indicated, accompanied by payment of the exercise price (by
money order, wire transfer, bank draft or certified cheque
payable to the order of “Vuzix Corporation”) for the
number of shares of our common stock with respect to which the
Warrant is being exercised.
The foregoing discussion of material terms and provisions of the
Warrants is qualified in its entirety by reference to the
detailed provisions of the Warrant Indenture, a copy of which
will be available on www.sedar.com and a copy of which may be
obtained by contacting us.
CDN-9
Alternate page for Canadian Prospectus
PRIOR
SALES
In the past 12 months, shares of our common stock or
securities convertible or exercisable for shares of our common
stock have been issued by us as follows:
| |
|
|
|
|
|
|
|
|
|
|
|
|
|
|
|
|
|
|
|
Number of Shares
|
|
Issue Price
|
|
|
|
|
|
Nature of
|
|
of Common Stock
|
|
Per Share of
|
|
Aggregate
|
|
Date of Issuance
|
|
Securities Issued
|
|
Issued or Issuable
|
|
Common Stock
|
|
Issue Price
|
|
|
|
May 2009
|
|
options(1)
|
|
|
2,335,940
|
|
|
$
|
0.15
|
|
|
|
—
|
|
|
January 2009
|
|
shares of common stock(2)
|
|
|
2,000,000
|
|
|
$
|
0.15
|
|
|
$
|
300,000
|
|
|
January 2009
|
|
warrants(2)
|
|
|
1,000,000
|
|
|
$
|
0.20
|
|
|
|
—
|
|
|
December 2008
|
|
warrants(3)
|
|
|
120,000
|
|
|
$
|
0.01
|
|
|
|
—
|
|
|
December 2008
|
|
warrants(4)
|
|
|
11,583
|
|
|
$
|
0.15
|
|
|
|
—
|
|
|
November 2008
|
|
options(5)
|
|
|
142,864
|
|
|
$
|
0.15
|
|
|
|
—
|
|
|
November 2008
|
|
options(6)
|
|
|
446,424
|
|
|
$
|
0.15
|
|
|
|
—
|
|
|
September 2008
|
|
shares of common
stock(7)
|
|
|
444,447
|
|
|
$
|
0.15
|
|
|
$
|
66,667
|
|
|
August 2008
|
|
shares of common
stock(8)
|
|
|
2,000,000
|
|
|
$
|
0.15
|
|
|
$
|
300,000
|
|
|
July 2008
|
|
options(9)
|
|
|
1,328,000
|
|
|
$
|
0.20
|
|
|
|
—
|
|
|
July 2008
|
|
shares of common
stock(10)
|
|
|
13,364,899
|
|
|
$
|
0.15
|
|
|
$
|
2,004,735
|
|
|
July 2008
|
|
warrants(11)
|
|
|
66,667
|
|
|
$
|
0.01
|
|
|
|
—
|
|
|
June 2008
|
|
warrants(12)
|
|
|
157,504
|
|
|
$
|
0.01
|
|
|
|
—
|
|
|
June 2008
|
|
warrants(13)
|
|
|
24,945
|
|
|
$
|
0.20
|
|
|
|
—
|
|
|
June 2008
|
|
shares of common
stock(14)
|
|
|
1,552,936
|
|
|
$
|
0.01
|
|
|
$
|
15,529
|
|
Notes:
|
|
| (1)
|
Options were granted under our stock option plan to 44 employees
and are exercisable for ten years from the date of grant,
subject to vesting over four years from the date of grant.
|
| |
| (2)
|
Shares of our common stock, together with a warrant to purchase
an additional 1,000,000 shares of our common stock, were
issued to an individual investor and such warrants are
exercisable for five years from the date of issue.
|
| |
| (3)
|
Warrants were issued to a consultant in consideration for
services and are exercisable for five years from the date of
issuance.
|
| |
| (4)
|
Warrants were issued to a consultant in consideration for
services and are exercisable for five years from the date of
issuance.
|
| |
| (5)
|
Options were granted under our stock option plan to our external
director as his annual retainer for serving and are exercisable
for ten years from the date of grant, subject to vesting over
12 months from the date of grant.
|
| |
| (6)
|
Options were issued to one consultant and two employees and are
exercisable for ten years from the date of grant, subject to
vesting over four years from the date of grant.
|
| |
| (7)
|
Shares of our common stock were issued to a consultant for
services.
|
| |
| (8)
|
Shares of our common stock were issued to an individual investor.
|
| |
| (9)
|
Options were issued under our 2007 stock option plan to seven
employees and are exercisable for ten years from the date of the
grant subject to vesting over four years from the date of grant.
|
| |
| (10)
|
Shares of our common stock were issued to 46 individual and
institutional investors.
|
| |
| (11)
|
Warrants were issued to a consultant in consideration for
services and are exercisable for five years from the date of
issuance.
|
| |
| (12)
|
Warrants were issued to a consultant in consideration for
services and are exercisable for five years from the date of
issuance.
|
| |
| (13)
|
Warrants were issued to a consultant in consideration for
services and are exercisable for five years from the date of
issuance.
|
| |
| (14)
|
Shares issued to 51 investors pursuant to the exercise of then
outstanding warrants.
|
Except for the Shares and Warrants issuable pursuant to the
Offering (including the issuance of shares of our common stock
pursuant to the Fiscal Advisory Fee Agreement), and the shares
of our common stock issuable pursuant to the conversion of
outstanding convertible securities if, as and when converted by
the holders thereof, as more particularly described in the U.S.
Prospectus, we do not have a present intention to issue any
other securities.
CDN-10
Alternate page for Canadian Prospectus
MATERIAL
CONTRACTS
The only material contracts not in the ordinary course of
business entered into since the beginning of the last financial
year ending before the date of the prospectus, or before the
beginning of such financial year where such contract is still in
effect, or to be entered into, on or before the closing of the
Offering, are as follows:
|
|
|
| |
(a)
|
Warrant Indenture. See “Plan of Distribution”.
|
| |
| |
(b)
|
Shareholders Agreement dated as of October 11, 2000 by and
among Vuzix and Shareholders (as defined therein). See
“Description of Capital Stock — Registration
Rights” and Exhibit 10.9 in the U.S. Prospectus.
|
| |
| |
(c)
|
Technology Purchase and Royalty Agreement dated as of
December 23, 2005 between Vuzix and New Light
Industries, Ltd. See “Description of Capital
Stock — Registration Rights” and
Exhibit 10.12 in the U.S. Prospectus.
|
| |
| |
(d)
|
Demand Note in the original principal amount of $247,690.92 by
Vuzix to the order of Paul J. Travers. See Exhibit 10.17 in
the U.S. Prospectus.
|
| |
| |
(e)
|
Loan Agreement dated as of October 2008 by and between Vuzix and
Paul J. Travers. See Exhibit 10.18 in the U.S. Prospectus.
|
| |
| |
(f)
|
Promissory Note dated as of October 2008 issued by Vuzix to the
order of Paul J. Travers. See Exhibit 10.19 in the U.S.
Prospectus.
|
| |
| |
(g)
|
Fiscal Advisory Fee Agreement dated as of June 29, 2009 between
Vuzix and the Agents. See Exhibit 10.21 in the U.S.
Prospectus.
|
| |
| |
(h)
|
Convertible Promissory Note dated September 19, 2006 in the
original principal amount of $500,000 by Vuzix to Sally Hyde
Burdick.
|
|
|
|
| |
(i)
|
Escrow Agreement dated as of
October l ,
2009 among Vuzix, Canaccord Capital Corporation
and l ,
as escrow agent.
|
In connection with the Offering, we will also enter into the
Agency Agreement with the Agents referred to under “Plan of
Distribution”.
Copies of these agreements are attached as exhibits to the U.S.
Prospectus, are available on www.sedar.com and also may be
examined during normal business hours at the offices of our
Canadian legal counsel, Wildeboer Dellelce LLP, located at
Wildeboer Dellelce Place, Suite 800, 365 Bay Street,
Toronto, Ontario, M5H 2V1, any time during the period of
distribution of the Units under this prospectus.
ELIGIBILITY
FOR INVESTMENT
In the opinion of Wildeboer Dellelce LLP, our Canadian counsel,
and McCullough O’Connor Irwin LLP, the Canadian counsel to
the Agents, provided that the relevant provisions of the Tax Act
and the regulations thereunder remain unamended at the time that
the Shares and Warrants are listed on a designated stock
exchange for purpose of the Tax Act (which currently includes
the TSX-V),
the Shares, if and when listed on a designated stock exchange,
and the Warrants, if and when listed on a designated stock
exchange, will be qualified investments under the Tax Act and
the regulations thereunder for trusts governed by registered
retirement savings plans, registered retirement income funds,
deferred profit sharing plans, registered education savings
plans, registered disability savings plans and tax-free savings
accounts. There can be no assurances that the Shares or Warrants
will be listed on a designated stock exchange.
An investment in our Shares and Warrants will not generally be a
“prohibited investment” for a particular trust
governed by a tax-free savings account provided the holder does
not have a “significant interest” in us. Generally, a
holder will not have a significant interest in us unless the
holder and/or persons not dealing at arm’s length with the
holder, owns directly or indirectly, 10% or more of the issued
shares of any class of our capital stock or a corporation
CDN-11
Alternate page for Canadian Prospectus
related to us. Specific rules may also deem an individual to own
shares of a partnership in which he or she is a member or a
trust of which he or she is a beneficiary.
INTERCORPORATE
RELATIONSHIPS
Set forth below is a chart reflecting our organizational
structure, as well as the percentage ownership and jurisdiction
of incorporation of our subsidiaries.
PURCHASERS’
STATUTORY RIGHTS
Securities legislation in certain provinces of Canada provides
purchasers with the right to withdraw from an agreement to
purchase securities. This right may be exercised within two
business days after receipt or deemed receipt of a prospectus
and any amendment. In several of the provinces, the securities
legislation further provides a purchaser with remedies for
rescission or, in some jurisdictions, damages if the prospectus
and any amendment contains a misrepresentation or is not
delivered to the purchaser, provided that such remedies for
rescission or damages are exercised by the purchaser within the
time limit prescribed by the securities legislation of the
purchaser’s province or territory. The purchaser should
refer to any applicable provisions of the securities legislation
of the purchaser’s province or territory for the
particulars of these rights or consult with a legal advisor.
UNITED
STATES PROSPECTUS
Attached is the U.S. Prospectus, which forms part of the
Form S-1
registration statement filed with the United States Securities
and Exchange Commission in connection with the U.S. offering.
The U.S. Prospectus is deemed to form a part of this
prospectus.
CDN-12
Alternate page for Canadian Prospectus
CERTIFICATE
OF VUZIX CORPORATION
Dated October 16,
2009
This amended and restated prospectus, together with the
documents and information incorporated by reference, will, as of
the date of the supplemented prospectus providing the
information permitted to be omitted from this prospectus,
constitute, full, true and plain disclosure of all material
facts relating to the securities offered by this prospectus as
required under the securities legislation of each of the
provinces of Canada other than Québec.
| |
|
|
|
By: (Signed) Paul J.
Travers
|
|
By: (Signed) Grant Russell
|
|
President and Chief Executive Officer
|
|
Chief Financial Officer, Treasurer and Secretary
|
|
|
|
On behalf of the Board of Directors of Vuzix Corporation
|
|
|
|
By: (Signed) William Lee
|
|
Director
|
CDN-C-1
Alternate page for Canadian Prospectus
CERTIFICATE
OF THE AGENTS
Dated October 16,
2009
To the best of our knowledge, information and belief, this
amended and restated prospectus, together with the documents and
information incorporated by reference, will, as of the date of
the supplemented prospectus providing the information permitted
to be omitted from this prospectus, constitute full, true and
plain disclosure of all material facts relating to the
securities offered by this prospectus as required under the
securities legislation of each of the provinces of Canada other
than Québec.
| |
|
|
|
CANACCORD CAPITAL CORPORATION
|
|
BOLDER INVESTMENT PARTNERS, LTD.
|
|
|
|
|
|
By: (Signed) David Rentz
|
|
By: (Signed) Paul
Woodward
|
CDN-C-2
PART II
INFORMATION
NOT REQUIRED IN PROSPECTUS
|
|
|
Item 13.
|
Other
Expenses of Issuance and Distribution.
|
The following table sets forth all costs and expenses, other
than underwriting discounts and commissions, payable by us in
connection with the sale of the common stock being registered.
All amounts shown are estimates except for the SEC registration
fee, the FINRA filing fee, the Canadian securities regulators
filing fees and the
TSX-V filing
fee.
| |
|
|
|
|
|
|
|
Amount to
|
|
|
|
|
be Paid
|
|
|
|
|
SEC registration fee
|
|
$
|
1,699
|
|
|
FINRA filing fee
|
|
$
|
3,734
|
|
|
Canadian securities regulators filing fees
|
|
$
|
15,320
|
|
|
TSX-V filing
fee
|
|
$
|
42,000
|
|
|
Blue sky qualification fees and expenses
|
|
$
|
15,500
|
|
|
Printing and engraving expenses
|
|
$
|
15,000
|
|
|
Legal fees and expenses
|
|
$
|
550,000
|
|
|
Accounting fees and expenses
|
|
$
|
30,000
|
|
|
Transfer agents and registrar fees and expenses
|
|
$
|
23,700
|
|
|
Miscellaneous expenses
|
|
$
|
10,000
|
|
|
|
|
|
|
|
|
Total
|
|
$
|
706,953
|
|
|
|
|
|
|
|
|
|
|
Item 14.
|
Indemnification
of Directors and Officers.
|
We are incorporated under the laws of the State of Delaware.
Section 145 of the Delaware General Corporation Law
provides that a Delaware corporation may indemnify any persons
who are, or are threatened to be made, parties to any
threatened, pending or completed action, suit or proceeding,
whether civil, criminal, administrative or investigative (other
than an action by or in the right of such corporation), by
reason of the fact that such person was an officer, director,
employee or agents of such corporation, or is or was serving at
the request of such person as an officer, director, employee or
agents of another corporation or enterprise. The indemnity may
include expenses (including attorneys’ fees), judgments,
fines and amounts paid in settlement actually and reasonably
incurred by such person in connection with such action, suit or
proceeding, provided that such person acted in good faith and in
a manner he or she reasonably believed to be in or not opposed
to the corporation’s best interests and, with respect to
any criminal action or proceeding, had no reasonable cause to
believe that his or her conduct was illegal. A Delaware
corporation may indemnify any persons who are, or are threatened
to be made, a party to any threatened, pending or completed
action or suit by or in the right of the corporation by reason
of the fact that such person was a director, officer, employee
or agents of such corporation, or is or was serving at the
request of such corporation as a director, officer, employee or
agents of another corporation or enterprise. The indemnity may
include expenses (including attorneys’ fees) actually and
reasonably incurred by such person in connection with the
defense or settlement of such action or suit, provided such
person acted in good faith and in a manner he or she reasonably
believed to be in or not opposed to the corporation’s best
interests except that no indemnification is permitted without
judicial approval if the officer or director is adjudged to be
liable to the corporation. Where an officer or director is
successful on the merits or otherwise in the defense of any
action referred to above, the corporation must indemnify him or
her against the expenses which such officer or director has
actually and reasonably incurred.
Section 102(b)(7) of the Delaware General Corporation Law
permits a corporation to provide in its certificate of
incorporation that a director of the corporation shall not be
personally liable to the corporation or its stockholders for
monetary damages for breach of fiduciary duties as a director,
except for liability for any:
|
|
|
| |
•
|
transaction from which the director derives an improper personal
benefit;
|
| |
| |
•
|
act or omission not in good faith or that involves intentional
misconduct or a knowing violation of law;
|
II-1
|
|
|
| |
•
|
unlawful payment of dividends or redemption of shares; or
|
| |
| |
•
|
breach of a director’s duty of loyalty to the corporation
or its stockholders.
|
Our certificate of incorporation provides that we shall
indemnify each director and officer of the registrant, his
heirs, executors and administrators, and may indemnify each
employee and agents of the registrant, his heirs, executors,
administrators and all other persons whom the registrant is
authorized to indemnify under the provisions of the General
Corporation Law of the State of Delaware, to the greatest extent
permitted or provided by law (a) against all expenses
(including attorney’s fees), judgments, fines and amounts
paid in settlement actually and reasonably incurred by him in
connection with any action, suit or proceeding, whether civil,
criminal, administrative or investigative, or in connection with
any appeal therein, or otherwise, and (b) against all
expenses (including attorney’s fees) actually and
reasonably incurred by him in connection with the defense or
settlement of any action or suit by or in the right of the
registrant, or in connection with any appeal therein, or
otherwise; and no provision of Article 9 of the
registrant’s certificate of incorporation is intended to be
construed as limiting, prohibiting, denying or abrogating any of
the general or specific powers or rights conferred by the
General Corporation Law of the State of Delaware upon the
registrant to furnish, or upon any court to award, such
indemnification, or indemnification as otherwise authorized
pursuant to the General Corporation Law of the State of Delaware
or any other law now or hereafter in effect.
Our by-laws provide that all directors and officers of the
registrant shall be entitled to be indemnified by us to the
fullest extent permitted by the General Corporation Law of the
State of Delaware. In addition, our by-laws provide that any
person serving or having served at the request of the registrant
as a director, trustee, officer, employee or agents of another
corporation or of a partnership, joint venture, trust or other
enterprise, including service with respect to an employee
benefit plan, shall be entitled to be indemnified by us to the
fullest extent permitted by the General Corporation Law of the
State of Delaware.
Insofar as indemnification for liabilities arising under the
Securities Act may be permitted to our directors, officers, and
controlling persons pursuant to the foregoing provisions, or
otherwise, we have been advised that in the opinion of the SEC
such indemnification is against public policy as expressed in
the Securities Act and is, therefore, unenforceable. In the
event that a claim for indemnification against such liabilities
(other than the payment of expenses incurred or paid by a
director, officer or controlling person in a successful defense
of any action, suit or proceeding) is asserted by such director,
officer or controlling person in connection with the securities
being registered, we will, unless in the opinion of its counsel
the matter has been settled by controlling precedent, submit to
the court of appropriate jurisdiction the question whether such
indemnification by it is against public policy as expressed in
the Securities Act and will be governed by the final
adjudication of such issue.
Section 174 of the Delaware General Corporation Law
provides, among other things, that a director who willfully or
negligently approves of an unlawful payment of dividends or an
unlawful stock purchase or redemption may be held liable for
such actions. A director who was either absent when the unlawful
actions were approved, or dissented at the time, may avoid
liability by causing his or her dissent to such actions to be
entered in the books containing minutes of the meetings of the
board of directors at the time such action occurred or
immediately after such absent director receives notice of the
unlawful acts.
As permitted by the Delaware General Corporation Law, we have
entered into indemnity agreements with each of our directors and
executive officers that require us to indemnify such persons
against any and all expenses (including attorneys’ fees),
witness fees, damages, judgments, fines, settlements and other
amounts incurred (including expenses of a derivative action) in
connection with any action, suit or proceeding, whether actual
or threatened, to which any such person may be made a party by
reason of the fact that such person is or was a director, an
officer or an employee of Vuzix or any of its affiliated
enterprises, provided that such person acted in good faith and
in a manner such person reasonably believed to be in or not
opposed to our best interests and, with respect to any criminal
proceeding, had no reasonable cause to believe his or her
conduct was unlawful. The indemnification agreements also set
forth certain procedures that will apply in the event of a claim
for indemnification thereunder.
At present, there is no pending litigation or proceeding
involving any of our directors or executive officers as to which
indemnification is required or permitted, and we are not aware
of any threatened litigation or proceeding that may result in a
claim for indemnification.
II-2
We have an insurance policy covering our officers and directors
with respect to certain liabilities, including liabilities
arising under the Securities Act or otherwise.
Reference is made to the following documents filed as exhibits
to this registration statement regarding relevant
indemnification provisions described above and elsewhere herein:
|
|
|
Item 15.
|
Recent
Sales of Unregistered Securities.
|
The following list sets forth information regarding all
securities sold or issued by us in the three years preceding the
date of this registration statement.
(1) In May 2009, we granted options under our 2007 stock
option plan to purchase an aggregate of 2,335,940 shares of
our common stock to 44 employees. Each option is
exercisable at $0.15 per share for ten years from the date of
grant, subject to vesting over four years from the date of
grant. The exercise price of these options is subject to upward
adjustment to the initial public offering price per share of our
common stock if the closing of this offering occurs within
90 days of the grant date.
(2) In January 2009, we issued 2,000,000 shares of our
common stock at a purchase price of $0.15, together with a
warrant to purchase an additional 1,000,000 shares of
shares of our common stock at an exercise purchase price of
$0.20 per share for 5 years from the date of issue, to an
individual investor for aggregate gross proceeds of $300,000 in
cash.
(3) In December 2008, we issued warrants to purchase
120,000 shares of our common stock, exercisable at $0.01
per share for five years from the date of issuance, to a
consultant in consideration for services.
(4) In December 2008, we issued warrants to purchase
11,583 shares of our common stock, exercisable at $0.15 per
share for five years from the date of issuance, to a consultant
in consideration for services.
(5) In November 2008, we granted an option under our 2007
stock option plan to purchase 142,864 shares of our common
stock to our external director as his annual retainer. The
option is exercisable at $0.15 per share for ten years from the
date of issuance and vests over 12 months from the date of
grant.
(6) In November 2008, we granted options under our 2007
stock option plan to purchase an aggregate of
446,424 shares of our common stock to one consultant and
two employees. Each option is exercisable at $0.15 per share for
ten years from the date of grant, subject to vesting over four
years from the date of grant.
(7) In September 2008, we issued 444,447 shares of our
common stock to a consultant in consideration for services.
(8) In July and August 2008, we issued
15,364,899 shares of our common stock to 46 individual and
institutional investors for aggregate gross proceeds of
$2,304,735 in cash.
(9) In July 2008, we issued warrants to purchase
66,667 shares of our common stock, exercisable at
$0.01 per share for five years from the date of issuance,
to a consultant in consideration for services.
(10) In July 2008, we issued 482,640 shares of our
common stock to a consultant in consideration for services.
(11) In July 2008, we granted options under our 2007 stock
option plan to purchase an aggregate of 1,328,000 shares of
our common stock to seven employees. Each option is exercisable
at $0.20 per share for ten years from the date of grant, subject
to vesting over four years from the date of grant.
(12) In June 2008, we issued 1,552,936 shares of our
common stock to 51 institutional and individual investors upon
the exercise of warrants for aggregate gross proceeds of $15,529
in cash.
(13) In June 2008, we issued warrants to purchase
157,504 shares of our common stock, exercisable at
$0.01 per share for five years from the date of issuance,
to a consultant in consideration for services.
(14) In June 2008, we issued warrants to purchase
24,945 shares of our common stock, exercisable at
$0.20 per share for five years from the date of issuance,
to a consultant in consideration for services.
II-3
(15) In January 2008, we issued 2,450,888 shares of
our common stock upon the exercise of options granted under our
2007 stock option plan for aggregate gross proceeds of $24,509
in cash.
(16) In December 2007, we issued warrants to purchase
45,000 shares of our common stock exercisable at $0.01 per
share and warrants to acquire 37,720 shares of our common
stock exercisable at $0.23336 per share to two consultants in
consideration for services.
(17) In November 2007, we granted options under our 2007
stock option plan to purchase an aggregate of
140,000 shares of our common stock to an employee. Each
option is exercisable at $0.20 per share for ten years from the
date of grant, subject to vesting over four years from the date
of grant.
(18) In November 2007, we granted an option under our 2007
stock option plan to purchase 142,864 shares of our common
stock to our non-employee director. The option is exercisable at
$0.20 per share for ten years from the date of issuance and
vests over 12 months from the date of grant.
(19) In November 2007, we issued 134,280 shares of our
common stock for aggregate gross proceeds of $1,343 in cash upon
the exercise of the warrants issued in the transactions
described in paragraph 37 below.
(20) In November 2007, we issued 500,000 shares of our
common stock upon the conversion of outstanding indebtedness at
the rate of $0.20 per share.
(21) In October 2007, we issued warrants to acquire
65,000 shares of our common stock, exercisable at
$0.20 per share for two years from the date of issuance, to
a consultant in consideration for services.
(22) In September 2007, we granted options under our 2007
stock option plan to purchase an aggregate of
644,000 shares of our common stock to six employees. Each
option is exercisable at $0.20 per share for ten years from the
date of grant, subject to vesting over four years from the date
of grant.
(23) In July 2007, we issued 42,856 shares of our
common stock to an individual investor for $429 in cash upon the
exercise of warrants issued in the transaction described in
paragraph 38 below.
(24) In June 2007, we issued warrants to acquire
38,568 shares of our common stock, exercisable at
$0.0875 per share for five years from the date of issuance,
to a consultant in consideration for services.
(25) In June 2007, we issued 20,891,600 shares of our
common stock to 160 individual and institutional investors for
aggregate gross proceeds of $4,178,320 in cash.
(26) In June 2007, in consideration of their services as
placement agents in the private placement described in the
immediately preceding paragraph, we issued to Canaccord Capital
Corporation 2,233,872 shares of our common stock and to
Canaccord Capital Corporation, IQ Ventures, Inc. and Lighthouse
Financial Group, LLC warrants to purchase up to an aggregate of
2,456,656 shares of our common stock, exercisable at $1.60
per share for two years from the date of issuance. The exercise
price of the warrants has been reduced to $0.20 per share as a
result of anti-dilution adjustments in accordance with the terms
thereof.
(27) In June 2007, we issued warrants to acquire 17,144 and
48,000 shares of our common stock, exercisable at $0.00875
per share for five years from the date of issuance, to two
consultants in consideration for services.
(28) In June 2007, we issued warrants to acquire
168,320 shares of our common stock, exercisable at $0.20
per share for five years from the date of issuance, to a
consultant in consideration for services.
(29) In May 2007, we issued 402,484 shares of our
common stock upon the exercise of options granted under our 2007
stock option plan for aggregate gross proceeds of $3,539 in cash.
(30) In April 2007, we granted options under our 1997 stock
option plan to purchase an aggregate of 274,286 shares of
our common stock to two employees. Each option is exercisable at
$0.2334 per share for ten years from the date of grant, subject
to vesting over four years from the date of grant.
(31) In April 2007, we granted options under our 1997 stock
option plan to purchase 571,432 shares of our common stock
to a consultant. The option is exercisable at $0.2334 per share
for five years from the date of grant, subject to vesting over
two years from the date of grant.
II-4
(32) In December 2006, we granted options under our 1997
stock option plan to purchase an aggregate of
390,286 shares of our common stock to 12 employees.
Each option is exercisable at $0.2334 per share for ten years
from the date of grant, subject to vesting over four years from
the date of grant.
(33) In November 2006, we granted options under our 1997
stock option plan to purchase an aggregate of
571,429 shares of our common stock to three employees. Each
option is exercisable at $0.2334 per share for ten years from
the date of grant, subject to vesting over four years from the
date of grant.
(34) In November 2006, we granted an option under our 1997
stock option plan to purchase 142,864 shares of our common
stock to our external director as his annual retainer, The
option is exercisable at $0.2334 per share for ten years from
the date of issuance and vests over 12 months from the date
of grant.
(35) In September 2006, we issued 22,857 shares of our
common stock upon the exercise of options granted under our 1997
stock option plan for aggregate gross proceeds of $229 in cash.
(36) In September 2006, in consideration of a loan of
$500,000, we issued to the lender a warrant exercisable upon
conversion of the promissory note issued in evidence of the loan
to purchase up to that number of shares of our common stock
equal to the principal amount of and accrued interest on the
promissory note then converted divided by 0.5334, exercisable at
$0.35 per share for three years from the date of the issue of
the promissory note. As of the date of this prospectus, the
promissory note has not been converted. Interest on the
promissory note accrued at an initial annual rate of 10% but
increased to 18% as of February 1, 2009.
(37) In September 2006, we issued 10,000 shares of our
Series C Preferred Stock and a warrant to purchase
91,432 shares of our common stock, exercisable at $0.00875
per share for approximately three years from the date of
issuance, to one individual investor for aggregate gross
proceeds of $100,000 in cash.
(38) In September 2006, in consideration of loans in the
aggregate amount of $200,000, we issued to the lenders warrants
to purchase up to 85,712 shares of our common stock,
exercisable at $0.00875 per share for five years from the date
of issuance.
(39) In August 2006, we granted an employee an option under
our 1997 stock option plan to purchase 142,857 shares of
our common stock, exercisable at $0.2275 per share for ten years
from the date of grant, subject to vesting over four years from
the date of grant.
The offers, sales and issuances of the securities described in
paragraphs 1, 5, 6, 17, 18, 22 and 30 through 34 above were
deemed to be exempt from registration under the Securities Act
in reliance on Rule 701 because the transactions were under
compensatory benefit plans and contracts relating to
compensation as provided under Rule 701. The recipients of
such securities were our employees, directors or bona fide
consultants and received the securities under our stock option
plan. Appropriate legends were affixed to the securities issued
in these transactions. Each of the recipients of securities in
these transactions had adequate access, through employment,
business or other relationships, to information about us.
The offers, sales and issuances of the securities described all
the other paragraphs above were deemed to be exempt from
registration under the Securities Act in reliance on
Rule 506 of Regulation D because the issuance of
securities to the accredited investors did not involve a public
offering. The recipients of securities in each of these
transactions acquired the securities for investment only and not
with a view to or for sale in connection with any distribution
thereof and appropriate legends were affixed to the securities
issued in these transactions. Each of the recipients of
securities in these transactions was an accredited investor
under Rule 501 of Regulation D.
|
|
|
Item 16.
|
Exhibits
and Financial Statement Schedules.
|
A list of exhibits filed with this registration statement on
Form S-1
is set forth in the Exhibit Index and is incorporated in
this Item 16(a) by reference.
II-5
|
|
|
(b)
|
Financial
Statement Schedules.
|
No financial statement schedules are provided because the
information called for is not required or is shown either in the
financial statements or the notes thereto.
The undersigned registrant hereby undertakes:
(1) To file, during any period in which offers or sales are
being made, a post-effective amendment to this registration
statement:
(i) To include any prospectus required by section 10(a)(3)
of the Securities Act of 1933;
(ii) To reflect in the prospectus any facts or events
arising after the effective date of the registration statement
(or the most recent post-effective amendment thereof) which,
individually or in the aggregate, represent a fundamental change
in the information set forth in the registration statement.
Notwithstanding the foregoing, any increase or decrease in
volume of securities offered (if the total dollar value of
securities offered would not exceed that which was registered)
and any deviation from the low or high end of the estimated
maximum offering range may be reflected in the form of
prospectus filed with the Commission pursuant to
Rule 424(b) (§ 230.424(b) of this chapter) if, in
the aggregate, the changes in volume and price represent no more
than 20% change in the maximum aggregate offering price set
forth in the “Calculation of Registration Fee” table
in the effective registration statement.
(iii) To include any material information with respect to
the plan of distribution not previously disclosed in the
registration statement or any material change to such
information in the registration statement;
(2) That, for the purpose of determining any liability
under the Securities Act of 1933, each such post-effective
amendment shall be deemed to be a new registration statement
relating to the securities offered therein, and the offering of
such securities at that time shall be deemed to be the initial
bona fide offering thereof.
(3) To remove from registration by means of a
post-effective amendment any of the securities being registered
which remain unsold at the termination of the offering.
(4) That, for the purpose of determining liability of the
registrant under the Securities Act of 1933 to any purchaser in
the initial distribution of the securities the undersigned
registrant undertakes that in a primary offering of securities
of the undersigned registrant pursuant to this registration
statement, regardless of the underwriting method used to sell
the securities to the purchaser, if the securities are offered
or sold to such purchaser by means of any of the following
communications, the undersigned registrant will be a seller to
the purchaser and will be considered to offer or sell such
securities to such purchaser:
(i) Any preliminary prospectus or prospectus of the
undersigned registrant relating to the offering required to be
filed pursuant to Rule 424 (§ 230.424 of this
chapter);
(ii) Any free writing prospectus relating to the offering
prepared by or on behalf of the undersigned registrant or used
or referred to by the undersigned registrant;
(iii) The portion of any other free writing prospectus
relating to the offering containing material information about
the undersigned registrant or its securities provided by or on
behalf of the undersigned registrant; and
(iv) Any other communication that is an offer in the
offering made by the undersigned registrant to the purchaser.
(5) That, for the purpose of determining liability under
the Securities Act of 1933 to any purchaser each prospectus
filed pursuant to Rule 424(b) as part of a registration
statement relating to an offering, other than registration
statements relying on Rule 430B or other than prospectuses
filed in reliance on Rule 430A
II-6
(§230.430A of this chapter), shall be deemed to be part of
and included in the registration statement as of the date it is
first used after effectiveness. Provided, however, that
no statement made in a registration statement or prospectus that
is part of the registration statement or made in a document
incorporated or deemed incorporated by reference into the
registration statement or prospectus that is part of the
registration statement will, as to a purchaser with a time of
contract of sale prior to such first use, supersede or modify
any statement that was made in the registration statement or
prospectus that was part of the registration statement or made
in any such document immediately prior to such date of first use.
The undersigned registrant hereby undertakes to provide to the
agents at the closing specified in the underwriting agreement
certificates in such denominations and registered in such names
as required by the agents to permit prompt delivery to each
purchaser.
Insofar as indemnification for liabilities arising under the
Securities Act may be permitted to directors, officers and
controlling persons of the registrant pursuant to the foregoing
provisions, or otherwise, the registrant has been advised that
in the opinion of the SEC such indemnification is against public
policy as expressed in the Securities Act and is, therefore,
unenforceable. In the event that a claim for indemnification
against such liabilities (other than the payment by the
registrant of expenses incurred or paid by a director, officer
or controlling person of the registrant in the successful
defense of any action, suit or proceeding) is asserted by such
director, officer or controlling person in connection with the
securities being registered, the registrant will, unless in the
opinion of its counsel the matter has been settled by
controlling precedent, submit to a court of appropriate
jurisdiction the question whether such indemnification by it is
against public policy as expressed in the Securities Act and
will be governed by the final adjudication of such issue.
The undersigned registrant hereby undertakes that:
(1) For purposes of determining any liability under the
Securities Act, the information omitted from the form of
prospectus filed as part of this registration statement in
reliance upon Rule 430A and contained in a form of
prospectus filed by the registrant pursuant to Rule 424(b)(1) or
(4) or 497(h) under the Securities Act shall be deemed to
be part of this registration statement as of the time it was
declared effective.
(2) For the purpose of determining any liability under the
Securities Act, each post-effective amendment that contains a
form of prospectus shall be deemed to be a new registration
statement relating to the securities offered therein, and the
offering of such securities at that time shall be deemed to be
the initial bona fide offering thereof.
II-7
SIGNATURES
Pursuant to the requirements of the Securities Act of 1933, as
amended, the registrant has duly caused this Amendment
No. 4 to Registration Statement on
Form S-1
to be signed on its behalf by the undersigned, thereunto duly
authorized, in the City of Rochester, State of New York, on this
10th day of November, 2009.
VUZIX CORPORATION
Paul J. Travers
President and Chief Executive Officer
Pursuant to the requirements of the Securities Act of 1933, as
amended, this Amendment No. 4 to Registration Statement on
Form S-1
has been signed by the following persons in the capacities and
on the dates indicated.
| |
|
|
|
|
|
|
|
Signature
|
|
Title
|
|
Date
|
|
|
|
|
|
|
|
|
|
/s/ Paul
J. Travers
Paul
J. Travers
|
|
President, Chief Executive Officer
and Director
(Principal Executive Officer)
|
|
November 10, 2009
|
|
|
|
|
|
|
|
/s/ Grant
Russell
Grant
Russell
|
|
Chief Financial Officer, Secretary
and Treasurer
(Principal Financial and
Accounting Officer)
|
|
November 10, 2009
|
|
|
|
|
|
|
|
/s/ William
Lee
William
Lee
|
|
Director
|
|
November 10, 2009
|
II-8
Index to
Exhibits
| |
|
|
|
|
|
|
1
|
.1
|
|
Form of Agency Agreement
|
|
|
3
|
.1(1)
|
|
Certificate of Incorporation currently in effect
|
|
|
3
|
.2(3)
|
|
Amended and Restated Certificate of Incorporation to be
effective immediately following the closing of the offering
|
|
|
3
|
.3(1)
|
|
Bylaws currently in effect
|
|
|
3
|
.4(3)
|
|
Amended and Restated Bylaws to be effective immediately
following the closing of the offering
|
|
|
4
|
.1
|
|
Specimen certificate evidencing shares of common stock
|
|
|
4
|
.2
|
|
Specimen common stock purchase warrant
|
|
|
4
|
.3
|
|
Form of Warrant Indenture between the registrant and
Computershare Trust Company of Canada Certain instruments
defining the rights of the holders of long-term debt of the
registrant, none of which authorize a total amount of
indebtedness in excess of 10% of the total assets of the
registrant and its subsidiary on a consolidated basis, have not
been filed as exhibits. The registrant hereby agrees to furnish
a copy of any of these agreements to the Commission upon request
|
|
|
5
|
.1(3)
|
|
Opinion of Boylan, Brown, Code, Vigdor & Wilson, LLP
|
|
|
10
|
.1(1)+
|
|
2007 Amended and Restated Stock Option Plan
|
|
|
10
|
.2(1)+
|
|
2009 Stock Option Plan
|
|
|
10
|
.3+
|
|
Form of Option Agreement under 2009 Stock Plan
|
|
|
10
|
.4(1)+
|
|
Form of Indemnification Agreement by and between the registrant
and each director and executive officer
|
|
|
10
|
.5(1)+
|
|
Employment Agreement dated as of August 1, 2007 by and
between the registrant and Paul J. Travers
|
|
|
10
|
.6(1)+
|
|
Employment Agreement dated as of August 1, 2007 by and
between the registrant and Grant Russell
|
|
|
10
|
.7(1)
|
|
Shareholders Agreement dated as of October 11, 2000 by and
among the registrant and Shareholders (as defined therein)
|
|
|
10
|
.81(1)
|
|
Registration Rights Agreement dated as of October 11, 2000
by and among the registrant and the Investors (as defined
therein)
|
|
|
10
|
.9(1)
|
|
Registration Rights Agreement dated as of June 2005 by and among
the registrant and the Investors (as defined therein)
|
|
|
10
|
.10(3)†
|
|
Technology Purchase and Royalty Agreement dated as of
December 23, 2005 between the registrant and New Light
Industries, Ltd.
|
|
|
10
|
.11(1)
|
|
Warrant to purchase common stock dated as of December 23,
2005 issued by the registrant to New Light Industries, Ltd.
|
|
|
10
|
.12(1)
|
|
Rights Agreement dated as of December 23, 2005 by and
between the registrant and New Light Industries, Ltd.
|
|
|
10
|
.13(1)
|
|
Agency Agreement dated as of June 29, 2007 by and between
the registrant and Canaccord Capital Corporation
|
|
|
10
|
.14(1)
|
|
Form of warrant to purchase common stock issued by the
registrant pursuant to the Agency Agreement dated as of
June 29, 2007 by and between the registrant and Canaccord
Capital Corporation
|
|
|
10
|
.15(1)
|
|
Demand Note in the original principal amount of $247,690.92 by
the registrant to the order of Paul J. Travers
|
|
|
10
|
.16(1)
|
|
Loan Agreement dated as of October 2008 by and between the
registrant and Paul J. Travers
|
|
|
10
|
.17(3)
|
|
Promissory Note dated as of October 2008 by the registrant to
the order of Paul J. Travers
|
|
|
10
|
.18(1)
|
|
Fiscal Advisory Fee Agreement dated as of June 29, 2009 by
and between the registrant and Canaccord Capital Corporation and
Bolder Investment Partners, Ltd.
|
|
|
10
|
.19(3)†
|
|
Distribution and Manufacturing Agreement dated August 27,
2009 between the registrant and YuView Holdings Ltd.
|
|
|
10
|
.20(3)
|
|
Convertible Promissory Note dated September 19, 2006 in the
original principal amount of $500,000 by the registrant to Sally
Hyde Burdick
|
| |
|
|
|
|
|
|
10
|
.21
|
|
Form of Escrow Agreement by and among the registrant, Canaccord
Capital Corporation the other Offering Agents (as defined
therein) and JP Morgan Chase Bank, National Association, as
escrow agent
|
|
|
16
|
.1(3)
|
|
Letter dated October 12, 2009 from EFP Rotenberg, LLP
pursuant to Item 304 of Regulation S-K
|
|
|
23
|
.1
|
|
Consent of EFP Rotenberg, LLP, independent registered
public accounting firm
|
|
|
23
|
.2
|
|
Consent of Davie Kaplan, CPA , P.C., independent registered
public accounting firm
|
|
|
23
|
.3(3)
|
|
Consent of Boylan, Brown, Code, Vigdor & Wilson, LLP
(included in Exhibit 5.1)
|
|
|
24
|
.1(1)
|
|
Power of Attorney (included on signature page)
|
|
|
99
|
.1(2)
|
|
Consent of Frank Zammataro pursuant to Rule 438
|
|
|
99
|
.2(2)
|
|
Consent of Kathryn Sayko pursuant to Rule 438
|
|
|
99
|
.3(2)
|
|
Consent of Bernard Perrine pursuant to Rule 438
|
|
|
|
|
(1) |
|
Previously filed as exhibit to the Registration Statement on
Form S-1
filed on July 2, 2009 |
| |
|
(2) |
|
Previously filed as exhibit to Amendment No. 2 to the
Registration Statement on
Form S-1
filed on September 4, 2009 |
|
|
|
|
(3) |
|
Previously filed as exhibit to Amendment No. 3 to the
Registration Statement on
Form S-1
filed October 16, 2009 |
|
|
|
|
+ |
|
Management contract or compensation plan or arrangement |
|
|
|
|
† |
|
Confidential treatment requested as to certain portions |