Attached files
| file | filename |
|---|---|
| 8-K - FORM 8-K - Discover Financial Services | d8k.htm |
 1 Bank of America Merrill Lynch Banking and Financial Services Conference David Nelms Chairman & Chief Executive Officer November 10, 2009 Exhibit 99.1 |
 2 Notice The following slides are part of a presentation by Discover Financial Services (the
"Company") and are intended to be viewed as part of that
presentation. No representation is made that the information in these slides is complete. The information provided herein may include certain non-GAAP financial measures. The
reconciliations of such measures to the comparable GAAP figures are included
in the Company’s Current Report on Form 8-K dated September 17,
2009, Quarterly Report on Form 10-Q for the quarter ended August 31, 2009 and Annual Report on Form 10-K for the year ended November 30, 2008, which are on file with the SEC and
available on the Company’s website at www.discoverfinancial.com.
Certain reconciliations are also included at the end of this presentation. The presentation contains forward-looking statements. You are cautioned not to place
undue reliance on forward- looking statements, which speak only as of the
date on which they are made, which reflect management’s estimates, projections, expectations or beliefs at that time and which are subject to risks and
uncertainties that may cause actual results to differ materially. For a
discussion of certain risks and uncertainties that may affect the future results of the Company, please see "Special Note Regarding Forward-Looking Statements,"
"Risk Factors," "Business – Competition," "Business
– Supervision and Regulation" and "Management’s Discussion
and Analysis of Financial Condition and Results of Operations" in the
Company’s Annual Report on Form 10-K for the year ended November 30, 2008, and “Risk Factors” and “Management’s Discussion and Analysis of Financial Condition and Results
of Operations” in the Company’s Quarterly Reports on Form 10-Q for the quarters ended
February 28, 2009, May 31, 2009 and August 31, 2009, which are on file with
the SEC. Certain historical financial information about the Company that we
have included in this presentation has been derived from Morgan
Stanley’s consolidated financial statements and does not necessarily reflect what our financial condition, results of operations or cash flows would have been had we operated as a separate,
stand-alone company during the periods presented. We own or have rights to use the trademarks, trade names and service marks that we use
in conjunction with the operation of our business, including, but not limited to: Discover ® , PULSE ® , Cashback Bonus ® , Discover ® Network and Diners Club International ® . All other trademarks, trade names and service marks included in this
presentation are the property of their respective owners. 2 |
 3 Company Overview Note(s): Balances as of August 31, 2009; volume based on the trailing four quarters ending 3Q09;
refer to appendix for reconciliation of GAAP to managed data U.S. Card
Issuing • Leading cash rewards program • Loyal, prime customer base • $48Bn in managed receivables Direct Banking • $10Bn direct consumer deposits • $3Bn personal and student loans • $110Bn volume • 4,500+ issuers • $97Bn volume • 30+ issuers • $26Bn volume • 49 franchises • 185 countries/territories PIN Debit/ATM Network International Signature Network North American Signature Network |
 4 Financial Strength • Profitable year-to-date, even excluding settlement proceeds • Managed revenue: $9Bn • Total managed assets: $68Bn • Market capitalization: $7.5Bn • Total volume: $234Bn • Total transactions: 4.3Bn • Annual rewards payout: >$700MM $1.57 $1.28 $1.79 YTD 3Q07 YTD 3Q08 YTD 3Q09 YTD Earnings Per Share (1) Key Statistics (2) Note(s) 1. Diluted EPS from continuing operations 2. As of August 31, 2009; managed revenue, total volume and total transactions based on
the trailing four quarters ending 3Q09; refer to appendix for reconciliation of GAAP to managed data |
 5 5 Manage conservatively in a challenging environment • Superior credit performance vs. competitors • Conservative loan growth • Increase net interest margin and revenues • Reduce expenses • Focus on capital/liquidity/funding Performance Priorities – Current |
 6 6 0% 50% 100% 150% 200% Unemployment and Underemployment Rates Current Environment Source Bureau of Labor Statistics; recessions shaded Source The Conference Board Consumer Confidence 0% 3% 6% 9% 12% 15% 18% Unemployment Unemployed plus Underemployed (Persons Working Part-Time due to Economic Reasons)
|
 7 Managed Net Charge-off Rate – 3Q09 (1) Loss Guidance 7 Credit Quality Leader 8.6% 8.9% 9.6% 10.2% 10.3% 13.9% DFS AXP COF C JPM BAC (2) • Continue to expect 4Q09 managed net charge-off rate to be in range of 8.5-9% versus 8.4% in 3Q09 • Will continue to maintain reserves reflecting credit conditions Total Managed Portfolio U.S. Credit Card Portfolio Source: Company Earnings Releases Note(s) 1. Refer to appendix for reconciliation of GAAP to managed data 2. Branded NA Cards |
 8 Conservative Loan Growth 3Q09 Update • Total managed loans were unchanged from 2Q09 – Strong growth in student loans • Credit card loans were down 2% from 2Q09 – Significant reductions in balance transfers (1%) (2%) (10%) (11%) (11%) (19%) C DFS BAC COF JPM AXP U.S. Credit Card Receivables (1) 3Q YOY % Change Note(s) 1. Based on 3Q09 quarterly reports; refer to appendix for reconciliation of GAAP to managed
data 2. Branded NA Cards 3. U.S. Card 4. Card Services (2) (3) (3) (3) (4) (3) |
 9 Managed Net Interest Margin (1) 9 Margin Expansion 7.75% 8.54% 9.42% 2007 2008 YTD 3Q09 3Q09 Update • Impact of portfolio rebalancing • Significant reduction in promotional rates • Cost of funds remains low +167bps Note(s) 1. Refer to appendix for reconciliation of GAAP to managed data
|
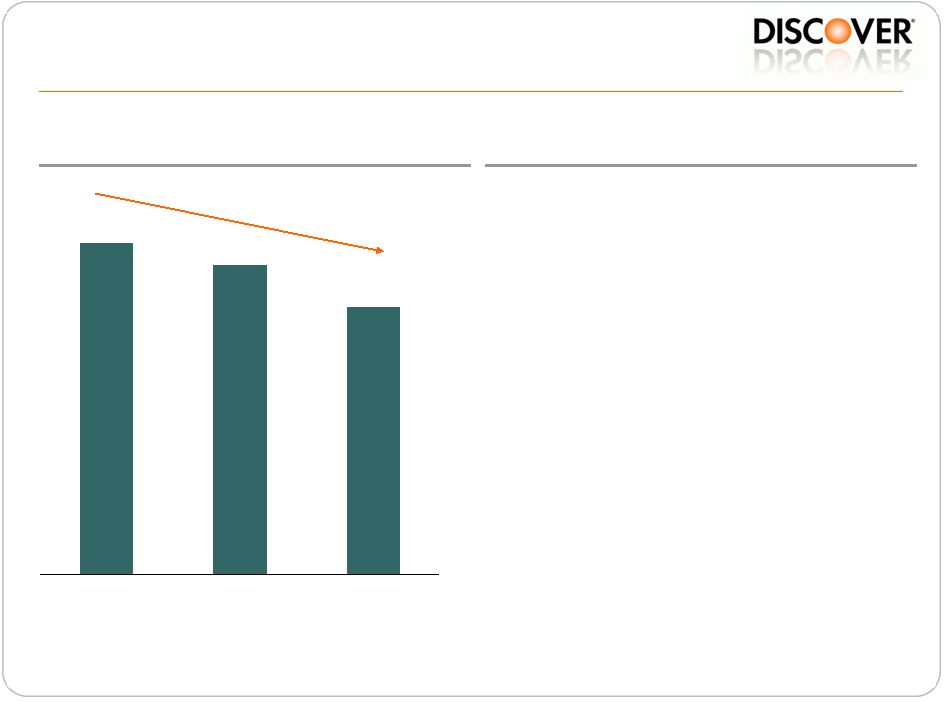 10 Non-Interest Expense (1) (%) 10 Expense Management 3Q09 Update • U.S. Card expenses down 16% YOY • Lowest quarterly operating expense ratio in our history • Increase in marketing spend in 4Q09 4.27% 4.93% 5.28% 2007 2008 YTD 3Q09 -101bps Note(s) 1. Non-interest expense as a percent of managed loans; refer to appendix for
reconciliation of GAAP to managed data |
 11 Other, 3% ABS, 44% Direct-to- Consumer & Affinity Deposits, 18% Brokered Deposits, 34% ABCP Open Lines, 1.5 Committed Credit, 2.4 Liquidity Reserve, 10.6 Fed Discount Window, 6.4 Capital, Funding and Liquidity (1) Capital Ratios Funding Mix (%) Total $56Bn Contingent Liquidity ($Bn) Total $21Bn • Total capital 15.9% • Tier 1 capital 14.6% • TCE/TMA 10.1% • TCE/MR 13.8% Recent Capital Market Transactions • 7/09 Common Equity Raise $0.5Bn • 7/09 DFS 10 Year Debt $0.4Bn • 7/09 TALF ABS $1.5Bn • 9/09 TALF ABS $1.3Bn Note(s) 1. As of 3Q09, prior to 12/1/09 FAS 166/167 change; refer to appendix for reconciliation of GAAP to managed data |
 12 12 Build for the future • Adjust business model for CARD Act • Leverage Discover brand and leading Rewards program • Continue to grow direct-to-consumer banking business • Increase acceptance to drive higher sales • Grow and integrate Diners Club/PULSE/Discover networks Performance Priorities – Future |
 13 0% 2% 4% 6% 8% 10% 1989 1991 1993 1995 1997 1999 2001 2003 2005 2007 2009 Managed Net Interest Margin ROMR Assessing Impact of CARD Act Introduction of: • Promotional rates (1999) • Risk-based pricing (2000) • Differentiated cash APRs (2000) • Delinquency repricing (2002) Managed Net Interest Margin & ROMR (1) Note(s) 1. Calendar year data prior to 1998; ROMR is defined as return on managed receivables; refer to appendix for
reconciliation of GAAP to managed data |
 14 Competitive Advantages 44% 22% 16% 14% 7% 6% DFS JPM C AXP BAC COF Cash Rewards Leadership Drives Loyalty Cash Rewards Market Share (1) Note(s) 1. Household ownership of cash rewards cards; percentages add to more than 100% due to
household use of multiple brands Source 2008 TNS Consumer Card Research • Highest household ownership of cash reward cards • 20+ years of cash rewards experience and innovation • Focus on clarity and simplicity • Merchant funded rewards • Best-in-class loyalty |
 15 Direct Banking Direct-to-Consumer Deposits (1) (Bn) Direct-to-Consumer Banking Growth Discover Personal Loans • Superior alternative for consolidating debt • $1.3Bn in outstanding loans • 86% cross-sell accounts Discover Student Loans • Federal and private student loans • $1.4Bn in outstanding loans • On preferred lender list at 700+ schools $10.2 $4.8 $2.7 3Q07 3Q08 3Q09 Note(s) 1. Includes deposits originated through affinity relationships
|
 16 Increasing Acceptance to Drive Higher Sales U.S. Merchant Acceptance • Agreements with over 100 merchant acquirers • Implementation continues (7%) (11%) (12%) (13%) (14%) (15%) DFS COF JPM AXP C BAC U.S. Credit Card Sales (1) 3Q YOY % Change Note(s) 1. Based on 3Q09 quarterly reports 2. U.S. Card; sales volume, except AXP = sales & cash volume 3. Card Services; sales, BT & cash volume 4. Branded NA Cards; sales & cash volume 5. Global Cards; sales volume • 5% increase in active merchants • Building awareness via cost-efficient targeted marketing (2) (2) (3) (2) (4) (5) |
 17 Achieving Global Acceptance – ATM Global ATM Network - Over 650,000 ATMs - Coverage in over 100 countries and continuing expansion *Based on Internal Discover Network Data Note: Once Discover Network completes its global interoperability initiative, each
Diners Club International location is expected to accept Discover Network cards and vice-versa |
 18 Achieving Global Acceptance – Merchant POS Global POS Network Discover cards accepted at DCI merchant locations: - Goal of 50+ countries/territories by year-end 2009 - Goal of 100 countries/territories by June 2010 - Goal of 125 countries/territories by year-end 2010 *Based on Internal Discover Network Data Note: Once Discover Network completes its global interoperability initiative, each
Diners Club International location is expected to accept Discover Network cards and vice-versa |
 19 1986 2009 Discover ® revolutionized credit cards 2005 • Debit network acquisition • International network acquisition 2008 2006 • First ZIP SM contactless merchants deployed Leveraging Discover Assets to Drive Growth • CUP partnership announced • JCB partnership announced Continuous innovation and expansion: • Global ATM network • Network-to-network relationships • Global merchant acceptance • Contactless/EMV |
 20 20 Manage conservatively in a challenging environment • Superior credit performance: 163bps lower charge-offs than industry average (2) • Conservative loan growth: +1% YOY, significant reduction in balance transfers • Increase net interest margin: 95bps increase YOY • Reduce expenses: 16% decrease in U.S. Card YOY • Focus on capital/liquidity/funding: 10.1% TCE/TMA Build for the future • Adjust business model for CARD Act • Leverage Discover brand and leading Rewards program • Continue to grow direct-to-consumer banking business • Increase acceptance to drive higher sales • Grow and integrate Diners Club/PULSE/Discover networks Performance Priorities (1) Note(s) 1. Discover data as of 3Q09 2. Managed net charge-offs (credit card loans); industry average includes 3Q09 results from
most relevant reporting segments of DFS, JPM, C, BAC, COF and AXP |
 Bank of America Merrill Lynch Banking and Financial Services Conference David Nelms Chairman & Chief Executive Officer November 10, 2009 |
 22 Appendix: Reconciliation of GAAP to Managed Data 3Q09 (1) Revenue Net of Interest Expense ($000s) GAAP Basis $7,132,139 Securitization Adjustments 1,798,454 Managed Basis $8,930,593 3Q09 Total Assets ($000s) GAAP Basis $42,698,290 Securitization Adjustments 25,096,019 Managed Basis $67,794,309 3Q09 Net Charge-off Rate (%) GAAP Basis 8.5% Securitization Adjustments 8.8% Managed Basis 8.6% 2Q09 3Q09 Credit Card Loans ($000s) GAAP Basis $25,312,764 $22,721,603 Securitization Adjustments 23,590,868 25,414,036 Managed Basis $48,903,632 $48,135,639 (1) As of August 31, 2009, based on the trailing four quarters ending 3Q09 |
 23 2007 2008 3Q09 Average Total Loans ($000's) GAAP Basis $19,947,784 $21,348,493 $27,454,927 Securitization Adjustments 26,965,690 27,662,655 23,868,274 Managed Basis $46,913,474 $49,011,148 $51,323,201 Net Interest Margin (%) GAAP Basis 6.8% 6.6% 7.6% Securitization Adjustments 8.4% 10.1% 11.5% Managed Basis 7.8% 8.6% 9.4% Non-Interest Expense (%) GAAP Basis 12.4% 11.3% 8.0% Securitization Adjustments - - - Managed Basis 5.3% 4.9% 4.3% Return on Managed Loan Receivables (%) GAAP Basis 3.0% 4.3% 3.4% Securitization Adjustments - - - Managed Basis 1.3% 1.9% 2.4% Appendix: Reconciliation of GAAP to Managed Data |
 24 Appendix: Reconciliation of GAAP to Managed Data 3Q09 Tangible Common Equity/Tangible Assets (%) GAAP Basis 16.0% Securitization Adjustments 27.0% Managed Basis 10.1% Tangible Common Equity/Net Loans (%) GAAP Basis 28.7% Securitization Adjustments 26.7% Managed Basis 13.8% |