Attached files
| file | filename |
|---|---|
| EX-32.1 - EX-32.1 - IMPAC MORTGAGE HOLDINGS INC | a2195353zex-32_1.htm |
| EX-31.2 - EX-31.2 - IMPAC MORTGAGE HOLDINGS INC | a2195353zex-31_2.htm |
| EX-31.1 - EX-31.1 - IMPAC MORTGAGE HOLDINGS INC | a2195353zex-31_1.htm |
Use these links to rapidly review the document
FORM 10-Q QUARTERLY REPORT TABLE OF CONTENTS
UNITED STATES
SECURITIES AND EXCHANGE COMMISSION
Washington, D.C. 20549
FORM 10-Q
| ý | QUARTERLY REPORT PURSUANT TO SECTION 13 OR 15(d) OF THE SECURITIES EXCHANGE ACT OF 1934 | |
For the quarterly period ended September 30, 2009 |
||
or |
||
o |
TRANSITION REPORT PURSUANT TO SECTION 13 OR 15(d) OF THE SECURITIES EXCHANGE ACT OF 1934 |
|
For the transition period from to . |
||
Commission File Number: 1-14100
IMPAC MORTGAGE HOLDINGS, INC.
(Exact name of registrant as specified in its charter)
| Maryland (State or other jurisdiction of incorporation or organization) |
33-0675505 (I.R.S. Employer Identification No.) |
19500 Jamboree Road, Irvine, California 92612
(Address of principal executive offices)
(949) 475-3600
(Registrant's telephone number, including area code)
Indicate by check mark whether the registrant (1) has filed all reports required to be filed by Section 13 or 15(d) of the Securities Exchange Act of 1934 during the preceding 12 months (or for such shorter period that the registrant was required to file such reports), and (2) has been subject to such filing requirements for the past 90 days. Yes ý No o
Indicate by check mark whether the registrant has submitted electronically and posted on its corporate Web site, if any, every Interactive Data File required to be submitted and posted pursuant to Rule 405 of Regulation S-T during the preceding 12 months (or for such shorter period that the registrant was required to submit and post such files). Yes o No o
Indicate by check mark whether the registrant is a large accelerated filer, an accelerated filer, or a non-accelerated filer. See definition of "accelerated filer and large accelerated filer" in Rule 12b-2 of the Exchange Act.
| Large accelerated filer o | Accelerated filer ý | Non-accelerated filer o (Do not check if a smaller reporting company) |
Smaller reporting company o |
Indicate by check mark whether the registrant is a shell company (as defined in Exchange Act Rule 12b-2) Yes o No ý
There were 7,698,146 shares of common stock outstanding as of November 6, 2009.
FORM 10-Q QUARTERLY REPORT
TABLE OF CONTENTS
ITEM 1. CONSOLIDATED FINANCIAL STATEMENTS
IMPAC MORTGAGE HOLDINGS, INC. AND SUBSIDIARIES
CONSOLIDATED BALANCE SHEETS
(in thousands, except share data)
| |
September 30, 2009 |
December 31, 2008 |
||||||||||
|---|---|---|---|---|---|---|---|---|---|---|---|---|
| |
(Unaudited) |
|
||||||||||
ASSETS |
||||||||||||
Cash and cash equivalents |
$ |
37,893 |
$ |
46,215 |
||||||||
Restricted cash |
1,252 | 1,243 | ||||||||||
Short-term investments |
5,014 | — | ||||||||||
Trust assets |
||||||||||||
Investment securities available-for-sale |
1,049 | 2,068 | ||||||||||
Securitized mortgage collateral |
5,767,379 | 5,894,424 | ||||||||||
Derivative assets |
222 | 37 | ||||||||||
Real estate owned |
170,153 | 599,084 | ||||||||||
Total trust assets |
5,938,803 | 6,495,613 | ||||||||||
Assets of discontinued operations |
98,257 |
141,053 |
||||||||||
Other assets |
27,544 | 31,393 | ||||||||||
Total assets |
$ | 6,108,763 | $ | 6,715,517 | ||||||||
LIABILITIES |
||||||||||||
Trust liabilities |
||||||||||||
Securitized mortgage borrowings |
$ | 5,744,725 | $ | 6,193,984 | ||||||||
Derivative liabilities |
164,835 | 273,584 | ||||||||||
Total trust liabilities |
5,909,560 | 6,467,568 | ||||||||||
Long-term debt |
9,399 |
15,403 |
||||||||||
Liabilities of discontinued operations |
170,973 | 217,241 | ||||||||||
Other liabilities |
9,141 | 6,053 | ||||||||||
Total liabilities |
6,099,073 | 6,706,265 | ||||||||||
Commitments and contingencies |
||||||||||||
STOCKHOLDERS' EQUITY |
||||||||||||
Series A junior participating preferred stock, $0.01 par value; 2,500,000 shares authorized; none issued and outstanding |
— |
— |
||||||||||
Series B 9.375% redeemable preferred stock, $0.01 par value; liquidation value $16,904; 2,000,000 shares authorized, 676,156 noncumulative and 2,000,000 cumulative shares issued and outstanding as of September 30, 2009 and December 31, 2008, respectively |
7 | 20 | ||||||||||
Series C 9.125% redeemable preferred stock, $0.01 par value; liquidation value $35,389; 5,500,000 shares authorized; 1,415,564 noncumulative and 4,470,600 cumulative shares issued and outstanding as of September 30, 2009 and December 31, 2008, respectively |
14 | 45 | ||||||||||
Common stock, $0.01 par value; 200,000,000 shares authorized; 7,618,146 shares issued and outstanding as of September 30, 2009 and December 31, 2008, respectively |
76 | 76 | ||||||||||
Additional paid-in capital |
1,179,879 | 1,177,697 | ||||||||||
Net accumulated deficit: |
||||||||||||
Cumulative dividends declared |
(822,520 | ) | (815,077 | ) | ||||||||
Retained deficit |
(347,766 | ) | (353,509 | ) | ||||||||
Net accumulated deficit |
(1,170,286 | ) | (1,168,586 | ) | ||||||||
Total stockholders' equity |
9,690 | 9,252 | ||||||||||
Total liabilities and stockholders' equity |
$ | 6,108,763 | $ | 6,715,517 | ||||||||
See accompanying notes to consolidated financial statements.
1
IMPAC MORTGAGE HOLDINGS, INC. AND SUBSIDIARIES
CONSOLIDATED STATEMENTS OF OPERATIONS
(in thousands, except per share data)
(Unaudited)
| |
For the Three Months Ended September 30, |
For the Nine Months Ended September 30, |
|||||||||||||
|---|---|---|---|---|---|---|---|---|---|---|---|---|---|---|---|
| |
2009 | 2008 | 2009 | 2008 | |||||||||||
INTEREST INCOME |
$ | 341,323 | $ | 397,445 | $ | 1,508,230 | $ | 1,077,256 | |||||||
INTEREST EXPENSE |
339,417 |
394,431 |
1,499,729 |
1,062,637 |
|||||||||||
Net interest income |
1,906 | 3,014 | 8,501 | 14,619 | |||||||||||
NON-INTEREST INCOME: |
|||||||||||||||
Change in fair value of net trust assets, excluding REO |
46,325 | 7,778 | 234,167 | 145 | |||||||||||
Losses from real estate owned |
(43,160 | ) | (15,685 | ) | (218,083 | ) | (24,771 | ) | |||||||
Non-interest income—net trust assets |
3,165 | (7,907 | ) | 16,084 | (24,626 | ) | |||||||||
Change in fair value of long-term debt |
341 |
10,494 |
682 |
5,473 |
|||||||||||
Real estate advisory fees |
— | 7,039 | — | 15,581 | |||||||||||
Mortgage and real estate services fees |
13,514 | 2,923 | 32,296 | 7,078 | |||||||||||
Other |
(107 | ) | (1,076 | ) | (333 | ) | (1,791 | ) | |||||||
Total non-interest income |
16,913 | 11,473 | 48,729 | 1,715 | |||||||||||
NON-INTEREST EXPENSE: |
|||||||||||||||
General and administrative |
4,603 | 4,951 | 15,053 | 13,864 | |||||||||||
Personnel expense |
9,413 | 2,382 | 26,050 | 7,531 | |||||||||||
Total non-interest expense |
14,016 |
7,333 |
41,103 |
21,395 |
|||||||||||
Earnings (loss) from continuing operations before income taxes |
4,803 | 7,154 | 16,127 | (5,061 | ) | ||||||||||
Income tax expense from continuing operations |
— | 5,253 | 2,018 | 13,980 | |||||||||||
Earnings (loss) from continuing operations |
4,803 | 1,901 | 14,109 | (19,041 | ) | ||||||||||
Loss from discontinued operations, net of tax |
(1,776 | ) | (18,121 | ) | (8,366 | ) | (28,481 | ) | |||||||
Net earnings (loss) |
3,027 | (16,220 | ) | 5,743 | (47,522 | ) | |||||||||
Cash dividends on preferred stock |
— | (3,722 | ) | (7,443 | ) | (11,165 | ) | ||||||||
Net earnings (loss) attributable to common stockholders |
$ | 3,027 | $ | (19,942 | ) | $ | (1,700 | ) | $ | (58,687 | ) | ||||
Earnings (loss) per common share—basic and diluted: |
|||||||||||||||
Earnings (loss) from continuing operations |
$ | 0.60 | $ | (0.24 | ) | $ | 0.88 | $ | (3.97 | ) | |||||
Loss from discontinued operations |
(0.22 | ) | (2.38 | ) | (1.10 | ) | (3.74 | ) | |||||||
Earnings (loss) per share attributable to common stockholders |
$ | 0.38 | $ | (2.62 | ) | $ | (0.22 | ) | $ | (7.71 | ) | ||||
See accompanying notes to consolidated financial statements
2
IMPAC MORTGAGE HOLDINGS, INC. AND SUBSIDIARIES
CONSOLIDATED STATEMENTS OF CASH FLOWS
(in thousands)
(Unaudited)
| |
For the Nine Months Ended September 30, |
||||||||
|---|---|---|---|---|---|---|---|---|---|
| |
2009 | 2008 | |||||||
CASH FLOWS FROM OPERATING ACTIVITIES: |
|||||||||
Earnings (loss) from continuing operations |
$ | 14,109 | $ | (19,041 | ) | ||||
Losses from real estate owned |
218,083 |
24,771 |
|||||||
Amortization and impairment of deferred charge, net |
1,998 | 13,980 | |||||||
Amortization and impairment of mortgage servicing rights |
— | 1,363 | |||||||
Change in fair value of net trust assets, excluding REO |
(392,962 | ) | (113,000 | ) | |||||
Change in fair value of long-term debt |
(682 | ) | (5,473 | ) | |||||
Accretion of interest income and expense |
553,813 | 385,759 | |||||||
Stock-based compensation |
3,297 | 901 | |||||||
Net cash provided by operating activities of discontinued operations |
12,590 | 89,973 | |||||||
Net change in other assets and liabilities |
(102,970 | ) | (42,135 | ) | |||||
Net cash provided by operating activities |
307,276 | 337,098 | |||||||
CASH FLOWS FROM INVESTING ACTIVITIES: |
|||||||||
Net change in securitized mortgage collateral |
663,938 | 1,409,506 | |||||||
Net change in mortgages held-for-investment |
406 | 59 | |||||||
Purchase of premises and equipment |
(378 | ) | 357 | ||||||
Purchase of short-term investments |
(5,041 | ) | — | ||||||
Net principal change on investment securities available-for-sale |
3,889 | 2,358 | |||||||
Proceeds from the sale of real estate owned |
596,423 | 351,183 | |||||||
Net cash provided by investing activities of discontinued operations |
14,148 | 13,613 | |||||||
Net cash provided by investing activities |
1,273,385 | 1,777,076 | |||||||
CASH FLOWS FROM FINANCING ACTIVITIES: |
|||||||||
Settlement of trust preferred securities |
(4,275 | ) | — | ||||||
Repurchase of preferred stock |
(1,259 | ) | — | ||||||
Preferred stock dividends paid |
(7,443 | ) | (11,165 | ) | |||||
Repayment of securitized mortgage borrowings |
(1,537,530 | ) | (1,962,577 | ) | |||||
Net cash used in financing activities of discontinued operations |
(37,622 | ) | (142,345 | ) | |||||
Net cash used in financing activities |
(1,588,129 | ) | (2,116,087 | ) | |||||
Net change in cash and cash equivalents |
(7,468 |
) |
(1,913 |
) |
|||||
Cash and cash equivalents at beginning of period |
46,228 | 26,462 | |||||||
Cash and cash equivalents at end of period—Continuing Operations |
37,893 | 24,536 | |||||||
Cash and cash equivalents at end of period—Discontinued Operations |
867 | 13 | |||||||
Total cash and cash equivalents at end of period |
$ | 38,760 | $ | 24,549 | |||||
NON-CASH TRANSACTIONS (Continuing and Discontinued Operations): |
|||||||||
Transfer of loans held-for-sale and held-for-investment to real estate owned |
$ | 12,540 | $ | 3,009 | |||||
Transfer of securitized mortgage collateral to real estate owned |
279,368 | 628,779 | |||||||
Transfer of assets from discontinued operations to continuing operations |
— | 25,600 | |||||||
See accompanying notes to consolidated financial statements.
3
IMPAC MORTGAGE HOLDINGS, INC. AND SUBSIDIARIES
NOTES TO UNAUDITED CONSOLIDATED FINANCIAL STATEMENTS
(dollars in thousands, except share and per
share data or as otherwise indicated)
Note A—Summary of Business, Significant Accounting Policies and Legal Proceedings
1. Business Summary and Financial Statement Presentation
Business Summary
Impac Mortgage Holdings, Inc. (the Company or IMH) is a Maryland corporation incorporated in August 1995 and has the following subsidiaries: Integrated Real Estate Service Corporation (IRES), IMH Assets Corp. (IMH Assets), Impac Warehouse Lending Group, Inc. (IWLG), and Impac Funding Corporation (IFC), together with its wholly-owned subsidiaries Impac Secured Assets Corp. (ISAC) and Impac Commercial Capital Corporation (ICCC).
In the first quarter of 2009, the Company created a new subsidiary, Integrated Real Estate Service Corporation, which includes mortgage and real estate fee-based businesses and entities.
The Company's continuing operations include the long-term mortgage portfolio (residual interests in securitizations reflected as net trust assets and liabilities in the consolidated balance sheets) and the mortgage and real estate fee-based businesses conducted by IRES. The discontinued operations include the former non-conforming mortgage and retail operations conducted by IFC, commercial operations conducted by ICCC, and warehouse lending operations conducted by IWLG.
Effective January 1, 2009, the Company revoked its election to be taxed as a real estate investment trust (REIT). As a result of revoking this election, the Company is subject to income taxes as a regular (Subchapter C) corporation. As of December 31, 2008, the Company had estimated federal and California net operating loss carryforwards of $356.2 million and $627.2 million, respectively.
The information contained throughout this document is presented on a continuing operations basis, unless otherwise stated.
Financial Statement Presentation
The accompanying unaudited consolidated financial statements of IMH and its subsidiaries (as defined above) have been prepared in accordance with Accounting Principles Generally Accepted in the United States of America (GAAP) for interim financial information and with the instructions to Form 10-Q and Rule 10-01 of Regulation S-X. Accordingly, they do not include all of the information and footnotes required by GAAP for complete financial statements. In the opinion of management, all adjustments, consisting of normal recurring adjustments considered necessary for a fair presentation, have been included. Operating results for the three and nine month periods ended September 30, 2009 are not necessarily indicative of the results that may be expected for the year ending December 31, 2009. These interim period condensed consolidated financial statements should be read in conjunction with the Company's audited consolidated financial statements, which are included in the Company's Annual Report on Form 10-K for the year ended December 31, 2008, filed with the United States Securities and Exchange Commission (SEC).
All significant inter-company balances and transactions have been eliminated in consolidation. In addition, certain amounts in the prior periods' consolidated financial statements have been reclassified to conform to the current year presentation.
Management has made a number of estimates and assumptions relating to the reporting of assets and liabilities, the disclosure of contingent assets and liabilities at the date of the financial statements
4
IMPAC MORTGAGE HOLDINGS, INC. AND SUBSIDIARIES
NOTES TO UNAUDITED CONSOLIDATED FINANCIAL STATEMENTS (Continued)
(dollars in thousands, except share and per share data or as otherwise indicated)
Note A—Summary of Business, Significant Accounting Policies and Legal Proceedings (Continued)
and the reported amounts of revenues and expenses during the reporting period to prepare these consolidated financial statements in conformity with GAAP. The items affected by such estimates and assumptions include the valuation of trust assets and trust liabilities, the valuation of repurchase liabilities related to sold loans, the valuation of long-term debt and the valuation of loans held-for-sale. Actual results could differ from those estimates and assumptions.
Market Conditions and Status of Operations
The economy continued to contract in the first nine months of 2009. Labor markets deteriorated rapidly as U.S. firms reduced the number of jobs driving the U.S. unemployment rate higher. Higher unemployment and weaker overall economic conditions have led to a significant increase in the number of loan defaults, while continued weak housing prices have driven a significant increase in loan loss severities. Defaults remain elevated as the economy and housing market continue to struggle. The credit performance of the Company's long-term mortgage portfolio continues to be negatively affected by these economic conditions. Delinquencies and nonperforming loans and assets increased as a percentage of loans outstanding. Additional deterioration in the overall economic environment, including continued weakening of the labor market, could cause loan delinquencies to increase beyond the Company's current expectations, resulting in additional increases in losses and reductions in fair value.
During the first quarter of 2009, the Company initiated various mortgage and real estate fee-based businesses, including loan modifications, real estate disposition, monitoring and surveillance services, real estate brokerage and lending services and escrow services. For the three and nine month periods ended September 30, 2009, mortgage and real estate services fees were $13.5 million and $32.3 million, respectively. However, since these businesses are newly formed and currently generate fees primarily from the Company's long-term mortgage portfolio, there remains uncertainty about their future success, including the ability to provide similar services to the marketplace.
In January 2009, the Company purchased and canceled $25.0 million in outstanding trust preferred securities of Impac Capital Trust #2 for $3.75 million and terminated the remaining debt.
In May 2009, the Company exchanged an aggregate of $51.3 million in trust preferred securities of Impac Capital Trusts #1 and #3 for junior subordinated notes with an aggregate principal balance of $62.0 million and a maturity date in March 2034. Under the terms of the exchange, the interest rate for each note was reduced from the original 8.01 percent to 2.00 percent through 2013 with increases of 1.00 percent per year through 2017. Starting in 2018, the interest rates become variable at three-month London Inter-bank Offered Rate (LIBOR) plus 375 basis points. In connection with the exchange, the Company paid a fee of $0.5 million. Refer to Note H—Long-term Debt for additional information.
In June 2009, the Company purchased and canceled $1.0 million in outstanding trust preferred securities of Impac Capital Trust #4 for $150 thousand.
In August 2009, the Company purchased and canceled $2.5 million in outstanding trust preferred securities of Impac Capital Trust #4 for $375 thousand, resulting in $8.5 million in outstanding trust preferred securities. In July 2009, the Company became current and is no longer deferring interest on its remaining trust preferred securities.
5
IMPAC MORTGAGE HOLDINGS, INC. AND SUBSIDIARIES
NOTES TO UNAUDITED CONSOLIDATED FINANCIAL STATEMENTS (Continued)
(dollars in thousands, except share and per share data or as otherwise indicated)
Note A—Summary of Business, Significant Accounting Policies and Legal Proceedings (Continued)
As a result of the restructuring of $51.3 million and purchase and cancelation of $36.5 million in outstanding trust preferred securities, the Company reduced its annual interest expense obligation from $7.8 million to $2.0 million. With the restructuring and purchase and cancelations of trust preferred securities, the Company has $8.5 million in outstanding trust preferred securities of Impac Capital Trust #4 and $62.0 million in outstanding junior subordinated notes.
In June 2009, the Company completed the Offer to Purchase and Consent Solicitation (the "Offer to Purchase") of all of its 9.375% Series B Cumulative Redeemable Preferred Stock and 9.125% Series C Cumulative Redeemable Preferred Stock. The Series B Preferred Stock had a liquidation preference of $50 million and the Series C Preferred Stock had a liquidation preference of $111.8 million, for a total of $161.8 million. Upon expiration of the Offer to Purchase, holders of approximately 68% of the Preferred Stock tendered an aggregate of 4,378,880 shares. Holders of the Company's Series B Preferred Stock tendered 1,323,844 shares at $0.29297 per share for a total of $388 thousand. Holders of the Company's Series C Preferred Stock tendered 3,055,036 shares at $0.28516 per share for a total of $871 thousand. The aggregate purchase price for the Preferred Stock was $1.3 million. In addition, in connection with completing the Offer to Purchase, the Company paid $7.4 million accumulated but unpaid dividends on its Preferred Stock. With the total cash payment of $8.7 million, the Company eliminated $109.5 million of liquidation preference on its Preferred Stock. After the completion of the Offer to Purchase, the Company has outstanding $52.3 million liquidation preference of Series B and Series C noncumulative Preferred Stock.
With completion of the Offer to Purchase and modification to the terms of the Series B Preferred Stock and Series C Preferred Stock, the Company eliminated its $14.9 million annual preferred dividend obligation. Refer to Note I—Preferred Stock Repurchase for additional information.
In October 2009, the Company entered into a settlement agreement (the "Settlement Agreement") with its remaining reverse repurchase facility lender to settle the Restructured Financing. The Settlement Agreement retires the current facility and removes any further exposure associated with the line or the loans that secured the line. Pursuant to the terms of the Settlement Agreement, the Company settled the $140.0 million balance of the reverse repurchase line by transferring the loans securing the line to the lender at their approximate carrying values, resulting in a cash payment of $20.0 million and the Company entering into a credit agreement with the lender (the "Credit Agreement") for a $33.9 million term loan. The borrowing under the Credit Agreement, which is to be paid over 18 months, bears interest at a rate of one-month LIBOR plus 350 basis points and requires monthly payments of $1.5 million. In addition to the monthly payments of $1.5 million, a $10.0 million principal payment is due by April 2010 as part of the Credit Agreement. Refer to Note G—Restructured Financing (Discontinued Operations) for additional information.
2. Recent Accounting Pronouncements
Recently Adopted Accounting Pronouncements
In June 2009, the Financial Accounting Standards Board (FASB) issued SFAS No. 168, "The FASB Accounting Standards Codification and the Hierarchy of Generally Accepted Accounting Principles"—a replacement of FASB Statement No 162 (SFAS 168). Under SFAS 168, The FASB Accounting Standards Codification (Codification or ASC) became the source of authoritative GAAP recognized by
6
IMPAC MORTGAGE HOLDINGS, INC. AND SUBSIDIARIES
NOTES TO UNAUDITED CONSOLIDATED FINANCIAL STATEMENTS (Continued)
(dollars in thousands, except share and per share data or as otherwise indicated)
Note A—Summary of Business, Significant Accounting Policies and Legal Proceedings (Continued)
the FASB to be applied by nongovernmental entities. Rules and interpretive releases of the SEC under authority of federal securities laws are also sources of authoritative GAAP for SEC registrants. On July 1, 2009, the Codification superseded all then-existing non-SEC accounting and reporting standards for non-governmental entities. All other non-grandfathered non-SEC accounting literature not included in the Codification became non-authoritative at that time. SFAS 168 is effective for interim and annual periods ending after September 15, 2009. The adoption of SFAS 168 did not have a significant impact on the Company's consolidated financial statements.
In May 2009, the FASB issued Statement of Financial Accounting Standard (SFAS) No. 165, "Subsequent Events" (SFAS 165), which was incorporated into FASB ASC 855-10 "Subsequent Events—Overall" (FASB ASC 855-10). FASB ASC 855-10, which is effective for interim and annual periods ending after June 15, 2009, establishes general standards of and accounting for and disclosure of events that occur after the balance sheet date but before financial statements are issued or are available to be issued. The adoption of FASB ASC 855-10 did not have an impact on the Company's consolidated financial statements.
In April 2009, the FASB issued three FASB Staff Positions (FSP) related to fair value measurements:
- •
- FSP No. FAS 157-4 "Determining Fair Value When the Volume and Level of Activity for the Asset or
Liability Have Significantly Decreased and Identifying Transactions That Are Not Orderly" (FASB ASC 820-10-65-4)
- •
- FSP No. FAS 107-1 and APB 28-1 "Interim Disclosures about Fair Value of Financial
Instruments" (FASB ASC 825-10-65-1)
- •
- FSP No. FAS 115-2 and FAS 124-2 "Recognition and Presentation of Other-Than-Temporary Impairments" (FASB ASC 320-10-65-1)
FASB ASC 820-10-65-4 provides additional guidance for estimating fair value in accordance with FASB ASC 820-10 (formerly SFAS No. 157 "Fair Value Measurements" (SFAS 157)) when the volume and level of market activity for the asset or liability have significantly decreased. FASB ASC 820-10-65-4 also includes guidance on identifying circumstances that indicate a transaction is not orderly. It acknowledges that in these circumstances quoted prices may not be determinative of fair value. FASB ASC 820-10-65-4 emphasizes that even if there has been a significant decrease in the volume and level of market activity for the asset or liability and regardless of the valuation technique(s) used, the objective of a fair value measurement remains the same. Fair value is the price that would be received to sell an asset or paid to transfer a liability in an orderly transaction (that is, not a forced liquidation or distressed sale) between market participants at the measurement date under current market conditions. Prior to the clarifications included in FASB ASC 820-10-65-4, many companies, including the Company, interpreted FASB ASC 820-10 to emphasize the use of most recently available quoted market prices in estimating fair value, regardless of whether markets had experienced a significant decline in the volume and level of activity relative to normal conditions and/or increased frequency of transactions that are not orderly.
Under FASB ASC 820-10-65-4, quoted prices for assets or liabilities in inactive markets may require adjustment due to uncertainty as to whether the underlying transactions are orderly. There is
7
IMPAC MORTGAGE HOLDINGS, INC. AND SUBSIDIARIES
NOTES TO UNAUDITED CONSOLIDATED FINANCIAL STATEMENTS (Continued)
(dollars in thousands, except share and per share data or as otherwise indicated)
Note A—Summary of Business, Significant Accounting Policies and Legal Proceedings (Continued)
little information, if any, to evaluate if individual transactions are orderly in an inactive market. Accordingly, the Company is required to evaluate the facts and circumstances to determine whether the transaction is orderly based on the weight of the evidence. FASB ASC 820-10-65-4 does not designate a specific method for adjusting a transaction or quoted price, however, it does provide guidance for determining how much weight to give a transaction or quoted price. Price quotes derived from transactions that are not orderly are not considered to be determinative of fair value and should be given less weight, if any, when estimating fair value.
The adoption of FASB ASC 820-10-65-4 on April 1, 2009 resulted in an increase of $13.3 million in net trust assets, which is included in change in fair value of net trust assets in the accompanying consolidated statements of operations. Offsetting this increase were decreases in the fair values of trust assets and trust liabilities as a result of the Company increasing loss assumptions for its long-term mortgage portfolio due to increases in expected defaults and loss severities related to the weak economy and housing market.
FASB ASC 825-10-65-1 requires disclosures about fair value of financial instruments for interim reporting periods of publicly traded companies as well as in annual financial statements. The adoption of FASB ASC 825-10-65-1, which became effective for interim reporting periods ending after June 15, 2009, did not have a significant effect on the Company's consolidated financial statements.
FASB ASC 320-10-65-1 amends the other-than-temporary impairment guidance in GAAP for debt securities to make the guidance more operational and improve the presentation and disclosure of other-than-temporary impairments on debt and equity securities in the financial statements. For debt securities, the pronouncement requires that an entity assess whether it (a) has the intent to sell the debt security or (b) more likely than not will be required to sell the debt security before its anticipated recovery. If either of these conditions is met, the Company would be required to recognize other-than-temporary impairment. The adoption of FASB ASC 320-10-65-1, which became effective for interim reporting periods ending after June 15, 2009, did not have a significant effect on the Company's consolidated financial statements.
Effective January 1, 2009, the Company adopted EITF No. 08-5, "Issuer's Accounting for Liabilities Measured at Fair Value with a Third-Party Credit Enhancement," which was incorporated into FASB ASC 820-10. FASB ASC 820-10-35 addresses whether issuers of liabilities should consider the effect of the third-party credit enhancement when measuring the liability at fair value. It requires that the issuer of a liability with a third-party credit enhancement that is inseparable from the liability shall not include the effect of the credit enhancement in the fair value measurement of the liability. The adoption of FASB ASC 820-10-35 did not have a significant impact on the Company's consolidated financial statements.
Effective January 1, 2009, application of FASB ASC 820-10-65 to nonfinancial assets and liabilities is required. As a result of the adoption of FASB ASC 820-10-65 for such assets and liabilities, the Company has included additional disclosures as of and for the three and nine months ended September 30, 2009 for nonrecurring fair value measurements related to its nonfinancial assets and liabilities (which include loans held for sale, REO, lease liability and deferred charge).
8
IMPAC MORTGAGE HOLDINGS, INC. AND SUBSIDIARIES
NOTES TO UNAUDITED CONSOLIDATED FINANCIAL STATEMENTS (Continued)
(dollars in thousands, except share and per share data or as otherwise indicated)
Note A—Summary of Business, Significant Accounting Policies and Legal Proceedings (Continued)
Recently Issued Accounting Pronouncements
In August 2009, the FASB issued Accounting Standards Update (ASU) 2009-05 "Fair Value Measurements and Disclosures (Topic 820)—Measuring Liabilities at Fair Value" (ASU 2009-05). ASU 2009-05 provides amendments to ASC Subtopic 820-10, Fair Value Measurements and Disclosures—Overall of the FASB Accounting Standards Codification for the fair value measurement of liabilities. The amendments provide clarification that in circumstances in which a quoted price in an active market for an identical liability is not available, companies are required to measure value using one or more of the techniques prescribed by the standard. Valuation techniques include the quoted price of the identical liability when traded as an asset, quoted prices of similar liabilities or similar liabilities when traded as an asset, and other valuation techniques consistent with the principles of FASB ASC 820. The amendments also clarify that when estimating the fair value of a liability, companies are not required to include a separate input or adjustment to other inputs relating to the existence of a restriction that prevents the transfer of the liability. ASU 2009-05 is effective for the first reporting period beginning after issuance. The Company does not expect the amendments to have a material impact on its consolidated financial statements.
In June 2009, the FASB issued SFAS No. 166, "Accounting for Transfers of Financial Assets—An Amendment of FASB Statement 140" and SFAS No. 167, "Amendments to FASB Interpretation No. 46(R)". These statements eliminated the concept of a qualifying special purpose entity (QSPE), created more stringent conditions for reporting a transfer of a portion of a financial asset as a sale, clarified other sale-accounting criteria, and changed the initial measurement of a transferor's interest in transferred financial assets. Former QSPEs will be evaluated for consolidation based on the provisions of FASB ASC 810-10-25, which changes the approach to determining a variable interest entity's (VIE) primary beneficiary and requires companies to more frequently reassess whether they must consolidate or deconsolidate VIEs. The accounting standard requires a qualitative, rather than quantitative, analysis to determine the primary beneficiary of a VIE for consolidation purposes. The primary beneficiary of a VIE is the enterprise that has (a) the power to direct the VIE activities that most significantly affect the VIE's economic performance, and (b) the right to receive benefits of the VIE that could potentially be significant to the VIE or the obligation to absorb losses of the VIE that could potentially be significant to the VIE. These statements are effective for fiscal years and interim periods ending after November 15, 2009. The Company is currently evaluating the impact of these new pronouncements on its financial statements. While management of the Company has not completed its evaluation, the Company may be required to consolidate certain trust assets and trust liabilities related to assets previously sold to QSPEs. As of September 30, 2009, the current principal balance of QSPEs to which the Company, acting as principal, had transferred assets and received sales treatment were $547.2 million. The Company's investment in these QSPEs consists of residual interests currently accounted for as investment securities available-for-sale in its consolidated balance sheets.
3. Income Taxes and Deferred Charge
Effective January 1, 2009, the Company revoked its election to be taxed as a REIT. As a result of revoking this election, the Company is subject to income taxes as a regular (Subchapter C) corporation.
Prior to January 1, 2009, the Company operated as a REIT under the requirements of the Internal Revenue Code. Requirements for qualification as a REIT included various restrictions on ownership of
9
IMPAC MORTGAGE HOLDINGS, INC. AND SUBSIDIARIES
NOTES TO UNAUDITED CONSOLIDATED FINANCIAL STATEMENTS (Continued)
(dollars in thousands, except share and per share data or as otherwise indicated)
Note A—Summary of Business, Significant Accounting Policies and Legal Proceedings (Continued)
IMH's stock, requirements concerning distribution of taxable income and certain restrictions on the nature of assets and sources of income.
As of December 31, 2008, the Company had estimated federal and California net operating loss carryforwards of $356.2 million and $627.2 million, respectively. As of December 31, 2008, the Company's taxable REIT subsidiary had an estimated federal net operating loss tax carryforward of $293.4 million. The federal net operating loss carryforward of the Company's taxable REIT subsidiary, utilization of which may be limited to such subsidiary, begins to expire in the year 2027. As of December 31, 2008, the Company and the Company's taxable REIT subsidiary had federal deferred tax assets of approximately $629 million and $106 million, respectively, and a combined California deferred tax asset in the amount of $181.5 million. The Company recorded a full valuation allowance against the deferred tax assets as it believes that as of September 30, 2009 it is more likely than not that the deferred tax assets will not be recoverable.
In accordance with ASC 810-10-45-8 the Company records a deferred charge representing the deferral of income tax expense on inter-company profits that resulted from the sale of mortgages from taxable subsidiaries to IMH in prior years. The deferred charge is included in other assets in the accompanying consolidated balance sheets and is amortized as a component of income tax expense in the accompanying consolidated statements of operations over the estimated life of the mortgages retained in the securitized mortgage collateral. The Company recorded income tax expense of zero and $2.0 million for the three and nine months ended September 30, 2009, respectively, compared to $5.3 million and $14.0 million for the three and nine months ended September 30, 2008, respectively. The income tax expense is primarily the result of the amount of the deferred charge amortized and/or impaired resulting from credit losses, which does not result in any tax liability required to be paid.
4. Legal Proceedings
The Company is party to litigation and claims which arise in the ordinary course of business.
In the matter of Sharon Page v. Impac Mortgage Holdings, Inc., et al, which was filed in the United States District Court, Central District of California and alleged breaches of fiduciary duties, conflicts of interest and fiduciary liability, a settlement was reached and confirmed by the Court. As part of the settlement, the Company agreed to (i) issue common stock to class members, (ii) make available to the class members free of charge investment training classes once per month for one year and (iii) pay certain attorneys fees. Pursuant to the settlement agreement, on October 27, 2009, the Company issued 80,000 shares of common stock.
On September 24, 2009, an action was filed in the United States district Court, Central district of California entitled Federal Deposit Insurance Corporation as Receiver for Indymac bank, F.S.B. v. Impac Funding Corporation as case No. CV09-6965 RC. The case claims damages for breach of contract based upon repurchase claims for loans sold to Indymac Bank. The action seeks $2.1 million in damages plus interest and attorneys fees.
Please refer to IMH's report on Form 10-K for the year ended December 31, 2008 for a description of other litigation and claims.
10
IMPAC MORTGAGE HOLDINGS, INC. AND SUBSIDIARIES
NOTES TO UNAUDITED CONSOLIDATED FINANCIAL STATEMENTS (Continued)
(dollars in thousands, except share and per share data or as otherwise indicated)
Note A—Summary of Business, Significant Accounting Policies and Legal Proceedings (Continued)
We believe that we have meritorious defenses to the above claims and intend to defend these claims vigorously and as such the Company believes the final outcome of such matters will not have a material adverse effect on our financial condition or results of operations. Nevertheless, litigation is uncertain and we may not prevail in the lawsuits and can express no opinion as to their ultimate resolution. An adverse judgment in any of these matters could have a material adverse effect on our financial position and results of operations.
Note B—Fair Value of Financial Instruments
The use of fair value to measure the Company's financial instruments is fundamental to its consolidated financial statements and is a critical accounting estimate because a substantial portion of its assets and liabilities are recorded at estimated fair value.
Effective April 1, 2009, the Company adopted the provisions of FASB ASC 820-10-65-4 (formerly FSP No. FAS 157-4), which address determining fair value when there has been a significant decrease in the volume and level of activity for an asset or liability compared to normal market activity for those or similar assets or liabilities. When significant decreases in the volume and level of activity for assets and liabilities are present, transaction and quoted prices may not be indicative of fair value. In these instances, the Company performs additional analysis of the transaction and quoted prices and may apply significant adjustments to those prices in estimating fair value. In determining which adjustments may be needed, the Company considers the nature of the quote (indicative price or binding offer) when weighting the available evidence. In the absence of transaction or quoted prices based on normal market activity, the Company may use valuation techniques that reflect management's views as to the assumptions that market participants would use in pricing the assets and liabilities.
Prior to adoption of the provisions of FASB ASC 820-10-65-4, the Company used independent broker quoted prices (unadjusted and non-binding quotes) to estimate fair value for substantially all of its securitized mortgage borrowings.
For securitized mortgage collateral and securitized mortgage borrowings, the underlying Alt-A residential and commercial loans and mortgage-backed securities market have experienced significant declines in market activity, along with a lack of orderly transactions. The Company's methodology to estimate fair value of these assets and liabilities included the use of internal pricing techniques such as the net present value of future expected cash flows (with observable market participant assumptions, where available) discounted at a rate of return based on the Company's estimates of market participant requirements. The significant assumptions utilized in these internal pricing techniques, which were based on the characteristics of the underlying collateral, included estimated credit losses, estimated prepayment speeds and appropriate discount rates.
11
IMPAC MORTGAGE HOLDINGS, INC. AND SUBSIDIARIES
NOTES TO UNAUDITED CONSOLIDATED FINANCIAL STATEMENTS (Continued)
(dollars in thousands, except share and per share data or as otherwise indicated)
Note B—Fair Value of Financial Instruments (Continued)
The following table presents the estimated fair value of financial instruments included in the consolidated financial statements as of the dates indicated:
| |
September 30, 2009 | December 31, 2008 | |||||||||||
|---|---|---|---|---|---|---|---|---|---|---|---|---|---|
| |
Carrying Amount |
Estimated Fair Value |
Carrying Amount |
Estimated Fair Value |
|||||||||
Assets |
|||||||||||||
Cash and cash equivalents |
$ | 37,893 | $ | 37,893 | $ | 46,215 | 46,215 | ||||||
Restricted cash |
1,252 | 1,252 | 1,243 | 1,243 | |||||||||
Short-term investments |
5,014 | 5,043 | — | — | |||||||||
Investment securities available-for-sale |
1,049 | 1,049 | 2,068 | 2,068 | |||||||||
Securitized mortgage collateral |
5,767,379 | 5,767,379 | 5,894,424 | 5,894,424 | |||||||||
Derivative assets |
222 | 222 | 37 | 37 | |||||||||
Liabilities |
|||||||||||||
Securitized mortgage borrowings |
$ | 5,744,725 | $ | 5,744,725 | $ | 6,193,984 | $ | 6,193,984 | |||||
Derivative liabilities |
164,835 | 164,835 | 273,584 | 273,584 | |||||||||
Long-term debt |
9,399 | 9,399 | 15,403 | 15,403 | |||||||||
The fair value amounts above have been estimated by management using available market information and appropriate valuation methodologies. Considerable judgment is required to interpret market data to develop the estimates of fair value in both inactive and orderly markets. Accordingly, the estimates presented are not necessarily indicative of the amounts that could be realized in a current market exchange. The use of different market assumptions and/or estimation methodologies may have a material effect on the estimated fair value amounts.
The carrying amount of cash and cash equivalents and restricted cash approximates fair value. Short-term investments are recorded at amortized cost. The fair value of short-term investments is determined using quoted prices in active markets. Refer to Recurring fair value measurements below for a description of the valuation methods used to determine the fair value of investment securities available for sale, securitized mortgage collateral and borrowings, derivative assets and liabilities and long-term debt.
Recurring Fair Value Measurements
The application of fair value measurements may be on a recurring or nonrecurring basis depending on the accounting principles applicable to the specific asset or liability or whether management has elected to carry the item at its estimated fair value.
12
IMPAC MORTGAGE HOLDINGS, INC. AND SUBSIDIARIES
NOTES TO UNAUDITED CONSOLIDATED FINANCIAL STATEMENTS (Continued)
(dollars in thousands, except share and per share data or as otherwise indicated)
Note B—Fair Value of Financial Instruments (Continued)
FASB ASC 820-10-35 specifies a hierarchy of valuation techniques based on whether the inputs to those techniques are observable or unobservable. Observable inputs reflect market data obtained from independent sources, while unobservable inputs reflect the Company's market assumptions. These two types of inputs create the following fair value hierarchy:
- •
- Level 1—Quoted prices (unadjusted) in active markets for identical instruments or liabilities that an
entity has the ability to assess at measurement date.
- •
- Level 2—Quoted prices for similar instruments in active markets; quoted prices for identical or similar
instruments in markets that are not active; inputs other than quoted prices that are observable for an asset or liability, including interest rates and yield curves observable at commonly quoted
intervals, prepayment speeds, loss severities, credit risks and default rates; and market-corroborated inputs.
- •
- Level 3—Valuations derived from valuation techniques in which one or more significant inputs or significant value drivers are unobservable.
This hierarchy requires the Company to use observable market data, when available, and to minimize the use of unobservable inputs when estimating fair value.
The following tables present the Company's assets and liabilities that are measured at estimated fair value on a recurring basis, including financial instruments for which the Company has elected the fair value option at September 30, 2009 and December 31, 2008, based on the fair value hierarchy:
| |
Recurring Fair Value Measurements | ||||||||||||||||||||
|---|---|---|---|---|---|---|---|---|---|---|---|---|---|---|---|---|---|---|---|---|---|
| |
September 30, 2009 | December 31, 2008 | |||||||||||||||||||
| |
Level 1 | Level 2 | Level 3 | Level 1 | Level 2 | Level 3 | |||||||||||||||
Assets |
|||||||||||||||||||||
Investment securities available-for-sale |
$ | — | $ | — | $ | 1,049 | $ | — | $ | — | $ | 2,068 | |||||||||
Securitized mortgage collateral |
— | — | 5,767,379 | — | — | 5,894,424 | |||||||||||||||
Total assets at fair value |
$ | — | $ | — | $ | 5,768,428 | $ | — | $ | — | $ | 5,896,492 | |||||||||
Liabilities |
|||||||||||||||||||||
Securitized mortgage borrowings |
$ | — | $ | — | $ | 5,744,725 | $ | — | $ | — | $ | 6,193,984 | |||||||||
Derivative liabilities, net(1) |
— | — | 164,613 | — | — | 273,547 | |||||||||||||||
Long-term debt |
— | — | 9,399 | — | — | 15,403 | |||||||||||||||
Total liabilities at fair value |
$ | — | $ | — | $ | 5,918,737 | $ | — | $ | — | $ | 6,482,934 | |||||||||
- (1)
- At September 30, 2009, derivative liabilities, net included $222 thousand in derivative assets and $164.8 million in derivative liabilities, included within trust assets and trust liabilities, respectively. At December 31, 2008, derivative liabilities, net included $37 thousand in derivative assets and $273.6 million in derivative liabilities, included within trust assets and trust liabilities, respectively.
As a result of the lack of observable market data resulting from inactive markets, the Company has classified its investment securities available-for-sale, securitized mortgage collateral and borrowings, net derivative liabilities and long-term debt as Level 3 fair value measurements at September 30, 2009
13
IMPAC MORTGAGE HOLDINGS, INC. AND SUBSIDIARIES
NOTES TO UNAUDITED CONSOLIDATED FINANCIAL STATEMENTS (Continued)
(dollars in thousands, except share and per share data or as otherwise indicated)
Note B—Fair Value of Financial Instruments (Continued)
and December 31, 2008. Level 3 assets and liabilities were 100 percent of total assets and total liabilities measured at estimated fair value at September 30, 2009 and December 31, 2008.
The following tables present a reconciliation for all assets and liabilities measured at estimated fair value on a recurring basis using significant unobservable inputs (Level 3) for the three and nine months ended September 30, 2009 and 2008:
| |
Level 3 Recurring Fair Value Measurements | |||||||||||||||||
|---|---|---|---|---|---|---|---|---|---|---|---|---|---|---|---|---|---|---|
| |
For the three months ended September 30, 2009 | |||||||||||||||||
| |
Investment securities available-for-sale |
Securitized mortgage collateral |
Securitized mortgage borrowings |
Derivative liabilities, net |
Long-term debt |
|||||||||||||
Fair value, June 30, 2009 |
$ | 1,332 | $ | 6,018,391 | $ | (6,080,637 | ) | $ | (184,672 | ) | $ | (9,797 | ) | |||||
Total gains (losses) included in earnings: |
||||||||||||||||||
Interest income(1) |
— | 139,958 | — | — | — | |||||||||||||
Interest expense(1) |
— | — | (312,226 | ) | — | (318 | ) | |||||||||||
Change in fair value of net trust assets, excluding REO |
1,160 | (79,422 | ) | 152,960 | (28,373 | ) | — | |||||||||||
Change in fair value of long-term debt |
— | — | — | — | 341 | |||||||||||||
Total gains (losses) included in earnings |
1,160 | 60,536 | (159,266 | ) | (28,373 | ) | 23 | |||||||||||
Transfers in and/or out of Level 3 |
— | — | — | — | — | |||||||||||||
Purchases, issuances and settlements |
(1,443 | ) | (311,548 | ) | 495,178 | 48,432 | 375 | |||||||||||
Fair value, September 30, 2009 |
$ | 1,049 | $ | 5,767,379 | $ | (5,744,725 | ) | $ | (164,613 | ) | $ | (9,399 | ) | |||||
Unrealized gains (losses) still held(2) |
$ | 709 | $ | (6,748,258 | ) | $ | 8,144,739 | $ | (166,793 | ) | $ | 61,721 | ||||||
- (1)
- Amounts
primarily represent accretion to recognize interest income and interest expense using effective yields based on estimated fair values for trust
assets and trust liabilities. The total net interest income, including cash received and paid, was $1.9 million for the three months ended September 30, 2009, as reflected in the
accompanying consolidated statement of operations.
- (2)
- Represents the amount of unrealized gains (losses) relating to assets and liabilities classified as Level 3 that are still held at September 30, 2009.
14
IMPAC MORTGAGE HOLDINGS, INC. AND SUBSIDIARIES
NOTES TO UNAUDITED CONSOLIDATED FINANCIAL STATEMENTS (Continued)
(dollars in thousands, except share and per share data or as otherwise indicated)
Note B—Fair Value of Financial Instruments (Continued)
| |
Level 3 Recurring Fair Value Measurements | |||||||||||||||||
|---|---|---|---|---|---|---|---|---|---|---|---|---|---|---|---|---|---|---|
| |
For the three months ended September 30, 2008 | |||||||||||||||||
| |
Investment securities available-for-sale |
Securitized mortgage collateral |
Securitized mortgage borrowings |
Derivative liabilities, net |
Long-term debt |
|||||||||||||
Fair value, June 30, 2008 |
$ | 8,644 | $ | 298,189 | $ | (316,968 | ) | $ | — | $ | (46,266 | ) | ||||||
Total gains (losses) included in earnings: |
||||||||||||||||||
Interest income(1) |
466 | 134,377 | — | — | — | |||||||||||||
Interest expense(1) |
— | — | (271,817 | ) | — | (126 | ) | |||||||||||
Change in fair value of net trust assets, excluding REO |
(3,092 | ) | (2,391,349 | ) | 2,413,109 | (10,890 | ) | — | ||||||||||
Change in fair value of long-term debt |
— | — | — | — | 10,494 | |||||||||||||
Total (losses) gains included in earnings |
(2,626 | ) | (2,256,972 | ) | 2,141,292 | (10,890 | ) | 10,368 | ||||||||||
Transfers in and/or out of Level 3(2) |
— | 10,747,133 | (11,180,164 | ) | (136,471 | ) | — | |||||||||||
Purchases, issuances and settlements |
(1,162 | ) | (534,355 | ) | 568,827 | 43,812 | — | |||||||||||
Fair value, September 30, 2008 |
$ | 4,856 | $ | 8,253,995 | $ | (8,787,013 | ) | $ | (103,549 | ) | $ | (35,898 | ) | |||||
Unrealized (losses) gains still held(3) |
$ | (7,070 | ) | $ | (6,408,849 | ) | $ | 7,113,480 | $ | (107,179 | ) | $ | 63,346 | |||||
- (1)
- Amounts
primarily represent accretion to recognize interest income and interest expense using effective yields based on estimated fair values for trust
assets and trust liabilities. The total net interest income, including cash received and paid, was $3.0 million for the three months ended September 30, 2008, as reflected in the
accompanying consolidated statement of operations.
- (2)
- Transfers
in and/or out of Level 3 are reflected using values as of the beginning of the period.
- (3)
- Represents the amount of unrealized (losses) gains relating to assets and liabilities classified as Level 3 that are still held at September 30, 2008.
15
IMPAC MORTGAGE HOLDINGS, INC. AND SUBSIDIARIES
NOTES TO UNAUDITED CONSOLIDATED FINANCIAL STATEMENTS (Continued)
(dollars in thousands, except share and per share data or as otherwise indicated)
Note B—Fair Value of Financial Instruments (Continued)
| |
Level 3 Recurring Fair Value Measurements | |||||||||||||||||
|---|---|---|---|---|---|---|---|---|---|---|---|---|---|---|---|---|---|---|
| |
For the nine months ended September 30, 2009 | |||||||||||||||||
| |
Investment securities available-for-sale |
Securitized mortgage collateral |
Securitized mortgage borrowings |
Derivative liabilities, net |
Long-term debt |
|||||||||||||
Fair value, December 31, 2008 |
$ | 2,068 | $ | 5,894,424 | $ | (6,193,984 | ) | $ | (273,547 | ) | $ | (15,403 | ) | |||||
Total gains (losses) included in earnings: |
||||||||||||||||||
Interest income(1) |
— | 850,079 | — | — | — | |||||||||||||
Interest expense(1) |
— | — | (1,403,248 | ) | — | (644 | ) | |||||||||||
Change in fair value of net trust assets, excluding REO |
2,870 | (33,818 | ) | 313,827 | (48,712 | ) | — | |||||||||||
Change in fair value of long-term debt |
— | — | — | — | 682 | |||||||||||||
Total gains (losses) included in earnings |
2,870 | 816,261 | (1,089,421 | ) | (48,712 | ) | 38 | |||||||||||
Transfers in and/or out of Level 3 |
— | — | — | — | — | |||||||||||||
Purchases, issuances and settlements |
(3,889 | ) | (943,306 | ) | 1,538,680 | 157,646 | 5,966 | |||||||||||
Fair value, September 30, 2009 |
$ | 1,049 | $ | 5,767,379 | $ | (5,744,725 | ) | $ | (164,613 | ) | $ | (9,399 | ) | |||||
- (1)
- Amounts primarily represent accretion to recognize interest income and interest expense using effective yields based on estimated fair values for trust assets and trust liabilities. The total net interest income, including cash received and paid, was $8.5 million for the nine months ended September 30, 2009, as reflected in the accompanying consolidated statement of operations.
16
IMPAC MORTGAGE HOLDINGS, INC. AND SUBSIDIARIES
NOTES TO UNAUDITED CONSOLIDATED FINANCIAL STATEMENTS (Continued)
(dollars in thousands, except share and per share data or as otherwise indicated)
Note B—Fair Value of Financial Instruments (Continued)
| |
Level 3 Recurring Fair Value Measurements | |
||||||||||||||||
|---|---|---|---|---|---|---|---|---|---|---|---|---|---|---|---|---|---|---|
| |
For the nine months ended September 30, 2008 | |
||||||||||||||||
| |
Investment securities available-for-sale |
Securitized mortgage collateral |
Securitized mortgage borrowings |
Derivative liabilities, net |
Long-term debt |
|||||||||||||
Fair value, January 1, 2008 |
$ | 15,248 | $ | 782,574 | $ | (767,704 | ) | $ | — | $ | (40,952 | ) | ||||||
Total gains (losses) included in earnings: |
||||||||||||||||||
Interest income(1) |
865 | 231,288 | — | — | — | |||||||||||||
Interest expense(1) |
— | — | (617,493 | ) | — | (419 | ) | |||||||||||
Change in fair value of net trust assets, excluding REO |
(8,899 | ) | (5,639,914 | ) | 5,743,357 | (94,399 | ) | — | ||||||||||
Change in fair value of long-term debt |
— | — | — | — | 5,473 | |||||||||||||
Total (losses) gains included in earnings |
(8,034 | ) | (5,408,626 | ) | 5,125,864 | (94,399 | ) | 5,054 | ||||||||||
Transfers in and/or out of Level 3(2) |
— | 14,919,649 | (15,109,073 | ) | (120,260 | ) | — | |||||||||||
Purchases, issuances and settlements |
(2,358 | ) | (2,039,602 | ) | 1,963,900 | 111,110 | — | |||||||||||
Fair value, September 30, 2008 |
$ | 4,856 | $ | 8,253,995 | $ | (8,787,013 | ) | $ | (103,549 | ) | $ | (35,898 | ) | |||||
- (1)
- Amounts
primarily represent accretion to recognize interest income and interest expense using effective yields based on estimated fair values for trust
assets and trust liabilities. The total net interest income, including cash received and paid, was $14.6 million for the nine months ended September 30, 2008, as reflected in the
accompanying consolidated statement of operations.
- (2)
- Transfers in and/or out of Level 3 are reflected using values as of the beginning of the period.
17
IMPAC MORTGAGE HOLDINGS, INC. AND SUBSIDIARIES
NOTES TO UNAUDITED CONSOLIDATED FINANCIAL STATEMENTS (Continued)
(dollars in thousands, except share and per share data or as otherwise indicated)
Note B—Fair Value of Financial Instruments (Continued)
The following is a description of the measurement techniques for items recorded at estimated fair value on a recurring basis.
Investment securities available-for-sale—The Company elected to carry all of its investment securities available-for-sale at fair value. The investment securities consist primarily of non-investment grade mortgage-backed securities. The fair value of the investment securities is measured based upon the Company's expectation of inputs that other market participants would use. Such assumptions include judgments about the underlying collateral, prepayment speeds, future credit losses, forward interest rates and certain other factors. Given the market disruption and lack of observable market data as of September 30, 2009 and December 31, 2008, the estimated fair value of the investment securities available-for-sale was measured using significant internal expectations of market participants' assumptions.
Securitized mortgage collateral—The Company elected to carry all of its securitized mortgage collateral at fair value. These assets consist primarily of non-conforming mortgage loans securitized between 2002 and 2007. Fair value measurements are based on the Company's internal models used to compute the net present value of future expected cash flows, with observable market participant assumptions, where available. The Company's assumptions include its expectations of inputs that other market participants would use in pricing these assets. These assumptions include judgments about the underlying collateral, prepayment speeds, estimated future credit losses, forward interest rates, investor yield requirements and certain other factors. As of September 30, 2009, securitized mortgage collateral had an unpaid principal balance of $12.5 billion, compared to an estimated fair value of $5.8 billion. The aggregate unpaid principal balance exceeds the fair value by $6.7 billion at September 30, 2009. As of September 30, 2009, the unpaid principal balance of loans 90 days or more past due was $2.6 billion compared to an estimated fair value of $0.8 billion. The aggregate unpaid principal balances of loans 90 days or more past due exceed the fair value by $1.8 billion at September 30, 2009.
Securitized mortgage borrowings—The Company elected to carry all of its securitized mortgage borrowings at fair value. These borrowings consist of individual tranches of bonds issued by securitization trusts and are primarily backed by non-conforming mortgage loans. Fair value measurements include the Company's judgments about the underlying collateral and assumptions such as prepayment speeds, estimated future credit losses, forward interest rates, investor yield requirements and certain other factors. As of September 30, 2009, securitized mortgage borrowings had an outstanding principal balance of $13.9 billion compared to an estimated fair value of $5.7 billion. The aggregate outstanding principal balance exceeds the fair value by $8.2 billion at September 30, 2009.
Long-term debt—The Company elected to carry all of its long-term debt (consisting of trust preferred securities and junior subordinated notes) at fair value. These securities were measured based upon an analysis prepared by management, which considered the Company's own credit risk, including recent settlements with trust preferred debt holders and discounted cash flow analysis of junior subordinated notes. As of September 30, 2009, long-term debt had an unpaid principal balance of $71.1 million compared to an estimated fair value of $9.4 million. The aggregate unpaid principal balance exceeds the fair value by $61.7 million at September 30, 2009.
18
IMPAC MORTGAGE HOLDINGS, INC. AND SUBSIDIARIES
NOTES TO UNAUDITED CONSOLIDATED FINANCIAL STATEMENTS (Continued)
(dollars in thousands, except share and per share data or as otherwise indicated)
Note B—Fair Value of Financial Instruments (Continued)
Derivative assets and liabilities—For non-exchange traded contracts, fair value is based on the amounts that would be required to settle the positions with the related counterparties as of the valuation date. Valuations of derivative assets and liabilities are based on observable market inputs, if available. To the extent observable market inputs are not available, fair values measurements include the Company's judgments about future cash flows, forward interest rates and certain other factors, including counterparty risk. Additionally, these values also take into account the Company's own credit standing, to the extent applicable; thus, the valuation of the derivative instrument includes the estimated value of the net credit differential between the counterparties to the derivative contract.
The following tables present the changes in recurring fair value measurements included in net earnings (loss) for the three and nine months ended September 30, 2009 and 2008:
| |
Recurring Fair Value Measurements | |||||||||||||||
|---|---|---|---|---|---|---|---|---|---|---|---|---|---|---|---|---|
| |
Changes in Fair Value Included in Net Earnings | |||||||||||||||
| |
For the three months ended September 30, 2009 | |||||||||||||||
| |
|
|
Change in Fair Value of | |
||||||||||||
| |
Interest Income(1) | Interest Expense(1) | Net Trust Assets | Long-term Debt | Total | |||||||||||
Investment securities available-for-sale |
$ | — | $ | — | $ | 1,160 | $ | — | $ | 1,160 | ||||||
Securitized mortgage collateral |
139,958 | — | (79,422 | ) | — | 60,536 | ||||||||||
Securitized mortgage borrowings |
— | (312,226 | ) | 152,960 | — | (159,266 | ) | |||||||||
Derivative instruments, net |
— | — | (28,373 | )(2) | — | (28,373 | ) | |||||||||
Long-term debt |
— | (318 | ) | — | 341 | 23 | ||||||||||
Total |
$ | 139,958 | $ | (312,544 | ) | $ | 46,325 | $ | 341 | $ | (125,920 | ) | ||||
- (1)
- Amounts
primarily represent accretion to recognize interest income and interest expense using effective yields based on estimated fair values for trust
assets and trust liabilities. The total net interest income, including cash received and paid, was $1.9 million for the three months ended September 30, 2009, as reflected in the
accompanying consolidated statement of operations.
- (2)
- Included in this amount is $20.4 million in changes in the fair value of derivative instruments, offset by $48.8 million in cash payments from the securitization trusts for the three months ended September 30, 2009.
19
IMPAC MORTGAGE HOLDINGS, INC. AND SUBSIDIARIES
NOTES TO UNAUDITED CONSOLIDATED FINANCIAL STATEMENTS (Continued)
(dollars in thousands, except share and per share data or as otherwise indicated)
Note B—Fair Value of Financial Instruments (Continued)
| |
Recurring Fair Value Measurements | |||||||||||||||
|---|---|---|---|---|---|---|---|---|---|---|---|---|---|---|---|---|
| |
Changes in Fair Value Included in Net Loss | |||||||||||||||
| |
For the three months ended September 30, 2008 | |||||||||||||||
| |
|
|
Change in Fair Value of | |
||||||||||||
| |
Interest Income(1) | Interest Expense(1) | Net Trust Assets | Long-term Debt | Total | |||||||||||
Investment securities available-for-sale |
$ | 466 | $ | — | $ | (3,092 | ) | $ | — | $ | (2,626 | ) | ||||
Securitized mortgage collateral |
134,377 | — | (2,391,349 | ) | — | (2,256,972 | ) | |||||||||
Securitized mortgage borrowings |
— | (271,817 | ) | 2,413,109 | — | 2,141,292 | ||||||||||
Derivative instruments, net |
— | — | (10,890 | )(2) | — | (10,890 | ) | |||||||||
Long-term debt |
— | (126 | ) | — | 10,494 | 10,368 | ||||||||||
Total |
$ | 134,843 | $ | (271,943 | ) | $ | 7,778 | $ | 10,494 | $ | (118,828 | ) | ||||
- (1)
- Amounts
primarily represent accretion to recognize interest income and interest expense using effective yields based on estimated fair values for trust
assets and trust liabilities. The total net interest income, including cash received and paid, was $3.0 million for the three months ended September 30, 2008, as reflected in the
accompanying consolidated statement of operations.
- (2)
- Included in this amount is $30.6 million in changes in the fair value of derivative instruments, offset by $41.5 million in cash payments from the securitization trusts for the three months ended September 30, 2008.
| |
Recurring Fair Value Measurements | |||||||||||||||
|---|---|---|---|---|---|---|---|---|---|---|---|---|---|---|---|---|
| |
Changes in Fair Value Included in Net Earnings | |||||||||||||||
| |
For the nine months ended September 30, 2009 | |||||||||||||||
| |
|
|
Change in Fair Value of | |
||||||||||||
| |
Interest Income(1) | Interest Expense(1) | Net Trust Assets | Long-term Debt | Total | |||||||||||
Investment securities available-for-sale |
$ | — | $ | — | $ | 2,870 | $ | — | $ | 2,870 | ||||||
Securitized mortgage collateral |
850,079 | — | (33,818 | ) | — | 816,261 | ||||||||||
Securitized mortgage borrowings |
— | (1,403,248 | ) | 313,827 | — | (1,089,421 | ) | |||||||||
Derivative instruments, net |
— | — | (48,712 | )(2) | — | (48,712 | ) | |||||||||
Long-term debt |
— | (644 | ) | — | 682 | 38 | ||||||||||
Total |
$ | 850,079 | $ | (1,403,892 | ) | $ | 234,167 | (3) | $ | 682 | $ | (318,964 | ) | |||
- (1)
- Amounts primarily represent accretion to recognize interest income and interest expense using effective yields based on estimated fair values for trust assets and trust liabilities. The total net interest income, including cash received and paid, was $8.5 million for the nine months ended September 30, 2009, as reflected in the accompanying consolidated statement of operations.
20
IMPAC MORTGAGE HOLDINGS, INC. AND SUBSIDIARIES
NOTES TO UNAUDITED CONSOLIDATED FINANCIAL STATEMENTS (Continued)
(dollars in thousands, except share and per share data or as otherwise indicated)
Note B—Fair Value of Financial Instruments (Continued)
- (2)
- Included
in this amount is $110.1 million in changes in the fair value of derivative instruments, offset by $158.8 million in cash payments
from the securitization trusts for the nine months ended September 30, 2009.
- (3)
- For the nine months ended September 30, 2009, change in the fair value of net trust assets, excluding REO was $234.2 million. Excluded from the $393.0 million change in fair value of net trust assets, excluding REO, in the accompanying consolidated statement of cash flows is $158.8 million in cash payments from the securitization trusts related to the Company's net derivative liabilities.
| |
Recurring Fair Value Measurements | |||||||||||||||
|---|---|---|---|---|---|---|---|---|---|---|---|---|---|---|---|---|
| |
Changes in Fair Value Included in Net Loss | |||||||||||||||
| |
For the nine months ended September 30, 2008 | |||||||||||||||
| |
|
|
Change in Fair Value of | |
||||||||||||
| |
Interest Income(1) | Interest Expense(1) | Net Trust Assets | Long-term Debt | Total | |||||||||||
Investment securities available-for-sale |
$ | 865 | $ | — | $ | (8,899 | ) | $ | — | $ | (8,034 | ) | ||||
Securitized mortgage collateral |
231,288 | — | (5,639,914 | ) | — | (5,408,626 | ) | |||||||||
Securitized mortgage borrowings |
— | (617,493 | ) | 5,743,357 | — | 5,125,864 | ||||||||||
Derivative instruments, net |
— | — | (94,399 | )(2) | — | (94,399 | ) | |||||||||
Long-term debt |
— | (419 | ) | — | 5,473 | 5,054 | ||||||||||
Total |
$ | 232,153 | $ | (617,912 | ) | $ | 145 | (3) | $ | 5,473 | $ | (380,141 | ) | |||
- (1)
- Amounts
primarily represent accretion to recognize interest income and interest expense using effective yields based on estimated fair values for trust
assets and trust liabilities. The total net interest income, including cash received and paid, was $14.6 million for the nine months ended September 30, 2008, as reflected in the
accompanying consolidated statement of operations.
- (2)
- Included
in this amount is $18.5 million in changes in the fair value of derivative instruments offset by $112.9 million in cash payments from
the securitization trusts for the nine months ended September 30, 2008.
- (3)
- For the nine months ended September 30, 2008, change in the fair value of net trust assets, excluding REO was $0.1 million. Excluded from the $113.0 million change in fair value of net trust assets, excluding REO, in the accompanying consolidated statement of cash flows is $112.9 million in cash payments from the securitization trusts related to the Company's net derivative liabilities.
In connection with the fair value option election for investment securities available-for-sale and securitized mortgage collateral and borrowings, interest income and interest expense are recognized using effective yields based on estimated fair values for these instruments. As the market's expectation of future credit losses has increased between periods, market participants have demanded higher yields, which have resulted in significant reductions in the fair values of these instruments. These reductions in fair value have significantly increased the effective yields used for purposes of recognizing interest income and interest expense on these instruments.
21
IMPAC MORTGAGE HOLDINGS, INC. AND SUBSIDIARIES
NOTES TO UNAUDITED CONSOLIDATED FINANCIAL STATEMENTS (Continued)
(dollars in thousands, except share and per share data or as otherwise indicated)
Note B—Fair Value of Financial Instruments (Continued)
The change in fair value of the asset and liabilities above, excluding derivative instruments, is primarily due to the changes in credit risk. The change in fair value for derivative instruments is primarily due to the change in the forward LIBOR curve.
Nonrecurring Fair Value Measurements
The Company is required to measure certain assets and liabilities at estimated fair value from time to time. These fair value measurements typically result from the application of specific accounting pronouncements under GAAP. The fair value measurements are considered nonrecurring fair value measurements under FASB ASC 820-10.
Loans held-for-sale—Loans held-for-sale for which the fair value option was not elected are carried at the lower of cost or market (LOCOM). When available, such measurements are based upon what secondary markets offer for portfolios with similar characteristics, and are considered Level 2 measurements. If market pricing is not available, such measurements are significantly impacted by the Company's expectations of other market participants' assumptions, and are considered Level 3 measurements. The Company utilizes internal pricing processes to estimate the fair value of loans held-for-sale, which is based on recent loan sales and estimates of the fair value of the underlying collateral. Loans held-for-sale, which are primarily included in assets of discontinued operations, are considered Level 3 fair value measurements at September 30, 2009 and December 31, 2008 based on the lack of observable market inputs.
Real estate owned—REO consists of residential real estate acquired in satisfaction of loans. Upon foreclosure, REO is adjusted to the estimated fair value of the residential real estate less estimated selling and holding costs, offset by expected mortgage insurance proceeds to be received, if any. Subsequently, REO is recorded at the lower of carrying value or estimated fair value less costs to sell. Fair values of REO are generally based on observable market inputs, and considered Level 2 measurements at September 30, 2009.
Lease liability—In connection with the discontinuation of our non-conforming mortgage, retail mortgage, warehouse lending and commercial operations, a significant amount of office space that was previously occupied is no longer being used by the Company. The Company has subleased a significant amount of this office space. The Company has recorded a liability, included within discontinued operations, representing the present value of the minimum lease payments over the remaining life of the lease, offset by the expected proceeds from sublet revenue related to this office space. This liability is based on present value techniques that incorporate the Company's judgments about estimated sublet revenue and discount rates. Therefore, this liability is considered a Level 3 measurement at September 30, 2009.
Deferred charge—Deferred charge represents the deferral of income tax expense on inter-company profits that resulted from the sale of mortgages from taxable subsidiaries to IMH in prior years. The deferred charge is amortized as a component of income tax expense over the estimated life of the mortgages retained in the securitized mortgage collateral. The Company evaluates the deferred charge for impairment quarterly using internal estimates of estimated cash flows and lives of the related mortgages retained in the securitized mortgage collateral. Deferred charge is considered a Level 3 measurement at September 30, 2009.
22
IMPAC MORTGAGE HOLDINGS, INC. AND SUBSIDIARIES
NOTES TO UNAUDITED CONSOLIDATED FINANCIAL STATEMENTS (Continued)
(dollars in thousands, except share and per share data or as otherwise indicated)
Note B—Fair Value of Financial Instruments (Continued)
The following tables present financial and non-financial assets and liabilities measured using nonrecurring fair value measurements at September 30, 2009 and December 31, 2008:
| |
Non-recurring Fair Value Measurements |
|
|
|||||||||||||
|---|---|---|---|---|---|---|---|---|---|---|---|---|---|---|---|---|
| |
Total Gains (Losses) | |||||||||||||||
| |
September 30, 2009 | |||||||||||||||
| |
For the Three Months Ended September 30, 2009 |
For the Nine Months Ended September 30, 2009 |
||||||||||||||
| |
Level 1 | Level 2 | Level 3 | |||||||||||||
Loans held-for-sale(1) |
$ | — | $ | — | $ | 79,505 | $ | — | $ | (7,517 | ) | |||||
REO(2) |
— | 116,694 | — | (25,285 | ) | (120,523 | ) | |||||||||
Lease liability(3) |
— | — | (3,924 | ) | (28 | ) | 2,531 | |||||||||
Deferred charge(4) |
13,144 | — | (1,998 | ) | ||||||||||||
- (1)
- Includes
$0.3 million and $79.2 million of loans held-for-sale within continuing and discontinued operations,
respectively, at September 30, 2009.
- (2)
- Includes
$112.8 million and $3.9 million in REO within continuing and discontinued operations, respectively, at September 30, 2009
which had additional impairment write-downs subsequent to the date of foreclosure. For the three months ended September 30, 2009, the $25.3 million loss related to additional impairment
write-downs during the period included $24.5 million and $0.8 million within continuing and discontinued operations, respectively. For the nine months ended September 30, 2009,
the $120.5 million loss related to additional impairment write-downs during the period included $117.9 million and $2.6 million within continuing and discontinued operations,
respectively.
- (3)
- Amounts
are included in discontinued operations. For the three and nine months ended September 30, 2009, the Company recorded $28 thousand in
losses and $2.5 million in gains resulting from changes in lease liabilities as a result of changes in our expected minimum future lease payments, respectively.
- (4)
- Amounts are included in continuing operations. For the three and nine months ended September 30, 2009, the Company recorded zero and $2.0 million, respectively, in income tax expense resulting from impairment writedowns based on changes in estimated cash flows and lives of the related mortgages retained in the securitized mortgage collateral .
| |
Non-recurring Fair Value Measurements |
|
|||||||||||
|---|---|---|---|---|---|---|---|---|---|---|---|---|---|
| |
December 31, 2008 | |
|||||||||||
| |
Total Losses For the Year Ended December 31, 2008 |
||||||||||||
| |
Level 1 | Level 2 | Level 3 | ||||||||||
Loans held-for-sale(1) |
$ | — | $ | — | $ | 108,223 | $ | 45,960 | |||||
- (1)
- Includes $0.4 million and $107.8 million of loans held-for-sale within continuing and discontinued operations, respectively, at December 31, 2008.
23
IMPAC MORTGAGE HOLDINGS, INC. AND SUBSIDIARIES
NOTES TO UNAUDITED CONSOLIDATED FINANCIAL STATEMENTS (Continued)
(dollars in thousands, except share and per share data or as otherwise indicated)
Note C—Stock Options
The fair value of stock options granted, which is amortized to expense over the service period, is estimated on the date of grant using the Black-Scholes-Merton option pricing model with the following weighted average assumptions:
| |
Nine Months Ended September 30, |
|||
|---|---|---|---|---|
| |
2009 | 2008 | ||
Risk-free interest rate |
2.86% | 1.88% to 2.54% | ||
Expected lives (in years) |
5.50 | 3.25 - 3.50 | ||
Expected volatility(1) |
259.16% | 87.3% - 91.9% | ||
Expected dividend yield(2) |
0.00% | 0.00% | ||
Grant date fair value of share options |
$0.53 | $5.02 - 7.76 | ||
- (1)
- Expected
volatility is based on the historical volatility of the Company's stock over the expected life of the stock option.
- (2)
- Expected dividend yield is zero because a dividend on the common stock was not probable over the expected life of the options granted during the nine months ended September 30, 2009 and 2008.
The following table summarizes activity, pricing and other information for the Company's stock options for the nine months ended September 30, 2009:
| |
Number of Shares |
Weighted- Average Exercise Price ($) |
||||||
|---|---|---|---|---|---|---|---|---|
Options outstanding at January 1, 2009 |
1,140,186 | $ | 37.18 | |||||
Options granted |
842,300 | 0.53 | ||||||
Options exercised |
— | — | ||||||
Options forfeited / cancelled |
(651,201 | ) | 34.64 | |||||
Options outstanding at September 30, 2009 |
1,331,285 | $ | 15.23 | |||||
Options exercisable at September 30, 2009 |
240,030 | $ | 67.89 | |||||
As of September 30, 2009, there was approximately $848 thousand of total unrecognized compensation cost related to nonvested share-based compensation arrangements granted under the Company's stock-based incentive compensation plan. This cost is expected to be recognized over a weighted average period of six months.
In April 2009, certain of the Company's officers and directors gave notice of the surrender of an aggregate of 581,000 options and the Board accepted and approved the cancellation of those options. In connection with the cancellation of these options, the Company recognized non-cash compensation expense of approximately $1.7 million during the quarter ended June 30, 2009.
24
IMPAC MORTGAGE HOLDINGS, INC. AND SUBSIDIARIES
NOTES TO UNAUDITED CONSOLIDATED FINANCIAL STATEMENTS (Continued)
(dollars in thousands, except share and per share data or as otherwise indicated)
Note D—Reconciliation of Earnings Per Share
The following table presents the computation of basic and diluted earnings (loss) per common share including the dilutive effect of stock options and preferred stock outstanding for the periods indicated:
| |
For the Three Months Ended September 30, |
For the Nine Months Ended September 30, |
|||||||||||||
|---|---|---|---|---|---|---|---|---|---|---|---|---|---|---|---|
| |
2009 | 2008 | 2009 | 2008 | |||||||||||
Numerator for basic earnings per share: |
|||||||||||||||
Earnings (loss) from continuing operations |
$ | 4,803 | $ | 1,901 | $ | 14,109 | $ | (19,041 | ) | ||||||
Loss from discontinued operations |
(1,776 | ) | (18,121 | ) | (8,366 | ) | (28,481 | ) | |||||||
Less: Cash dividends on cumulative redeemable preferred stock |
— | (3,722 | ) | (7,443 | ) | (11,165 | ) | ||||||||
Net earnings (loss) attributable to common stockholders |
$ | 3,027 | $ | (19,942 | ) | $ | (1,700 | ) | $ | (58,687 | ) | ||||
Denominator for basic earnings per share: |
|||||||||||||||
Basic weighted average number of common shares outstanding during the period |
7,618 | 7,610 | 7,618 | 7,610 | |||||||||||
Denominator for diluted earnings per share: |
|||||||||||||||
Diluted weighted average number of common shares outstanding during the period |
7,618 | 7,610 | 7,618 | 7,610 | |||||||||||
Net effect of dilutive stock options |
384 | — | — | — | |||||||||||
Diluted weighted average common shares |
8,002 | 7,610 | 7,618 | 7,610 | |||||||||||
Earnings (loss) per common share—basic and diluted: |
|||||||||||||||
Earnings (loss) from continuing operations |
$ | 0.60 | $ | (0.24 | ) | $ | 0.88 | $ | (3.97 | ) | |||||
Loss from discontinued operations |
(0.22 | ) | (2.38 | ) | (1.10 | ) | (3.74 | ) | |||||||
Earnings (loss) per share attributable to common stockholders |
$ | 0.38 | $ | (2.62 | ) | $ | (0.22 | ) | $ | (7.71 | ) | ||||
For the three and nine months ended September 30, 2009, stock options to purchase 504 thousand and 1.3 million shares, respectively, were outstanding but not included in the above weighted average share calculations because they were anti-dilutive.
For the three and nine months ended September 30, 2008, stock options to purchase 1.2 million shares were outstanding but not included in the above weighted average share calculations because they were anti-dilutive.
25
IMPAC MORTGAGE HOLDINGS, INC. AND SUBSIDIARIES
NOTES TO UNAUDITED CONSOLIDATED FINANCIAL STATEMENTS (Continued)
(dollars in thousands, except share and per share data or as otherwise indicated)
Note E—Segment Reporting
The Company has three reporting segments, consisting of the long-term mortgage portfolio, mortgage and real estate services and discontinued operations. The following tables present the selected financial data and operating results by reporting segment for the periods indicated:
| |
Long-term Portfolio |
Mortgage and Real Estate Services |
Discontinued Operations |
Consolidated | ||||||||||
|---|---|---|---|---|---|---|---|---|---|---|---|---|---|---|
Balance sheet items as of September 30, 2009: |
||||||||||||||
Securitized mortgage collateral |
$ | 5,767,379 | $ | — | $ | — | $ | 5,767,379 | ||||||
Total assets |
5,981,485 | 29,021 | 98,257 | 6,108,763 | ||||||||||
Total liabilities |
5,924,092 | 4,008 | 170,973 | 6,099,073 | ||||||||||
Total stockholders' equity (deficit) |
57,393 | 25,013 | (72,716 | ) | 9,690 | |||||||||
Balance sheet items as of December 31, 2008: |
||||||||||||||
Securitized mortgage collateral |
$ | 5,894,424 | $ | — | $ | — | $ | 5,894,424 | ||||||
Total assets |
6,574,464 | — | 141,053 | 6,715,517 | ||||||||||
Total liabilities |
6,489,024 | — | 217,241 | 6,706,265 | ||||||||||
Total stockholders' equity (deficit) |
85,440 | — | (76,188 | ) | 9,252 | |||||||||
26
IMPAC MORTGAGE HOLDINGS, INC. AND SUBSIDIARIES
NOTES TO UNAUDITED CONSOLIDATED FINANCIAL STATEMENTS (Continued)
(dollars in thousands, except share and per share data or as otherwise indicated)
Note E—Segment Reporting (Continued)
| |
Long-term Portfolio |
Mortgage and Real Estate Services |
Discontinued Operations |
Reclassifications(1) | Consolidated | ||||||||||||
|---|---|---|---|---|---|---|---|---|---|---|---|---|---|---|---|---|---|
Statement of Operations Items for the three months ended September 30, 2009: |
|||||||||||||||||
Net interest income |
$ | 1,894 | $ | 12 | $ | 834 | $ | (834 | ) | $ | 1,906 | ||||||
Non-interest income—net trust assets |
3,165 | — | — | — | 3,165 | ||||||||||||
Mortgage and real estate services fees |
— | 13,514 | — | — | 13,514 | ||||||||||||
Other non-interest income (expense) |
361 | (127 | ) | (2,148 | ) | 2,148 | 234 | ||||||||||
Non-interest expense and income taxes |
(5,422 | ) | (8,594 | ) | (462 | ) | 462 | (14,016 | ) | ||||||||
Earnings from continuing operations |
$ | (2 | ) | $ | 4,805 | 4,803 | |||||||||||
Loss from discontinued operations, net of tax |
$ | (1,776 | ) | (1,776 | ) | ||||||||||||
Net earnings |
$ | 3,027 | |||||||||||||||
Statement of Operations Items for the nine months ended September 30, 2009: |
|||||||||||||||||
Net interest income (expense) |
$ | 8,496 | $ | 5 | $ | (244 | ) | $ | 244 | $ | 8,501 | ||||||
Non-interest income—net trust assets |
16,084 | — | — | — | 16,084 | ||||||||||||
Mortgage and real estate services fees |
— | 32,296 | — | — | 32,296 | ||||||||||||
Other non-interest income (expense) |
661 | (312 | ) | (10,928 | ) | 10,928 | 349 | ||||||||||
Non-interest expense and income taxes |
(22,962 | ) | (20,159 | ) | 2,806 | (2,806 | ) | (43,121 | ) | ||||||||
Earnings from continuing operations |
$ | 2,279 | $ | 11,830 | 14,109 | ||||||||||||
Loss from discontinued operations, net of tax |
$ | (8,366 | ) | (8,366 | ) | ||||||||||||
Net earnings |
$ | 5,743 | |||||||||||||||
| |
Long-term Portfolio |
Mortgage and Real Estate Services |
Discontinued Operations |
Reclassifications(1) | Consolidated | ||||||||||||
|---|---|---|---|---|---|---|---|---|---|---|---|---|---|---|---|---|---|
Statement of Operations Items for the three months ended September 30, 2008: |
|||||||||||||||||
Net interest income |
$ | 3,014 | $ | — | $ | 158 | $ | (158 | ) | $ | 3,014 | ||||||
Non-interest income—net trust assets |
(7,907 | ) | — | — | — | (7,907 | ) | ||||||||||
Mortgage and real estate services fees |
— | 2,923 | — | — | 2,923 | ||||||||||||
Other non-interest income (expense) |
16,124 | 333 | (13,000 | ) | 13,000 | 16,457 | |||||||||||
Non-interest expense and income taxes |
(12,145 | ) | (441 | ) | (5,279 | ) | 5,279 | (12,586 | ) | ||||||||
Earnings from continuing operations |
$ | (914 | ) | $ | 2,815 | 1,901 | |||||||||||
Loss from discontinued operations, net of tax |
$ | (18,121 | ) | (18,121 | ) | ||||||||||||
Net loss |
$ | (16,220 | ) | ||||||||||||||
Statement of Operations Items for the nine months ended September 30, 2008: |
|||||||||||||||||
Net interest income (expense) |
$ | 14,624 | $ | (5 | ) | $ | 3,372 | $ | (3,372 | ) | $ | 14,619 | |||||
Non-interest income—net trust assets |
(24,626 | ) | — | — | — | (24,626 | ) | ||||||||||
Mortgage and real estate services fees |
— | 7,078 | — | — | 7,078 | ||||||||||||
Other non-interest income (expense) |
18,918 | 345 | (12,021 | ) | 12,021 | 19,263 | |||||||||||
Non-interest expense and income taxes |
(34,067 | ) | (1,308 | ) | (19,832 | ) | 19,832 | (35,375 | ) | ||||||||
Loss (earnings) from continuing operations |
$ | (25,151 | ) | $ | 6,110 | (19,041 | ) | ||||||||||
Loss from discontinued operations, net of tax |
$ | (28,481 | ) | (28,481 | ) | ||||||||||||
Net loss |
$ | (47,522 | ) | ||||||||||||||
- (1)
- Amounts represent reclassifications of activity in the discontinued operations segment into loss from discontinued operations, net of tax as presented in the accompanying consolidated statements of operations.
27
IMPAC MORTGAGE HOLDINGS, INC. AND SUBSIDIARIES
NOTES TO UNAUDITED CONSOLIDATED FINANCIAL STATEMENTS (Continued)
(dollars in thousands, except share and per share data or as otherwise indicated)
Note F—Real Estate Owned (REO)
The Company's REO consisted of the following:
| |
September 30, 2009 |
December 31, 2008 |
|||||
|---|---|---|---|---|---|---|---|
REO |
$ | 218,107 | $ | 635,285 | |||
Impairment(1) |
(47,474 | ) | (35,533 | ) | |||
Ending balance |
$ | 170,633 | $ | 599,752 | |||
REO inside trusts |
$ |
170,153 |
$ |
599,084 |
|||
REO outside trusts(2) |
480 | 668 | |||||
Total |
$ | 170,633 | $ | 599,752 | |||
- (1)
- Impairment
represents the cumulative write-downs of REO to estimated net realizable value subsequent to foreclosure.
- (2)
- Amount represents REO related to former on-balance sheet securitizations, which were collapsed as a result of the Company exercising its clean-up call options. This REO is included in other assets in the accompanying consolidated balance sheets.
Note G—Restructured Financing (Discontinued Operations)
In October 2009, the Company entered into a settlement agreement (the "Settlement Agreement") with its remaining reverse repurchase facility lender to settle the Restructured Financing. The Settlement Agreement retires the current facility and removes any further exposure associated with the line or the loans that secured the line. Pursuant to the terms of the Settlement Agreement, the Company settled the $140.0 million balance of the reverse repurchase line by transferring the loans securing the line to the lender at their approximate carrying values, resulting in a cash payment of $20.0 million and the Company entering into a credit agreement with the lender (the "Credit Agreement") for a $33.9 million term loan. The borrowing under the Credit Agreement, which is to be paid over 18 months, bears interest at a rate of one-month LIBOR plus 350 basis points and requires monthly payments of $1.5 million. In addition to the monthly payments of $1.5 million, a $10.0 million principal payment is due by April 2010 as part of the Credit Agreement.
The borrowing under the Credit Agreement may be prepaid by the Company at any time; provided that if the entire borrowing is repaid on or before December 31, 2009, then $5.0 million will be deducted from the amount due. Upon any sale of assets, excluding mortgage assets, issuance of debt, excluding warehouse borrowings, or equity by the Company, then all of the proceeds therefrom are required to be applied to the borrowing under the Credit Agreement, or in the case of an equity issuance, applied to the $10.0 million principal payment due by April 2010.
In addition to the restrictions above, the Credit Agreement requires the Company to maintain certain business and financial covenants until the borrowing is paid in full. These covenants place several restrictions on the Company and its operations, including limiting its ability to pay dividends, issue equity interests, make investments over certain amounts without prior consent or enter into any transaction to merge or consolidate. The covenants also require the Company to maintain cash and cash equivalents of $10.0 million (based on certain calculations) and stockholders' equity greater than zero (based on certain calculations).
28
IMPAC MORTGAGE HOLDINGS, INC. AND SUBSIDIARIES
NOTES TO UNAUDITED CONSOLIDATED FINANCIAL STATEMENTS (Continued)
(dollars in thousands, except share and per share data or as otherwise indicated)
Note G—Restructured Financing (Discontinued Operations) (Continued)
As of September 30, 2009, the Company's reverse repurchase financing, included in discontinued operations, was secured by mortgage loans held-for-sale with an unpaid principal balance of $173.1 million, restricted cash of $12.2 million and certain REOs. The following table presents the outstanding balance of the Company's Restructured Financing as of the dates indicated:
| |
Discontinued Operations | ||||||
|---|---|---|---|---|---|---|---|
| |
September 30, 2009 |
December 31, 2008 |
|||||
Reverse repurchase line(1) |
$ | 151,056 | $ | 188,677 | |||
- (1)
- This line, which is guaranteed by IMH, is no longer funding loans and was restructured in 2008 as described below.
In September 2008, the Company entered into an agreement to restructure its reverse repurchase line (Restructured Financing) with its remaining lender, which was subsequently settled as described above. The agreement removed all technical defaults from financial covenant noncompliance and any associated margin calls for the term of the agreement. The agreement called for certain targets including a reduction of the borrowings balance to $100 million by March 2010 with an advance rate of no more than 65 percent of the outstanding principal balance and $50 million by September 2010 with an advance rate of no more than 55 percent of the outstanding principal balance. At September 30, 2009, the advance rate was 78 percent. The agreement also called for monthly payments of $1.5 million until the earlier of the Company raising capital or the end of the agreement term. If the Company is successful in raising capital, approximately 10 percent of the gross proceeds must be remitted as an additional payment and the monthly payment would then be reduced to $750,000. The interest rate was LIBOR plus 325 basis points.
During the three and nine months ended September 30, 2009, the Company paid an additional $4.5 million and $13.5 million, respectively, in payments used by the lender to offset interest and settlement shortfalls, as required under the terms of the Restructured Financing.
Note H—Long-term Debt
The following table shows the composition of long-term debt as of the dates indicated:
| |
September 30, 2009 |
December 31, 2008 |
|||||||
|---|---|---|---|---|---|---|---|---|---|
Trust preferred securities: |
|||||||||
Outstanding balance |
$ | 8,500 | $ | 88,250 | |||||
Common securities |
620 | 2,994 | |||||||
Fair value adjustment |
(7,409 | ) | (75,841 | ) | |||||
Total trust preferred securities |
1,711 | 15,403 | |||||||
Junior subordinated notes: |
|||||||||
Outstanding balance |
62,000 | — | |||||||
Fair value adjustment |
(54,312 | ) | — | ||||||
Total junior subordinated notes |
7,688 | — | |||||||
Total long-term debt |
$ | 9,399 | $ | 15,403 | |||||
29
IMPAC MORTGAGE HOLDINGS, INC. AND SUBSIDIARIES
NOTES TO UNAUDITED CONSOLIDATED FINANCIAL STATEMENTS (Continued)
(dollars in thousands, except share and per share data or as otherwise indicated)
Note H—Long-term Debt (Continued)
In January 2009, the Company purchased and canceled $25.0 million in outstanding trust preferred securities of Impac Capital Trust #2 for $3.75 million and terminated the remaining debt.
In May 2009, the Company exchanged an aggregate of $51.3 million in trust preferred securities of Impac Capital Trusts #1 and #3 for junior subordinated notes with an aggregate principal balance of $62.0 million and a maturity date of March 2034. Under the terms of the exchange, the interest rate for each note was reduced from 8.01 percent to 2.00 percent through 2013 with increases thereafter of 1.00 percent per year through 2017. Starting in 2018, the interest rates become variable at 3-month LIBOR plus 375 basis points. In connection with the exchange, the Company paid a fee of $0.5 million.
In June 2009, the Company purchased and canceled $1.0 million in outstanding trust preferred securities of Impac Capital Trust #4 for $150 thousand.
In August 2009, the Company purchased and canceled $2.5 million in outstanding trust preferred securities of Impac Capital Trust #4 for $375 thousand, resulting in $8.5 million in outstanding trust preferred securities. In July 2009, the Company became current and is no longer deferring interest on its remaining trust preferred securities.
As a result of the restructuring of $51.3 million and purchase and cancelation of $36.5 million in outstanding trust preferred securities, the Company reduced its annual interest expense obligation from $7.8 million to $2.0 million. With the restructuring and purchase and cancelations of trust preferred securities, the Company has $8.5 million in outstanding trust preferred securities of Impac Capital Trust #4 and $62.0 million in outstanding junior subordinated notes.
Note I—Preferred Stock Repurchase
In June 2009, the Company completed the Offer to Purchase and Consent Solicitation (the "Offer to Purchase") of all of its 9.375% Series B Cumulative Redeemable Preferred Stock and 9.125% Series C Cumulative Redeemable Preferred Stock. The Series B Preferred Stock had a liquidation preference of $50 million and the Series C Preferred Stock had a liquidation preference of $111.8 million, for a total of $161.8 million. Upon expiration of the Offer to Purchase, holders of approximately 68% of the Preferred Stock tendered an aggregate of 4,378,880 shares. Holders of the Company's Series B Preferred Stock tendered 1,323,844 shares at $0.29297 per share for a total of $388 thousand. Holders of the Company's Series C Preferred Stock tendered 3,055,036 shares at $0.28516 per share for a total of $871 thousand. The aggregate purchase price for the Preferred Stock was $1.3 million. In addition, in connection with completing the offer to purchase the Company paid $7.4 million accumulated but unpaid dividends on its Preferred Stock. With the total cash payment of $8.7 million, the Company eliminated $109.5 million of liquidation preference on its Preferred Stock. After the completion of the Offer to Purchase, the Company has outstanding $52.3 million liquidation preference of Series B and Series C Preferred Stock.
With completion of the Offer to Purchase and modification to the terms of the Series B Preferred Stock and Series C Preferred Stock, the Company eliminated its $14.9 million annual preferred dividend obligation.
As a condition to completing the offer to purchase, the common stockholders and preferred stockholders approved and consented to modify the terms of each of the Series B Cumulative Preferred
30
IMPAC MORTGAGE HOLDINGS, INC. AND SUBSIDIARIES
NOTES TO UNAUDITED CONSOLIDATED FINANCIAL STATEMENTS (Continued)
(dollars in thousands, except share and per share data or as otherwise indicated)
Note I—Preferred Stock Repurchase (Continued)
Stock and Series C Preferred Stock to (i) make Preferred Stock dividends, if any, non-cumulative, (ii) eliminate the provisions prohibiting the payment of dividends on junior stock and prohibiting the purchase or redemption of junior or parity stock if full cumulative dividends for all past dividend periods are not paid or declared and set apart for payment, (iii) eliminate any premiums payable upon the liquidation, dissolution or winding up of the Company, (iv) eliminate the provision prohibiting the Company from electing to redeem Preferred Stock prior to the fifth year anniversary of the issuance of such preferred stock, (v) eliminate the provision prohibiting the Company from redeeming less than all of the outstanding Preferred Stock if full cumulative dividends for all past dividend periods have not been paid or declared and set apart for payment, (vi) eliminate the right of holders of Preferred Stock to elect two directors if dividends are in arrears for six quarterly periods and (vii) eliminate the right of holders of Preferred Stock to consent to or approve the authorization or issuance of preferred stock senior to the Preferred Stock. The holders of each series of Preferred Stock retain the right to a $25.00/share liquidation preference in the event of a liquidation of the Company and the right to receive dividends on the Preferred Stock if any such dividends are declared.
Note J—Subsequent Events
Subsequent events have been evaluated through November 9, 2009, the date these financial statements were issued.
In October 2009, the Company entered into a settlement agreement (the "Settlement Agreement") with its remaining reverse repurchase facility lender to settle the Restructured Financing. The Settlement Agreement retires the current facility and removes any further exposure associated with the line or the loans that secured the line. Pursuant to the terms of the Settlement Agreement, the Company settled the $140.0 million balance of the reverse repurchase line by transferring the loans securing the line to the lender at their approximate carrying values, resulting in a cash payment of $20.0 million and the Company entering into a credit agreement with the lender (the "Credit Agreement") for a $33.9 million term loan. The borrowing under the Credit Agreement, which is to be paid over 18 months, bears interest at a rate of one-month LIBOR plus 350 basis points and requires monthly payments of $1.5 million. In addition to the monthly payments of $1.5 million, a $10.0 million principal payment is due by April 2010 as part of the Credit Agreement. See further discussion of the settlement agreement in Note G—Restructured Financing (Discontinued Operations).
On October 27, 2009, the Company issued 80,000 shares of common stock and paid legal expenses in connection with the settlement of Sharon Page v. Impac Mortgage Holdings, Inc., et al., which was originally filed on December 17, 2007 in the United States District Court, Central District of California against IMH and several of its senior officers and is described in the Company's Annual Report on Form 10-K for the year ended December 31, 2008.
31
ITEM 2: MANAGEMENT'S DISCUSSION AND ANALYSIS OF FINANCIAL CONDITION AND RESULTS OF OPERATIONS
(dollars in thousands, except per share data or as otherwise indicated)
Unless the context otherwise requires, the terms "Company," "we," "us," and "our" refer to Impac Mortgage Holdings, Inc. (the Company or IMH), a Maryland corporation incorporated in August 1995, and its subsidiaries, Integrated Real Estate Services Corporation (IRES), IMH Assets Corp. (IMH Assets), Impac Warehouse Lending Group, Inc. (IWLG), and Impac Funding Corporation (IFC), together with its wholly-owned subsidiaries Impac Secured Assets Corp. (ISAC) and Impac Commercial Capital Corporation (ICCC).
This report on Form 10-Q contains certain forward-looking statements within the meaning of Section 27A of the Securities Act of 1933 and Section 21E of the Securities Exchange Act of 1934. Forward-looking statements, some of which are based on various assumptions and events that are beyond our control, may be identified by reference to a future period or periods or by the use of forward-looking terminology, such as "may," "will," "believe," "expect," "likely," "should," "could," "anticipate," or similar terms or variations on those terms or the negative of those terms. The forward-looking statements are based on current management expectations. Actual results may differ materially as a result of several factors, including, but not limited to the following: the ongoing volatility in the mortgage industry; our ability to successfully manage through the current market environment; our ability to meet liquidity needs from current cash flows or generate new sources of revenue; management's ability to successfully manage and potentially grow the Company's mortgage and real estate fee-based businesses; the ability to make interest and dividend payments; increases in default rates and mortgage related losses; the ability to satisfy conditions (payment and covenants) in the new credit agreement; our ability to obtain additional financing and the terms of any financing that we do obtain; inability to effectively liquidate properties to mitigate losses; increase in loan repurchase requests and ability to adequately settle repurchase obligations; decreases in value of our residual interests that differ from our assumptions; the ability of our common stock to continue trading in an active market; the outcome of litigation or regulatory actions pending against us or other legal contingencies; and our compliance with applicable local, state and federal laws and regulations and other general market and economic conditions.
For a discussion of these and other risks and uncertainties that could cause actual results to differ from those contained in the forward-looking statements, see "Risk Factors" and "Management's Discussion and Analysis of Financial Condition and Results of Operations" in the Company's Annual Report on Form 10-K for the period ended December 31, 2008, the other reports we file under the Securities and Exchange Act of 1934. This document speaks only as of its date and we do not undertake, and specifically disclaim any obligation, to publicly release the results of any revisions that may be made to any forward-looking statements to reflect the occurrence of anticipated or unanticipated events or circumstances after the date of such statements.
The Mortgage Banking Industry and Discussion of Relevant Fiscal Periods
The mortgage banking industry is continually vulnerable to current events that occur in the financial services industry. These events include changes in economic indicators, government regulation, interest rates, price competition, geographic shifts, disposable income, housing prices, market liquidity, market anticipation, and customer perception, as well as others. The factors that affect the industry change rapidly and can be unforeseeable.
Current events can diminish the relevance of "quarter over quarter" and "year-to-date over year-to-date" comparisons of financial information. In such instances, the Company attempts to present
32
financial information in its Management's Discussion and Analysis of Financial Condition and Results of Operations that is the most relevant to its financial information.
Status of Operations, Liquidity and Capital Resources
Mortgage and real estate services
In 2009, the Company has sought to create an integrated services platform to provide solutions to the mortgage and real estate markets. Pursuant to that, the Company initiated various mortgage and real estate fee-based businesses, including loan modifications, real estate disposition, monitoring and surveillance services, real estate brokerage and lending services and title and closing services. The Company has been able to develop and enhance its service offerings in providing services to investors, servicers and individual borrowers primarily by focusing on loss mitigation and performance of our own long-term mortgage portfolio. The development of these businesses focuses on vertical integration of a centralized platform which we believe we can operate synergistically to maximize their success. The Company has established the following businesses:
- •
- Loan Modification—The Company has established a loan
modification business to provide outsourced loss mitigation services to investors and institutions with distressed and delinquent residential and multifamily mortgage portfolios. In addition, we
provide modification solutions to individual borrowers by interacting with loan servicers on behalf of the borrowers to assist them in lowering the monthly mortgage payments to an affordable level
allowing them to remain in their homes.
- •
- Real Estate Solutions—The Company has established a real
estate solutions business to provide real estate owned (REO) surveillance services to servicers and portfolio managers to assist them in maximizing loss mitigation performance in managing distressed
mortgage portfolios and foreclosed real estate assets, along with disposition of such assets. In addition, we perform default surveillance and monitoring services for residential and multifamily
mortgage portfolios for investors and servicers to assist them with overall portfolio performance.
- •
- Real Estate Brokerage and Lending—The Company has established
a real estate brokerage business which primarily serves the southern California area and a mortgage lending business as it seeks to re-enter the mortgage lending industry. The primary
business of the real estate brokerage business is the listing and selling of REO and mortgage short sales. Our mortgage lending activities include earning fees for brokering loans to third-party
lenders since 2008 and originating loans through our mortgage banking platform under the "Impac" brand name. Although we have originated only a minimal number of loans year to date, we expect to
increase our loan originations over the next few quarters through retail channels focusing on originating only loans that are eligible for sale to HUD and other government-sponsored enterprises.
- •
- Title and Escrow—The Company has established a title agent and escrow business to provide title insurance, escrow and settlement services to residential mortgage lenders, real estate agents, asset managers and REO companies in the residential market sector of the real estate industry. We deliver services through a proprietary integrated technology platform.
For the three and nine month periods ended September 30, 2009, mortgage and real estate services fees were $13.5 million and $32.3 million, respectively. Although the Company intends to generate more fees by providing these services to third parties in the marketplace in the near future, the revenues from these businesses have primarily been generated from the Company's long-term mortgage portfolio. Furthermore, since these businesses are newly formed there remains uncertainty about their future success.
33
Long-term mortgage portfolio
During 2009, the Company continues to be significantly and negatively affected by the deteriorating real estate market and the weak economic environment. These factors have led to continued deterioration in the quality of the Company's long-term mortgage portfolio, as evidenced by the continued increases in delinquencies, foreclosures and credit losses. Existing conditions are unprecedented and inherently involve significant risks and uncertainty to the Company. The current market conditions have led to fewer sources of liquidity available to the Company to operate its business. These conditions continue to have an adverse effect on the performance of the Company's long-term mortgage portfolio, including significant losses on real estate owned. During 2009, the Company increased its loss assumptions for its long-term mortgage portfolio due to the increase in expected defaults and loss severities related to the weak economy and housing market.
Liquidity and capital resources
During the first nine months of 2009, the Company continued to fund its operations primarily from the cash flows from its long-term mortgage portfolio and mortgage and real estate fee-based businesses.
Trust preferred securities
In January 2009, the Company purchased and canceled all of the $25.0 million in outstanding trust preferred securities of Impac Capital Trust #2 for $3.75 million and terminated the remaining debt.
In May 2009, the Company exchanged an aggregate of $51.3 million in trust preferred securities of Impac Capital Trusts #1 and #3 for junior subordinated notes with an aggregate principal balance of $62.0 million, with a maturity date in March 2034. Under the terms of the exchange, the interest rate for each note was reduced from the original 8.01 percent to 2.00 percent through 2013 with increases of 1.00 percent per year through 2017. Starting in 2018, the interest rates become variable at 3-month LIBOR plus 375 basis points. In connection with the exchange, the Company paid a fee of $0.5 million.
In June 2009, the Company purchased and canceled $1.0 million in outstanding trust preferred securities of Impac Capital Trust #4 for $150 thousand.
In July 2009, the Company became current and is no longer deferring interest on its remaining trust preferred securities. For the three and nine months ended September 30, 2009 and 2008, the Company paid $0.6 million and $1.8 million, respectively in interest on trust preferred securities.
In August 2009, the Company purchased and canceled $2.5 million in outstanding trust preferred securities of Impac Capital Trust #4 for $375 thousand.
As a result of the restructuring of $51.3 million and the purchase and cancelation of $36.5 million in outstanding trust preferred securities, the Company reduced its annual interest expense obligation from $7.8 million to $2.0 million. With the restructuring and purchase and cancelations of trust preferred securities, the Company has $8.5 million in outstanding trust preferred securities of Impac Capital Trust #4 and $62.0 million in outstanding junior subordinated notes.
Preferred stock
In June 2009, the Company completed the Offer to Purchase and Consent Solicitation (the "Offer to Purchase") of all of its 9.375% Series B Cumulative Redeemable Preferred Stock and 9.125% Series C Cumulative Redeemable Preferred Stock. The Series B Preferred Stock had a liquidation preference of $50 million and the Series C Preferred Stock had a liquidation preference of $111.8 million, for a total of $161.8 million. Upon expiration of the Offer to Purchase, holders of approximately 67.7% of the Preferred Stock tendered an aggregate of 4,378,880 shares. Stockholders of the Company's Series B Preferred Stock tendered 1,323,844 shares at $0.29297 per share for
34
$388 thousand. Stockholders of the Company's Series C Preferred Stock tendered 3,055,036 shares at $0.28516 per share for $871 thousand. The aggregate purchase price for the Preferred Stock was $1.3 million. In addition, in connection with the completion of the offer to purchase the Company paid $7.4 million accumulated but unpaid dividends on its Preferred Stock. With the total cash payment of $8.7 million, the Company eliminated $109.5 million of liquidation preference on its Preferred Stock. After the completion of the Offer to Purchase, the Company has outstanding $52.3 million liquidation preference of Series B and Series C Preferred Stock.
In connection with the Offer to Purchase, the Company filed Articles of Amendment to its charter with the State Department of Assessments and Taxation of Maryland to modify the terms of each of its 9.375% Series B Cumulative Redeemable Preferred Stock and 9.125% Series C Cumulative Redeemable Preferred Stock to (i) make dividends, if any, non-cumulative, (ii) eliminate the provisions prohibiting the payment of dividends on junior stock and prohibiting the purchase or redemption of junior or parity stock if full cumulative dividends for all past dividend periods are not paid or declared and set apart for payment, (iii) eliminate any premiums payable upon the liquidation, dissolution or winding up of the Company, (iv) eliminate the provision prohibiting the Company from electing to redeem Preferred Stock prior to the fifth year anniversary of the issuance of such Preferred Stock, (v) eliminate the provision prohibiting the Company from redeeming less than all of the outstanding Preferred Stock if full cumulative dividends for all past dividend periods have not been paid or declared and set apart for payment, (vi) eliminate the right of holders of preferred stock to elect two directors if dividends are in arrears for six quarterly periods and (vii) eliminate the right of holders of Preferred Stock to consent to or approve the authorization or issuance of Preferred Stock senior to the preferred stock.
With completion of the Offer to Purchase and modification to the terms of the Series B Preferred Stock and Series C Preferred Stock, the Company eliminated its $14.9 million annual preferred dividend obligation.
Restructured Financing
In October 2009, the Company entered into a settlement agreement (the "Settlement Agreement") with its remaining reverse repurchase facility lender to settle the Restructured Financing. The Settlement Agreement retires the current facility and removes any further exposure associated with the line or the loans that secured the line. Pursuant to the terms of the Settlement Agreement, the Company settled the $140.0 million balance of the reverse repurchase line by transferring the loans securing the line to the lender at their approximate carrying values, resulting in a cash payment of $20.0 million and the Company entering into a credit agreement with the lender (the "Credit Agreement") for a $33.9 million term loan. The borrowing under the Credit Agreement, which is to be paid over 18 months, bears interest at a rate of one-month LIBOR plus 350 basis points and requires monthly payments of $1.5 million. In addition to the monthly payments of $1.5 million, a $10.0 million principal payment is due by April 2010 as part of the Credit Agreement.
During the three and nine month periods ended September 30, 2008, the Company's sources of cash flow earnings also included real estate advisory fees. The real estate advisory agreement was terminated in the fourth quarter of 2008 and we received a fee of $27.0 million for agreeing to terminate this relationship. During the three and nine month periods ended September 30, 2008, we earned $7.0 million and $15.6 million, respectively in real estate advisory fees.
Prior to the aforementioned settlement in October 2009, the primary use of liquidity within discontinued operations was the Company's restructured reverse repurchase financing (Restructured Financing). As of September 30, 2009, the balance of the Restructured Financing was $151.1 million secured by loans held for sale with an unpaid principal balance of $173.1 million, restricted cash of $12.2 million and certain real estate owned. Principal and interest received on the underlying collateral
35
was remitted to the lender monthly. During the three and nine month periods ended September 30, 2009, the Company paid an additional $4.5 million and $13.5 million in payments, used by the lender to offset interest and settlement shortfalls, as required under the previous restructured terms.
The ability to meet our long-term liquidity requirements is subject to several factors, such as realizing cash flows from our long-term mortgage portfolio and generating fees from our mortgage and real estate fee-based businesses. Our future financial performance and success are dependent in large part upon our ability to grow our mortgage and real estate fee-based businesses. We believe that current cash balances, short-term investments, cash flows realized from our long-term mortgage portfolio and fees generated from our mortgage and real estate fee-based businesses will be adequate to fund our current operations. There can be no assurances that we will be able to implement our new mortgage and real estate fee-based business strategies successfully or achieve the anticipated benefits of their implementation. If we are unable to do so, we may be unable to satisfy our future operating costs and liabilities, including repayment of the Credit Agreement and long-term debt.
To understand the financial position of the Company better, we believe it is important to understand the composition of the Company's stockholders' equity (deficit) and to which component of the business it relates. At September 30, 2009, the equity (deficit) within our continuing and discontinued operations was comprised of the following significant assets and liabilities:
| |
Condensed Components of Stockholders' Equity (Deficit) |
|||||||||
|---|---|---|---|---|---|---|---|---|---|---|
| |
As of September 30, 2009 | |||||||||
| |
Continuing Operations |
Discontinued Operations |
Total | |||||||
Cash |
$ | 37,893 | $ | 867 | $ | 38,760 | ||||
Short-term investments |
5,014 | — | 5,014 | |||||||
Residual interests in securitizations |
29,243 | — | 29,243 | |||||||
Long-term debt ($71,120 par) |
(9,399 | ) | — | (9,399 | ) | |||||
Repurchase liabilities(1) |
— | (65,693 | ) | (65,693 | ) | |||||
Lease liability(2) |
— | (3,924 | ) | (3,924 | ) | |||||
Deferred charge |
13,144 | — | 13,144 | |||||||
Net other assets (liabilities) |
6,511 | (3,966 | ) | 2,545 | ||||||
Stockholders' equity (deficit) |
$ | 82,406 | $ | (72,716 | ) | $ | 9,690 | |||
- (1)
- Balance
includes the net amount owed to our lender, which is guaranteed by IMH, and the repurchase reserve.
- (2)
- Guaranteed by IMH.
Continuing operations
At September 30, 2009, cash within our continuing operations decreased to $37.9 million from $46.2 million at December 31, 2008. The primary sources of cash between periods were cash flow of $24.6 million from residual interests in securitizations and $32.3 million fees generated from the mortgage and real estate fee-based businesses. Offsetting the sources of cash were operating expenses totaling $41.4 million, a $5.0 million investment in highly liquid short-term investments during the first quarter of 2009 and the Company's repurchase of preferred stock of $1.3 million and payment of $7.4 million in accumulated preferred stock dividends during the second quarter of 2009. Additionally, the Company paid $4.3 million to purchase and cancel $28.5 million in trust preferred securities.
Since our consolidated and unconsolidated securitization trusts are nonrecourse, we have netted trust assets and liabilities to present the Company's interest in these trusts more simply, which are
36
considered our residual interests in securitizations. For unconsolidated securitizations our residual interests represent the fair value of investment securities available-for-sale. For consolidated securitizations, our residual interests are represented by the fair value of securitized mortgage collateral and real estate owned, offset by the fair value of securitized mortgage borrowings and net derivative liabilities. We receive cash flows from our residual interests in securitizations to the extent they are available after required distributions to bondholders and maintaining overcollateralization levels within the trusts. The estimated fair value of the residual interests, represented by the difference in the fair value of trust assets and trust liabilities, was $29.2 million at September 30, 2009, compared to $28.0 million at December 31, 2008.
At September 30, 2009, we had deferred charges of $13.1 million, which is amortized as a component of income tax expense in the consolidated statements of operations over the estimated life of the mortgages retained in the securitized mortgage collateral. The deferred charges represent the deferral of income tax expense on inter-company profits that resulted from the sale of mortgages from taxable subsidiaries to IMH in prior years. This balance is recorded as required by accounting principles generally accepted in the United States of America (GAAP) and does not have any realizable cash value.
Net other assets include $2.4 million in premises and equipment, $1.3 million in restricted cash and $2.7 million in prepaid expenses.
Discontinued operations
The Company's most significant liabilities at September 30, 2009 relate to its repurchase liabilities and a lease liability within discontinued operations.
The repurchase liabilities consist of a repurchase reserve and the net amount previously owed to our lender for the Restructured Financing as of September 30 2009, which was collateralized by loans held-for-sale, restricted cash balances and certain real estate owned. The balance of the Restructured Financing was approximately $151.1 million at September 30, 2009. Prior to the settlement of the Restructured Financing in October 2009, we were distributing all principal and interest received from the collateral securing the Restructured Financing to the lender. In October 2009, we entered a settlement agreement to settle the Restructured Financing as discussed in Liquidity and Capital Resources.
We were required to make normal and customary representations and warranties about the loans we had previously sold to investors. Our whole loan sale agreements generally required us to repurchase loans if we breached a representation or warranty given to the loan purchaser. In addition, we also could be required to repurchase loans as a result of borrower fraud or if a payment default occurs on a mortgage loan shortly after its sale. The repurchase reserve is an estimate of losses from expected repurchases, and is based, in part, on the recent settlement of claims. At September 30, 2009, the repurchase reserve was $11.3 million.
In connection with the discontinuation of our non-conforming mortgage, retail mortgage, warehouse lending and commercial operations, a significant amount of office space that was previously occupied is no longer being used by the Company. The Company has subleased a significant amount of this office space. At September 30, 2009, the Company had a liability of $3.9 million included within discontinued operations, representing the present value of the minimum lease payments over the remaining life of the lease, offset by the expected proceeds from sublet revenue related to this office space.
37
The economy continued to contract in the first nine months of 2009. Labor markets deteriorated rapidly as U.S. firms reduced the number of jobs driving the U.S. unemployment rate higher in September. Higher unemployment and weaker overall economic conditions have led to a significant increase in the number of defaults, while continued weak housing prices have driven a significant increase in loss severities. Defaults continue to remain elevated as the economy and housing market continues to struggle. The credit performance of the Company's long-term mortgage portfolio continues to be negatively affected by these economic conditions. Delinquencies and nonperforming loans and assets continue to increase as a percentage of loans outstanding. Additional deterioration in the overall economic environment, including continued deterioration in the labor market, could cause delinquencies to increase beyond the Company's current expectations, resulting in additional increases in losses and reductions in fair value.
We believe there is currently no index for Alt-A mortgage product, but the general direction and magnitude of price movement in the ABX 2007-1index is reflective of the disruption in the market and general price movement experienced by the Company's securities. The index, which does not include any IMH bonds, is being used for illustrative purposes only because it is a non-conforming single-family mortgage index that has traded consistently in recent years. The ABX 2007-1 Index illustrates market prices for designated groups of subprime securities by credit rating. The index is shown here as an illustration of the price volatility in the general non-conforming mortgage market since the beginning of 2007 and does not reflect actual pricing on IMH bonds, which are backed by Alt-A loans rather than subprime loans. As shown below, the ABX 2007-1 Index displays dramatic declines in the value of such securities.
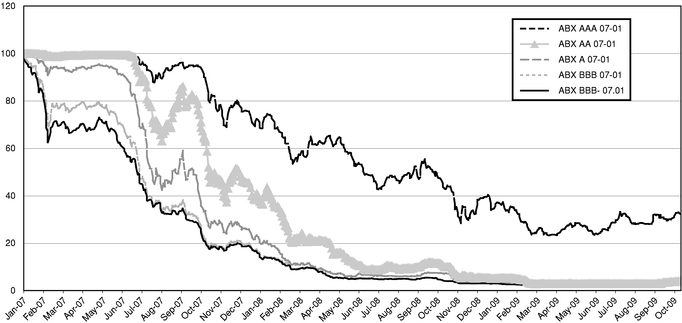
38
Effects of Recent Market Activity
As a result of the Company's inability to sell or securitize non-conforming loans during the second half of 2007, the Company discontinued funding loans and discontinued substantially all of its mortgage (non-conforming single-family loans and commercial loans, which consist primarily of multifamily loans) and warehouse lending operations. Market conditions deteriorated in 2008 and continue to be depressed in 2009. As a result, the Company's investment in securitized non-conforming loans (residual interests) has been affected by the increase in estimated defaults and severities, evidenced by significant home price depreciation. The decline in single-family home prices can be seen in the chart below.
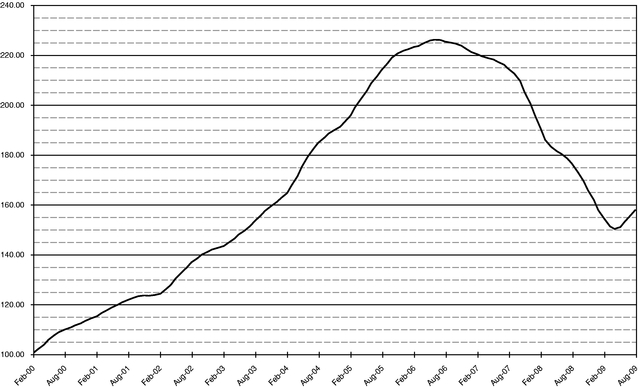
As depicted in the chart above, average home prices peaked in June 2006 at 226.29 and continued their dramatic decline through much of the first half of 2009, while increasing slightly in each of the months from May through August 2009. The Standard & Poor's Case-Shiller 10-City Composite Home Price Index (the Index) for August 2009 was 157.93 (with the base of 100.00 for January 2000) and hasn't been this low since October 2003 when the Index was 157.71. Beginning in the third quarter of 2007, the Company believes there is a correlation between the borrowers' perceived equity in their homes and defaults. The original loan-to-value (defined as loan amount as a percentage of collateral value, "LTV") and original combined loan-to-value (defined as first lien plus total subordinate liens to collateral value, "CLTV") ratios of single-family mortgages remaining in the Company's securitized mortgage collateral as of September 30, 2009 was 73 percent and 83 percent, respectively. The current LTV and CLTV ratios likely increased from origination date as a result of the deterioration in the real estate market. We believe that home prices that have declined below the borrower's original purchase price have a higher risk of default within our portfolio. Based on the Index, home prices have declined 30 percent through August 2009 from the 2006 peak. Further, we believe the home prices in California and Florida, the states with the highest concentration of our mortgages, have declined even further than the Index. We have considered the deterioration in home prices and its impact on our loss severities, which are a primary assumption used in the valuation of securitized mortgage collateral and borrowings.
39
Several of the critical accounting policies important to the portrayal of our financial condition and results of operations require management to make difficult and complex judgments that rely on estimates about the effect of matters that are inherently uncertain due to the affect of changing market conditions and/or consumer behavior. We believe our most critical accounting policies relate to the valuation of: (1) assets and liabilities that are highly dependent on internal valuation models and assumptions rather than market quotations (see Fair Value of Financial Instruments discussion below); (2) derivatives and other hedging instruments; (3) real estate owned and loans held-for-sale, including estimates of fair value, and related lower of cost or market (LOCOM) valuation reserve; and (4) repurchase reserve (included in liabilities of discontinued operations). Refer to our report on Form 10-K for the year ended December 31, 2008 for further discussion of our critical accounting policies and judgments.
Management discusses its critical accounting policies and related estimates with the Company's Audit Committee on a regular basis. We believe the judgments, estimates and assumptions used in the preparation of our consolidated financial statements are appropriate given the factual circumstances at the time. However, given the sensitivity of our consolidated financial statements to these critical accounting policies, the use of other judgments, estimates and assumptions could result in material differences in our results of operations or financial condition.
Fair Value of Financial Instruments
Financial Accounting Standards Board Accounting Standards Codification 820-10 "Fair Value Measurements and Disclosures—Overall" (FASB ASC 820-10) defines fair value, establishes a framework for measuring fair value and outlines a fair value hierarchy based on the inputs to valuation techniques used to measure fair value. It defines fair value as the price that would be received to sell an asset or paid to transfer a liability in an orderly transaction between market participants at the measurement date (also referred to as an exit price). FASB ASC 820-10 categorizes fair value measurements into a three-level hierarchy based on the extent to which the measurement relies on observable market inputs in measuring fair value. Level 1, which is the highest priority in the fair value hierarchy, is based on unadjusted quoted prices in active markets for identical assets or liabilities. Level 2 is based on observable market-based inputs, other than quoted prices, in active markets for identical assets or liabilities. Level 3, which is the lowest priority in the fair value hierarchy, is based on unobservable inputs. Assets and liabilities are classified within this hierarchy in their entirety based on the lowest level of any input that is significant to the fair value measurement.
The use of fair value to measure our financial instruments is fundamental to our financial statements and is a critical accounting estimate because a substantial portion of our assets and liabilities are recorded at estimated fair value. Financial instruments classified as Level 3 are generally based on unobservable inputs, and the process to determine fair value is generally more subjective and involves a high degree of management judgment and assumptions. These assumptions may have a significant effect on our estimates of fair value, and the use of different assumptions, as well as changes in market conditions, could have a material effect on our results of operations or financial condition.
As a result of the lack of observable market data resulting from inactive markets, the Company has classified all its investment securities available-for-sale, securitized mortgage collateral and borrowings, net derivative liabilities and long-term debt as Level 3 fair value measurements at September 30, 2009 and December 31, 2008. Level 3 assets and liabilities were 100 percent of total assets and liabilities at fair value at September 30, 2009 and December 31, 2008.
The Company adopted FSP No. SFAS 157-4 "Determining Fair Value When the Volume and Level of Activity for the Asset or Liability Have Significantly Decreased and Identifying Transactions That Are Not Orderly" (FSP 157-4, which was incorporated into FASB ASC 820-10-65-4) effective April 1,
40
2009. The FSP addresses measuring fair value under FASB ASC 820-10 in situations where the volume and level of market activity has significantly decreased and transactions are not orderly. Under the provisions of the FSP, transactions or quoted prices may not be determinative of fair value for assets or liabilities in inactive markets.
There is little information, if any, to evaluate if individual transactions are orderly in an inactive market. Accordingly, the Company is required to evaluate the facts and circumstances to determine whether the transaction is orderly based on the weight of the evidence. The FSP does not designate a specific method for adjusting a transaction or quoted price, however, it does provide guidance for determining how much weight to give a transaction or quoted price. Price quotes derived from transactions that are not orderly are not considered to be determinative of fair value and should be given less weight, if any, when measuring fair value.
FSP 157-4 was effective for interim and annual reporting periods beginning April 1, 2009, and has been applied prospectively. Its adoption on April 1, 2009, resulted in a positive net change of $13.3 million in net trust assets, which is included in change in fair value of net trust assets in the consolidated statements of operations. Offsetting the positive net change at adoption were decreases in the fair values of trust assets and trust liabilities as a result of the Company increasing loss assumptions for its long-term mortgage portfolio due to increases in expected defaults and loss severities related to the weak economy and housing market.
In August 2009, the FASB issued accounting guidance related to fair value measurement of liabilities. The amendments provide clarification that in circumstances in which a quoted price in an active market for an identical liability is not available, companies are required to measure value using one or more of the techniques prescribed by the standard. Valuation techniques include the quoted price of the identical liability when traded as an asset, quoted prices of similar liabilities or similar liabilities when traded as an asset, and other valuation techniques consistent with the principles of FASB ASC 820. The amendments also clarify that when estimating the fair value of a liability, companies are not required to include a separate input or adjustment to other inputs relating to the existence of a restriction that prevents the transfer of the liability. The amendments contained in ASU 2009-05 are not expected to have a material impact on our consolidated financial statements.
Recurring basis
Investment securities available-for-sale—The Company elected to carry all of its investment securities available-for-sale at fair value. The investment securities consist primarily of non-investment grade mortgage-backed securities. The fair value of the investment securities are measured based upon our expectation of inputs that other market participants would use. Such assumptions include our judgments about the underlying collateral, prepayment speeds, credit losses, and certain other factors. Given the market disruption and lack of observable market data as of September 30, 2009, the fair value of the investment securities available-for-sale were measured using significant internal expectations of market participants' assumptions.
Securitized mortgage collateral—The Company elected to carry all of its securitized mortgage collateral at fair value. These assets consist primarily of non-conforming single-family residential and multifamily mortgage loans securitized between 2002 and 2007. Fair value measurements are based on the Company's internal models used to compute the net present value of future expected cash flows with market participant assumptions, where available. The Company's assumptions include our expectations of inputs that other market participants would use in pricing these assets. These assumptions include our judgments about the underlying collateral, prepayment speeds, estimated future credit losses, forward interest rates, investor yield requirements and certain other factors.
Securitized mortgage borrowings—The Company elected to carry all of its securitized mortgage borrowings at fair value. These borrowings consist of individual tranches of bonds issued by
41
securitization trusts and are primarily backed by non-conforming mortgage loans. Fair value measurements include our judgments about the underlying collateral assumptions such as prepayment speeds, estimated future credit losses, forward interest rates, investor yield requirements and certain other factors.
Long-term debt—The Company elected to carry all of its long-term debt (consisting of trust preferred securities and junior subordinated notes) at fair value. These securities were measured based upon an analysis prepared by the Company, which considered the Company's own credit risk, including consideration of recent settlements with trust preferred debt holders and discounted cash flow analysis of junior subordinated notes.
Derivative assets and liabilities—For non-exchange traded contracts, fair value is based on the amounts that would be required to settle the positions with the related counterparties as of the valuation date. Valuations of derivative assets and liabilities are based on observable market inputs, if available. To the extent observable market inputs are not available, fair values measurements include the Company's judgments about the future cash flows, forward interest rates and certain other factors, including counterparty risk. These values also take into account the Company's own credit standing, to the extent applicable, thus included in the valuation of the derivative instrument is the value of the net credit differential between the counterparties to the derivative contract.
The Company's primary objective is to limit the exposure to the variability in future cash flows attributable to the variability of one-month LIBOR, which is the underlying index of adjustable rate securitized mortgage borrowings. The Company also monitors on an ongoing basis the prepayment risks that arise in fluctuating interest rate environments. The Company's interest rate risk management policies are formulated with the intent to offset the potential adverse effects of changing interest rates on securitized mortgage borrowings.
To mitigate exposure to the effect of changing interest rates on cash flows on securitized mortgage borrowings, the Company purchased derivative instruments primarily in the form of interest rate swap agreements (swaps) and, to a lesser extent, interest rate cap agreements (caps) and interest rate floor agreements (floors). Due to the closure of the mortgage operations, the Company has not entered into a new derivative instrument since the third quarter of 2007.
On September 15, 2008, Lehman Brothers Holdings Inc. (LBHI) filed a petition for protection under Chapter 11 of the U.S. Bankruptcy Code. As of that date, LBHI, through affiliated companies, was an interest rate swap counterparty to several of the Company's CMO and REMIC securitizations. At September 30, 2009, the estimated value of derivative liabilities to LBHI, through its affiliated companies was approximately $65.2 million and is included in derivative liabilities in the consolidated balance sheet. As the related securitization trusts are nonrecourse to the Company, the Company is not required to replace or otherwise settle any derivative positions affected by counterparty default within the consolidated trusts.
Nonrecurring basis
The Company is required to measure certain assets and liabilities at fair value. These fair value measurements typically result from the application of specific accounting pronouncements under GAAP. The fair value measurements are considered nonrecurring fair value measurements under the fair value hierarchy.
Loans held-for-sale—Loans held-for-sale are carried at lower of cost or market (LOCOM). When available, such measurements are based upon what secondary markets offer for portfolios of loans with similar characteristics, and are considered Level 2 measurements. If market pricing is not available, such measurements are significantly impacted by the Company's expectations of other market participants' assumptions, and are considered Level 3 measurements. The Company utilizes internal
42
pricing processes to estimate the fair value of loans held-for-sale, which is based on recent loan sales and estimates of the fair value of the underlying collateral. Loans held-for-sale, which are primarily included in assets of discontinued operations, are considered Level 3 fair value measurements at September 30, 2009 and December 31, 2008 based on the lack of observable market inputs.
Real estate owned—REO, which consists of residential real estate acquired in satisfaction of loans, is carried at net realizable value. Upon foreclosure, REO is adjusted to the estimated fair value of the residential real estate less estimated selling and holding costs, offset by expected mortgage insurance proceeds to be received, if any. Subsequently, REO is recorded at the lower of carrying value or estimated fair value less costs to sell. Fair values of REO are generally based on observable market inputs, and considered Level 2 measurements at September 30, 2009 and December 31, 2008.
Lease liability—In connection with the discontinuation of our non-conforming mortgage, retail mortgage, warehouse lending and commercial operations, a significant amount of office space that was previously occupied is no longer being used by the Company. The Company has subleased a significant amount of this office space. The Company has recorded a liability, included within discontinued operations, representing the fair value of the minimum lease payments over the remaining life of the lease, offset by the expected proceeds from sublet revenue related to this office space. This liability is based on the present value techniques that incorporate the Company's judgments about estimated sublet revenue and discount rates. Therefore, this liability is considered a Level 3 measurement at September 30, 2009 and December 31, 2008.
Deferred charge—Deferred charge represents the deferral of income tax expense on inter-company profits that resulted from the sale of mortgages from taxable subsidiaries to IMH in prior years. The deferred charge is amortized as a component of income tax expense over the estimated life of the mortgages retained in the securitized mortgage collateral. The Company evaluates the deferred charge for impairment quarterly using internal estimates of estimated cash flows and lives of the related mortgage retained in the securitized mortgage collateral. Deferred charge is considered a Level 3 measurement at September 30, 2009.
We continue to refine our valuation methodologies as markets and products develop and the pricing for certain products becomes more or less transparent. While we believe our valuation methods are appropriate and consistent with those of other market participants, the use of different methodologies or assumptions to determine the fair value of certain financial instruments could result in a materially different estimate of fair value as of the reporting date.
Interest income on securitized mortgage collateral and interest expense on securitized mortgage borrowings are recorded using the effective yield for the period based on the previous quarter's estimated fair value.
Selected Financial Results for the Three Months Ended September 30, 2009
Continuing Operations
- •
- Earnings from continuing operations of $4.8 million for the third quarter of 2009, compared to $1.9 million
for the comparable 2008 period.
- •
- Net interest income of $1.9 million for the third quarter of 2009, primarily from our long-term
mortgage portfolio, compared to $3.0 million for the comparable 2008 period.
- •
- Non-interest income—net trust assets of $3.2 million for the third quarter of 2009, compared to $(7.9) million for the comparable 2008 period.
43
- •
- Mortgage and real estate services fees of $13.5 million for the third quarter of 2009, compared to
$2.9 million for the comparable 2008 period.
- •
- Personnel expense of $9.4 million for the third quarter of 2009, compared to $2.4 million for the comparable 2008 period.
Discontinued Operations
- •
- Loss from discontinued operations of $1.8 million for the third quarter of 2009, compared to a loss of
$18.1 million for the comparable 2008 period.
- •
- Restructured Financing was $151.1 million at September 30, 2009, compared to $188.7 million at
December 31, 2008.
- •
- Loans held-for-sale were $79.2 million, including a fair value adjustment of $94.4 million at September 30, 2009, compared to loans held-for-sale of $107.8 million, including a $109.1 million fair value adjustment at December 31, 2008.
Selected Financial Results for the Nine Months Ended September 30, 2009
Continuing Operations
- •
- Earnings from continuing operations of $14.1 million for the nine months ended September 30, 2009, compared
to a loss of $19.0 million for the comparable 2008 period.
- •
- Net interest income of $8.5 million for the nine months ended September 30, 2009, primarily from our
long-term mortgage portfolio, compared to $14.6 million for the comparable 2008 period.
- •
- Non-interest income—net trust assets of $16.1 million for the nine months ended
September 30, 2009, compared to $(24.6) million for the comparable 2008 period.
- •
- Mortgage and real estate services fees of $32.3 million for the nine months ended September 30, 2009,
compared to $7.1 million for the comparable 2008 period.
- •
- Personnel expense of $26.1 million for the nine months ended September 30, 2009, compared to $7.5 million for the comparable 2008 period.
Discontinued Operations
- •
- Loss from discontinued operations of $8.4 million for the nine months ended September 30, 2009, compared to a loss of $28.5 million for the comparable 2008 period.
While the Company has generated significant net operating loss carryforwards in recent periods, we do not expect to generate sufficient taxable income in future periods to be able to realize these tax benefits. Therefore, we have recorded a full valuation allowance against the net deferred tax assets as we believe that as of September 30, 2009 it is more likely than not that the net deferred tax assets will not be recoverable.
44
Financial Condition and Results of Operations
Financial Condition
Condensed Balance Sheet Data
| |
September 30, 2009 |
December 31, 2008 |
Increase (Decrease) |
% Change |
|||||||||||
|---|---|---|---|---|---|---|---|---|---|---|---|---|---|---|---|
Investment securities available-for-sale |
$ | 1,049 | $ | 2,068 | $ | (1,019 | ) | (49 | )% | ||||||
Securitized mortgage collateral |
5,767,379 |
5,894,424 |
(127,045 |
) |
(2 |
) |
|||||||||
Derivative assets |
222 | 37 | 185 | 500 | |||||||||||
Real estate owned |
170,153 | 599,084 | (428,931 | ) | (72 | ) | |||||||||
Total trust assets |
5,938,803 | 6,495,613 | (556,810 | ) | (9 | ) | |||||||||
Assets of discontinued operations |
98,257 |
141,053 |
(42,796 |
) |
(30 |
) |
|||||||||
Other assets |
71,703 | 78,851 | (7,148 | ) | (9 | ) | |||||||||
Total assets |
$ | 6,108,763 | $ | 6,715,517 | $ | (606,754 | ) | (9 | )% | ||||||
Securitized mortgage borrowings |
$ |
5,744,725 |
$ |
6,193,984 |
$ |
(449,259 |
) |
(7 |
)% |
||||||
Derivative liabilities |
164,835 | 273,584 | (108,749 | ) | (40 | ) | |||||||||
Total trust liabilities |
5,909,560 | 6,467,568 | (558,008 | ) | (9 | ) | |||||||||
Liabilities of discontinued operations |
170,973 |
217,241 |
(46,268 |
) |
(21 |
) |
|||||||||
Other liabilities |
18,540 | 21,456 | (2,916 | ) | (14 | ) | |||||||||
Total liabilities |
6,099,073 | 6,706,265 | (607,192 | ) | (9 | ) | |||||||||
Total stockholders' equity |
9,690 | 9,252 | 438 | 5 | |||||||||||
Total liabilities and stockholders' equity |
$ | 6,108,763 | $ | 6,715,517 | $ | (606,754 | ) | (9 | )% | ||||||
Total assets and total liabilities were $6.1 billion at September 30, 2009 as compared to $6.7 billion at December 31, 2008. The decrease in total assets and liabilities are primarily attributable to decreases in the Company's trust assets and trust liabilities as summarized below:
- •
- Securitized mortgage collateral decreased $127.0 million during the nine months ended September 30, 2009.
The decrease in securitized mortgage collateral from $5.9 billion at December 31, 2008 to $5.8 billion at September 30, 2009 was primarily due to increased loss assumptions
and reductions in principal balances from defaults and principal payments during the period, offset by the adoption of FSP 157-4 during the second quarter of 2009, which clarified the use
of quoted prices in determining fair values in markets that are inactive, thus moderating the need to use distressed prices in valuing financial assets and liabilities in illiquid markets as the
Company had used in prior periods. For the nine months ended September 30, 2009, increases in fair value totaled $816.3 million, offset by reductions in principal balances (resulting
from transfers to REO and principal paydowns) of $943.3 million.
- •
- REO within the Company's securitization trusts decreased $428.9 million to $170.2 million at
September 30, 2009. Increases in REO from foreclosures totaled $279.1 million. Offsetting the increase in REO from foreclosures were $590.2 million in liquidations and
$117.9 million in additional lower of cost or market write-downs subsequent to foreclosure.
- •
- Securitized mortgage borrowings decreased $449.3 million to $5.7 billion at September 30, 2009. The decrease in securitized mortgage borrowings was primarily due to increased loss assumptions and reductions in principal balances during the period, offset by the adoption of FSP 157-4 during the second quarter of 2009, which clarified the use of quoted prices in determining fair values in markets that are inactive, thus moderating the need to use distressed
45
- •
- Derivative liabilities, net decreased $108.9 million during the nine months to $164.6 million at September 30, 2009. The decrease is the result of a $48.7 million change in fair value resulting from decreases in the forward Libor curve, offset by $157.6 million in cash payments from the securitization trusts.
prices in valuing financial asset and liabilities in illiquid markets as the Company had used in prior periods. For the nine months ended September 30, 2009, increases in fair value totaled $1.1 billion, offset by reductions in outstanding balances of $1.5 billion.
Since our consolidated and unconsolidated securitization trusts are nonrecourse to the Company, our economic risk is limited to our residual interests in these securitization trusts. Therefore, in the following table we have netted trust assets and trust liabilities to present these residual interests more simply. Our residual interests in securitizations are segregated between our single-family (SF) residential and multifamily (MF) residential portfolios and are represented by the difference between trust assets and trust liabilities. For unconsolidated securitizations, our residual interests represent the fair value of investment securities available-for-sale. For consolidated securitizations, our residual interests are represented by the fair value of securitized mortgage collateral and net realizable value of real estate owned, offset by the fair value of securitized mortgage borrowings and net derivative liabilities. The following tables present the estimated fair value of our residual interests by securitization vintage year and other related assumptions used to derive these values at September 30, 2009:
| |
Estimated Fair Value of Residual Interests by Vintage Year |
||||||||||
|---|---|---|---|---|---|---|---|---|---|---|---|
| |
SF | MF | Total | ||||||||
2002 - 2003(1) |
$ | 14,018 | $ | 6,585 | $ | 20,603 | |||||
2004 |
1,537 | 6,256 | 7,793 | ||||||||
2005(2) |
12 | 403 | 415 | ||||||||
2006(2) |
— | 432 | 432 | ||||||||
2007(2) |
— | — | — | ||||||||
Total |
$ | 15,567 | $ | 13,676 | $ | 29,243 | |||||
Weighted avg. prepayment rate |
6 |
% |
20 |
% |
7 |
% |
|||||
Weighted avg. discount rate |
30 | % | 21 | % | 26 | % | |||||
- (1)
- 2002-2003
vintage year includes CMO 2007-A, since the majority of the mortgages collateralized in this securitization were
originated during this period.
- (2)
- The estimated fair values of residual interests in vintage years 2005 through 2007 is reflective of higher estimated future losses and investor yield requirements compared to earlier vintage years.
The credit loss, prepayment and forward interest rate assumptions used in the fair value process were the same for trust assets, trust liabilities and residual interests, as the collateral assumptions determine collateral cash flows which are used to pay the bonds and residual interests. The only difference in assumptions was between the investor yield requirements on trust assets and liabilities (trust liabilities were slightly less on those securitization trusts with residual interests) and the discount
46
rates used for residual interests. The table below reflects the estimated future credit losses and investor yield requirements for trust assets by product (SF and MF) and securitization vintage:
| |
Estimated Future Losses(1) |
Investor Yield Requirement(2) |
|||||||||||
|---|---|---|---|---|---|---|---|---|---|---|---|---|---|
| |
SF | MF | SF | MF | |||||||||
2002 - 2003 |
6 | % | 2 | % | 12 | % | 13 | % | |||||
2004 |
22 | % | 2 | % | 15 | % | 12 | % | |||||
2005 |
41 | % | 8 | % | 21 | % | 17 | % | |||||
2006 |
55 | % | 18 | % | 21 | % | 21 | % | |||||
2007 |
49 | % | 15 | % | 20 | % | 20 | % | |||||
- (1)
- Estimated
future losses derived by dividing future projected losses by unpaid principal balances at September 30, 2009.
- (2)
- Investor yield requirements represent the Company's estimate of the yield third-party market participants would require to price our trust assets and liabilities given our prepayment, credit loss and forward interest rate assumptions.
The adoption of FSP 157-4 clarified the use of quoted prices in determining fair value for assets and liabilities in inactive markets. Fair value is the price that would be received to sell an asset or paid to transfer a liability in an orderly transaction. Upon adoption and at September 30, 2009, the Company relied on observable market participant assumptions for investor yield requirements resulting in an overall decrease in weighted average yield requirements as compared to prior periods. The increases in fair value as a result of decreased yield requirements was offset by increased loss assumptions due to increases in expected defaults and severities related to the weak economy and housing market.
The following table presents selected financial data as of the dates indicated:
| |
As of and Year-to-Date Ended, | |||||||||
|---|---|---|---|---|---|---|---|---|---|---|
| |
September 30, 2009 |
June 30, 2009 |
December 31, 2008 |
|||||||
Prior 12-month constant prepayment rate (CPR)—Residential |
11 | % | 12 | % | 11 | % | ||||
Prior 12-month constant prepayment rate (CPR)—Commercial |
6 | % | 8 | % | 10 | % | ||||
Total nonperforming loans |
$ | 3,055,540 | $ | 3,166,056 | $ | 3,040,291 | ||||
Total nonperforming loans to total loans |
23.0 | % | 22.4 | % | 19.4 | % | ||||
Total nonperforming assets(1) |
$ | 3,230,719 | $ | 3,450,125 | $ | 3,646,742 | ||||
Total nonperforming assets to total assets(2) |
17.3 | % | 20.1 | % | 25.8 | % | ||||
- (1)
- Nonperforming
assets include the unpaid principal balance of nonperforming loans (loans that are 90 days or more delinquent, including loans in
foreclosure and delinquent bankruptcies) and REO.
- (2)
- Nonperforming assets to total assets is presented as the fair value of loans 90 or more days delinquent, foreclosures and delinquent bankruptcies plus REO as a percentage of total assets.
47
We believe that in order for us to generate cash flows from the long-term mortgage portfolio, we must successfully manage the following operational and market risks:
- •
- liquidity risk;
- •
- credit risk;
- •
- interest rate risk; and
- •
- prepayment risk.
Liquidity Risk. Refer to "Status of Operations, Liquidity and Capital Resources."
Credit risk. We manage credit risk by actively managing delinquencies and defaults through our servicers. Starting with the second half of 2007 we have not retained any mortgages in our long-term mortgage portfolio. Our securitized mortgage collateral primarily consists of Alt-A mortgages which are generally within typical Fannie Mae and Freddie Mac guidelines but have loan characteristics, which may include higher loan balances, higher loan-to-value ratios or lower documentation requirements (including stated-income loans), that make them non-conforming under those guidelines.
As of September 30, 2009, single-family and multifamily securitized mortgage collateral had an original weighted average credit score of 701 and 731, an original weighted average LTV ratio of 73 and 66 percent and an original CLTV of 83 percent and 66 percent, respectively. The current LTV and CLTV ratios likely have increased from origination date as a result of the deterioration of the real estate market.
Using historical losses, current portfolio statistics and market conditions and available market data, the Company has estimated future loan losses, which are included in the fair value adjustment to our investment securities available for sale and securitized mortgage collateral. While the credit performance for the loans has been clearly far worse than the Company's initial expectations when the loans were originated, the ultimate level of realized losses will largely be influenced by events that will likely unfold over the next several years, including the severity of housing price declines and overall strength of the economy. If market conditions continue to deteriorate in excess of our expectations, the Company may need to recognize additional fair value reductions to our investment securities available for sale and securitized mortgage collateral, which may also affect the value of the related securitized mortgage borrowings.
We monitor our servicers to attempt to ensure that they perform loss mitigation, foreclosure and collection functions according to their servicing practices and each securitization trust's pooling and servicing agreement. We have met with the management of our servicers to assess our borrowers' current ability to pay their mortgages and to make arrangements with selected delinquent borrowers which will result in the best interest of the trust, borrower and the Company, in an effort to minimize the number of mortgages which become seriously delinquent. When resolving delinquent mortgages, servicers are required to take timely action. The servicer is required to determine payment collection under various circumstances, which will result in the maximum financial benefit. This is accomplished by either working with the borrower to bring the mortgage current or by foreclosing and liquidating the property. When a borrower fails to make required payments on a mortgage and does not cure the delinquency within 60 days, we generally record a notice of default and commence foreclosure proceedings, or arrange alternative terms of forbearance. If the mortgage is not reinstated within the time permitted by law for reinstatement, the property may then be sold at a foreclosure sale. At a foreclosure sale, the trusts consolidated on our balance sheet generally acquire title to the property.
We use the Mortgage Bankers Association (MBA) method to define delinquency as a contractually required payment being 30 days or more past due. We measure delinquencies from the date of the last payment due date in which a payment was received. Delinquencies for loans 60 days late or greater, foreclosures and delinquent bankruptcies were $3.4 billion or 25.8 percent as of September 30, 2009.
48
The following table summarizes the unpaid principal balances of nonperforming loans in our mortgage portfolio, included in securitized mortgage collateral, loans held-for-investment and loans held-for-sale for continuing and discontinued operations combined, that were 60 or more days delinquent (utilizing the MBA method) as of the dates indicated:
| |
September 30, 2009 |
% | December 31, 2008 |
% | |||||||||||
|---|---|---|---|---|---|---|---|---|---|---|---|---|---|---|---|
Loans held for sale(1) |
|||||||||||||||
60 - 89 days delinquent |
$ | 6,254 | 0.0 | % | $ | 13,694 | 0.1 | % | |||||||
90 or more days delinquent |
59,911 | 0.5 | % | 63,541 | 0.4 | % | |||||||||
Foreclosures(2) |
51,671 | 0.4 | % | 65,661 | 0.4 | % | |||||||||
Total 60+ days delinquent loans held-for-sale |
117,836 | 0.9 | % | 142,896 | 0.9 | % | |||||||||
Securitized mortgage collateral |
|||||||||||||||
60 - 89 days delinquent |
$ | 361,028 | 2.7 | % | $ | 494,960 | 3.2 | % | |||||||
90 or more days delinquent |
1,030,620 | 7.8 | % | 1,096,366 | 7.0 | % | |||||||||
Foreclosures(2) |
1,619,363 | 12.2 | % | 1,614,472 | 10.3 | % | |||||||||
Delinquent bankruptcies(3) |
293,975 | 2.2 | % | 200,251 | 1.3 | % | |||||||||
Total 60+ days delinquent long-term mortgage portfolio |
3,304,986 | 24.9 | % | 3,406,049 | 21.7 | % | |||||||||
Total 60 or more days delinquent |
$ | 3,422,822 | 25.8 | % | $ | 3,548,945 | 22.7 | % | |||||||
Total collateral |
$ | 13,256,626 | $ | 15,666,243 | |||||||||||
- (1)
- Loans
held-for-sale are substantially included in discontinued operations in the consolidated balance sheets.
- (2)
- Represents
properties in the process of foreclosure.
- (3)
- Represents bankruptcies that are 30 days or more delinquent.
The following table summarizes securitized mortgage collateral, loans held-for-investment, loans held-for-sale and real estate owned, that were nonperforming for continuing and discontinued operations combined as of the dates indicated (excludes 60-89 days delinquent):
| |
September 30, 2009 |
% | December 31, 2008 |
% | ||||||||||
|---|---|---|---|---|---|---|---|---|---|---|---|---|---|---|
90 or more days delinquent, foreclosures and delinquent bankruptcies |
$ | 3,055,540 | 95 | % | $ | 3,040,291 | 83 | % | ||||||
Real estate owned |
175,179 | 5 | % | 606,451 | 17 | % | ||||||||
Total nonperforming assets |
$ | 3,230,719 | 100 | % | $ | 3,646,742 | 100 | % | ||||||
Nonperforming assets consist of nonperforming loans (mortgages that are 90 days or more delinquent, including loans in foreclosure and delinquent bankruptcies) plus REO. It is our policy to place a mortgage on nonaccrual status when it becomes 90 days delinquent and to reverse from revenue any accrued interest, except for interest income on securitized mortgage collateral when the scheduled payment is received from the servicer. The servicers are required to advance principal and interest on loans within the securitization trusts to the extent the advances are considered recoverable. As of September 30, 2009, nonperforming assets (representing the fair value of loans 90 or more days delinquent, foreclosures and delinquent bankruptcies plus REO) as a percentage of the total assets was 17 percent. At December 31, 2008, nonperforming assets to total assets was 26 percent.
49
REO, which consists of residential real estate acquired in satisfaction of loans, is carried at the lower of cost or net realizable value less estimated selling costs. Adjustments to the carrying value of REO at the time of foreclosure are included in the change in the fair value of net trust assets. Changes in the Company's estimates of net realizable value subsequent to the time of foreclosure and through the time of ultimate disposition are recorded as gains or losses from real estate owned in the consolidated statements of operations. REO, for continuing and discontinued operations, at September 30, 2009 decreased $431.3 million or 71 percent from December 31, 2008 as a result of increased liquidations during the nine month period ended September 30, 2009. Foreclosures continue to increase resulting from higher delinquencies and deterioration in the prevailing real estate market and, in part, due to borrowers' inability to obtain replacement financing.
We realized a loss on sale of real estate owned in the amount $18.6 million and $100.2 million for the three and nine months ended September 30, 2009, respectively, compared to $10.1 million and $4.9 million, respectively for the comparable 2008 periods. Additionally, during the three and nine months ended September 30, 2009, the Company recorded write-downs of the net realizable value of the REO in the amount of $24.5 million and $117.9 million, respectively, compared to $5.6 million and $19.9 million, respectively, for the comparable 2008 periods. These write-downs of the net realizable value reflect declines in value of the REO subsequent to foreclosure date.
The following table presents the balances of REO for continuing operations:
| |
September 30, 2009 |
December 31, 2008 |
|||||
|---|---|---|---|---|---|---|---|
REO |
$ | 218,107 | $ | 635,285 | |||
Impairment(1) |
(47,474 | ) | (35,533 | ) | |||
Ending balance |
$ | 170,633 | $ | 599,752 | |||
REO inside trusts |
$ |
170,153 |
$ |
599,084 |
|||
REO outside trusts(2) |
480 | 668 | |||||
Total |
$ | 170,633 | $ | 599,752 | |||
- (1)
- Impairment
represents the cumulative write-downs of net realizable value subsequent to foreclosure.
- (2)
- Amount represents REO related to former on-balance sheet securitizations, which were collapsed as the result of the Company exercising its clean-up call options. This REO is included in other assets in the accompanying consolidated balance sheets.
In calculating the cash flows to assess the fair value of the securitized mortgage collateral, the Company estimates the future losses embedded in our loan portfolio. In evaluating the adequacy of these losses, management takes many factors into consideration. For instance, a detailed analysis of historical loan performance data is accumulated and reviewed. This data is analyzed for loss performance and prepayment performance by product type, origination year and securitization issuance. The data is also broken down by collection status. Our estimate of losses for these loans is developed by estimating both the rate of default of the loans and the amount of loss in the event of default. The rate of default is assigned to the loans based on their attributes (e.g., original loan-to-value, borrower credit score, documentation type, geographic location, etc.) and collection status. The rate of default is based on analysis of migration of loans from each aging category. The loss severity is determined by estimating the net proceeds from the ultimate sale of the foreclosed property. The results of that analysis are then applied to the current mortgage portfolio and an estimate is created. We believe that pooling of mortgages with similar characteristics is an appropriate methodology in which to evaluate the future loan losses.
50
Management recognizes that there are qualitative factors that must be taken into consideration when evaluating and measuring losses in the loan portfolios. These items include, but are not limited to, economic indicators that may affect the borrower's ability to pay, changes in value of collateral, political factors, employment and market conditions, competitor's performance, market perception, historical losses, and industry statistics. The assessment for losses, is based on delinquency trends and prior loss experience and management's judgment and assumptions regarding various matters, including general economic conditions and loan portfolio composition. Management continually evaluates these assumptions and various relevant factors affecting credit quality and inherent losses.
Interest Rate Risk. Refer to Item 3. "Quantitative and Qualitative Disclosures About Market Risk."
Prepayment Risk. The Company historically used prepayment penalties as a method of partially mitigating prepayment risk for those borrowers that have the ability to refinance. The recent economic downturn, lack of available credit and declines in property values have limited borrowers' ability to refinance. These factors have significantly reduced prepayment risk within our long-term mortgage portfolio. With the seasoning of the long-term mortgage portfolio, a significant portion of prepayment penalties terms have expired, thereby further reducing prepayment penalty income.
51
For the Three and Nine Months Ended September 30, 2009 compared to the Three and Nine Months Ended September 30, 2008
Condensed Statements of Operations Data
| |
For the Three Months Ended September 30, | |||||||||||||
|---|---|---|---|---|---|---|---|---|---|---|---|---|---|---|
| |
2009 | 2008 | Increase (Decrease) |
% Change |
||||||||||
Interest income |
$ | 341,323 | $ | 397,445 | $ | (56,122 | ) | (14 | )% | |||||
Interest expense |
339,417 | 394,431 | (55,014 | ) | (14 | ) | ||||||||
Net interest income |
1,906 | 3,014 | (1,108 | ) | (37 | ) | ||||||||
Total non-interest income |
16,913 | 11,473 | 5,440 | 47 | ||||||||||
Total non-interest expense |
14,016 | 7,333 | 6,683 | 91 | ||||||||||
Income tax expense |
— | 5,253 | (5,253 | ) | (100 | ) | ||||||||
Earnings from continuing operations |
4,803 | 1,901 | 2,902 | 153 | ||||||||||
Loss from discontinued operations, net |
(1,776 | ) | (18,121 | ) | 16,345 | 90 | ||||||||
Net earnings (loss) |
$ | 3,027 | $ | (16,220 | ) | $ | 19,247 | 119 | ||||||
Cash dividends on preferred stock |
$ | — | $ | (3,722 | ) | $ | 3,722 | 100 | ||||||
Net earnings (loss) attributable to common stockholders |
$ | 3,027 | $ | (19,942 | ) | $ | 22,969 | 115 | % | |||||
Earnings (loss) per common share—basic and diluted: |
$ |
0.38 |
$ |
(2.62 |
) |
$ |
3.00 |
114 |
% |
|||||
| |
For the Nine Months Ended September 30, | |||||||||||||
|---|---|---|---|---|---|---|---|---|---|---|---|---|---|---|
| |
2009 | 2008 | Increase (Decrease) |
% Change |
||||||||||
Interest income |
$ | 1,508,230 | $ | 1,077,256 | $ | 430,974 | 40 | % | ||||||
Interest expense |
1,499,729 | 1,062,637 | 437,092 | 41 | ||||||||||
Net interest income |
8,501 | 14,619 | (6,118 | ) | (42 | ) | ||||||||
Total non-interest income |
48,729 | 1,715 | 47,014 | 2,741 | ||||||||||
Total non-interest expense |
41,103 | 21,395 | 19,708 | 92 | ||||||||||
Income tax expense |
2,018 | 13,980 | (11,962 | ) | (86 | ) | ||||||||
Earnings (loss) from continuing operations |
14,109 | (19,041 | ) | 33,150 | 174 | |||||||||
Loss from discontinued operations, net |
(8,366 | ) | (28,481 | ) | 20,115 | 71 | ||||||||
Net earnings (loss) |
$ | 5,743 | $ | (47,522 | ) | $ | 53,265 | 112 | ||||||
Cash dividends on preferred stock |
$ | (7,443 | ) | $ | (11,165 | ) | $ | 3,722 | 33 | |||||
Net loss attributable to common stockholders |
$ | (1,700 | ) | $ | (58,687 | ) | $ | 56,987 | 97 | % | ||||
Loss per common share—basic and diluted: |
$ |
(0.22 |
) |
$ |
(7.71 |
) |
$ |
7.49 |
97 |
% |
||||
52
Net Interest Income
We earn net interest income primarily from mortgage assets which include securitized mortgage collateral, loans held-for-sale and investment securities available-for-sale, or collectively, "mortgage assets," and, to a lesser extent, interest income earned on cash and cash equivalents. Interest expense is primarily interest paid on borrowings secured by mortgage assets, which include securitized mortgage borrowings. Interest income and interest expense during the period primarily represents the effective yield, based on the fair value of the trust assets and liabilities.
The following tables summarize average balance, interest and weighted average yield on mortgage assets and borrowings, included within continuing and discontinued operations, for the periods indicated. Cash receipts and payments on derivative instruments hedging interest rate risk related to our securitized mortgage borrowings are not included in the results below. These cash receipts and payments are included as a component of the change in fair value of net trust assets.
| |
For the Three Months Ended September 30, | ||||||||||||||||||
|---|---|---|---|---|---|---|---|---|---|---|---|---|---|---|---|---|---|---|---|
| |
2009 | 2008 | |||||||||||||||||
| |
Average Balance |
Interest | Yield | Average Balance |
Interest | Yield | |||||||||||||
MORTGAGE ASSETS |
|||||||||||||||||||
Investment securities, available-for-sale |
$ | 1,191 | $ | 154 | 51.72 | % | $ | 8,322 | $ | 560 | 26.92 | % | |||||||
Securitized mortgage collateral |
5,892,885 | 340,828 | 23.13 | % | 9,659,897 | 396,695 | 16.43 | % | |||||||||||
Loans held-for-investment and held-for-sale(1) |
180,459 | 1,118 | 2.48 | % | 152,115 | 2,043 | 5.37 | % | |||||||||||
Total mortgage assets\ interest income |
$ | 6,074,535 | $ | 342,100 | 22.53 | % | $ | 9,820,334 | $ | 399,298 | 16.26 | % | |||||||
BORROWINGS |
|||||||||||||||||||
Securitized mortgage borrowings |
$ | 5,912,681 | $ | 338,563 | 22.90 | % | $ | 10,142,072 | $ | 392,271 | 15.47 | % | |||||||
Reverse repurchase agreements |
158,406 | 1,425 | 3.60 | % | 208,949 | 2,039 | 3.90 | % | |||||||||||
Total borrowings on mortgage assets\ interest expense |
$ | 6,071,087 | $ | 339,988 | 22.40 | % | $ | 10,351,021 | $ | 394,310 | 15.24 | % | |||||||
Net Interest Spread(2) |
$ |
2,112 |
0.13 |
% |
$ |
4,988 |
1.03 |
% |
|||||||||||
Net Interest Margin(3) |
0.14 | % | 0.20 | % | |||||||||||||||
- (1)
- The
held-for-sale balance excludes the lower of cost or market (LOCOM) write-down on the loans.
- (2)
- Net
interest spread on mortgage assets is calculated by subtracting the weighted average yield on total borrowings on mortgage assets from the weighted
average yield on total mortgage assets.
- (3)
- Net interest margin on mortgage assets is calculated by subtracting interest expense on total borrowings on mortgage assets from interest income on total mortgage assets and then dividing by total average mortgage assets.
Net interest income spread decreased $2.9 million for the three months ended September 30, 2009 to $2.1 million from $5.0 million for the comparable 2008 period. The decrease in net interest spread was primarily attributable to overall declines in credit quality between periods and the resulting decrease in net interest income on securitized mortgage collateral and securitized mortgage borrowings, as well as reductions in net interest income on loans held for sale. As a result, net interest margin decreased from 0.20 percent for the three months ended September 30, 2008 to 0.14 percent for the three months ended September 30, 2009.
53
During the three months ended September 30, 2009, the yield on mortgage assets increased to 22.53 percent from 16.26 percent in the comparable 2008 period. The yield on total borrowings increased to 22.40 percent for the three months ended September 30, 2009 from 15.24 percent for comparable 2008 period. In connection with the fair value accounting for investment securities available-for-sale and securitized mortgage collateral and borrowings, interest income and interest expense is recognized using effective yields based on estimated fair values for these instruments. As the market's expectation of future credit losses has increased between periods, market participants have demanded higher yields, which have resulted in significant reductions in the fair values of these instruments. These reductions in fair value have significantly increased the effective yields used for purposes of recognizing interest income and interest expense on these instruments.
| |
For the Nine Months Ended September 30, | ||||||||||||||||||
|---|---|---|---|---|---|---|---|---|---|---|---|---|---|---|---|---|---|---|---|
| |
2009 | 2008 | |||||||||||||||||
| |
Average Balance |
Interest | Yield | Average Balance |
Interest | Yield | |||||||||||||
MORTGAGE ASSETS |
|||||||||||||||||||
Investment securities, available-for-sale |
$ | 1,443 | $ | 387 | 35.76 | % | $ | 11,250 | $ | 1,980 | 23.47 | % | |||||||
Securitized mortgage collateral |
6,371,533 | 1,506,951 | 31.54 | % | 11,666,313 | 1,073,580 | 12.27 | % | |||||||||||
Loans held-for-investment and held-for-sale(1) |
196,688 | 3,023 | 2.05 | % | 182,683 | 9,492 | 6.93 | % | |||||||||||
Total mortgage assets\ interest income |
$ | 6,569,664 | $ | 1,510,361 | 30.65 | % | $ | 11,860,246 | $ | 1,085,052 | 12.20 | % | |||||||
BORROWINGS |
|||||||||||||||||||
Securitized mortgage borrowings |
$ | 6,499,331 | $ | 1,497,456 | 30.72 | % | $ | 11,988,676 | $ | 1,055,519 | 11.74 | % | |||||||
Reverse repurchase agreements |
173,252 | 4,758 | 3.66 | % | 241,961 | 7,197 | 3.97 | % | |||||||||||
Total borrowings on mortgage assets\ interest expense |
$ | 6,672,583 | $ | 1,502,214 | 30.02 | % | $ | 12,230,637 | $ | 1,062,716 | 11.59 | % | |||||||
Net Interest Spread(2) |
$ |
8,147 |
0.63 |
% |
$ |
22,336 |
0.61 |
% |
|||||||||||
Net Interest Margin(3) |
0.17 | % | 0.25 | % | |||||||||||||||
- (1)
- The
held-for-sale balance excludes the lower of cost or market (LOCOM) write-down on the loans.
- (2)
- Net
interest spread on mortgage assets is calculated by subtracting the weighted average yield on total borrowings on mortgage assets from the weighted
average yield on total mortgage assets.
- (3)
- Net interest margin on mortgage assets is calculated by subtracting interest expense on total borrowings on mortgage assets from interest income on total mortgage assets and then dividing by total average mortgage assets.
Net interest income spread for the nine months ended September 30, 2009 decreased $14.2 million to $8.1 million from $22.3 million for the comparable 2008 period. The decrease in net interest spread was primarily attributable to overall declines in credit quality between periods and the resulting decrease in net interest income on securitized mortgage collateral and securitized mortgage borrowings, as well as reductions in net interest income on loans held for sale. As a result, net interest margin decreased from 0.25 percent for the nine months ended September 30, 2008 to 0.17 percent for the nine months ended September 30, 2009.
During the nine months ended September 30, 2009, the yield on mortgage assets increased to 30.65 percent from 12.20 percent in the comparable 2008 period. The yield on total borrowings
54
increased to 30.02 percent for the nine months ended September 30, 2009 from 11.59 percent for comparable 2008 period. In connection with the fair value accounting for investment securities available-for-sale and securitized mortgage collateral and borrowings, interest income and interest expense is recognized using effective yields based on estimated fair values for these instruments. As the market's expectation of future credit losses has increased between periods, market participants have demanded higher yields, which have resulted in significant reductions in the fair values of these instruments. These reductions in fair value have significantly increased the effective yields used for purposes of recognizing interest income and interest expense on these instruments.
Non-Interest Income
Changes in Non-Interest Income
| |
For the Three Months Ended September 30, | |||||||||||||
|---|---|---|---|---|---|---|---|---|---|---|---|---|---|---|
| |
2009 | 2008 | Increase (Decrease) |
% Change |
||||||||||
Change in fair value of net trust assets, excluding REO |
$ | 46,325 | $ | 7,778 | $ | 38,547 | 496 | % | ||||||
Losses from real estate owned |
(43,160 | ) | (15,685 | ) | (27,475 | ) | (175 | ) | ||||||
Non-interest income—net trust assets |
3,165 | (7,907 | ) | 11,072 | 140 | |||||||||
Change in fair value of long-term debt |
341 | 10,494 | (10,153 | ) | (97 | ) | ||||||||
Real estate advisory fees |
— | 7,039 | (7,039 | ) | (100 | ) | ||||||||
Mortgage and real estate services fees |
13,514 | 2,923 | 10,591 | 362 | ||||||||||
Other |
(107 | ) | (1,076 | ) | 969 | 90 | ||||||||
Total non-interest income |
$ | 16,913 | $ | 11,473 | $ | 5,440 | 47 | % | ||||||
Non-interest income—net trust assets. Since our consolidated and unconsolidated securitization trusts are nonrecourse to the Company, our economic risk is limited to our residual interests in these securitization trusts. To better understand the economics on our residual interests in securitizations, it is necessary to consider the net effect of changes in fair value of net trust assets and losses from real estate owned. All estimated future losses are included in the estimate of the fair value of securitized mortgage collateral and REO. Losses on REO are reported separately in the consolidated statement of operations as REO is a nonfinancial asset which is the only component of trust assets and liabilities that is not recorded at fair value. Therefore, REO value at the time of sale or losses from further write-downs are recorded separately in the Company's consolidated statement of operations. The net effect of changes in value related to our investment in all trust assets and liabilities is shown as non-interest income—net trust assets, which includes losses from real estate owned. Non-interest income related to our net trust assets (residual interests in securitizations) was $3.2 million for the three months ended September 30, 2009, compared to a loss of $7.9 million in the comparable 2008 period. The $3.2 million gain on net trust assets was primarily attributable to increased expected net interest spread as a result of a downward shift in the forward Libor curve during the three months ended September 30, 2009. The individual components of the non-interest income from net trust assets were comprised of:
Change in fair value of net trust assets, excluding REO. For the quarter ended September 30, 2009, the Company recognized a $46.3 million gain from the change in fair value of net trust assets, excluding REO. The net gain recognized during the period was comprised of gains from the increase in fair value of investment securities-for-sale and reduction in the fair value of securitized mortgage borrowings of $1.2 million and $153.0 million, respectively. Offsetting these gains were losses resulting from decreases in the fair value of securitized mortgage collateral and increases in the fair value of derivative liabilities, net of $79.4 million and $28.4 million, respectively.
55
For the quarter ended September 30, 2008, the Company recognized a $7.8 million gain from the change in fair value of net trust assets, excluding REO. This gain was comprised of losses from reductions in the fair value of investment securities available-for-sale and securitized mortgage collateral of $3.1 million and $2.4 billion, respectively, and an increase in the fair value of derivative liabilities, net of $10.9 million. Offsetting these losses was a gain of $2.4 billion resulting from changes in the fair value of securitized mortgage borrowings.
Losses from real estate owned. Losses from real estate owned were $43.2 million for the three months ended September 30, 2009. This loss was comprised of an $18.7 million loss on sale of real estate owned, coupled with $24.5 million in additional impairment write-downs during the period. During the quarter, loss severities resulting from liquidations in areas where we have high concentration of foreclosed properties (such as California and Florida) have continued to increase over previous periods as a result of continued deterioration in the U.S. economy and real estate markets. These continued declines in housing prices have resulted in liquidations of foreclosed assets at prices below expected levels as well as additional impairment write-downs of REO since foreclosure.
Losses from real estate owned were $15.7 million for the three months ended September 30, 2008, comprised of $10.1 million in losses from the sale of real estate owned and $5.6 million in additional impairment write-downs.
Change in the fair value of long-term debt. Change in the fair value of long-term debt was a gain of $341 thousand for the three months ended September 30, 2009, compared to $10.5 million for the comparable 2008 period. Long-term debt (consisting of trust preferred securities and junior subordinated notes) is measured based upon an analysis prepared by the Company, which considers the Company's own credit risk, including consideration of recent settlements with trust preferred debt holders and discounted cash flow analysis of junior subordinated notes. During the three months ended September 30, 2008, the Company recorded a $10.5 million change in the fair value of long-term debt associated with decreases in estimated market pricing and anticipated settlements of the Company's trust preferred securities.
Mortgage and real estate services fees. During the first quarter of 2009, the Company initiated various mortgage and real estate fee-based businesses. Revenues generated from these businesses are primarily from the Company's long-term mortgage portfolio. For the three months ended September 30, 2009, mortgage and real estate services fees, which primarily include loan modification fees and monitoring and surveillance services fees, were $13.5 million compared to $2.9 million in monitoring fees in the comparable 2008 period.
Changes in Non-Interest Income
| |
For the Nine Months Ended September 30, | |||||||||||||
|---|---|---|---|---|---|---|---|---|---|---|---|---|---|---|
| |
2009 | 2008 | Increase (Decrease) |
% Change |
||||||||||
Change in fair value of net trust assets, excluding REO |
$ | 234,167 | $ | 145 | $ | 234,022 | 161,394 | % | ||||||
Losses from real estate owned |
(218,083 | ) | (24,771 | ) | (193,312 | ) | (780 | ) | ||||||
Non-interest income—net trust assets |
16,084 | (24,626 | ) | 40,710 | 165 | |||||||||
Change in fair value of long-term debt |
682 | 5,473 | (4,791 | ) | (88 | ) | ||||||||
Real estate advisory fees |
— | 15,581 | (15,581 | ) | (100 | ) | ||||||||
Mortgage and real estate services fees |
32,296 | 7,078 | 25,218 | 356 | ||||||||||
Other |
(333 | ) | (1,791 | ) | 1,458 | 81 | ||||||||
Total non-interest income |
$ | 48,729 | $ | 1,715 | $ | 47,014 | 2,741 | % | ||||||
56
Non-interest income—net trust assets. Since our consolidated and unconsolidated securitization trusts are nonrecourse to the Company, our economic risk is limited to our residual interests in these securitization trusts. To better understand the economics on our residual interests in securitizations, it is necessary to consider the net effect of changes in fair value of net trust assets and losses from real estate owned. All estimated future losses are included in the estimate of the fair value of securitized mortgage collateral and REO. Losses on REO are reported separately in the consolidated statement of operations as REO is a nonfinancial asset which is the only component of trust assets and liabilities that is not recorded at fair value. Therefore, REO value at the time of sale or losses from further write-downs are recorded separately in the Company's consolidated statement of operations. The net effect of changes in value related to our investment in all trust assets and trust liabilities is shown as non-interest income—net trust assets, which includes losses from real estate owned. Non-interest income related to our net trust assets (residual interests in securitizations) was $16.1 million for the nine months ended September 30, 2009, compared to $(24.6) million in the comparable 2008 period. The $16.1 million gain on net trust assets was primarily attributable to the adoption of FSP 157-4, which clarified the use of quoted prices in determining fair values in markets that are inactive, thus moderating the need to use distressed prices in valuing financial assets and liabilities in illiquid markets as the Company had used in prior periods. Also contributing to the gain was increased expected net interest spread as a result of a downward shift in the forward Libor curve during the nine months ended September 30, 2009. Offsetting these gains were declines in fair value resulting from the Company increasing its loss assumptions for its long-term mortgage portfolio due to the increase in expected defaults and loss severities related to the weak economy and housing market. The individual components of the non-interest income from net trust assets were comprised of:
Change in fair value of net trust assets, excluding REO. For the nine months ended September 30, 2009, the Company recognized a $234.2 million gain from the change in fair value of net trust assets, excluding REO. The net gain recognized during the period was comprised of gains resulting from the increase in fair value of investment securities-for-sale and reduction in the fair value of securitized mortgage borrowings of $2.9 million and $313.8 million, respectively. Offsetting these gains were losses from the reduction in the fair value of securitized mortgage collateral and increase in the fair value of net derivative liabilities of $33.8 million and $48.7 million, respectively.
For the nine months ended September 30, 2008, the Company recognized a $145 thousand gain from the change in fair value of net trust assets, excluding REO. This gain was comprised of losses resulting from the reductions in the fair value of investment securities available-for-sale, securitized mortgage collateral and derivative instruments of $8.9 million, $5.6 billion and $94.4 million, respectively. Offsetting these losses were gains from reductions in the fair value of securitized mortgage borrowings of $5.7 billion.
Losses from real estate owned. Losses from real estate owned were $218.1 million for the nine months ended September 30, 2009. This loss was comprised of a $100.2 million loss on sale of real estate owned, coupled with $117.9 million in additional impairment write-downs during the period. During the first nine months of 2009, loss severities resulting from liquidations in areas where we have high concentration of foreclosed properties (such as California and Florida) have continued to increase significantly over previous periods as a result of continued deterioration in the U.S. economy and real estate markets. These continued declines in housing prices have resulted in liquidations of foreclosed assets at prices below expected levels as well as additional impairment write-downs of REO since foreclosure.
Losses from real estate owned were $24.8 million for the nine months ended September 30, 2008, comprised of $4.9 million in losses from the sale of real estate owned and $19.9 million in additional impairment write-downs.
57
Change in the fair value of long-term debt. Change in the fair value of long-term debt was a gain of $682 thousand for the nine months ended September 30, 2009, compared to $5.5 million for the comparable 2008 period. Long-term debt (consisting of trust preferred securities and junior subordinated notes) is measured based upon an analysis prepared by the Company, which considers the Company's own credit risk, including consideration of recent settlements with trust preferred debt holders and discounted cash flow analysis of junior subordinated notes. During the nine months ended September 30, 2008, the Company recorded a $5.5 million change in the fair value of long-term debt associated with decreases in estimated market pricing and anticipated settlements of the Company's trust preferred securities.
Mortgage and real estate services fees. During the first quarter of 2009, the Company initiated various mortgage and real estate fee-based businesses. Revenues generated from these businesses are primarily from the Company's long-term mortgage portfolio. For the nine months ended September 30, 2009, mortgage and real estate services fees, which primarily include loan modification fees and monitoring and surveillance services fees, were $32.3 million compared to $7.1 million in monitoring fees in the comparable 2008 period.
Non-Interest Expense
Changes in Non-Interest Expense
| |
For the Three Months Ended September 30, | ||||||||||||
|---|---|---|---|---|---|---|---|---|---|---|---|---|---|
| |
2009 | 2008 | Increase (Decrease) |
% Change |
|||||||||
General and administrative |
$ | 4,603 | $ | 4,951 | $ | (348 | ) | (7 | )% | ||||
Personnel expense |
9,413 | 2,382 | 7,031 | 295 | |||||||||
Total operating expense |
$ | 14,016 | $ | 7,333 | $ | 6,683 | 91 | % | |||||
Total non-interest expense was $14.0 million for the three months ended September 30, 2009, compared to $7.3 million for the comparable period of 2008. The $6.7 million increase in non-interest expense was primarily attributable to a $7.0 million increase in personnel expense over the previous period. The increase in personnel expense is attributable to increases in personnel and related costs associated with the initiation of our new mortgage and real estate fee-based businesses.
| |
For the Nine Months Ended September 30, | ||||||||||||
|---|---|---|---|---|---|---|---|---|---|---|---|---|---|
| |
2009 | 2008 | Increase (Decrease) |
% Change |
|||||||||
General and administrative |
$ | 15,053 | $ | 13,864 | $ | 1,189 | 9 | % | |||||
Personnel expense |
26,050 | 7,531 | 18,519 | 246 | |||||||||
Total operating expense |
$ | 41,103 | $ | 21,395 | $ | 19,708 | 92 | % | |||||
Total non-interest expense was $41.1 million for the nine months ended September 30, 2009, compared to $21.4 million for the comparable period of 2008. The $19.7 million increase in non-interest expense was primarily attributable to an $18.5 million increase in personnel expenses over the previous period. The increase in personnel expense is attributable to increases in personnel and related costs associated with the initiation of our new mortgage and real estate fee-based businesses. Additionally, in April 2009, certain of the Company's officers and directors gave notice of the surrender of an aggregate of 581,000 options and the Board accepted and approved the cancellation of those listed options. In connection with the cancellation of these options, the Company recognized non-cash compensation expense of approximately $1.7 million during the second quarter.
58
Results of Operations by Business Segment
Mortgage and Real Estate Services
During the first quarter of 2009, the Company initiated various mortgage and real estate fee-based businesses, including loan modifications, real estate disposition, monitoring and surveillance services, real estate brokerage and lending services and escrow services. Although the Company intends to generate fees by providing these services to third parties in the marketplace in the near future, the revenues from these businesses have primarily been generated from the Company's long-term mortgage portfolio. Furthermore, since these businesses are newly formed there remains uncertainty about their future success.
Condensed Statements of Operations Data
| |
For the Three Months Ended September 30, | |||||||||||||
|---|---|---|---|---|---|---|---|---|---|---|---|---|---|---|
| |
2009 | 2008 | Increase (Decrease) |
% Change |
||||||||||
Net interest income |
$ | 12 | $ | — | $ | 12 | N/A | % | ||||||
Mortgage and real estate services fees |
13,514 |
2,923 |
10,591 |
362 |
||||||||||
Other non-interest income |
(127 | ) | 333 | (460 | ) | (138 | ) | |||||||
Total non-interest income |
13,387 | 3,256 | 10,131 | 311 | ||||||||||
Personnel expense |
6,996 |
293 |
6,703 |
2,288 |
||||||||||
Non-interest expense and income taxes |
1,598 | 148 | 1,450 | 980 | ||||||||||
Net earnings |
$ | 4,805 | $ | 2,815 | $ | 1,990 | 71 | % | ||||||
For the three months ended September 30, 2009, mortgage and real estate services fees were $13.5 million compared to $2.9 million in the comparable period for 2008. For the three months ended September 30, 2009, mortgage and real estate services fees primarily includes loan modification fees and monitoring and surveillance services fees generated primarily from the Company's long-term mortgage portfolio. In 2008, mortgage and real estate services fees represented monitoring fees from the Company's long-term mortgage portfolio.
For the three months ended September 30, 2009, personnel expense increased $6.7 million to $7.0 million as a result of increases in personnel and related costs associated with the initiation of the new mortgage and real estate fee-based businesses.
For the three months ended September 30, 2009, non-interest expense and income taxes increased $1.5 million to $1.6 million. The increase is related to higher occupancy and general and administrative expenses associated with the new mortgage and real estate fee-based businesses.
| |
For the Nine Months Ended September 30, | |||||||||||||
|---|---|---|---|---|---|---|---|---|---|---|---|---|---|---|
| |
2009 | 2008 | Increase (Decrease) |
% Change |
||||||||||
Net interest income (expense) |
$ | 5 | $ | (5 | ) | $ | 10 | 200 | % | |||||
Mortgage and real estate services fees |
32,296 |
7,078 |
25,218 |
356 |
||||||||||
Other non-interest income |
(312 | ) | 345 | (657 | ) | (190 | ) | |||||||
Total non-interest income |
31,984 | 7,423 | 24,561 | 331 | ||||||||||
Personnel expense |
15,598 |
915 |
14,683 |
1,605 |
||||||||||
Non-interest expense and income taxes |
4,561 | 393 | 4,168 | 1,061 | ||||||||||
Net earnings |
$ | 11,830 | $ | 6,110 | $ | 5,720 | 94 | % | ||||||
59
For the nine months ended September 30, 2009, mortgage and real estate services fees were $32.3 million compared to $7.1 million in the comparable period for 2008. For the nine months ended September 30, 2009, mortgage and real estate services fees primarily includes loan modification fees and monitoring and surveillance services fees generated primarily from the Company's long-term mortgage portfolio. In 2008, mortgage and real estate services fees represented monitoring fees from the Company's long-term mortgage portfolio.
For the nine months ended September 30, 2009, personnel expense increased $14.7 million to $15.6 million as a result of increases in personnel and related costs associated with the initiation of the new mortgage and real estate fee-based businesses.
For the nine months ended September 30, 2009, non-interest expense and income taxes increased $4.2 million to $4.6 million. The increase is related to higher occupancy and general and administrative expenses associated with the new mortgage and real estate fee-based businesses.
Long-term Portfolio
Condensed Statements of Operations Data
| |
For the Three Months Ended September 30, | ||||||||||||||
|---|---|---|---|---|---|---|---|---|---|---|---|---|---|---|---|
| |
2009 | 2008 | Increase (Decrease) |
% Change |
|||||||||||
Net interest income |
$ | 1,894 | $ | 3,014 | $ | (1,120 | ) | (37 | )% | ||||||
Change in fair value of net trust assets, excluding REO |
46,325 |
7,778 |
38,547 |
496 |
|||||||||||
Losses from real estate owned |
(43,160 | ) | (15,685 | ) | (27,475 | ) | (175 | ) | |||||||
Non-interest income—net trust assets |
3,165 | (7,907 | ) | 11,072 | 140 | ||||||||||
Change in fair value of long-term debt |
341 | 10,494 | (10,153 | ) | (97 | ) | |||||||||
Other non-interest income |
20 | 5,630 | (5,610 | ) | (100 | ) | |||||||||
Total non-interest income |
3,526 | 8,217 | (4,691 | ) | (57 | ) | |||||||||
Personnel expense |
2,417 |
2,089 |
328 |
16 |
|||||||||||
Non-interest expense and income taxes |
3,005 | 10,056 | (7,051 | ) | (70 | ) | |||||||||
Net loss |
$ | (2 | ) | $ | (914 | ) | $ | 912 | 100 | % | |||||
Net loss for the three months ended September 30, 2009 decreased $0.9 million to $2 thousand, compared to a loss of $0.9 million for the comparable period of 2008. This decrease in net loss is primarily attributable to a $4.7 million decrease in non-interest income, offset by a $7.1 million reduction in non-interest expense and income taxes.
Non-interest income from net trust assets increased $11.1 million to a $3.2 million gain in the three months ended September 30, 2009, compared to a loss of $7.9 million for the comparable period in 2008. The increase in the fair value of net trust assets was primarily due to increased expected net interest spread as a result of a downward shift in the forward Libor curve during the three months ended September 30, 2009. Offsetting the positive changes in fair value related to trust assets was a $10.2 million reduction in change in fair value of long-term debt, which was attributable to reductions in fair value as a result of decreases in estimated market pricing and anticipated settlements of the Company's trust preferred securities during the quarter ended September 30, 2008.
Other non-interest income decreased $5.6 million during the three months ended September 30, 2009 to $20 thousand from $5.6 million. The decrease is attributed to the elimination of real estate advisory fees that were terminated during the fourth quarter of 2008, for which the Company earned a $27.0 million fee for agreeing to terminate the relationship.
60
Non-interest expense and income taxes decreased $7.1 million during the three months ended September 30, 2009 to $3.0 million from $10.1 million. The decrease is primarily attributable to a $5.3 million reduction in income tax expense to zero as a result of no amortization or impairment of deferred charge during the three months ended September 30, 2009, as compared to the same period in 2008. Additionally, legal and professional fees decreased $1.0 million during the quarter to $0.5 million.
| |
For the Nine Months Ended September 30, | ||||||||||||||
|---|---|---|---|---|---|---|---|---|---|---|---|---|---|---|---|
| |
2009 | 2008 | Increase (Decrease) |
% Change |
|||||||||||
Net interest income |
$ | 8,496 | $ | 14,624 | $ | (6,128 | ) | (42 | )% | ||||||
Change in fair value of net trust assets, excluding REO |
234,167 |
145 |
234,022 |
161,394 |
|||||||||||
Losses from real estate owned |
(218,083 | ) | (24,771 | ) | (193,312 | ) | (780 | ) | |||||||
Non-interest income—net trust assets |
16,084 | (24,626 | ) | 40,710 | 165 | ||||||||||
Change in fair value of long-term debt |
682 | 5,473 | (4,791 | ) | (88 | ) | |||||||||
Other non-interest income |
(21 | ) | 13,445 | (13,466 | ) | (100 | ) | ||||||||
Total non-interest income |
16,745 | (5,708 | ) | 22,453 | 393 | ||||||||||
Personnel expense |
10,452 |
6,616 |
3,836 |
58 |
|||||||||||
Non-interest expense and income taxes |
12,510 | 27,451 | (14,941 | ) | (54 | ) | |||||||||
Net earnings (loss) |
$ | 2,279 | $ | (25,151 | ) | $ | 27,430 | 109 | % | ||||||
Net earnings for the nine months ended September 30, 2009 increased $27.4 million to $2.3 million, compared to a net loss of $25.2 million for the comparable period of 2008. This increase in net loss is primarily attributable to a $22.5 million increase in non-interest income during the period, coupled with reductions in non-interest expense and income taxes of $14.9 million.
Non-interest income from net trust assets increased $40.7 million to a $16.1 million gain for the nine months ended September 30, 2009, compared to a loss of $24.6 million for the comparable period in 2008. The increase in the fair value of net trust assets was primarily due to the adoption of FSP 157-4, which clarified the use of quoted prices in determining fair values in markets that are inactive, thus moderating the need to use distressed prices in valuing financial assets and liabilities in illiquid markets as the Company had used in prior periods. The increase in fair value was offset by increased loss assumptions and reductions in principal balances during the period. Offsetting the positive changes in fair value related to trust assets was a $4.8 million reduction in change in fair value of long-term debt which was attributable to reductions in fair value as a result of decreases in estimated market pricing and anticipated settlements of the Company's trust preferred securities during the nine months ended September 30, 2008.
Other non-interest income decreased $13.5 million during the nine months ended September 30, 2009 to $(21) thousand from $13.4 million. The decrease is attributable to the elimination of real estate advisory fees that were terminated during the fourth quarter of 2008, for which the Company earned a $27.0 million fee for agreeing to terminate the relationship.
Non-interest expense decreased $14.9 million during the nine months ended September 30, 2009 to $12.5 million from $27.5 million. The decrease is primarily attributable to a $12.0 million reduction in income tax expense to $2.0 million as a result of reductions in amortization of deferred charge during the nine months ended September 30, 2009. Additionally, legal and professional fees decreased $2.0 million during the period to $2.3 million.
61
Discontinued Operations
Condensed Statements of Operations Data
| |
For the Three Months Ended September 30, | |||||||||||||
|---|---|---|---|---|---|---|---|---|---|---|---|---|---|---|
| |
2009 | 2008 | Increase (Decrease) |
% Change |
||||||||||
Net interest income |
$ | 834 | $ | 158 | $ | 676 | 428 | % | ||||||
Loss on sale of loans |
(756 |
) |
(12,279 |
) |
11,523 |
94 |
||||||||
Provision for repurchases |
(1,107 | ) | (1,060 | ) | (47 | ) | (4 | ) | ||||||
Other non-interest income |
(285 | ) | 339 | (624 | ) | (184 | ) | |||||||
Total non-interest income |
(2,148 | ) | (13,000 | ) | 10,852 | 83 | ||||||||
Personnel expense |
27 |
3,979 |
(3,952 |
) |
(99 |
) |
||||||||
Non-interest expense and income taxes |
435 | 1,300 | (865 | ) | (67 | ) | ||||||||
Net loss |
$ | (1,776 | ) | $ | (18,121 | ) | $ | 16,345 | 90 | % | ||||
Net loss for the discontinued operations was $1.8 million for the three months ended September 30, 2009, compared to $18.1 million for the comparable period in 2008. Net interest income increased $0.7 million to $0.8 million as a result of reductions in overall interest expense resulting from the exchange of $51.3 million in trust preferred securities for $62.0 million in junior subordinated notes in May 2009, which reduced the interest rates through 2017. Loss on sale of loans decreased $11.5 million to $0.8 million as a result of reduced sale activity between periods. Other non-interest income decreased $0.6 million during the quarter to $0.3 million. The decrease in other non-interest income was primarily the result of a $0.3 million increase in losses on real estate owned and reduction in other income of $0.4 million. The $3.9 million decrease in personnel expense during the three months ended September 30, 2009 over the comparable period was a result of reduced expenses associated with the discontinuation of the Company's non-conforming mortgage, retail mortgage, warehouse lending and commercial operations. The $0.9 million decrease in non-interest expense and income taxes is primarily attributable to reductions in overall operating expenses, such as occupancy and general and administrative expenses, in connection with the discontinuation of the operations.
| |
For the Nine Months Ended September 30, | |||||||||||||
|---|---|---|---|---|---|---|---|---|---|---|---|---|---|---|
| |
2009 | 2008 | Increase (Decrease) |
% Change |
||||||||||
Net interest (expense) income |
$ | (244 | ) | $ | 3,372 | $ | (3,616 | ) | (107 | )% | ||||
Loss on sale of loans |
(8,767 |
) |
(20,990 |
) |
12,223 |
58 |
||||||||
Recovery for repurchases |
68 | 7,375 | (7,307 | ) | (99 | ) | ||||||||
Other non-interest income |
(2,229 | ) | 1,594 | (3,823 | ) | (240 | ) | |||||||
Total non-interest income |
(10,928 | ) | (12,021 | ) | 1,093 | 9 | ||||||||
Personnel expense |
532 |
12,953 |
(12,421 |
) |
(96 |
) |
||||||||
Non-interest expense and income taxes |
(3,338 | ) | 6,879 | (10,217 | ) | (149 | ) | |||||||
Net loss |
$ | (8,366 | ) | $ | (28,481 | ) | $ | 20,115 | 71 | % | ||||
Net loss for discontinued operations was $8.4 million for the nine months ended September 30, 2009, compared to $28.5 million for the comparable period in 2008. Net interest income decreased $3.6 million to net interest expense of $0.2 million as a result of deterioration in loans held for sale and the resulting decreases in interest income. Loss on sale of loans decreased $12.2 million to $8.8 million as a result of reduced sale activity between periods. Recovery for repurchases decreased $7.3 million to $68 thousand for the nine months ended September 30, 2009, compared to $7.4 million in the
62
comparable period of 2008. The $7.3 million decrease is the result of changes in estimated repurchase obligations between periods, primarily related to favorable settlements of repurchase obligation during the first nine months of 2008. Other non-interest income decreased $3.8 million during the quarter to $(2.2) million. The decrease in other non-interest income was primarily the result of a $3.4 million increase in losses on real estate owned, resulting from losses on the sale of REO and additional impairment write-downs based on changes in estimated values of the REO. The $12.4 million decrease in personnel expense during the nine months ended September 30, 2009 over the comparable period was a result of reduced expenses associated with the discontinuation of the Company's non-conforming mortgage, retail mortgage, warehouse lending and commercial operations. As a result of the discontinuation of certain operations, non-interest expense and income taxes decreased $10.2 million between periods primarily due to reductions of $4.6 million in occupancy expense resulting from both from the discontinuation of operations and changes in estimated lease liabilities as a result of changes in our expected minimum future lease payments. Additionally, there were reductions of $3.3 million in legal and professional expense and $2.7 million in general and administrative expenses.
ITEM 3: QUANTITATIVE AND QUALITATIVE DISCLOSURES ABOUT MARKET RISK
For quantitative and qualitative disclosures about market risk, see Item 7A, "Quantitative and Qualitative Disclosures About Market Risk," included in our annual report on Form 10-K for the year ended December 31, 2008. Our exposures to market risks have not changed materially since December 31, 2008.
ITEM 4: CONTROLS AND PROCEDURES
Evaluation of Disclosure Controls and Procedures
The Company maintains disclosure controls and procedures (as defined in the Securities Exchange Act of 1934 Rules 13a-15(e) or 15d-15(e)) designed to ensure that information required to be disclosed in reports filed or submitted under the Securities Exchange Act of 1934, as amended, is recorded, processed, summarized and reported within the time periods specified in the SEC's rules and forms. Disclosure controls and procedures include, without limitation, controls and procedures designed to ensure that information required to be disclosed by the Company in its reports that it files or submits under the Exchange Act is accumulated and communicated to the Company's management, including its principal executive and principal financial officers, or persons performing similar functions, as appropriate to allow timely decisions regarding required disclosure.
As required by Rules 13a-15 and 15d-15 under the Exchange Act, in connection with the filing of this Quarterly Report on Form 10-Q, our management, under the supervision and with the participation of our CEO and CFO, conducted an evaluation of our disclosure controls and procedures, as such term is defined under Rule 13a-15(e). Based on that evaluation, the Company's chief executive officer and chief financial officer concluded that, as of that date, the Company's disclosure controls and procedures were effective at a reasonable assurance level.
Changes in Internal Control Over Financial Reporting
There has been no change in the Company's internal control over financial reporting during the Company's quarter ended September 30, 2009, that has materially affected, or is reasonably likely to materially affect, the Company's internal control over financial reporting.
63
In the matter of Sharon Page v. Impac Mortgage Holdings, Inc., et al, which was filed in the United States District Court, Central District of California and alleged breaches of fiduciary duties, conflicts of interest and fiduciary liability, a settlement was reached and confirmed by the Court. As part of the settlement, the Company agreed to (i) issue common stock to class members, (ii) make available to the class members free of charge investment training classes once per month for one year and (iii) pay certain attorneys fees. Pursuant to the settlement agreement, on October 27, 2009, the Company issued 80,000 shares of common stock.
On September 24, 2009, an action was filed in the United States district Court, Central district of California entitled Federal Deposit Insurance Corporation as Receiver for Indymac bank, F.S.B. v. Impac Funding Corporation as case No. CV09-6965 RC. The case claims damages for breach of contract based upon repurchase claims for loans sold to Indymac Bank. The action seeks $2.1 million in damages plus interest and attorneys fees.
Please refer to IMH's report on Form 10-K for the year ended December 31, 2008 for a description of other litigation and claims.
We believe that we have meritorious defenses to the above claims and intend to defend these claims vigorously and as such the Company believes the final outcome of such matters will not have a material adverse effect on our financial condition or results of operations. Nevertheless, litigation is uncertain and we may not prevail in the lawsuits and can express no opinion as to their ultimate resolution. An adverse judgment in any of these matters could have a material adverse effect on us.
Our Annual Report on Form 10-K for the year ended December 31, 2008 and our quarterly reports on Form 10-Q for the periods ended March 31, 2009 and June 30, 2009, include a detailed discussion of our risk factors.
ITEM 2: UNREGISTERED SALES OF EQUITY SECURITIES AND USE OF PROCEEDS
None.
ITEM 3: DEFAULTS UPON SENIOR SECURITIES
None.
ITEM 4: SUBMISSION OF MATTERS TO A VOTE OF SECURITY HOLDERS
Annual Meeting of Stockholders
On July 21, 2009, we held our annual meeting of stockholders. Of 7,618,146 shares eligible to vote, 6,423,162, or 84.3 percent, votes were returned, formulating a quorum. At the annual stockholders meeting, the following matter was submitted to stockholders for vote Proposal I—Election of Directors.
64
Proposal I—Election of Directors
The results of voting on these proposals are as follows:
Director
|
For | Withheld | Elected | |||||
|---|---|---|---|---|---|---|---|---|
Joseph R. Tomkinson |
5,701,251 | 721,911 | Yes | |||||
William S. Ashmore |
5,731,300 | 691,862 | Yes | |||||
James Walsh |
5,737,490 | 685,672 | Yes | |||||
Frank P. Filipps |
5,735,073 | 688,089 | Yes | |||||
Stephan R. Peers |
5,680,333 | 742,829 | Yes | |||||
Leigh J. Abrams |
5,721,130 | 702,032 | Yes | |||||
All directors were elected at our annual stockholders meeting.
Amendment to Declaration of Trust #4 and Supplement to Indenture
On July 14, 2009, the Company, Wilmington Trust Company, as institutional trustee, and holders of capital securities of Impac Capital Trust #4 ("Trust #4") entered into Amendment No. 1 to the Amended and Restated Declaration of Trust #4 dated October 18, 2005 in order to (a) allow for the surrender of (i) Capital Securities of Trust #4 held by the Company or any of its affiliates, and (ii) Common Securities of Trust #4 proportionate to the Capital Securities surrendered, and in exchange receive a principal amount of debentures equal to the respective liquidation amount of the Capital Securities and Common Securities so surrendered so that the principal amount of debentures so issued in exchange may then be surrendered to the trustee for cancellation; (b) allow the holder of the Common Securities or the obligor under the Indenture to purchase outstanding Capital Securities; and (c) terminate any right by the Company to defer interest payments on the Capital Securities of Trust #4.
On July 14, 2009, the Company and Wilmington Trust Company also entered into a First Supplemental Indenture to the Indenture dated October 18, 2005 to amend the Indenture to terminate the Company's right to defer interest payments on the debt securities.
The above information included in this Item 5 is provided in accordance with Item 1.01 of Form 8-K.
- (a)
- Exhibits:
| 31.1 | Certification of Chief Executive Officer pursuant to Item 601(b)(31) of Regulation S-K, as adopted pursuant to Section 302 of the Sarbanes-Oxley Act of 2002. | ||
31.2 |
Certification of Chief Financial Officer pursuant to Item 601(b)(31) of Regulation S-K, as adopted pursuant to Section 302 of the Sarbanes-Oxley Act of 2002. |
||
32.1 |
* |
Certifications of Chief Executive Officer and Chief Financial Officer pursuant to 18 U.S.C. Section 1350 as adopted pursuant to Section 906 of the Sarbanes-Oxley Act of 2002. |
- *
- This exhibit shall not be deemed "filed" for purposes of Section 18 of the Securities Exchange Act of 1934 or otherwise subject to the liabilities of that section, nor shall it be deemed incorporated by reference in any filing under the Securities Act of 1933 or the Securities Exchange Act of 1934, whether made before or after the date hereof and irrespective of any general incorporation language in any filings.
65
Pursuant to the requirements of the Securities Exchange Act of 1934, the Registrant has duly caused this report to be signed on its behalf by the undersigned, thereunto duly authorized.
| IMPAC MORTGAGE HOLDINGS, INC. | ||
/s/ TODD R. TAYLOR Todd R. Taylor Chief Financial Officer (authorized officer of registrant and principal financial officer) |
November 9, 2009
66