Attached files
| file | filename |
|---|---|
| 8-K - FORM 8-K - GARDNER DENVER INC | c54591e8vk.htm |
Exhibit 99.1

| Investor Presentation November 2009 The Gardner Denver Way |

| All of the statements made by Gardner Denver in this presentation or made orally in connection with it, other than historical facts, are forward- looking statements. As a general matter, forward-looking statements are those focused upon anticipated events or trends, expectations, and beliefs relating to matters that are not historical in nature. The Private Securities Litigation Reform Act of 1995 provides a "safe harbor" for these forward-looking statements. In order to comply with the terms of the safe harbor, the Company notes that forward-looking statements are subject to known and unknown risks, uncertainties, and other factors relating to the Company's operations and business environment, all of which are difficult to predict and many of which are beyond the control of the Company. These known and unknown risks, uncertainties, and other factors could cause actual results to differ materially from those matters expressed in, anticipated by or implied by such forward-looking statements. Factors that could cause or contribute to such differences include, but are not limited to: changing economic conditions; pricing of the Company's products and other competitive market pressures; the costs and availability of raw materials; fluctuations in foreign currency rates and energy prices; risks associated with the Company's current and future litigation; and the other risks detailed from time to time in the Company's SEC filings, including but not limited to, its annual report on Form 10-K for the fiscal year ending December 31, 2008, and its quarterly reports on Form 10-Q. These statements reflect the current views and assumptions of management with respect to future events. The Company does not undertake, and hereby disclaims, any duty to update these forward-looking statements, although its situation and circumstances may change in the future. The inclusion of any statement in this presentation does not constitute admission by the Company or any other person that the events or circumstances described in such statement are material. Safe Harbor Disclosure |

| A G E N D A Building The New Gardner Denver Transforming the Company Operational Excellence 1 Execution Update Execution Update 2 3 Future Growth |
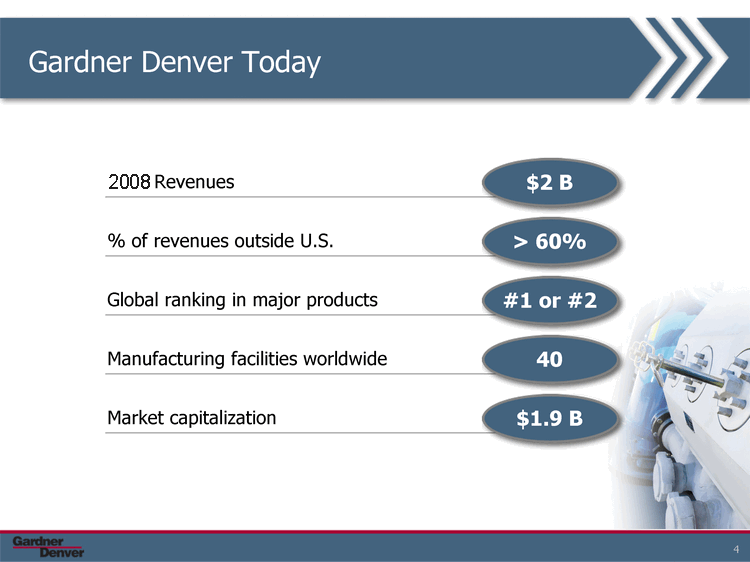
| Gardner Denver Today Revenues $2 B % of revenues outside U.S. > 60% Global ranking in major products #1 or #2 Manufacturing facilities worldwide 40 Market capitalization $1.9 B |

| IN THE PAST Successful Acquisition-Driven Growth Strategy... (Actual Revenues $M) 99 00 01 02 03 04 05 06 07 08 United States 232.7 272.2 291.9 264.5 253.6 327.6 495.3 695.2 765 747.9 Europe 49.6 53.9 65.5 85.7 97.2 237.8 418.2 601.8 669.1 760.8 Asia 6.9 13.7 14.1 26 40 93.1 167.3 191.8 246 292.8 Other 37.9 39.6 48.3 42 48.7 81.1 133.8 180.4 188.7 216.8 Other Asia Europe US |

| United States Europe Asia Canada Latin America Other 747.9 760.8 292.8 54.5 98.6 63.7 Built a Well-Diversified Business Industrial Manufacturing Downstream Energy Upstream Energy Transportation Medical Mining and Construction Chemical Environment Food and Beverage Printing Paper Other 0.29 0.13 0.09 0.09 0.07 0.06 0.06 0.04 0.04 0.03 0.03 0.06 Revenues By Industries Served (2) Revenues By Geography (2) No customer >4% of revenues United States 37% Europe 38% Asia 14% Canada 3% Latin America 5% Other 3% (2) See note on slide 33 Industrial Manufacturing 30% Downstream Energy 13% Upstream Energy 9% Transportation 9% Medical 7% Mining and Construction 6% Chemical 6% Environment 4% Food and Beverage 4% Printing 3% Paper 3% Other 6% |

| Economic Indicator Outlook Today Market Outlook Snapshot U.S. Industrial Production E.U. Industrial Production Oil and gas capex China growth Rig count OEM applications Stable to positive Stable to positive Stable with some opportunities Positive Stable Stable to positive Six months ago |

| REALIGNED OPERATIONS IN 2009: Two Focused Operating Segments Industrial Products Group 57% of revenues Engineered Products Group Segment Key Products Top Industries Served Compressors (>50 psi) Blowers (<50 psi, vacuum) Manufacturing Transportation Mining / Construction Energy Reciprocating pumps Liquid ring pumps Loading arms OEM compressors and pumps Energy Manufacturing Medical Chemical 43% revenues Revenues for nine months ending September 30, 2009 |

| Conditions Right for a Transformation Last 10 years primary focus on external growth 22 acquisitions Significant integration, rationalization and margin expansion opportunities New CEO in 2008 Expertise in operational excellence Economic slowdown Added impetus Conditions right for transformation |
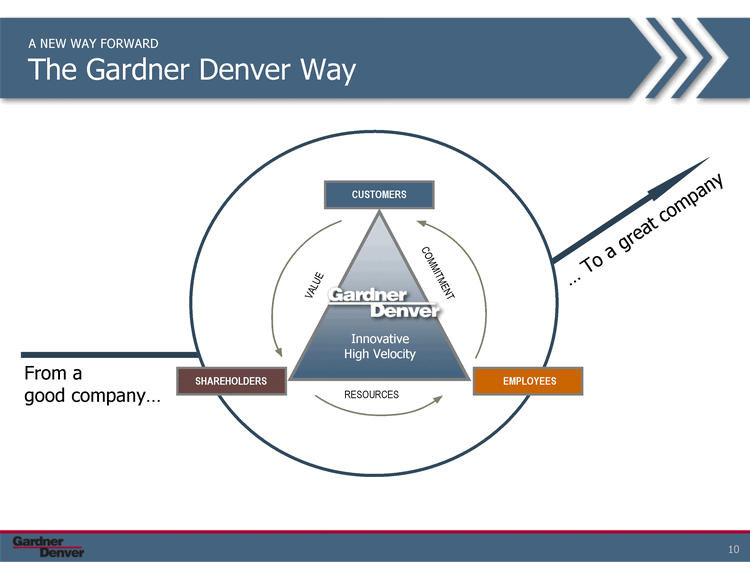
| A NEW WAY FORWARD The Gardner Denver Way From a good company... ... To a great company CUSTOMERS SHAREHOLDERS EMPLOYEES Innovative High Velocity VALUE COMMITMENT RESOURCES |

| Our Vision for The New Gardner Denver Greater organic growth Operational excellence Improved profitability and cash flow Improved return on invested capital CUSTOMERS SHAREHOLDERS EMPLOYEES Innovative High Velocity VALUE COMMITMENT RESOURCES |

| A G E N D A Building The New Gardner Denver Transforming the Company The Gardner Denver Way 1 Execution Update Execution Update 2 Future Growth 3 |

| Priorities to Transform Gardner Denver Improve margins Streamline global footprint Reduce material costs Improve productivity Expand Cash Flow Accelerate inventory turns to 7-8X Targeted capital spending Divest excess assets Underpinned by operational excellence The new Gardner Denver |

| #1 IMPROVE MARGINS Major Restructuring Projects Moving Forward 4Q09 2010 Completed Completion Completion CompAir administration integration Salaried staff reductions Facility rationalizations Hanover, MD Louisville, KY Piqua, OH Tulsa, OK Assembly Gloucester, UK Puchheim, Germany Sheboygan, WI Implement SAP / SAP Business One Reduce annual costs by $70 million 5 6 10 Ocala, FL |

| Before After East 128500 67000 #1 IMPROVE MARGINS Case Study: Rationalization in Germany Merging Puchheim, Germany plant into Memmingen facility Created efficient cells 108 manpower reduction 22% inventory reduction 48% reduction in manufacturing floor space (sq. ft.) Puchheim Memmingen |

| #1 IMPROVE MARGINS Delivering Significant Cost Savings Annual Savings Expected 2009 2010 Future years 2007 East 40 65 70 40 West 30.6 38.6 34.6 31.6 North 45.9 46.9 45 43.9 Investing $75M to realize these savings Reduced manpower by 1,600 or 20% |

| #1 IMPROVE MARGINS Increase Engineered Products Group Trough Margins 200 BPS Adjusted Operating Margins (1) Peak Trough New Trough Q309 East 0.245 0.13 0.15 0.178 Closing 3 facilities Reduced material costs Ongoing operational improvements Despite revenue decline of 20-25% (1) See note on slide 33 |

| #1 IMPROVE MARGINS Expand Margins in Industrial Products Group Adjusted Operating Margins (1) 2007 2008 Q109 Q209 Q309 2014 Goal East 0.103 0.088 0.018 0.023 0.067 0.14 Goal: "14 x 14" Integrated CompAir Closing 5 facilities Reduced material costs Ongoing operational improvements (1) See note on slide 33 |

| #2 EXPAND CASH FLOW Strong Balance Sheet and Growing Free Cash Flow Excellent liquidity $109.7M cash $290.1M unused credit Debt to total capitalization of 29% Upgraded from "BB-" to "BB" Strong Balance Sheet (September 30, 2009) Growing Free Cash Flow * 2004 2005 2006 2007 2008 East 20 36 41 48 41 West 76 115 167 182 277 North 45.9 46.9 45 43.9 Capex Free cash flow $M Cash Flow Free cash flow $175M LTM Free cash flow >220% adjusted net income (1) 3Q09 and nearly 200% YTD * Free cash flow is defined as "cash flow provided by operating activities, less capital expenditures." (1) See note on slide 33 |

| IN SUMMARY Gardner Denver Remains Solidly Profitable ... Despite Economic Headwinds 2008 2009 E East 2 1.66 Revenues ($M) 2008 2009 E East 3.54 2.32 Adjusted DEPS (1) ($) Transformation will lead to new peak earnings $1.7B-$1.8B (1) See note on slide 33 |

| A G E N D A Building The New Gardner Denver Transforming the Company The Gardner Denver Way 1 Future Growth Execution Update Future Growth 3 Execution Update 2 |

| Powerful New Culture Will Drive Growth Product focus Medium innovation Primary growth Acquisitions Top down culture Profitable Customer focus High innovation Balanced growth Organic and acquisitions Inclusive culture Highly profitable Past Future |

| Five Point Growth Strategy 5. Margin improvement 4. Selective acquisitions 3. Innovative products 2. Aftermarket growth 1. Organic growth |
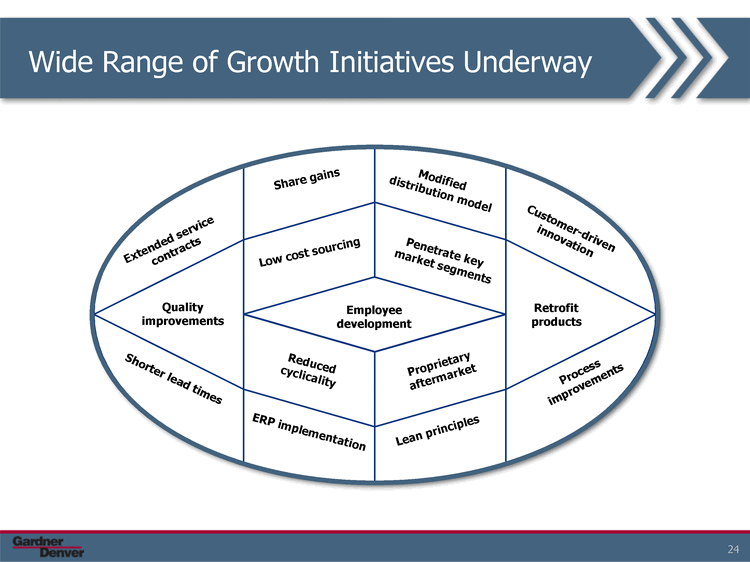
| Quality improvements Extended service contracts Shorter lead times Share gains Low cost sourcing Employee development Reduced cyclicality ERP implementation Modified distribution model Penetrate key market segments Proprietary aftermarket Lean principles Customer-driven innovation Retrofit products Process improvements Wide Range of Growth Initiatives Underway |

| Lean principles ERP implementation Proprietary aftermarket Employee development Low cost sourcing Penetrate key market segments Quality improvements Share gains Modified distribution model Extended service contracts Customer-driven innovation Shorter lead times Retrofit products Process improvements Building The New Gardner Denver |

| A CLOSER LOOK AT GROWTH INITIATIVES Innovative Products: Quantima Case Study Product CompAir Quantima Compressor Innovations No gear box, no oil, no mechanical bearings, no friction The customer Murray Goulburn Co-operative Co. Ltd. Results Energy use a 35% Service cost a 64% Annualized savings of 187K AUD in energy and maintenance costs CO2 emissions a 2,577 metric tons annually |

| A CLOSER LOOK AT GROWTH INITIATIVES Growth Potential in Aftermarket Broaden direct service capabilities Enhance product offering Design in proprietary features Higher margin revenue growth Sales Sales Today 78 22 20-25% Aftermarket Today Sales Sales Today 60 40 40-45% Aftermarket 3-5 years (% of total sales) |

| A CLOSER LOOK AT GROWTH INITIATIVES After Market Growth: Vacuum Pumps Case Study Existing Product Nash CL has a large installed base Recognized reliability Product design leads to durability in harsh environments Requires a constant flow of liquid to operate ECO-FLOTM Technology Developed New, innovative, upgraded internal design Reduces customers' costs and environmental impact Up to 50% less liquid usage Opportunity Potential to retrofit 20,000 CL pumps installed globally |

| RESULTS WE EXPECT Driving >$120M Operating Margin Expansion With Zero Top Line Growth Industrial Products Group Adjusted Operating Margin (1) 1H 2009 Goal 2014 East 2 2 6 10 14 4 4 4 Restructuring Productivity Sourcing "14 by 14" Impact Adds $120-$125 million to operating income Adds $1.62-$1.68 to DEPS 2.0% 1/3 1/3 1/3 14% See slide 34 for additional information |

| Gardner Denver 3-5 years out Higher margins in both segments Aftermarket growth reduces revenue cyclicality Expanded share in target markets served Inventory turns improve 2-3 times Higher ROIC Balanced growth - organic and acquisitions |

| Why Invest in Gardner Denver Leading position in served market segments Multi-year profit improvement program ahead Delivering > $120 M margin improvements with zero top line growth Building a new, high performance company |

| Investor Presentation November 2009 The Gardner Denver Way |
| Presentation Notes Note 1: Adjusted Operating Income, Adjusted Operating Margins, Adjusted Net Income and Adjusted DEPS are financial measures that are not in accordance with US GAAP. Adjusted Operating Income, Adjusted Operating Margins and Adjusted DEPS excludes the net impact of expenses incurred for profit improvement initiatives, non- recurring items and impairment charges. Free cash flow adjusted net income is net income excluding non-cash impairment charges, net of related changes in deferred tax assets and liabilities. Gardner Denver believes the non-GAAP financial measure of Adjusted Operating Income, Adjusted Operating Margins, Adjusted Net Income and DEPS provides important supplemental information to both management and investors regarding financial and business trends used in assessing its results of operations. Gardner Denver believes excluding the specified items from the aforementioned financial measures provides a more meaningful comparison to the corresponding reported periods and internal budgets and forecasts, assists investors in performing analysis that is consistent with financial models developed by investors and research analysts, provides management with a more relevant measurement of operating performance, and is more useful in determining management compensation. Note 2: Company estimates Gardner Denver, Nash, CompAir and Quantima, and their related designs and logotypes, are trademarks and servicemarks of Gardner Denver, Inc. and its subsidiaries |

| Significant Operating Margin Improvement Opportunities The Company's long-term target of 14.0 percent operating margin in the IPG segment has the potential to yield approximately $1.63 in additional DEPS ($ in millions, except per share data) GDI Industrial Products Group 1H 2009 annualized segment revenues $1,017 1H 2009 annualized segment adjusted operating income (1) $20 As a percent of revenues (adjusted operating margin (1)) 2.0% Target IPG segment operating margin 14.0% Target IPG segment operating income, based on 2009 annualized revenues $142 Incremental operating income $122 Incremental after-tax earnings $85 Average Diluted Shares Outstanding on June 30, 2009 52.0 million Incremental DEPS impact of segment operating margin improvement to target $1.63 (1) See note on slide 33 |
