Attached files
UNITED
STATES
SECURITIES
AND EXCHANGE COMMISSION
Washington,
D. C. 20549
FORM
10-Q
(Mark
One)
x QUARTERLY
REPORT PURSUANT TO SECTION 13 OR 15(d) OF THE SECURITIES EXCHANGE ACT OF
1934
|
For
the quarterly period ended
|
September
30, 2009
|
OR
o TRANSITION
REPORT PURSUANT TO SECTION 13 OR 15(d) OF THE SECURITIES EXCHANGE ACT OF
1934
|
For
the transition period from
|
to
|
|
Commission
File Number
|
Registrant,
State of Incorporation
Address and Telephone
Number
|
IRS
Employer
Identification No.
|
|
0-30512
|
CH
Energy Group, Inc.
(Incorporated
in New York)
284
South Avenue
Poughkeepsie,
New York 12601-4839
(845)
452-2000
|
14-1804460
|
|
1-3268
|
Central
Hudson Gas & Electric Corporation
(Incorporated
in New York)
284
South Avenue
Poughkeepsie,
New York 12601-4839
(845)
452-2000
|
14-0555980
|
Indicate
by check mark whether the Registrants (1) have filed all reports required to be
filed by Section 13 or 15(d) of the Securities Exchange Act of 1934 during the
preceding 12 months (or for such shorter period that the Registrants were
required to file such reports), and (2) have been subject to such filing
requirements for the past 90 days.
Yes x No o
Indicate
by check mark CH Energy Group, Inc. has submitted electronically and posted on
its corporate Web site, if any, every Interactive Data File required to be
submitted and posted pursuant to Rule 405 of Regulation S-T (§232.405 of this
chapter) during the preceding 12 months (or for such shorter period that the
registrant was required to submit and post such files).
Yes o No o
Indicate
by check mark Central Hudson Gas & Electric Corporation has submitted
electronically and posted on its corporate Web site, if any, every Interactive
Data File required to be submitted and posted pursuant to Rule 405 of Regulation
S-T (§232.405 of this chapter) during the preceding 12 months (or for such
shorter period that the registrant was required to submit and post such
files).
Yes o No o
Indicate
by check mark whether CH Energy Group, Inc. is a large accelerated filer, an
accelerated filer, a non-accelerated filer, or a smaller reporting
company. See the definitions of “large accelerated filer,”
“accelerated filer” and “smaller reporting company” in Rule 12b-2 of the
Exchange Act. (Check one):
Large Accelerated Filer
o
Accelerated Filer x
Non-Accelerated
Filer o Smaller
Reporting Company o
Indicate
by check mark whether Central Hudson Gas & Electric Corporation is a large
accelerated filer, an accelerated filer, a non-accelerated filer, or a smaller
reporting company. See the definitions of “large accelerated filer,”
“accelerated filer” and “smaller reporting company” in Rule 12b-2 of the
Exchange Act. (Check one):
Large
Accelerated Filer o Accelerated
Filer o
Non-Accelerated Filer
x
Smaller Reporting
Company o
Indicate
by check mark whether CH Energy Group, Inc. is a shell company (as defined in
Rule 12b-2 of the Exchange Act):
Yes o No x
Indicate
by check mark whether Central Hudson Gas & Electric Corporation is a shell
company (as defined in Rule 12b-2 of the Exchange Act):
Yes o No x
As of the
close of business on October 30, 2009, (i) CH Energy Group, Inc. had outstanding
15,804,806 shares of Common Stock ($0.10 per share par value) and (ii) all of
the outstanding 16,862,087 shares of Common Stock ($5 per share par value) of
Central Hudson Gas & Electric Corporation were held by CH Energy Group,
Inc.
CENTRAL
HUDSON GAS & ELECTRIC CORPORATION MEETS THE CONDITIONS SET FORTH IN GENERAL
INSTRUCTIONS (H)(1)(a) AND (b) OF FORM 10-Q AND IS THEREFORE FILING THIS FORM
WITH THE REDUCED DISCLOSURE FORMAT PURSUANT TO GENERAL INSTRUCTIONS (H)(2)(a),
(b) AND (c).
TABLE OF
CONTENTS
|
PART
I – FINANCIAL INFORMATION
|
PAGE
|
|
|
ITEM
1 – FINANCIAL STATEMENTS (UNAUDITED)
|
||
|
CH
ENERGY GROUP, INC.
|
||
|
Consolidated
Statement of Income –
|
||
|
6
|
||
|
7
|
||
|
Consolidated
Statement of Comprehensive Income –
|
||
|
8
|
||
|
8
|
||
|
Nine
Months Ended September 30, 2009 and 2008
|
9
|
|
|
December
31, 2008 and September 30, 2008
|
10
|
|
|
Nine
Months Ended September 30, 2009 and 2008
|
12
|
|
|
CENTRAL HUDSON GAS & ELECTRIC
CORPORATION
|
||
|
Statement
of Income –
|
||
|
13
|
||
|
14
|
||
|
Statement
of Comprehensive Income –
|
||
|
15
|
||
|
15
|
||
|
Nine
Months Ended September 30, 2009 and 2008
|
16
|
|
|
December
31, 2008 and September 30, 2008
|
17
|
|
|
Nine
Months Ended September 30, 2009 and 2008
|
19
|
|
|
20
|
||
|
TABLE OF CONTENTS
|
||
|
PAGE
|
||
|
ITEM
2
|
67
|
|
|
ITEM
3
|
114
|
|
|
ITEM
4
|
114
|
|
|
PART II – OTHER INFORMATION
|
||
|
ITEM
1
|
115
|
|
|
ITEM
1A
|
115
|
|
|
ITEM
6
|
117
|
|
|
118
|
||
|
119
|
||
|
CERTIFICATIONS
|
123
|
|
_______________________________________________
Filing
Format
This
Quarterly Report on Form 10-Q is a combined quarterly report being filed by two
different registrants: CH Energy Group, Inc. (“CH Energy Group”) and
Central Hudson Gas & Electric Corporation (“Central Hudson”), a wholly owned
subsidiary of CH Energy Group. Except where the content clearly
indicates otherwise, any reference in this report to CH Energy Group includes
all subsidiaries of CH Energy Group, including Central
Hudson. Central Hudson makes no representation as to the information
contained in this report in relation to CH Energy Group and its subsidiaries
other than Central Hudson.
PART 1 – FINANCIAL
INFORMATION
ITEM 1 – FINANCIAL
STATEMENTS (UNAUDITED)
|
CH
ENERGY GROUP CONSOLIDATED STATEMENT OF INCOME
(UNAUDITED)
|
||||||||
|
(In
Thousands, except per share amounts)
|
||||||||
|
Three
Months Ended
|
||||||||
|
September 30,
|
||||||||
|
2009
|
2008
|
|||||||
|
Operating
Revenues
|
|
|
||||||
|
Electric
|
$ | 138,685 | $ | 179,001 | ||||
|
Natural
gas
|
16,243 | 21,773 | ||||||
|
Competitive
business subsidiaries:
|
||||||||
|
Petroleum
products
|
47,244 | 88,618 | ||||||
|
Other
|
11,473 | 11,395 | ||||||
|
Total
Operating Revenues
|
213,645 | 300,787 | ||||||
|
Operating
Expenses
|
||||||||
|
Operation:
|
||||||||
|
Purchased
electricity and fuel used in electric generation
|
61,379 | 116,900 | ||||||
|
Purchased
natural gas
|
5,798 | 13,405 | ||||||
|
Purchased
petroleum
|
40,258 | 82,002 | ||||||
|
Other
expenses of operation - regulated activities
|
50,311 | 39,247 | ||||||
|
Other
expenses of operation - competitive business subsidiaries
|
19,118 | 20,508 | ||||||
|
Depreciation
and amortization
|
10,277 | 9,713 | ||||||
|
Taxes,
other than income tax
|
10,228 | 9,634 | ||||||
|
Total
Operating Expenses
|
197,369 | 291,409 | ||||||
|
Operating
Income
|
16,276 | 9,378 | ||||||
|
Other
Income and Deductions
|
||||||||
|
(Loss)
income from unconsolidated affiliates
|
(75 | ) | 123 | |||||
|
Interest
on regulatory assets and investment income
|
1,218 | 1,339 | ||||||
|
Other
- net
|
(1,384 | ) | (41 | ) | ||||
|
Total
Other Income
|
(241 | ) | 1,421 | |||||
|
Interest
Charges
|
||||||||
|
Interest
on long-term debt
|
5,355 | 4,926 | ||||||
|
Interest
on regulatory liabilities and other interest
|
1,711 | 1,485 | ||||||
|
Total
Interest Charges
|
7,066 | 6,411 | ||||||
|
Income
before income taxes, non-controlling interest and preferred dividends
of subsidiary
|
8,969 | 4,388 | ||||||
|
Income
Taxes
|
3,327 | 1,193 | ||||||
|
Net
Income
|
5,642 | 3,195 | ||||||
|
Net
income attributable to non-controlling interest:
|
||||||||
|
Non-controlling
interest in subsidiary
|
48 | 68 | ||||||
|
Dividends
declared on Preferred Stock of subsidiary
|
242 | 242 | ||||||
|
Net
income attributable to CH Energy Group
|
5,352 | 2,885 | ||||||
|
Dividends
declared on Common Stock
|
8,535 | 8,523 | ||||||
|
Change
in Retained Earnings
|
$ | (3,183 | ) | $ | (5,638 | ) | ||
|
Common
Stock:
|
||||||||
|
Average
shares outstanding
|
||||||||
|
Basic
|
15,776 | 15,771 | ||||||
|
Diluted
|
15,854 | 15,819 | ||||||
|
Amounts
attributable to CH Energy Group common shareholders
|
||||||||
|
Earnings
per share
|
||||||||
|
Basic
|
$ | 0.34 | $ | 0.18 | ||||
|
Diluted
|
$ | 0.34 | $ | 0.18 | ||||
|
Dividends
Declared Per Share
|
$ | 0.54 | $ | 0.54 | ||||
The Notes to Financial Statements are
an integral part hereof.
|
CH
ENERGY GROUP CONSOLIDATED STATEMENT OF INCOME
(UNAUDITED)
|
||||||||
|
(In
Thousands, except per share amounts)
|
||||||||
|
Nine
Months Ended
|
||||||||
|
September 30,
|
||||||||
|
2009
|
2008
|
|||||||
|
Operating
Revenues
|
|
|
||||||
|
Electric
|
$ | 404,035 | $ | 468,659 | ||||
|
Natural
gas
|
137,422 | 142,267 | ||||||
|
Competitive
business subsidiaries:
|
||||||||
|
Petroleum
products
|
218,273 | 379,653 | ||||||
|
Other
|
32,618 | 33,653 | ||||||
|
Total
Operating Revenues
|
792,348 | 1,024,232 | ||||||
|
Operating
Expenses
|
||||||||
|
Operation:
|
||||||||
|
Purchased
electricity and fuel used in electric generation
|
205,014 | 291,675 | ||||||
|
Purchased
natural gas
|
89,924 | 98,008 | ||||||
|
Purchased
petroleum
|
167,198 | 334,982 | ||||||
|
Other
expenses of operation - regulated activities
|
141,022 | 123,414 | ||||||
|
Other
expenses of operation - competitive business subsidiaries
|
63,748 | 65,716 | ||||||
|
Depreciation
and amortization
|
30,561 | 28,722 | ||||||
|
Taxes,
other than income tax
|
29,966 | 28,425 | ||||||
|
Total
Operating Expenses
|
727,433 | 970,942 | ||||||
|
Operating
Income
|
64,915 | 53,290 | ||||||
|
Other
Income and Deductions
|
||||||||
|
Income
from unconsolidated affiliates
|
2 | 459 | ||||||
|
Interest
on regulatory assets and investment income
|
4,684 | 4,404 | ||||||
|
Reserve
for note receivable
|
(1,299 | ) | - | |||||
|
Other
- net
|
(3,744 | ) | (159 | ) | ||||
|
Total
Other Income
|
(357 | ) | 4,704 | |||||
|
Interest
Charges
|
||||||||
|
Interest
on long-term debt
|
15,229 | 15,064 | ||||||
|
Interest
on regulatory liabilities and other interest
|
4,575 | 4,116 | ||||||
|
Total
Interest Charges
|
19,804 | 19,180 | ||||||
|
Income
before income taxes, non-controlling interest and preferred dividends
of subsidiary
|
44,754 | 38,814 | ||||||
|
Income
Taxes
|
17,152 | 14,102 | ||||||
|
Net
Income
|
27,602 | 24,712 | ||||||
|
Net
(loss) income attributable to non-controlling interest:
|
||||||||
|
Non-controlling
interest in subsidiary
|
(141 | ) | 129 | |||||
|
Dividends
declared on Preferred Stock of subsidiary
|
727 | 727 | ||||||
|
Net
income attributable to CH Energy Group
|
27,016 | 23,856 | ||||||
|
Dividends
declared on Common Stock
|
25,585 | 25,564 | ||||||
|
Change
in Retained Earnings
|
$ | 1,431 | $ | (1,708 | ) | |||
|
Common
Stock:
|
||||||||
|
Average
shares outstanding
|
||||||||
|
Basic
|
15,774 | 15,767 | ||||||
|
Diluted
|
15,851 | 15,815 | ||||||
|
Amounts
attributable to CH Energy Group common shareholders
|
||||||||
|
Earnings
per share
|
||||||||
|
Basic
|
$ | 1.71 | $ | 1.51 | ||||
|
Diluted
|
$ | 1.70 | $ | 1.51 | ||||
|
Dividends
Declared Per Share
|
$ | 1.62 | $ | 1.62 | ||||
The Notes
to Financial Statements are an integral part hereof.
|
CH
ENERGY GROUP CONSOLIDATED STATEMENT OF COMPREHENSIVE
INCOME (UNAUDITED)
|
||||||||
|
(In
Thousands)
|
||||||||
|
Three
Months Ended
|
||||||||
|
September 30,
|
||||||||
|
2009
|
2008
|
|||||||
|
Net
Income
|
$ | 5,642 | $ | 3,195 | ||||
|
Other
Comprehensive Income:
|
||||||||
|
Fair
value of cash flow hedges:
|
||||||||
|
Unrealized
losses - net of tax of $6 and $125
|
(9 | ) | (188 | ) | ||||
|
Reclassification
for gains realized in net income -net of tax of $0 and $0
|
- | - | ||||||
|
Net
unrealized losses on investments held by equity method investees - net of
tax of $7 and $61
|
(10 | ) | (91 | ) | ||||
|
Other
comprehensive loss
|
(19 | ) | (279 | ) | ||||
|
Comprehensive
Income
|
5,623 | 2,916 | ||||||
|
Comprehensive
income attributable to non-controlling interest
|
290 | 310 | ||||||
|
Comprehensive
income attributable to CH Energy Group
|
$ | 5,333 | $ | 2,606 | ||||
|
Nine Months Ended
|
||||||||
|
September 30,
|
||||||||
|
2009
|
2008
|
|||||||
|
Net
Income
|
$ | 27,602 | $ | 24,712 | ||||
|
Other
Comprehensive Income:
|
||||||||
|
Fair
value of cash flow hedges:
|
||||||||
|
Unrealized
gains - net of tax of $(33) and ($867)
|
49 | 1,300 | ||||||
|
Reclassification
for losses realized in net income -net of tax of $0 and
$1,343
|
- | (2,014 | ) | |||||
|
Net
unrealized losses on investments held by equity method investees – net of
tax of $8 and $214
|
(11 | ) | (321 | ) | ||||
|
Other
comprehensive income (loss)
|
38 | (1,035 | ) | |||||
|
Comprehensive
Income
|
27,640 | 23,677 | ||||||
|
Comprehensive
income attributable to non-controlling interest
|
586 | 856 | ||||||
|
Comprehensive
income attributable to CH Energy Group
|
$ | 27,054 | $ | 22,821 | ||||
The Notes
to Financial Statements are an integral part hereof.
|
CH
ENERGY GROUP CONSOLIDATED STATEMENT OF CASH FLOWS
(UNAUDITED)
|
||||||||
|
(In
Thousands)
|
||||||||
|
Nine
Months Ended
|
||||||||
|
September 30,
|
||||||||
|
2009
|
2008
|
|||||||
|
Operating
Activities:
|
|
|
||||||
|
Net
income
|
$ | 27,602 | $ | 24,712 | ||||
|
Adjustments
to reconcile net income to net cash provided by operating
activities:
|
||||||||
|
Depreciation
|
26,647 | 25,009 | ||||||
|
Amortization
|
3,914 | 3,713 | ||||||
|
Deferred
income taxes - net
|
2,180 | 6,674 | ||||||
|
Provision
for uncollectibles
|
11,530 | 7,736 | ||||||
|
Distributed
equity in earnings of unconsolidated affiliates
|
941 | 844 | ||||||
|
Pension
expense
|
13,296 | 9,493 | ||||||
|
Other
post-employment benefits ("OPEB") expense
|
6,669 | 7,551 | ||||||
|
Regulatory
liability - rate moderation
|
(3,789 | ) | (5,901 | ) | ||||
|
Revenue
decoupling mechanism
|
(5,529 | ) | - | |||||
|
Regulatory
asset amortization
|
3,378 | 3,322 | ||||||
|
Gain
on sale of property and plant
|
(10 | ) | (98 | ) | ||||
|
Changes
in operating assets and liabilities - net of business
acquisitions:
|
||||||||
|
Accounts
receivable, unbilled revenues and other receivables
|
38,870 | 15,682 | ||||||
|
Fuel,
materials and supplies
|
5,352 | (14,066 | ) | |||||
|
Special
deposits and prepayments
|
603 | 4,231 | ||||||
|
Accounts
payable
|
(16,431 | ) | 11,352 | |||||
|
Accrued
income taxes and interest
|
8,968 | (2,264 | ) | |||||
|
Customer
advances
|
2,159 | 2,577 | ||||||
|
Pension
plan contribution
|
(15,000 | ) | (12,895 | ) | ||||
|
OPEB
contribution
|
(1,300 | ) | (4,200 | ) | ||||
|
Regulatory
asset - manufactured gas plant ("MGP") site remediations
|
(1,595 | ) | (1,051 | ) | ||||
|
Regulatory
asset - PSC tax surcharge and general assessment
|
(15,566 | ) | - | |||||
|
Deferred
natural gas and electric costs
|
17,993 | (4,832 | ) | |||||
|
Customer
benefit fund
|
(33 | ) | (369 | ) | ||||
|
Other
- net
|
10,155 | 1,464 | ||||||
|
Net
cash provided by operating activities
|
121,004 | 78,684 | ||||||
|
Investing
Activities:
|
||||||||
|
Proceeds
from sale of short-term investments
|
- | 3,545 | ||||||
|
Proceeds
from sale of property and plant
|
194 | 181 | ||||||
|
Additions
to utility and other property and plant
|
(93,946 | ) | (62,573 | ) | ||||
|
Acquisitions
made by competitive business subsidiaries
|
- | (9,262 | ) | |||||
|
Other
- net
|
(3,694 | ) | 958 | |||||
|
Net
cash used in investing activities
|
(97,446 | ) | (67,151 | ) | ||||
|
Financing
Activities:
|
||||||||
|
Redemption
of long-term debt
|
(20,000 | ) | - | |||||
|
Proceeds
from issuance of long-term debt
|
74,000 | - | ||||||
|
(Repayments)
borrowings of short-term debt - net
|
(18,500 | ) | 9,000 | |||||
|
Dividends
paid on Preferred Stock of subsidiary
|
(727 | ) | (727 | ) | ||||
|
Dividends
paid on Common Stock
|
(25,573 | ) | (25,559 | ) | ||||
|
Other
- net
|
(366 | ) | 5,765 | |||||
|
Net
cash provided by (used in) financing activities
|
8,834 | (11,521 | ) | |||||
|
Net
Change in Cash and Cash Equivalents
|
32,392 | 12 | ||||||
|
Cash
and Cash Equivalents at Beginning of Period
|
19,825 | 11,313 | ||||||
|
Cash
and Cash Equivalents at End of Period
|
$ | 52,217 | $ | 11,325 | ||||
|
Supplemental
Disclosure of Cash Flow Information:
|
||||||||
|
Interest
paid
|
$ | 15,410 | $ | 18,475 | ||||
|
Federal
and state taxes paid
|
$ | 24,785 | $ | 9,986 | ||||
|
Additions
to plant included in liabilities
|
$ | 2,685 | $ | 16,349 | ||||
The Notes
to Financial Statements are an integral part hereof.
|
CH
ENERGY GROUP CONSOLIDATED BALANCE SHEET
(UNAUDITED)
|
||||||||||||
|
(In
Thousands)
|
||||||||||||
|
September 30,
|
December 31,
|
September 30,
|
||||||||||
|
2009
|
2008
|
2008
|
||||||||||
|
ASSETS
|
|
|
|
|||||||||
|
Utility
Plant
|
|
|
|
|||||||||
|
Electric
|
$ | 899,355 | $ | 862,465 | $ | 842,006 | ||||||
|
Natural
gas
|
276,639 | 263,874 | 259,377 | |||||||||
|
Common
|
138,925 | 135,732 | 118,148 | |||||||||
| 1,314,919 | 1,262,071 | 1,219,531 | ||||||||||
|
Less:
Accumulated depreciation
|
373,693 | 369,925 | 368,065 | |||||||||
| 941,226 | 892,146 | 851,466 | ||||||||||
|
Construction
work in progress
|
62,957 | 53,778 | 80,302 | |||||||||
|
Net
Utility Plant
|
1,004,183 | 945,924 | 931,768 | |||||||||
|
Non-Utility
Property & Plant
|
||||||||||||
|
Griffith
non-utility property & plant
|
43,592 | 42,691 | 42,023 | |||||||||
|
Other
non-utility property & plant
|
23,176 | 15,345 | 15,294 | |||||||||
| 66,768 | 58,036 | 57,317 | ||||||||||
|
Less: Accumulated
depreciation - Griffith
|
25,646 | 23,398 | 22,710 | |||||||||
|
Less: Accumulated
depreciation - other
|
2,984 | 2,212 | 2,000 | |||||||||
|
Net
Non-Utility Property & Plant
|
38,138 | 32,426 | 32,607 | |||||||||
|
Current
Assets
|
||||||||||||
|
Cash
and cash equivalents
|
52,217 | 19,825 | 11,325 | |||||||||
|
Accounts
receivable from customers - net of allowance for doubtful accounts; $10.0
million, $8.8 million and $6.5 million, respectively
|
85,145 | 131,727 | 119,338 | |||||||||
|
Accrued
unbilled utility revenues
|
9,308 | 12,657 | 8,087 | |||||||||
|
Other
receivables
|
8,203 | 7,914 | 6,854 | |||||||||
|
Fuel,
materials and supplies
|
31,233 | 36,585 | 47,794 | |||||||||
|
Regulatory
assets
|
64,057 | 60,502 | 52,179 | |||||||||
|
Fair
value of derivative instruments
|
263 | - | 28 | |||||||||
|
Special
deposits and prepayments
|
20,815 | 21,344 | 23,904 | |||||||||
|
Accumulated
deferred income tax
|
7,486 | 7,498 | 7,077 | |||||||||
|
Total
Current Assets
|
278,727 | 298,052 | 276,586 | |||||||||
|
Deferred
Charges and Other Assets
|
||||||||||||
|
Regulatory
assets - pension plan
|
174,723 | 197,934 | 40,641 | |||||||||
|
Regulatory
assets - OPEB
|
6,429 | 4,257 | - | |||||||||
|
Regulatory
assets - other
|
106,215 | 109,743 | 117,075 | |||||||||
|
Goodwill
|
67,455 | 67,455 | 67,564 | |||||||||
|
Other
intangible assets - net
|
33,006 | 36,129 | 37,037 | |||||||||
|
Unamortized
debt expense
|
5,093 | 5,009 | 4,067 | |||||||||
|
Investments
in unconsolidated affiliates
|
8,417 | 9,711 | 9,882 | |||||||||
|
Other
investments
|
10,296 | 7,815 | 9,464 | |||||||||
|
Other
|
16,809 | 15,728 | 16,146 | |||||||||
|
Total
Deferred Charges and Other Assets
|
428,443 | 453,781 | 301,876 | |||||||||
|
Total
Assets
|
$ | 1,749,491 | $ | 1,730,183 | $ | 1,542,837 | ||||||
The Notes
to Financial Statements are an integral part hereof.
|
CH
ENERGY GROUP CONSOLIDATED BALANCE SHEET (CONT'D)
(UNAUDITED)
|
||||||||||||
|
(In
Thousands)
|
||||||||||||
|
September 30,
|
December 31,
|
September 30,
|
||||||||||
|
|
2009
|
2008
|
2008
|
|||||||||
|
CAPITALIZATION
AND LIABILITIES
|
|
|
|
|||||||||
|
Capitalization
|
|
|
|
|||||||||
|
CH
Energy Group Common Shareholders' Equity
|
|
|
|
|||||||||
|
Common
Stock (30,000,000 shares authorized: $0.10 par value;16,862,087 shares
issued) 15,790,431 shares, 15,783,083 shares, and 15,783,083 shares
outstanding, respectively
|
$ | 1,686 | $ | 1,686 | $ | 1,686 | ||||||
|
Paid-in
capital
|
350,905 | 350,873 | 350,828 | |||||||||
|
Retained
earnings
|
218,065 | 216,634 | 213,931 | |||||||||
|
Treasury
stock - 1,071,656 shares, 1,079,004 shares, and 1,079,004 shares,
respectively
|
(45,026 | ) | (45,386 | ) | (45,386 | ) | ||||||
|
Accumulated
other comprehensive income
|
93 | 55 | 138 | |||||||||
|
Capital
stock expense
|
(328 | ) | (328 | ) | (328 | ) | ||||||
|
Total
CH Energy Group Common Shareholders' Equity
|
525,395 | 523,534 | 520,869 | |||||||||
|
Non-controlling
interest in subsidiary
|
1,520 | 1,448 | 1,474 | |||||||||
|
Total
Equity
|
526,915 | 524,982 | 522,343 | |||||||||
|
Preferred
Stock of subsidiary
|
21,027 | 21,027 | 21,027 | |||||||||
|
Long-term
debt
|
463,897 | 413,894 | 383,893 | |||||||||
|
Total
Capitalization
|
1,011,839 | 959,903 | 927,263 | |||||||||
|
Current
Liabilities
|
||||||||||||
|
Current
maturities of long-term debt
|
24,000 | 20,000 | 20,000 | |||||||||
|
Notes
payable
|
17,000 | 35,500 | 51,500 | |||||||||
|
Accounts
payable
|
34,025 | 52,824 | 54,596 | |||||||||
|
Accrued
interest
|
6,238 | 5,899 | 4,288 | |||||||||
|
Dividends
payable
|
8,777 | 8,765 | 8,765 | |||||||||
|
Accrued
vacation and payroll
|
6,910 | 6,628 | 6,485 | |||||||||
|
Customer
advances
|
32,601 | 30,442 | 25,622 | |||||||||
|
Customer
deposits
|
8,582 | 8,445 | 8,413 | |||||||||
|
Regulatory
liabilities
|
24,064 | 4,275 | 3,922 | |||||||||
|
Fair
value of derivative instruments
|
12,887 | 15,759 | 14,080 | |||||||||
|
Accrued
environmental remediation costs
|
12,986 | 5,757 | 7,876 | |||||||||
|
Accrued
income taxes
|
9,070 | 441 | 409 | |||||||||
|
Deferred
revenues
|
7,476 | 8,827 | 7,424 | |||||||||
|
Other
|
14,344 | 27,974 | 31,651 | |||||||||
|
Total
Current Liabilities
|
218,960 | 231,536 | 245,031 | |||||||||
|
Deferred
Credits and Other Liabilities
|
||||||||||||
|
Regulatory
liabilities - OPEB
|
- | - | 15,505 | |||||||||
|
Regulatory
liabilities - other
|
101,176 | 130,893 | 123,828 | |||||||||
|
Operating
reserves
|
4,931 | 5,155 | 4,802 | |||||||||
|
Accrued
environmental remediation costs
|
14,518 | 21,796 | 21,860 | |||||||||
|
Accrued
OPEB costs
|
54,381 | 52,645 | 30,019 | |||||||||
|
Accrued
pension costs
|
157,030 | 161,674 | 474 | |||||||||
|
Other
|
14,525 | 12,478 | 13,795 | |||||||||
|
Total
Deferred Credits and Other Liabilities
|
346,561 | 384,641 | 210,283 | |||||||||
|
Accumulated
Deferred Income Tax
|
172,131 | 154,103 | 160,260 | |||||||||
|
Commitments
and Contingencies
|
||||||||||||
|
Total
Capitalization and Liabilities
|
$ | 1,749,491 | $ | 1,730,183 | $ | 1,542,837 | ||||||
The Notes
to Financial Statements are an integral part hereof.
CH
ENERGY GROUP CONSOLIDATED STATEMENT OF CHANGES IN EQUITY
(UNAUDITED)
(In
Thousands, except share and per share amounts)
|
CH
Energy Group Common Shareholders
|
|||||||||||||||||||||||||||||||||
|
Common
Stock
$0.10
par value; 30,000,000 shares authorized
|
Treasury
Stock
|
||||||||||||||||||||||||||||||||
|
Shares
Issued
|
Amount
|
Shares
Repurchased
|
Amount
|
Paid-In
Capital
|
Capital
Stock Expense
|
Retained
Earnings
|
Accumulated
Other Comprehensive Income / (Loss)
|
Non-controlling
Interest
|
Total
Equity
|
||||||||||||||||||||||||
|
Balance
at January 1, 2008
|
16,862,087 | $ | 1,686 | (1,100,087 | ) | $ | (46,252 | ) | $ | 351,230 | $ | (328 | ) | $ | 215,639 | $ | 1,173 | $ | 1,345 | $ | 524,493 | ||||||||||||
|
Comprehensive
income:
|
|||||||||||||||||||||||||||||||||
|
Net
income
|
23,856 | 129 | 23,985 | ||||||||||||||||||||||||||||||
|
Change
in fair value:
|
|||||||||||||||||||||||||||||||||
|
Derivative
instruments
|
1,300 | 1,300 | |||||||||||||||||||||||||||||||
|
Investments
|
(2,014 | ) | (2,014 | ) | |||||||||||||||||||||||||||||
|
Reclassification
adjustments for losses recognized in net income
|
(321 | ) | (321 | ) | |||||||||||||||||||||||||||||
|
Dividends
declared on common stock ($2.16 per share)
|
(25,564 | ) | (25,564 | ) | |||||||||||||||||||||||||||||
|
Treasury
shares activity - net
|
21,083 | 866 | (402 | ) | 464 | ||||||||||||||||||||||||||||
|
Balance
at September 30, 2008
|
16,862,087 | $ | 1,686 | (1,079,004 | ) | $ | (45,386 | ) | $ | 350,828 | $ | (328 | ) | $ | 213,931 | $ | 138 | $ | 1,474 | $ | 522,343 | ||||||||||||
|
Balance
at January 1, 2009
|
16,862,087 | $ | 1,686 | (1,079,004 | ) | $ | (45,386 | ) | $ | 350,873 | $ | (328 | ) | $ | 216,634 | $ | 55 | $ | 1,448 | $ | 524,982 | ||||||||||||
|
Comprehensive
income:
|
|||||||||||||||||||||||||||||||||
|
Net
income
|
27,016 | (141 | ) | 26,875 | |||||||||||||||||||||||||||||
|
Capital
Contributions
|
213 | 213 | |||||||||||||||||||||||||||||||
|
Change
in fair value:
|
|||||||||||||||||||||||||||||||||
|
Derivative
instruments
|
49 | 49 | |||||||||||||||||||||||||||||||
|
Investments
|
(11 | ) | (11 | ) | |||||||||||||||||||||||||||||
|
Reclassification
adjustments for losses recognized in net income
|
- | ||||||||||||||||||||||||||||||||
|
Dividends
declared on common stock ($2.16 per share)
|
(25,585 | ) | (25,585 | ) | |||||||||||||||||||||||||||||
|
Treasury
shares activity - net
|
7,348 | 360 | 32 | 392 | |||||||||||||||||||||||||||||
|
Balance
at September 30, 2009
|
16,862,087 | $ | 1,686 | (1,071,656 | ) | $ | (45,026 | ) | $ | 350,905 | $ | (328 | ) | $ | 218,065 | $ | 93 | $ | 1,520 | $ | 526,915 | ||||||||||||
The Notes
to Financial Statements are an integral part hereof.
|
CENTRAL
HUDSON STATEMENT OF INCOME (UNAUDITED)
|
||||||||
|
(In
Thousands)
|
||||||||
|
Three
Months Ended
|
||||||||
|
September 30,
|
||||||||
|
2009
|
2008
|
|||||||
|
Operating
Revenues
|
|
|
||||||
|
Electric
|
$ | 138,685 | $ | 179,001 | ||||
|
Natural
gas
|
16,243 | 21,773 | ||||||
|
Total
Operating Revenues
|
154,928 | 200,774 | ||||||
|
Operating
Expenses
|
||||||||
|
Operation:
|
||||||||
|
Purchased
electricity and fuel used in electric generation
|
60,017 | 115,413 | ||||||
|
Purchased
natural gas
|
5,798 | 13,405 | ||||||
|
Other
expenses of operation
|
50,311 | 39,247 | ||||||
|
Depreciation
and amortization
|
8,015 | 7,566 | ||||||
|
Taxes,
other than income tax
|
9,867 | 9,452 | ||||||
|
Total
Operating Expenses
|
134,008 | 185,083 | ||||||
|
Operating
Income
|
20,920 | 15,691 | ||||||
|
Other
Income and Deductions
|
||||||||
|
Interest
on regulatory assets and other interest income
|
1,202 | 962 | ||||||
|
Other
- net
|
(710 | ) | 120 | |||||
|
Total
Other Income
|
492 | 1,082 | ||||||
|
Interest
Charges
|
||||||||
|
Interest
on other long-term debt
|
4,515 | 4,926 | ||||||
|
Interest
on regulatory liabilities and other interest
|
1,693 | 1,374 | ||||||
|
Total
Interest Charges
|
6,208 | 6,300 | ||||||
|
Income
Before Income Taxes
|
15,204 | 10,473 | ||||||
|
Income
Taxes
|
6,333 | 4,346 | ||||||
|
Net
Income
|
8,871 | 6,127 | ||||||
|
Dividends
Declared on Cumulative Preferred Stock
|
242 | 242 | ||||||
|
Income
Available for Common Stock
|
$ | 8,629 | $ | 5,885 | ||||
The Notes
to Financial Statements are an integral part hereof.
|
CENTRAL
HUDSON STATEMENT OF INCOME (UNAUDITED)
|
||||||||
|
(In
Thousands)
|
||||||||
|
Nine
Months Ended
|
||||||||
|
September 30,
|
||||||||
|
2009
|
2008
|
|||||||
|
Operating
Revenues
|
|
|
||||||
|
Electric
|
$ | 404,035 | $ | 468,659 | ||||
|
Natural
gas
|
137,422 | 142,267 | ||||||
|
Total
Operating Revenues
|
541,457 | 610,926 | ||||||
|
Operating
Expenses
|
||||||||
|
Operation:
|
||||||||
|
Purchased
electricity and fuel used in electric generation
|
201,782 | 287,156 | ||||||
|
Purchased
natural gas
|
89,924 | 98,008 | ||||||
|
Other
expenses of operation
|
141,022 | 123,414 | ||||||
|
Depreciation
and amortization
|
24,013 | 22,380 | ||||||
|
Taxes,
other than income tax
|
29,197 | 27,886 | ||||||
|
Total
Operating Expenses
|
485,938 | 558,844 | ||||||
|
Operating
Income
|
55,519 | 52,082 | ||||||
|
Other
Income and Deductions
|
||||||||
|
Interest
on regulatory assets and other interest income
|
3,813 | 3,290 | ||||||
|
Other
- net
|
(2,271 | ) | 558 | |||||
|
Total
Other Income
|
1,542 | 3,848 | ||||||
|
Interest
Charges
|
||||||||
|
Interest
on other long-term debt
|
13,863 | 15,064 | ||||||
|
Interest
on regulatory liabilities and other interest
|
4,454 | 3,589 | ||||||
|
Total
Interest Charges
|
18,317 | 18,653 | ||||||
|
Income
Before Income Taxes
|
38,744 | 37,277 | ||||||
|
Income
Taxes
|
16,062 | 15,212 | ||||||
|
Net
Income
|
22,682 | 22,065 | ||||||
|
Dividends
Declared on Cumulative Preferred Stock
|
727 | 727 | ||||||
|
Income
Available for Common Stock
|
$ | 21,955 | $ | 21,338 | ||||
The Notes
to Financial Statements are an integral part hereof.
|
CENTRAL
HUDSON STATEMENT OF COMPREHENSIVE INCOME
(UNAUDITED)
|
||||||||
|
(In
Thousands)
|
||||||||
|
Three
Months Ended
|
||||||||
|
September 30,
|
||||||||
| 2009 | 2008 | |||||||
|
Net
Income
|
$ | 8,871 | $ | 6,127 | ||||
|
Other
Comprehensive Income
|
- | - | ||||||
|
Comprehensive
Income
|
$ | 8,871 | $ | 6,127 | ||||
|
September 30,
|
||||||||
| 2009 | 2008 | |||||||
|
Net
Income
|
$ | 22,682 | $ | 22,065 | ||||
|
Other
Comprehensive Income
|
- | - | ||||||
|
Comprehensive
Income
|
$ | 22,682 | $ | 22,065 | ||||
The Notes
to Financial Statements are an integral part hereof.
|
CENTRAL
HUDSON STATEMENT OF CASH FLOWS
(UNAUDITED)
|
||||||||
|
(In
Thousands)
|
||||||||
|
Nine
Months Ended
|
||||||||
|
September 30,
|
||||||||
|
2009
|
2008
|
|||||||
|
Operating
Activities:
|
|
|
||||||
|
Net
Income
|
$ | 22,682 | $ | 22,065 | ||||
|
Adjustments
to reconcile net income to net cash provided by operating
activities:
|
||||||||
|
Depreciation
|
23,217 | 21,746 | ||||||
|
Amortization
|
796 | 634 | ||||||
|
Deferred
income taxes - net
|
(376 | ) | 4,090 | |||||
|
Provision
for uncollectibles
|
7,966 | 5,326 | ||||||
|
Pension
expense
|
13,296 | 9,493 | ||||||
|
OPEB
expense
|
6,669 | 7,551 | ||||||
|
Regulatory
liability - rate moderation
|
(3,789 | ) | (5,901 | ) | ||||
|
Revenue
decoupling mechanism
|
(5,529 | ) | - | |||||
|
Regulatory
asset amortization
|
3,378 | 3,322 | ||||||
|
Loss
on sale of property and plant
|
25 | - | ||||||
|
Changes
in operating assets and liabilities - net:
|
||||||||
|
Accounts
receivable, unbilled revenues and other receivables
|
20,578 | 7,751 | ||||||
|
Fuel,
materials and supplies
|
4,554 | (15,729 | ) | |||||
|
Special
deposits and prepayments
|
2,332 | 5,093 | ||||||
|
Accounts
payable
|
(13,102 | ) | 15,857 | |||||
|
Accrued
income taxes and interest
|
8,392 | 899 | ||||||
|
Customer
advances
|
1,437 | (5,194 | ) | |||||
|
Pension
plan contribution
|
(15,000 | ) | (12,895 | ) | ||||
|
OPEB
contribution
|
(1,300 | ) | (4,200 | ) | ||||
|
Regulatory
asset - MGP site remediations
|
(1,595 | ) | (1,051 | ) | ||||
|
Regulatory
asset - PSC tax surcharge and general assessment
|
(15,566 | ) | - | |||||
|
Deferred
natural gas and electric costs
|
17,993 | (4,832 | ) | |||||
|
Customer
benefit fund
|
(33 | ) | (369 | ) | ||||
|
Other
- net
|
12,209 | 3,360 | ||||||
|
Net
cash provided by operating activities
|
89,234 | 57,016 | ||||||
|
Investing
Activities:
|
||||||||
|
Additions
to utility plant
|
(85,843 | ) | (58,268 | ) | ||||
|
Other
- net
|
(3,937 | ) | (1,180 | ) | ||||
|
Net
cash used in investing activities
|
(89,780 | ) | (59,448 | ) | ||||
|
Financing
Activities:
|
||||||||
|
Redemption
of long-term debt
|
(20,000 | ) | - | |||||
|
Proceeds
from issuance of long-term debt
|
24,000 | - | ||||||
|
Repayments
of short-term debt - net
|
(8,500 | ) | (6,000 | ) | ||||
|
Additional
paid-in capital
|
25,000 | - | ||||||
|
Dividends
paid on cumulative Preferred Stock
|
(727 | ) | (727 | ) | ||||
|
Other
- net
|
(369 | ) | 5,765 | |||||
|
Net
cash provided by (used in) provided by financing
activities
|
19,404 | (962 | ) | |||||
|
Net
Change in Cash and Cash Equivalents
|
18,858 | (3,394 | ) | |||||
|
Cash
and Cash Equivalents - Beginning of Period
|
2,455 | 3,592 | ||||||
|
Cash
and Cash Equivalents - End of Period
|
$ | 21,313 | $ | 198 | ||||
|
Supplemental
Disclosure of Cash Flow Information:
|
||||||||
|
Interest
paid
|
$ | 15,282 | $ | 17,950 | ||||
|
Federal
and state taxes paid
|
$ | 25,103 | $ | 8,642 | ||||
|
Additions
to plant included in liabilities
|
$ | 1,723 | $ | 16,349 | ||||
The Notes
to Financial Statements are an integral part hereof.
|
CENTRAL
HUDSON BALANCE SHEET (UNAUDITED)
|
||||||||||||
|
(In
Thousands)
|
||||||||||||
|
September 30,
|
December 31,
|
September 30,
|
||||||||||
|
|
2009
|
2008
|
2008
|
|||||||||
|
ASSETS
|
|
|
|
|||||||||
|
Utility
Plant
|
|
|
|
|||||||||
|
Electric
|
$ | 899,355 | $ | 862,465 | $ | 842,006 | ||||||
|
Natural
gas
|
276,639 | 263,874 | 259,377 | |||||||||
|
Common
|
138,925 | 135,732 | 118,148 | |||||||||
| 1,314,919 | 1,262,071 | 1,219,531 | ||||||||||
|
Less:
Accumulated depreciation
|
373,693 | 369,925 | 368,065 | |||||||||
| 941,226 | 892,146 | 851,466 | ||||||||||
|
Construction
work in progress
|
62,957 | 53,778 | 80,302 | |||||||||
|
Net
Utility Plant
|
1,004,183 | 945,924 | 931,768 | |||||||||
|
Non-Utility
Property and Plant
|
681 | 445 | 445 | |||||||||
|
Less:
Accumulated depreciation
|
32 | 32 | 32 | |||||||||
|
Net
Non-Utility Property and Plant
|
649 | 413 | 413 | |||||||||
|
Current
Assets
|
||||||||||||
|
Cash
and cash equivalents
|
21,313 | 2,455 | 198 | |||||||||
|
Accounts
receivable from customers - net of allowance for doubtful
accounts; $5.8 million, $4.0 million and $3.6 million,
respectively
|
60,380 | 85,352 | 72,206 | |||||||||
|
Accrued
unbilled utility revenues
|
9,308 | 12,657 | 8,087 | |||||||||
|
Other
receivables
|
2,683 | 3,447 | 2,774 | |||||||||
|
Fuel,
materials and supplies - at average cost
|
26,561 | 31,115 | 39,999 | |||||||||
|
Regulatory
assets
|
64,057 | 60,502 | 52,179 | |||||||||
|
Fair
value of derivative instruments
|
180 | - | - | |||||||||
|
Special
deposits and prepayments
|
16,315 | 18,573 | 19,415 | |||||||||
|
Accumulated
deferred income tax
|
4,675 | 4,685 | 5,754 | |||||||||
|
Total
Current Assets
|
205,472 | 218,786 | 200,612 | |||||||||
|
Deferred
Charges and Other Assets
|
||||||||||||
|
Regulatory
assets - pension plan
|
174,723 | 197,934 | 40,641 | |||||||||
|
Regulatory
assets - OPEB
|
6,429 | 4,257 | - | |||||||||
|
Regulatory
assets - other
|
106,215 | 109,743 | 117,075 | |||||||||
|
Unamortized
debt expense
|
5,093 | 5,009 | 4,067 | |||||||||
|
Other
investments
|
10,049 | 7,697 | 9,325 | |||||||||
|
Other
|
3,196 | 2,433 | 3,338 | |||||||||
|
Total
Deferred Charges and Other Assets
|
305,705 | 327,073 | 174,446 | |||||||||
|
Total
Assets
|
$ | 1,516,009 | $ | 1,492,196 | $ | 1,307,239 | ||||||
The Notes
to Financial Statements are an integral part hereof.
|
CENTRAL
HUDSON BALANCE SHEET (CONT'D) (UNAUDITED)
|
||||||||||||
|
(In
Thousands)
|
||||||||||||
|
September 30,
|
December 31,
|
September 30,
|
||||||||||
|
|
2009
|
2008
|
2008
|
|||||||||
|
CAPITALIZATION
AND LIABILITIES
|
|
|
|
|||||||||
|
Capitalization
|
|
|
|
|||||||||
|
Common
Stock, 30,000,000 shares authorized; 16,862,087
shares issued and outstanding, $5 par value
|
$ | 84,311 | $ | 84,311 | $ | 84,311 | ||||||
|
Paid-in
capital
|
199,980 | 174,980 | 174,980 | |||||||||
|
Retained
earnings
|
140,899 | 118,944 | 114,014 | |||||||||
|
Capital
stock expense
|
(4,961 | ) | (4,961 | ) | (4,961 | ) | ||||||
|
Total
Equity
|
420,229 | 373,274 | 368,344 | |||||||||
|
Cumulative
Preferred Stock not subject to mandatory redemption
|
21,027 | 21,027 | 21,027 | |||||||||
|
Long-term
debt
|
413,897 | 413,894 | 383,893 | |||||||||
|
Total
Capitalization
|
855,153 | 808,195 | 773,264 | |||||||||
|
Current
Liabilities
|
||||||||||||
|
Current
maturities of long-term debt
|
24,000 | 20,000 | 20,000 | |||||||||
|
Notes
payable
|
17,000 | 25,500 | 36,500 | |||||||||
|
Accounts
payable
|
26,481 | 42,913 | 43,992 | |||||||||
|
Accrued
interest
|
4,876 | 5,895 | 4,275 | |||||||||
|
Dividends
payable - Preferred Stock
|
242 | 242 | 242 | |||||||||
|
Accrued
vacation and payroll
|
4,855 | 4,896 | 4,537 | |||||||||
|
Customer
advances
|
11,011 | 9,574 | 5,648 | |||||||||
|
Customer
deposits
|
8,468 | 8,317 | 8,285 | |||||||||
|
Regulatory
liabilities
|
24,064 | 4,275 | 3,922 | |||||||||
|
Fair
value of derivative instruments
|
12,887 | 15,759 | 14,080 | |||||||||
|
Accrued
environmental remediation costs
|
12,881 | 5,563 | 7,680 | |||||||||
|
Accrued
income taxes
|
9,498 | 87 | 6,040 | |||||||||
|
Other
|
7,571 | 21,284 | 25,666 | |||||||||
|
Total
Current Liabilities
|
163,834 | 164,305 | 180,867 | |||||||||
|
Deferred
Credits and Other Liabilities
|
||||||||||||
|
Regulatory
liabilities - OPEB
|
- | - | 15,505 | |||||||||
|
Regulatory
liabilities - other
|
101,176 | 130,893 | 123,828 | |||||||||
|
Operating
reserves
|
3,777 | 3,898 | 3,776 | |||||||||
|
Accrued
environmental remediation costs
|
13,337 | 20,621 | 20,640 | |||||||||
|
Accrued
OPEB costs
|
54,381 | 52,645 | 30,019 | |||||||||
|
Accrued
pension costs
|
157,030 | 161,674 | 474 | |||||||||
|
Other
|
13,798 | 11,891 | 13,225 | |||||||||
|
Total
Deferred Credits and Other Liabilities
|
343,499 | 381,622 | 207,467 | |||||||||
|
Accumulated
Deferred Income Tax
|
153,523 | 138,074 | 145,641 | |||||||||
|
Commitments
and Contingencies
|
||||||||||||
|
Total
Capitalization and Liabilities
|
$ | 1,516,009 | $ | 1,492,196 | $ | 1,307,239 | ||||||
The Notes
to Financial Statements are an integral part hereof.
|
CENTRAL
HUDSON STATEMENT OF CHANGES IN EQUITY
(UNAUDITED)
|
||||||||||||||||||||||||||||
|
(In
Thousands, except share and per share amounts)
|
||||||||||||||||||||||||||||
|
|
||||||||||||||||||||||||||||
|
Central
Hudson Common Shareholders
|
||||||||||||||||||||||||||||
|
Common
Stock
$5.00
par value;
30,000,000
shares authorized
|
Treasury
Stock
|
|||||||||||||||||||||||||||
|
Shares
Issued
|
Amount
|
Shares
Repurchased
|
Amount
|
Paid-In
Capital
|
Capital
Stock Expense
|
Retained
Earnings
|
Accumulated
Other Comprehensive Income / (Loss)
|
Total
Equity
|
||||||||||||||||||||
|
Balance
at January 1, 2008
|
16,862,087 | $ | 84,311 | - | $ | - | $ | 174,980 | $ | (4,961 | ) | $ | 92,676 | $ | - | $ | 347,006 | |||||||||||
|
Net
income
|
21,338 | 21,338 | ||||||||||||||||||||||||||
|
Balance
at September 30, 2008
|
16,862,087 | $ | 84,311 | - | $ | - | $ | 174,980 | $ | (4,961 | ) | $ | 114,014 | $ | - | $ | 368,344 | |||||||||||
|
Balance
at January 1, 2009
|
16,862,087 | $ | 84,311 | - | $ | - | $ | 174,980 | $ | (4,961 | ) | $ | 118,944 | $ | - | $ | 373,274 | |||||||||||
|
Net
income
|
21,955 | 21,955 | ||||||||||||||||||||||||||
|
Additional
Paid-In Capital
|
25,000 | 25,000 | ||||||||||||||||||||||||||
|
Balance
at September 30, 2009
|
16,862,087 | $ | 84,311 | - | $ | - | $ | 199,980 | $ | (4,961 | ) | $ | 140,899 | $ | - | $ | 420,229 | |||||||||||
The Notes
to Financial Statements are an integral part hereof.
NOTES TO FINANCIAL STATEMENTS (UNAUDITED)
NOTE 1 - SUMMARY OF
SIGNIFICANT ACCOUNTING POLICIES
Basis
of Presentation
This
Quarterly Report on Form 10-Q is a combined report of CH Energy Group, Inc. (“CH
Energy Group”) and its regulated electric and natural gas subsidiary, Central
Hudson Gas & Electric Corporation (“Central Hudson”). The Notes
to the Consolidated Financial Statements apply to both CH Energy Group and
Central Hudson. CH Energy Group’s Consolidated Financial Statements
include the accounts of CH Energy Group and its wholly owned subsidiaries, which
include Central Hudson and CH Energy Group’s non-utility subsidiary, Central
Hudson Enterprises Corporation (“CHEC”). Operating results of
CHEC include its wholly owned subsidiaries, Griffith Energy Services, Inc.
(“Griffith”), CH-Auburn Energy, LLC (“CH-Auburn”), CH-Greentree, LLC
(“CH-Greentree”), and CH-Lyonsdale, LLC (“CH-Lyonsdale”), and its majority owned
subsidiary Lyonsdale Biomass, LLC (“Lyonsdale”). CHEC’s operating
results are consolidated in the Consolidated Financial Statements of CH Energy
Group. The non-controlling interest shown on CH Energy Group’s Consolidated
Financial Statements represents the minority owner’s proportionate share of the
income and equity of Lyonsdale and preferred stock of Central
Hudson. Inter-company balances and transactions have been eliminated
in consolidation.
The
Financial Statements were prepared in conformity with accounting principles
generally accepted in the United States of America (“GAAP”), which for regulated
public utilities, includes the Financial Accounting Standards Board’s (“FASB”)
Accounting Standards Codification (“ASC”) 980, Regulated Operations,
(formerly Statement of Financial Accounting Standards (“SFAS”) No. 71, Accounting for the Effects of Certain Types of
Regulation). For additional information regarding regulatory
accounting see Note 2 – “Regulatory Matters”.
Unaudited
Financial Statements
The
accompanying Consolidated Financial Statements of CH Energy Group and Financial
Statements of Central Hudson are unaudited but, in the opinion of Management,
reflect adjustments (which include normal recurring adjustments) necessary for a
fair statement of the results for the interim periods
presented. These condensed, unaudited, quarterly Financial Statements
do not contain the detail or footnote disclosures concerning accounting policies
and other matters which would be included in annual Financial Statements and,
accordingly, should be read in conjunction with the audited Financial Statements
(including the Notes thereto) included in the combined CH Energy Group/Central
Hudson Annual Report on Form 10-K for the year ended December 31, 2008 (the
“Corporations’ 10-K Annual Report”).
CH Energy
Group’s and Central Hudson’s balance sheets as of September 30, 2008 are not
required to be included in this Quarterly Report on Form 10-Q; however, these
balance sheets are included for supplemental analysis purposes.
Reclassification
Certain
amounts in the 2008 Financial Statements have been reclassified to conform to
the 2009 presentation.
Effective
January 1, 2009, Central Hudson adopted ASC 810-10-65-1, Transition Related to FASB Statement
No. 160, Noncontrolling Interests in Consolidated Financial Statements – an
amendment of ARB No. 51, (formerly SFAS No. 160 – Noncontrolling Interest in
Consolidated Financial Statements). In accordance with this
standard, CH Energy Group modified the presentation of minority interest or
non-controlling interest in the prior periods presented for CH Energy Group’s
Consolidated Statement of Income, Consolidated Statement of Cash Flow and
Consolidated Balance Sheet. For more information, see Note 3 – “New
Accounting Standards and Other FASB Projects”.
Cash
and Cash Equivalents
For
purposes of the Statement of Cash Flows and the Balance Sheet, CH Energy Group
and Central Hudson consider temporary cash investments with a maturity (when
purchased) of three months or less, to be cash equivalents.
Revenue
Recognition
CH Energy
Group’s deferred revenue balances as of September 30, 2009, December 31, 2008
and September 30, 2008 were $7.5 million, $8.8 million and $7.4 million,
respectively. The deferred revenue balance will be recognized in
competitive business subsidiaries’ operating revenues over the 12-month term of
the respective customer contract.
As
required by the New York State Public Service Commission (“PSC”), Central Hudson
records gross receipts tax revenues and expenses on a gross income statement
presentation basis (i.e., included in both revenue and
expenses). Sales and use taxes for both Central Hudson and Griffith
are accounted for on a net basis (excluded from revenue).
Fuel,
Materials and Supplies
Fuel,
materials and supplies for CH Energy Group are valued using the following
accounting methods:
|
Company
|
Valuation Method
|
|
Central
Hudson
|
Average
cost
|
|
Griffith
|
FIFO
|
|
Lyonsdale
|
Weighted
average cost
|
The
following is a summary of CH Energy Group’s and Central Hudson’s inventories (In
Thousands):
CH Energy
Group
|
|
September 30,
|
December 31,
|
September 30,
|
|||||||||
|
|
2009
|
2008
|
2008
|
|||||||||
|
Natural
gas
|
$ | 16,670 | $ | 22,684 | $ | 32,019 | ||||||
|
Petroleum
products and propane
|
1,935 | 2,782 | 5,367 | |||||||||
|
Fuel
used in electric generation
|
776 | 586 | 822 | |||||||||
|
Materials
and supplies
|
11,852 | 10,533 | 9,586 | |||||||||
|
Total
|
$ | 31,233 | $ | 36,585 | $ | 47,794 | ||||||
Central
Hudson
|
|
September 30,
|
December 31,
|
September 30,
|
|||||||||
|
|
2009
|
2008
|
2008
|
|||||||||
|
Natural
gas
|
$ | 16,670 | $ | 22,684 | $ | 32,019 | ||||||
|
Petroleum
products and propane
|
550 | 550 | 557 | |||||||||
|
Fuel
used in electric generation
|
329 | 343 | 344 | |||||||||
|
Materials
and supplies
|
9,012 | 7,538 | 7,079 | |||||||||
|
Total
|
$ | 26,561 | $ | 31,115 | $ | 39,999 | ||||||
Depreciation
and Amortization
For
financial statement purposes, Central Hudson’s depreciation provisions are
computed on the straight-line method using rates based on studies of the
estimated useful lives and estimated net salvage value of
properties. The anticipated costs of removing assets upon retirement
are provided for over the life of those assets as a component of depreciation
expense. This depreciation method is consistent with industry
practice and the applicable depreciation rates have been approved by the
PSC.
ASC 410,
Asset Retirement and
Environmental Obligations, (formerly SFAS No. 143, Accounting for Asset Retirement
Obligations), precludes the recognition of expected future retirement
obligations as a component of depreciation expense or accumulated
depreciation. Central Hudson, however, is required to use
depreciation methods and rates approved by the PSC under regulatory
accounting. In accordance with ASC 980, Central Hudson continues to
accrue for the future cost of removal for its rate-regulated natural gas and
electric utility assets. In accordance with ASC 410, Central Hudson
has classified $47.9 million, $47.6 million, and $49.5 million of net cost of
removal as regulatory liabilities as of September 30, 2009, December 31, 2008,
and September 30, 2008, respectively.
For
financial statement purposes, both Griffith and Lyonsdale have depreciation
provisions that are computed on the straight-line method using depreciation
rates based on the estimated useful lives of depreciable property and
equipment. Expenditures for major renewals and betterments, which
extend the useful lives of property and equipment, are
capitalized. Expenditures for maintenance and repairs are charged to
expense when incurred. Retirements, sales, and disposals of assets
are recorded by removing the cost and accumulated depreciation from the asset
and accumulated depreciation accounts with any resulting gain or loss reflected
in earnings.
Amortization
of intangibles (other than goodwill) is computed on the straight-line method
over the assets’ expected useful lives. See Note 6 – “Goodwill and
Other Intangible Assets” for further discussion.
Earnings
Per Share
In the
calculation of earnings per share (basic and diluted) of CH Energy Group’s
common stock (“Common Stock”), earnings for CH Energy Group are reduced by the
preferred stock dividends of Central Hudson. The average dilutive
effect of CH Energy Group’s stock options, performance shares and restricted
shares was 77,983 shares and 47,827 shares for the three months ended September
30, 2009 and 2008, respectively. The average dilutive effect of CH Energy
Group’s stock options, performance shares and restricted shares was 77,663
shares and 47,814 shares for the nine months ended September 30, 2009 and 2008,
respectively. Certain stock options are excluded from the calculation of diluted
earnings per share because the exercise prices of those options were greater
than the average market price per share of Common Stock for some of the periods
presented. Excluded from the calculation were options for 17,420
shares for the three and nine months ended September 30, 2009, and 39,980 shares
for the three and nine months ended September 30, 2008. For
additional information regarding stock options and performance shares, see Note
11 – “Equity-Based Compensation.”
Equity-Based
Compensation
CH Energy
Group has an equity-based employee compensation plan that is described in Note
11 – “Equity-Based Compensation.”
Parental
Guarantees
CH Energy
Group and CHEC have issued guarantees in conjunction with certain commodity and
derivative contracts that provide financial or performance assurance to third
parties on behalf of a subsidiary. The guarantees are entered into
primarily to support or enhance the creditworthiness otherwise attributed to a
subsidiary on a stand-alone basis, thereby facilitating the extension of
sufficient credit to accomplish the relevant subsidiary’s intended commercial
purposes.
The
guarantees described above have been issued to counterparties to assure the
payment, when due, of certain obligations incurred by CH Energy Group
subsidiaries in physical and financial transactions related to heating oil,
propane, other petroleum products, and weather and commodity
hedges. At September 30, 2009, the aggregate amount of subsidiary
obligations covered by these guarantees was $2.7 million. Where
liabilities exist under the commodity-related contracts subject to these
guarantees, these liabilities are included in CH Energy Group’s Consolidated
Balance Sheet.
Other
Guarantees
Central
Hudson had a reimbursement obligation with respect to a $6.8 million standby
letter of credit issued by a financial institution to support a real estate
transaction that closed in June 2009. No premium was received or is
receivable by Central Hudson in connection with this letter of
credit. This uncollateralized letter of credit was issued February
29, 2008 and expired upon the closing of the real estate
transaction.
Product
Warranties
Griffith
offers a multi-year warranty on heating system installations and has recorded
liabilities for the estimated costs of fulfilling its obligations under these
warranties. CH Energy Group’s approximate aggregate potential
liability for product warranties at September 30, 2009, December 31, 2008 and
September 30, 2008 was not material. CH Energy Group’s liabilities
for these product warranties were determined by accruing the present value of
future estimated warranty expense based on the number and type of contracts
outstanding and historical costs for these contracts.
Consolidation
CH Energy
Group and its subsidiaries do not have any interests in special purpose entities
and do not have material affiliations with any variable interest entities that
require consolidation under the provisions of ASC 810-10-25-30.
Common
Stock Dividends
CH Energy
Group’s ability to pay dividends may be affected by the ability of its
subsidiaries to pay dividends. The Federal Power Act limits the payment of
dividends by Central Hudson to its retained earnings. More
restrictive is the PSC’s limit on the dividends Central Hudson may pay to CH
Energy Group which is 100% of the average annual income available for common
stock, calculated on a two-year rolling average basis. Based on this
calculation as of September 30, 2009, Central Hudson would be able to pay a
maximum of $28.3 million in dividends to CH Energy Group without violating the
restrictions by the PSC. Central Hudson’s dividend would be reduced
to 75% of its average annual income in the event of a downgrade of its senior
debt rating below “BBB+” by more than one rating agency if the stated reason for
the downgrade is related to CH Energy Group or any of Central Hudson’s
affiliates. Further restrictions are imposed for any downgrades below
this level. Central Hudson’s current senior unsecured debt
rating/outlook is ‘A’/stable by both Standard & Poor’s Rating Services
(“Standard & Poor’s”) and Fitch Ratings and ‘A3’/negative by Moody’s
Investors Service (“Moody’s”).1 CH Energy
Group’s other subsidiaries do not have express restrictions on their ability to
pay dividends.
On
September 30, 2009, the Board of Directors of CH Energy Group declared a
quarterly dividend of $0.54 per share, payable November 2, 2009, to shareholders
of record as of October 13, 2009.
__________________
1 These
ratings reflect only the views of the rating agency issuing the rating, are not
recommendations to buy, sell, or hold securities of Central Hudson and may be
subject to revision or withdrawal at any time by the rating agency issuing the
rating. Each rating should be evaluated independently of any other
rating.
Summary
of Regulatory Assets and Liabilities
The
following table sets forth Central Hudson’s regulatory assets and liabilities
(In Thousands):
|
September 30,
|
December 31,
|
September 30,
|
||||||||||
|
|
2009
|
2008
|
2008
|
|||||||||
|
Regulatory Assets (Debits):
|
|
|
|
|||||||||
|
Current:
|
|
|
|
|||||||||
|
Deferred
purchased electric and natural gas costs
|
$ | 26,113 | $ | 41,931 | $ | 34,309 | ||||||
|
Deferred
unrealized losses on derivatives
|
12,707 | 15,759 | 14,080 | |||||||||
|
PSC
tax surcharge
|
15,594 | - | - | |||||||||
|
Revenue
decoupling mechanism ("RDM")
|
5,565 | - | - | |||||||||
|
Residual
natural gas deferred balances
|
3,988 | 2,812 | 3,790 | |||||||||
|
Other
|
90 | - | - | |||||||||
| 64,057 | 60,502 | 52,179 | ||||||||||
|
Long-term:
|
||||||||||||
|
Deferred
pension costs
|
174,723 | (1) | 197,934 | 40,641 | ||||||||
|
Carrying
charges - pension reserve
|
664 | (1) | 10,642 | 9,621 | ||||||||
|
Deferred
costs - MGP site remediation
|
25,840 | (1) | 30,397 | 30,704 | ||||||||
|
Deferred
OPEB costs (Note 10)
|
6,429 | (1) | 4,257 | - | ||||||||
|
Deferred
debt expense on re-acquired debt
|
4,999 | 5,442 | 5,589 | |||||||||
|
Residual
natural gas deferred balances
|
17,533 | 22,825 | 21,909 | |||||||||
|
Income
taxes recoverable through future rates
|
48,989 | 26,874 | 38,312 | |||||||||
|
Storm
costs
|
- | (1) | 3,085 | - | ||||||||
|
Other
|
8,190 | (1) | 10,478 | 10,940 | ||||||||
| 287,367 | 311,934 | 157,716 | ||||||||||
|
Total
Regulatory Assets
|
$ | 351,424 | $ | 372,436 | $ | 209,895 | ||||||
|
Regulatory Liabilities
(Credits):
|
||||||||||||
|
Current:
|
||||||||||||
|
Excess
electric depreciation reserve
|
$ | 16,569 | $ | - | $ | - | ||||||
|
Gas
costs deferred - GSC
|
2,174 | - | - | |||||||||
|
Income
taxes refundable through future rates
|
5,321 | 4,275 | 3,922 | |||||||||
| 24,064 | 4,275 | 3,922 | ||||||||||
|
Long-term:
|
||||||||||||
|
Customer
benefit fund
|
4,043 | 4,266 | 4,496 | |||||||||
|
Deferred
cost of removal
|
47,880 | 47,630 | 49,513 | |||||||||
|
Excess
electric depreciation reserve
|
21,818 | 32,313 | 32,399 | |||||||||
|
Income
taxes refundable through future rates
|
18,318 | 19,756 | 17,732 | |||||||||
|
Deferred
OPEB costs
|
- | (1) | - | 15,505 | ||||||||
|
Carrying
charges - OPEB reserve
|
723 | (1) | 5,633 | - | ||||||||
|
Other
|
8,394 | (1) | 21,295 | 19,688 | ||||||||
| 101,176 | 130,893 | 139,333 | ||||||||||
|
Total
Regulatory Liabilities
|
$ | 125,240 | $ | 135,168 | $ | 143,255 | ||||||
|
Net
Regulatory Assets
|
$ | 226,184 | $ | 237,268 | $ | 66,640 | ||||||
|
(1)
|
Effective
July 1, 2009, Central Hudson offset all or a portion of certain regulatory
assets and liabilities, including full offset of the June 30, 2009
balances for Carrying charges - OPEB reserve, Carrying charges - pension
reserve and Storm costs in accordance with the 2009 Rate
Order.
|
The
significant regulatory assets and liabilities include:
PSC tax
surcharge: In the third quarter of 2009, Central Hudson paid
$17.7 million to the PSC for a new tax surcharge instituted in April
2009. This charge represented a full year assessment; however, $2.1
million of this surcharge has been collected from customers as of September 30,
2009. The remainder is being collected over the next six
months. In March 2010, Central Hudson will begin making bi-annual
installments of approximately $8.9 million for this surcharge and will collect
the amounts from customers in the subsequent six month period.
RDM: The
2009 Rate Order authorized a revenue decoupling mechanism as part of the rate
increase which allows Central Hudson to recognize revenues at the level approved
in rates for most of Central Hudson’s electric customer classes and recognized
sales at the approved level per customer in rates for most of Central Hudson’s
gas customer classes.
Storm
Costs: The 2009 Rate Order authorized the recovery of
restoration costs incurred by the Company related to an ice storm in December
2008 through an offset against certain electric regulatory liability
balances.
Excess Electric Depreciation
Reserve: Per the 2009 Rate Order, $8.8 million of additional
excess electric depreciation reserve was transferred in July
2009. The transfer represented a portion of the electric depreciation
reserve that was in excess of the theoretical book reserve based on depreciation
rates approved by the PSC in 2009. The 2009 Rate Order prescribed the
use of the Excess Electric Depreciation Reserve to offset certain electric
regulatory assets and liabilities. As a result of these adjustments,
the Excess Electric Depreciation Reserve increased by $9.9
million. The remainder is to be used for authorized rate
moderation.
Residual Natural Gas
Deferred Balances: Per the 2009 Rate Order, certain gas
regulatory assets and liabilities were identified for offset, resulting in a net
regulatory asset balance. Additionally, $2.8 million of excess gas
depreciation reserve identified by the PSC was transferred as a reduction to
this balance. As a result of the 2009 Rate Order adjustments, the
Residual Natural Gas Deferred Balance increased by $0.1 million. The
remaining balance is to be amortized over a five-year period beginning July 1,
2009.
2009
Rate Order
From July
1, 2009 through June 30, 2010, Central Hudson operates under the terms of the
2009 Rate Order, which provides for the following:
|
|
·
|
Electric
delivery increase of $39.6 million moderated by a $20.0 million customer
bill credit from the excess depreciation
reserve.
|
|
|
·
|
Natural
gas delivery increase of $13.8
million.
|
|
|
·
|
Delivery
rates based on a ROE of 10.0%.
|
|
|
|
|
·
|
Common
equity layer of 47% of permanent
capital.
|
|
|
·
|
RDM
for both electric and gas delivery
service.
|
|
|
·
|
Continued
funding for the full recovery of the Company’s current pension and OPEB
costs and continues deferral authorization for pensions, OPEBs, research
and development costs, stray voltage testing, MGP site remediation
expenditures and electric and gas supply cost recovery and variable rate
debt.
|
|
|
·
|
New
deferral authorizations for: fixed debt costs; the costs to bring electric
lines into compliance with current height above ground requirements; and
the New York State Temporary
Assessment.
|
|
|
·
|
Continuation,
with minor modifications, of the Company’s Electric Reliability, Gas
Safety and Customer Service performance
mechanisms.
|
|
|
·
|
Recovery
through offset against a deferred liability account (non-cash) of the $3.3
million in incremental storm restoration costs incurred from the December
2008 ice storm.
|
NOTE 3 - NEW ACCOUNTING
STANDARDS AND OTHER FASB PROJECTS
New
accounting standards are summarized below, and explanations of the underlying
information for all standards (except those not currently applicable to CH
Energy Group and its subsidiaries) follow the chart.
|
Category
|
Codification
Reference
|
Former
Reference
|
Title
|
Issued
Date
|
Effective
Date
|
|||||
|
Under
Assessment(1)
|
||||||||||
|
Variable
Interest Entities
|
|
SFAS
No. 167
|
|
N/A
|
|
Amendments
to ASC 810-10-25-38 (formerly FIN 46(R))
|
|
Jun-09
|
|
Jan-10
|
|
Postretirement
Benefit Plan Assets
|
|
ASC
715-20-65-2
|
|
FSP
No. FAS 132(R)-1
|
|
Employers'
Disclosures about Postretirement Benefit Plan Assets
|
|
Dec-08
|
|
Dec-09
|
|
Fair
Value Measurement
|
|
ASU
No. 2009-05
|
|
N/A
|
|
Amendments
to ASC 820-10 - Fair Value Measurements and Disclosures-Overall, for the
fair value measurement of liabilities
|
|
Aug-09
|
|
Dec-09
|
|
Implemented(2)
|
|
|
|
|
|
|
|
|||
|
GAAP
Hierarchy
|
|
SFAS
No. 168
|
|
N/A
|
|
The
FASB Accounting Standards Codification and the Hierarchy of Generally
Accepted Accounting Principles - a replacement of SFAS No.
162
|
|
Jun-09
|
|
Sep-09
|
|
Subsequent
Events
|
|
ASC
855
|
|
SFAS
No. 165
|
|
Subsequent
Events
|
|
May-09
|
|
Jun-09
|
|
Business
Combinations
|
|
ASC
805
|
|
FSP
No. FAS 141(R)-1
|
|
Business
Combinations (encompassing Accounting for Assets Acquired and Liabilities
Assumed in a Business Combination That Arise from
Contingencies)
|
|
Apr-09
|
|
Jan-09
|
|
Fair
Value Measurement
|
|
ASC
820
|
|
FSP
No. FAS 157-4
|
|
Fair
Value Measurements and Disclosures (encompassing Determining Fair Value
When the Volume and Level of Activity for the Asset or Liability Have
Significantly Decreased and Identifying Transactions That Are Not
Orderly)
|
|
Apr-09
|
|
Jun-09
|
|
Other-Than-Temporary-Investments
|
|
ASC
320
|
|
FSP
No. FAS 115-2 and FAS 124-2
|
|
Investments
- Debt and Equity Securities (encompassing Recognition and Presentation of
Other-Than-Temporary Impairments)
|
|
Apr-09
|
|
Jun-09
|
|
Financial
Instruments
|
|
ASC
825
|
|
FSP
No.
FAS
107-1 and APB 28-1
|
|
Financial
Instruments (encompassing Interim Disclosures about Fair Value of
Financial Instruments)
|
|
Apr-09
|
|
Jun-09
|
|
Equity
Method Investments
|
|
ASC
323-10
|
|
EITF
Issue No. 08-6
|
|
Investments
- Equity Method (formerly Equity Method Investment Accounting
Considerations)
|
|
Nov-08
|
|
Jan-09
|
|
Liabilities
Measured at Fair Value
|
|
ASC
820
|
|
EITF
Issue No. 08-5
|
|
Fair
Value Measurement and Disclosures (encompassing Issuer's Accounting for
Liabilities Measured at Fair Value with a Third-Party Credit
Enhancement)
|
|
Sep-08
|
|
Jan-09
|
|
Credit
Derivatives
|
|
ASC
815-10-65-2
|
|
FSP
No.
FAS
133-1 and
FIN
45-4
|
|
Disclosures
About Credit Derivatives and Certain Guarantees: An Amendment
of FASB Statement No. 133 and FASB Interpretation No. 45; and
Clarification of the Effective Date of FASB Statement No.
161
|
|
Sep-08
|
|
Jan-09
|
|
Derivative
Instruments
|
|
ASC
815
|
|
SFAS
No. 161
|
|
Derivatives
and Hedging (encompassing Disclosures About Derivative Instruments and
Hedging Activities)
|
|
Mar-08
|
|
Jan-09
|
|
Share-Based
Payments
|
|
ASC
260-10-55
|
|
FSP
No.
EITF
03-6-1
|
|
Participating
Share-Based Payment Awards (formerly Determining Whether Instruments
Granted in Share-Based Payment Transactions are Participating
Securities)
|
|
Jun-08
|
|
Jan-09
|
|
Business
Combinations
|
|
ASC
805
|
|
SFAS
No. 141R
|
|
Business
Combinations (formerly Business Combinations - Revised)
|
|
Dec-07
|
|
Jan-09
|
|
Noncontrolling
Interests
|
|
ASC
810-10-65-1
|
|
SFAS
No. 160
|
|
Transition
Related to FASB Statement No. 160, Noncontrolling Interests in
Consolidated Financial Statements - an amendment of ARB No. 51 (formerly
Noncontrolling Interest in Consolidated Financial
Statements)
|
|
Dec-07
|
|
Jan-09
|
|
Intangible
Assets
|
|
ASC
350-30
|
|
FSP
No. FAS 142-3
|
|
General
Intangibles Other than Goodwill (encompassing Determining the Useful Life
of Intangible Assets)
|
|
Nov-07
|
|
Jan-09
|
|
Not Currently
Applicable(3)
|
|
|
|
|
|
|
|
|||
|
Financial
Assets
|
|
SFAS
No. 166
|
|
N/A
|
|
Accounting
for Transfers of Financial Assets - an amendment of FAS
140
|
|
Jun-09
|
|
Jan-10
|
Impact
Key:
1 - No
significant impact on the financial condition, results of operations and cash
flows of CH Energy Group and its subsidiaries expected.
2 -
Following the chart, the impacts are separately disclosed as of standard
effective dates.
3 - No
current impact on the financial condition, results of operations and cash flows
of CH Energy Group and its subsidiaries.
Standards
Under Assessment
SFAS No.
167 amends ASC 810-10-25-38, Consolidation Based on Variable
Interests (formerly FASB
Interpretation No. 46(R), Consolidation of Variable Interest
Entities). This Statement
requires an enterprise involved with variable interest entities to perform an
analysis to determine whether the enterprise’s variable interest or interests
give it a controlling financial interest in the variable interest entity. This Statement
is effective for annual reporting periods beginning after November 15,
2009. SFAS No. 167 has not been superseded by the FASB Accounting
Standards Codification. It is not expected that this Statement will
have a significant impact on the Company.
ASC
715-20-65-2 (formerly FASB Staff Position (“FSP”) No. FAS 132(R)-1) provides
guidance on an employer’s disclosures about plan assets of a defined benefit
pension or other post-retirement plan. The ASC defines the objectives
of the disclosures as providing users of the financial statements with an
understanding of how investment allocation decisions are made, pertinent factors
of investment policies and strategies, major categories of plan assets, inputs
and valuation techniques used to measure the fair value of plan assets, the
effect of fair value measurements using significant unobservable inputs on
changes in the plan assets for the period, and significant concentrations of
credit risk within plan assets. In accomplishing these objectives,
expanded disclosures related to pension and other post-retirement benefit plans
will be made beginning for fiscal periods ending after December 15,
2009. It is not expected that this ASC will have a significant impact
on the Company.
ASU No.
2009-05, an update to ASC 820-10, Fair Value Measurements and
Disclosures-Overall, for the fair value measurements of liabilities,
establishes a hierarchy of valuation techniques preferred and defines that the
restrictions on the transfer of liabilities do not need to be considered in
assessing the fair value of liabilities. This update is effective for
fiscal periods ending after December 15, 2009. It is not expected
that this ASU will have a significant impact on the Company.
Standards
Implemented
SFAS No.
168 (which was not superseded by FASB Accounting Standards Codification)
identifies the FASB Accounting Standards Codification as the source of
authoritative US Generally Accepted Accounting Principles (“GAAP”) recognized by
FASB for nongovernmental entities. SFAS No. 168 supersedes SFAS No.
162 by defining the Codification as the only authoritative
GAAP. There was no significant impact on the Company upon adoption of
this standard.
ASC 855
(formerly SFAS No. 165) provides general standards of accounting for and
disclosure of events that occur after the balance sheet date but before
financial statements are issued or available to be issued. CH Energy
Group implemented this standard for interim reporting periods ending June 30,
2009. There was no significant impact on the Company upon adoption of
this standard.
ASC 805
(formerly FSP No. FAS 141(R)-1) includes amendments to and clarifies application
issues regarding the accounting and disclosure provisions for contingencies in
FASB Statement No. 141 (R), Business
Combinations. This ASC includes amendments to Statement 141(R)
by replacing the guidance on the initial recognition and measurements of assets
and liabilities arising from contingencies acquired or assumed in business
combinations. CH Energy Group implemented ASC 805 (formerly FSP No.
141(R)-1) upon its issuance. There was no significant impact on the
Company upon adoption of this standard.
ASC 820
(which encompasses FSP No. FAS 157-4) provides factors that should be considered
in determining whether there has been a significant decrease in the volume and
level of activity for an asset or liability and guidance on additional analysis
that may be necessary as a result in estimating fair value in accordance with
ASC 820. This ASC also includes guidance on identifying circumstances
that indicate whether a transaction is considered orderly. There was
no significant impact on the Company upon adoption of this
ASC. Management cannot predict what impact, if any, this ASC will
have on future valuations.
ASC 320
(which encompasses FSP No. FAS 115-2 and FAS 124-2) amends the
other-than-temporary impairment guidance relating to debt securities classified
as available-for-sale or held-to-maturity in accordance with FAS 115, Accounting for Certain Investments
in Debt and Equity Securities, which is superseded by the
ASC. The objective of this ASC is to improve the presentation and
disclosure of other-than-temporary impairments in the financial
statements. CH Energy Group implemented this ASC for the interim
reporting period ended June 30, 2009. There was no significant impact
on the Company upon adoption of this ASC.
ASC 825,
Financial Instruments, encompasses FSP No. FAS 107-1 and
APB 28-1 amends SFAS No. 107, Disclosures about Fair Value of
Financial Instruments, to require disclosures about the fair value of
financial instruments for interim reporting periods, in addition to the annual
disclosures previously required. This ASC also amends APB Opinion No. 28, Interim Financial Reporting,
to require those disclosures in summarized financial information at interim
reporting periods. CH Energy Group implemented this ASC for the
interim reporting period ended June 30, 2009 and the additional required interim
disclosures have been incorporated in Note 15 – “Fair Value
Measurements”. There was no significant impact on the Company upon
adoption of this FSP.
ASC
323-10 (formerly Emerging Issues Task Force (“EITF”) Issue No. 08-6) provides
guidance related to certain accounting considerations for equity method
investments. Specifically, this guidance clarifies the accounting
guidance on issues related to the determination of the initial carrying value of
an equity method investment, the performance of impairment assessments of
underlying indefinite-lived intangible assets of an equity method investment,
the accounting for the issuance of shares by an equity method investment, and
the accounting for a change in an investment from the equity method to the cost
method. CH Energy Group implemented ASC 323-10 on January 1,
2009. There was no significant impact on the Company upon adoption of
this ASC.
ASC 820
encompasses EITF Issue No. 08-5 which clarifies that the issuer of a liability
with a third-party credit enhancement that is inseparable from the liability
shall not include the effect of the credit enhancement in the fair value
measurement of the liability, but the issuer should discuss the existence of
this third-party credit enhancement. There was no significant impact
on the Company upon adoption of this ASC.
ASC
815-10-65-2 (formerly FSP No. FAS 133-1 and FIN 45-4) require more detailed
disclosures about credit derivatives, including the potential adverse effects of
changes in credit risk on the financial position, financial performance, and
cash flows of the sellers of the instruments. ASC 815, Derivatives and Hedging,
replaces SFAS No. 133, Accounting for Derivative
Instruments and Hedging Activities, to require increased disclosures by
sellers of credit derivatives, including credit derivatives embedded in hybrid
instruments. The ASC also encompasses FIN 45, Guarantor’s Accounting and
Disclosure Requirements for Guarantees, Including Indirect Guarantees of
Indebtedness to Others, to require an additional disclosure about the
current status of the payment or performance risk of a
guarantee. There was no significant impact on the Company upon
adoption of this ASC.
ASC 815
encompasses SFAS No. 161 and requires entities to provide qualitative
disclosures about the objectives and strategies for using derivatives, and
quantitative data about the fair value of and gains and losses on derivative
contracts. ASC 815 also requires more information about the location
and amounts of derivative instruments in financial statements, how derivatives
are accounted for under the ASC, and how hedges affect the entity's financial
position, financial performance and cash flows. For more information,
see Note 14 – “Accounting for Derivative Instruments and Hedging
Activities”. There was no significant impact on the Company upon
adoption of this standard.
ASC
260-10-55 (formerly FSP No. EITF 03-6-1) clarifies that instruments granted in
share-based payment transactions are considered participating securities prior
to vesting if they contain non-forfeitable rights to dividends or dividend
equivalents and therefore need to be included in the computation of EPS under
the two-class method described in SFAS No. 128, Earnings Per Share, which was
superseded by ASC 260, encompassing both the FSP and SFAS. There was
no significant impact on the Company upon adoption of this ASC.
ASC 805
(formerly SFAS No. 141R) requires that acquisition-related costs be expensed in
the period incurred and can no longer be capitalized and included as a cost of
the acquired business. The objective of ASC 805 is to improve the
relevance, representational faithfulness, and comparability of the information
that an entity provides in its financial reports about a business combination
and its effects. This standard applies to all transactions or events in which an
entity obtains control of one or more businesses, and to combinations achieved
without the transfer of consideration. There was no significant
impact on the Company upon adoption of this standard.
ASC
810-10-65-1 (formerly SFAS No. 160) amends Accounting Research Bulletin (“ARB”)
51 to establish accounting and reporting standards for the non-controlling
interest in a subsidiary and for the deconsolidation of a
subsidiary. It clarifies that a non-controlling interest in a
subsidiary is an ownership interest in the consolidated entity that should be
reported as equity in the consolidated financial statements. The
objective of ASC 810-10-65-1 is to improve the relevance, comparability and
transparency of the financial information that an entity provides in its
consolidated financial statements. There was no significant impact on
the Company upon adoption of this standard.
ASC
350-30 (formerly FSP No. FAS 142-3) amends the factors that should be considered
in developing renewal or extension assumptions used to determine the useful life
of recognized intangible assets under SFAS No. 142, Goodwill and Other Intangible
Assets, which was superseded by ASC 350. The guidance is
intended to improve consistency between the recognized useful asset life, and
the period of expected cash flows used to measure the fair value of the
asset. There was no significant impact on the Company upon adoption
of this FSP.
NOTE 4 – INCOME
TAX
ASC 740,
Income Taxes,
supersedes FIN 48 which clarified the accounting for uncertainty in income taxes
recognized in an entity’s financial statements in accordance with SFAS 109,
titled Accounting for Income
Taxes, also superseded by the ASC. As there are no uncertain
tax positions, no interest or penalties have been recorded in the financial
statements. If CH Energy Group and its subsidiaries incur any
interest or penalties on underpayment of income taxes, the amounts would be
included on the line “Other liabilities” on the Consolidated Balance Sheet and
on the line “Other – net” on the Consolidated Statement of Income. CH
Energy Group and its subsidiaries file a consolidated Federal and New York State
income tax return, which represents the major tax jurisdictions of CH Energy
Group. The statute of limitations for federal tax years 2006 through
2008 are still open for audit and tax years 2007 and 2008 are currently under
audit. The New York State income tax return is currently open for
audit for tax years 2006 through 2008.
NOTE 5 - ACQUISITIONS AND
INVESTMENTS
Acquisitions
During
the nine months ended September 30, 2009, CH Energy Group and its subsidiaries
made no acquisitions.
Investments
CHEC
holds a 12% interest in preferred equity units plus subordinated notes issued by
Cornhusker Holdings. Cornhusker Holdings is the owner of Cornhusker
Energy Lexington, LLC (“CEL”), a fuel ethanol production facility located in
Nebraska that began operation as of the end of January 2006. This
investment is accounted for under the equity method. As of September
30, 2009, CHEC’s total investment in Cornhusker consisted of subordinated notes
totaling $10.2 million, including interest, and an equity investment of $2.2
million. In response to the continuation of lower than expected crush
margins, Management stopped accruing interest income on the subordinated debt
and will record such interest on the cash basis until the current outstanding
balance of interest has been paid. The recoverability of the
Company’s total investment in Cornhusker Holdings is predicated on CEL achieving
sufficient positive cash flow to repay the notes receivable, as indicated in
CEL’s cash flow forecast. If CEL does not achieve sufficient positive
cash flow, the investment and notes receivable may become
impaired. CEL re-negotiated the deadline in its senior note agreement
for completing the expansion of the plant’s capacity and output to December 31,
2009. Management expects the expansion of the plant’s capacity to be
completed by that date, but believes the output required under the terms of the
note agreement may not be achieved until the first quarter of
2010. If the expanded output is not achieved by December 31, 2009
(and following any cure period as provided for under the terms of the
agreement), CEL may request a waiver to extend the deadline, and if CEL is
unable to obtain a waiver by December 31, 2009, the senior note holder may have
the right to accelerate all amounts due under the senior note.
In the
fourth quarter of 2007, CHEC’s subsidiary, CH-Auburn Energy, LLC (“CH-Auburn”),
entered into a 15-year Energy Services Agreement (“ESA”) to supply the City of
Auburn, NY (the “City”) with a portion of its electricity needs by constructing
and operating a 3-megawatt electric generating plant in Auburn that will burn
gas derived from wastewater sludge and a landfill to generate renewable
power. Under the agreement with the City as renegotiated on March 31,
2009, the project will utilize methane gas generated by the City of Auburn
landfill to produce and sell electricity to the City. A second phase
digester portion of the project was eliminated from the restructured project,
but may be reinitiated by the City at a later time. Project permits
were received and site construction began in August 2009. As of
September 30, 2009, CH-Auburn has incurred approximately $4.4 million of design
and construction costs related to this investment. CH-Auburn is
consolidated in the Consolidated Financial Statements of CH Energy
Group.
In June
2007, CHEC made a $1.2 million loan to Buckeye Biopower, LLC (“Buckeye”) for
development of a corn-ethanol plant. Since receipt of the loan
from CHEC, the developers have entered into a lease for a site, and a Letter of
Intent to provide engineering, procurement and construction for the
plant. In June 2008, the developers paid CHEC all interest owed on
the loan for the initial term and extended the term of the loan for one
additional year. Current low crush margins for corn-to-ethanol plants
and credit market conditions have made the arrangement of construction financing
difficult. CHEC’s Management has notified the developers that the
loan is past due and has recorded a reserve for the full outstanding
balance.
In April
2009, CHEC’s subsidiary, CH-Greentree, LLC (“CH-Greentree”) entered into an
agreement to invest $5.5 million in the acquisition, construction and
installation of a molecular gate for lease to Beacon Landfill Gas Holdings
(“Beacon”) at Beacon’s currently operating landfill gas processing plant at the
Greentree landfill in western Pennsylvania. The molecular gate is
used to remove nitrogen from the landfill gas produced by the Greentree facility
thereby increasing its energy content and quality, thus allowing Beacon to sell
more of its landfill gas output. The term of the lease is seven years
and construction was substantially complete on June 30,
2009. CH-Greentree is consolidated in the Consolidated Financial
Statements of CH Energy Group.
NOTE 6 - GOODWILL AND OTHER
INTANGIBLE ASSETS
Intangible
assets include separate, identifiable, intangible assets such as customer
relationships, trademarks, and covenants not to compete. Intangible
assets with finite lives are amortized over their useful lives. The
estimated useful life for customer relationships is 15 years, which is believed
to be appropriate in view of average historical customer
attrition. The estimated useful lives of trademarks range from 10 to
15 years and are based upon Management’s assessment of several variables such as
brand recognition, Management’s plan for the use of the trademark, and other
factors that will affect the duration of the trademark’s life. The
useful life of a covenant not to compete is based on the expiration date of the
covenant, generally between three and ten years. Intangible assets
with indefinite useful lives and goodwill are no longer amortized, but instead
are periodically reviewed for impairment. Griffith tests the goodwill
and intangible assets remaining on the balance sheet for impairment annually in
the fourth quarter, and retests between annual tests if an event should occur or
circumstances arise that would more likely than not reduce the fair value below
its carrying amount. Amortization expense was $1.0 million and $1.1
million for the three-month periods ended September 30, 2009 and 2008,
respectively. Amortization expense was $3.1 million for both of the
nine-month periods ended September 30, 2009 and 2008,
respectively. The estimated annual amortization expense for each of
the next five years, assuming no new acquisitions, is approximately $4.0
million. The carrying amount for goodwill was $67.5 million as of
September 30, 2009, $67.5 million as of December 31, 2008, and was $67.6 million
as of September 30, 2008. For tax purposes, goodwill is amortized
ratably over a 15-year period, beginning in the month of
acquisition.
The
weighted average amortization periods for customer relationships, trademarks and
covenants not to compete are 15 years, 11 years, and 8.9 years,
respectively. The weighted average amortization period for all
amortizable intangible assets is 14.6 years.
The
components of amortizable intangible assets of CH Energy Group are summarized as
follows (In Thousands):
|
|
September 30,
2009
|
December 31,
2008
|
September 30,
2008
|
|||||||||||||||||||||
|
|
Gross
Carrying Amount
|
Accumulated
Amortization
|
Gross
Carrying Amount
|
Accumulated
Amortization
|
Gross
Carrying Amount
|
Accumulated
Amortization
|
||||||||||||||||||
|
Customer
relationships
|
$ | 55,166 | $ | 25,007 | $ | 55,171 | $ | 22,248 | $ | 55,141 | $ | 21,328 | ||||||||||||
|
Trademarks
|
2,956 | 578 | 2,956 | 372 | 2,956 | 300 | ||||||||||||||||||
|
Covenants
not to compete
|
1,605 | 1,136 | 1,605 | 983 | 1,660 | 1,092 | ||||||||||||||||||
|
Total
Amortizable Intangibles
|
$ | 59,727 | $ | 26,721 | $ | 59,732 | $ | 23,603 | $ | 59,757 | $ | 22,720 | ||||||||||||
NOTE 7 - SHORT-TERM
BORROWING ARRANGEMENTS
CH Energy
Group maintains a $150 million revolving credit facility with several commercial
banks to provide committed liquidity. This facility’s term expires in
February 2013. As of September 30, 2009 and December 31, 2008, there
were no borrowings under this facility. As of September 30, 2008, the
loan outstanding under this facility was $15.0 million. The notes payable
balances reported in the CH Energy Group Consolidated Balance Sheet reflect the
borrowings of CH Energy Group’s subsidiaries as of September 30, 2009, December
31, 2008 and September 30, 2008, as discussed below.
Central
Hudson maintains a revolving credit facility with several commercial banks,
pursuant to PSC authorization, in the amount of $125 million, for a five-year
term ending January 2, 2012. As of September 30, 2009 and December
31, 2008, there were no borrowings under this agreement. As of September 30,
2008, $15.0 million was outstanding under this facility.
Both the
CH Energy Group and Central Hudson credit facilities reflect commitments from
JPMorgan Chase Bank, N.A., Bank of America, N.A., HSBC Bank USA, N.A. and
KeyBank National Association. If these lenders are unable to fulfill
their commitments under these facilities, funding may not be available as
needed.
Central
Hudson also maintains certain uncommitted lines of credit that diversify its
sources of cash and provide competitive options to minimize its cost of
short-term debt. As of September 30, 2009, December 31, 2008 and
September 30, 2008, Central Hudson’s outstanding balance on these lines of
credit, in aggregate was $17.0 million, $25.5 million and $21.5 million,
respectively.
On March
27, 2009, Central Hudson filed with the PSC a Financing Petition seeking
authorization to increase its multi-year committed credit to $175 million and to
issue up to $250 million of long-term debt through December 31,
2012. An Order was issued on September 22, 2009. The Order
authorizes Central Hudson to seek a higher level of committed credit, which will
enable greater liquidity to support construction forecasts, known seasonality,
volatile energy markets, adverse borrowing environments, and other unforeseen
events.
On
January 18, 2008, Griffith established an uncommitted line of credit of up to
$25 million with a commercial bank for the purpose of funding seasonal working
capital, and for general corporate purposes. Under the terms of the
line, the maximum amount that could be outstanding was $25 million during the
period between December 1st of
each year and May 31st of
each following year, and $15 million during the period between June 1st and
November 30th of
each year. On April 30, 2009, Griffith Management allowed its
uncommitted line of credit to expire. As of December 31, 2008, there
were borrowings under this agreement of $10.0 million. There were no
borrowings under this agreement as of September 30, 2008. The
obligations of Griffith under the line of credit were guaranteed by CH Energy
Group and CHEC.
NOTE 8 – CAPITALIZATION –
COMMON AND PREFERRED STOCK
There
were no repurchases of common or preferred stock in the nine months ended
September 30, 2009.
In April
2009, CH Energy Group invested $25 million in Central Hudson, which was recorded
as additional paid-in capital. Central Hudson paid no common stock
dividends in the first nine months of 2009.
NOTE 9 – CAPITALIZATION -
LONG-TERM DEBT
On April
17, 2009, CH Energy Group entered into a Note Purchase Agreement to issue and
sell, in a private placement exempt from registration under the Securities Act
of 1933, $50 million of senior unsecured notes. The notes bear interest at the
rate of 6.58% per annum and mature on April 17, 2014. CH Energy Group completed
the sale of $35 million in principal amount of the notes on April 17, 2009, and
$15 million in principal amount on June 15, 2009. CH Energy Group
will use the proceeds from the sale of the notes to repay short-term debt and
for general corporate purposes.
On
September 30, 2009, Central Hudson issued $24 million of 30-year, 5.80% Series F
notes. The proceeds from this issuance will be used for general corporate
purposes including the pay down of short-term debt outstanding, funding
construction expenditures and working capital requirements. The current rating
and outlook on these bonds and Central Hudson’s other senior unsecured debt is
‘A’/stable by Standard & Poor’s and Fitch Ratings and ‘A3’/negative by
Moody’s. 2 Central
Hudson has $20 million remaining on its Series F notes, but does not expect to
issue additional notes in 2009.
___________________
2These
ratings reflect only the views of the rating agency issuing the rating, are not
recommendations to buy, sell, or hold securities of Central Hudson and may be
subject to revision or withdrawal at any time by the rating agency issuing the
rating. Each rating should be evaluated independently of any other
rating.
On
September 9, 2009, Moody’s downgraded Central Hudson’s senior unsecured debt and
issuer ratings to ‘A3’ from ‘A2’. Moody’s has stated that the downgrade was due
to weakness in the company’s financial performance through the twelve months
ended June 30, 2009. Moody’s maintained the outlook at negative to
reflect the current weakness in financial metrics and the company’s ongoing need
for rate relief to support planned capital expenditures. The
downgrade is not expected to have a material impact on Central Hudson’s
financial performance.
NYSERDA
Central
Hudson has five debt series that were issued in conjunction with the sale of
tax-exempt pollution control revenue bonds by New York State Energy Research and
Development Authority (“NYSERDA”). These NYSERDA bonds, totaling $166
million, are insured by Ambac Assurance Corporation (“Ambac”). The
current underlying rating and outlook on these bonds and Central Hudson’s other
senior unsecured debt is ‘A’/stable by Standard & Poor’s and Fitch Ratings
and ‘A3’/negative by Moody’s.3
Central
Hudson’s 1998 NYSERDA Series A Bonds, totaling $16.7 million, were re-marketed
on December 1, 2008. Under the terms of the applicable indenture,
Central Hudson converted the bonds to a fixed rate of 6.5% which will continue
until their maturity in December 2028. Prior to the December 1, 2008
re-marketing, the bonds bore interest at 3.0%.
Central
Hudson’s 1999 NYSERDA Series A Bonds, totaling $33.4 million, have an interest
rate that is fixed to maturity in 2027 at 5.45%.
_____________________
3These
ratings reflect only the views of the rating agency issuing the rating, are not
recommendations to buy, sell, or hold securities of Central Hudson and may be
subject to revision or withdrawal at any time by the rating agency issuing the
rating. Each rating should be evaluated independently of any other
rating.
Central
Hudson’s 1999 NYSERDA Bonds, Series B, C, and D, totaling $115.9 million, are
multi-modal bonds that are currently in auction rate mode. Beginning
in 1999 when the bonds were issued, the bonds’ interest rate has been reset
every 35 days in a Dutch auction. Auctions in the market for
municipal auction rate securities have experienced widespread failures since
early in 2008. Generally, an auction failure occurs because there is
an insufficient level of demand to purchase the bonds and the bondholders who
want to sell must hold the bonds for the next interest rate
period. Since February 2008, all auctions for Central Hudson’s three
series of auction rate bonds have failed. As a consequence, the
interest rate paid to the bondholders has been set to the then prevailing
maximum rate defined in the trust indenture. Central Hudson’s maximum
rate results in interest rates that are generally higher than expected results
from the auction process. For the foreseeable future, Central Hudson
expects the interest rate to be set at the maximum rate, determined on the date
of each auction as 175% of the yield on an index of tax-exempt short-term debt,
or its approximate equivalent. In the third quarter of 2009, the
average maximum rate applicable on the bonds was 0.65%. In its
Orders, the PSC has authorized deferral accounting treatment for the interest
costs from Central Hudson’s three series of variable rate 1999 NYSERDA
Bonds. As a result, variations in interest rates on these bonds are
deferred for future recovery from or refund to customers and Central Hudson does
not expect the auction failures to have any adverse impact on
earnings. To mitigate the potential impact of unexpected increases in
short-term interest rates, Central Hudson purchases interest rate caps based on
an index for short-term tax-exempt debt. Central Hudson replaced the cap that
expired on March 31, 2009 with a one-year cap, effective April 1, 2009 set at
4.375%. The cap is based on the monthly weighted average of an index
of tax-exempt variable rate debt, multiplied by 175% to align with the maximum
rate formula of the three series of variable rate 1999 NYSERDA
Bonds. Central Hudson would receive a payout if the bonds reset at
rates above 4.375%. During the third quarter of 2009, the average did
not exceed the cap rate and therefore no payments were received.
Central
Hudson is currently evaluating what actions, if any, it may take in the future
in connection with its 1999 NYSERDA Bonds, Series B, C and
D. Potential actions may include converting the debt from auction
rate to another interest rate mode or refinancing with taxable
bonds.
On March
27, 2009, Central Hudson filed with the PSC a Financing Petition seeking
authorization to increase its multi-year committed credit to $175 million and to
issue up to $250 million of long-term debt through December 31,
2012. An Order was issued on September 22, 2009. The Order
authorizes Central Hudson to issue and sell $250 million of long-term debt to
finance its construction expenditures, refund maturing long-term debt, and
potentially refinance its 1999 NYSERDA Bonds, Series B, C and
D. Central Hudson plans to register a new series of notes pursuant to
the authority granted by the PSC.
NOTE 10 - POST-EMPLOYMENT
BENEFITS
Central
Hudson provides certain health care and life insurance benefits for retired
employees through its post-retirement benefit plans. Managerial,
professional and supervisory employees (“non-union”) hired prior to January 1,
2008, may become eligible for these benefits if they reach retirement age while
employed by Central Hudson. In order to reduce the total costs of
these benefits, other post-retirement benefit (“OPEB”) plan changes were
negotiated with the IBEW Local 320 for unionized employees and certain retired
employees effective May 1, 2008. Plans were also amended to eliminate
post-retirement benefits for union employees hired on or after May 1,
2008.
The
following are the components of Central Hudson’s net periodic benefit costs for
its pension and OPEB plans for the three and nine months ended September 30,
2009 and 2008 (In Thousands):
|
Pension
Benefits
|
OPEB(1)
|
|||||||||||||||
|
Three
Months Ended
September 30,
|
Three
Months Ended
September 30,
|
|||||||||||||||
|
2009
|
2008
|
2009
|
2008
|
|||||||||||||
|
Service
cost
|
$ | 1,956 | $ | 1,942 | $ | 518 | $ | 513 | ||||||||
|
Interest
cost
|
6,455 | 6,238 | 1,792 | 1,862 | ||||||||||||
|
Expected
return on plan assets
|
(4,969 | ) | (7,578 | ) | (1,271 | ) | (1,774 | ) | ||||||||
|
Amortization
of:
|
||||||||||||||||
|
Prior
service cost (credit)
|
544 | 517 | (1,467 | ) | (1,571 | ) | ||||||||||
|
Transitional
obligation (asset)
|
- | - | 642 | 642 | ||||||||||||
|
Recognized
actuarial loss
|
6,350 | 3,102 | 2,208 | 1,687 | ||||||||||||
|
Net
Periodic Benefit Cost
|
$ | 10,336 | $ | 4,221 | $ | 2,422 | $ | 1,359 | ||||||||
|
Pension
Benefits
|
OPEB(1)
|
|||||||||||||||
|
Nine
Months Ended
September 30,
|
Nine
Months Ended
September 30,
|
|||||||||||||||
|
2009
|
2008
|
2009
|
2008
|
|||||||||||||
|
Service
cost
|
$ | 5,870 | $ | 5,826 | $ | 1,556 | $ | 1,540 | ||||||||
|
Interest
cost
|
19,365 | 18,716 | 5,374 | 5,586 | ||||||||||||
|
Expected
return on plan assets
|
(14,907 | ) | (22,734 | ) | (3,813 | ) | (5,322 | ) | ||||||||
|
Amortization
of:
|
||||||||||||||||
|
Prior
service cost (credit)
|
1,632 | 1,551 | (4,401 | ) | (4,713 | ) | ||||||||||
|
Transitional
obligation (asset)
|
- | - | 1,924 | 1,925 | ||||||||||||
|
Recognized
actuarial loss
|
19,050 | 9,306 | 6,626 | 5,061 | ||||||||||||
|
Net
Periodic Benefit Cost
|
$ | 31,010 | $ | 12,665 | $ | 7,266 | $ | 4,077 | ||||||||
|
(1)
|
The
OPEB amounts for both years reflect the effect of the Medicare
Prescription Drug Improvement and Modernization Act of 2003 under the
provision of ASC 715-60, Defined Benefit Plans – Other Postretirement
(encompassing FSP No. FAS 106-2, titled Accounting and Disclosure
Requirements Related to the Medicare Prescription Drug, Improvement and
Modernization Act of 2003).
|
In
accordance with the measurement date provisions of ASC 715-20 (formerly SFAS
158), Central Hudson changed its measurement date for its pension plan (the
“Retirement Plan”) from September 30 to December 31 for its financial statements
for the year ended December 31, 2008. Central Hudson elected the
“15-month-transition approach” and recorded an adjustment in the first quarter
of 2008 to recognize the effects of the change in measurement
date. This adjustment represented 3/15ths of the net periodic pension
cost determined for the period from October 1, 2007 to December 31, 2008; the
remaining 12/15ths of the net periodic pension cost was recorded over the twelve
months ended December 31, 2008. The recording of this adjustment
increased Central Hudson’s pension liability by $0.4 million, comprised of the
following components (In Thousands):
|
Adjustment
for 3/15ths of net periodic pension costs
|
$ | 2,788 | ||
|
Adjustment
for amortization of prior service costs and actuarial losses (1)
|
(2,426 | ) | ||
|
Net
increase to pension liability
|
$ | 362 |
|
(1)
|
Liability
recognized previously on Consolidated Balance Sheet upon initial
implementation of ASC 715-20.
|
In
accordance with the provisions of ASC 715-20, Central Hudson’s pension liability
balance (i.e., the funded status) at September 30, 2009, December 31, 2008 and
September 30, 2008, was $157.5 million, $162.2 million and $1.0 million,
respectively. These balances include recognition for the difference
between the projected benefit obligation (“PBO”) for pensions and the market
value of the pension assets, as well as consideration for non-qualified
executive plans. As a result of volatile conditions in the economy
and financial markets over the past year, Central Hudson’s Retirement Plan
assets have significantly decreased relative to the plan
liabilities.
The
following reflects the impact of the recording of ASC 715-20 adjustments on the
Balance Sheets of CH Energy Group and Central Hudson (In
Thousands):
|
|
September
30,
|
December
31,
|
September
30,
|
|||||||||
|
|
2009
|
2008
|
2008
|
|||||||||
|
Prefunded
(accrued) pension costs prior to ASC 715-20 adjustment
|
$ | 13,873 | $ | 29,884 | $ | 34,141 | ||||||
|
Additional
liability required
|
(171,401 | ) | (192,084 | ) | (35,142 | ) | ||||||
|
Accrued
pension liability per ASC 715-20
|
$ | (157,528 | ) | $ | (162,200 | ) | $ | (1,001 | ) | |||
|
Total
offset to additional liability - Regulatory
assets - Retirement Plan
|
$ | 171,401 | $ | 192,084 | $ | 35,142 | ||||||
Pursuant
to ASC 715-20, gains or losses and prior service costs or credits that arise
during the period but are not recognized as components of net periodic pension
cost would typically be recognized as a component of other comprehensive income,
net of tax. However, Central Hudson records regulatory assets rather
than adjusting comprehensive income to offset the additional ASC 715-20
liability. The recording of a regulatory asset is consistent with the
PSC’s 1993 Statement of Policy regarding pensions and OPEB (“1993 PSC
Policy”). Under the 1993 PSC Policy, differences between pension
expense and rate allowances covering these costs are deferred for future
recovery from or return to customers with carrying charges accrued on cash
differences.
Decisions
to fund Central Hudson’s Retirement Plan are based on several factors, including
the value of plan assets relative to plan liabilities, legislative requirements,
regulatory considerations, and available corporate resources. As a
result of volatile conditions in the economy and financial markets over the past
year, Central Hudson’s Retirement Plan assets have significantly decreased
relative to the plan liabilities. Despite recent gains in the
financial markets, Central Hudson cannot predict the funding impact of these
gains on the Plan because the annual valuation driving contributions was
performed as of October 1, 2008, the Retirement Plan year-end, and has not been
updated for the current plan year at this time. The liabilities are
affected by the discount rate used to determine benefit obligations and the
accruing of additional benefits. Central Hudson considers the
provisions of the Pension Protection Act of 2006 in determining its funding for
the Retirement Plan for the near-term and future
periods. Contributions to the Retirement Plan during the nine months
ended September 30, 2009 and September 30, 2008 were $14.6 million and $12.5
million, respectively.
Employer
contributions for OPEB totaled $1.3 million and $4.2 million during the nine
months ended September 30, 2009 and September 30, 2008,
respectively. Contribution levels are determined by various factors
including the discount rate, expected return on plan assets, medical claims
assumptions used, mortality assumptions used, benefit changes, and corporate
resources.
NOTE 11 - EQUITY-BASED
COMPENSATION
A summary
of the status of performance shares granted to executives under the 2006 Plan is
as follows:
|
|
|
|
|
|
|
Performance
Shares
|
|
|
|
|
|
|
Performance
Shares
|
Outstanding
at
|
|
Grant
Date
|
|
Grant
Price
|
|
Granted
|
September 30,
2009
|
|
|
January
25, 2007
|
|
$
|
51.09
|
|
21,330
|
19,380
|
|
January
24, 2008
|
|
$
|
42.44
|
|
33,440
|
31,900
|
|
January
26, 2009
|
|
$
|
49.29
|
|
36,730
|
36,730
|
The
ultimate number of shares earned under the awards is based on metrics
established by the Compensation Committee at the beginning of the award
cycle. Compensation expense is recorded as performance shares are
earned over the relevant three-year life of the performance share grant prior to
its award. The portion of the compensation expense related to an
employee who retires during the performance period is the amount recognized up
to the date of retirement.
On May 1,
2009, performance shares earned as of December 31, 2008 for the award cycle with
a grant date of April 25, 2006 were issued to participants. Those
recipients electing not to defer this compensation under the CH Energy Group
Directors and Executives Deferred Compensation Plan received shares issued from
CH Energy Group's treasury stock. A total of 4,560 shares were issued
from CH Energy Group's treasury stock on May 1, 2009. Additionally,
due to the retirement of one of Central Hudson's executive officers on January
1, 2009, a pro-rated number of shares under the January 25, 2007 and January 24,
2008 grants were paid to this individual on July 2, 2009. An
additional 294 shares were issued from CH Energy Group's treasury stock on this
date in satisfaction of these awards.
The
following table summarizes compensation expense for performance shares for the
three and nine months ended September 30, 2009 and 2008 (In
Thousands):
|
Three
Months Ended
|
Nine
Months Ended
|
|||||||||||||||
|
|
September 30,
|
September 30,
|
||||||||||||||
|
|
2009
|
2008
|
2009
|
2008
|
||||||||||||
|
Performance
shares - compensation expense
|
$ | 129 | $ | 228 | $ | 623 | $ | 294 | ||||||||
The
following table summarizes information concerning stock options granted through
September 30, 2009:
|
|
|
|
|
|
|
Weighted
|
|
||||
|
|
|
|
|
|
Number
of
|
Number
of
|
Average
|
Number
of
|
|||
|
|
|
Exercise
|
|
Options
|
Options
|
Remaining
|
Options
|
||||
|
Date
of Grant
|
|
Price
|
|
Granted
|
Outstanding
|
Life
in Years
|
Exercisable
|
||||
|
January
1, 2000
|
|
$
|
31.94
|
|
30,300
|
320
|
0.25
|
320
|
|||
|
January
1, 2001
|
|
$
|
44.06
|
|
59,900
|
18,560
|
1.25
|
18,560
|
|||
|
January
1, 2003
|
|
$
|
48.62
|
|
36,900
|
17,420
|
3.25
|
17,420
|
|||
|
|
|
|
|
|
127,100
|
36,300
|
2.20
|
36,300
|
|||
A summary
of the status of stock options awarded to executives and non-employee Directors
of CH Energy Group and its subsidiaries under the 2000 Plan is as
follows:
|
Stock
Option
Shares
|
|
Weighted
Average
Exercise
Price
|
|
Weighted
Average
Remaining
Life
in
Years
|
||
|
Outstanding
at 12/31/08
|
40,300
|
|
$
|
46.05
|
|
3.91
|
|
Granted
|
-
|
|
|
-
|
|
|
|
Exercised
|
4,000
|
|
|
45.20
|
|
|
|
Expired
/ Forfeited
|
-
|
|
|
-
|
|
|
|
Outstanding
at 9/30/09
|
36,300
|
|
$
|
46.14
|
|
2.20
|
|
Total
CH Energy Group Shares Outstanding
|
|
15,790,431
|
|
|
||
|
Potential
Dilution
|
|
|
0.2
|
%
|
|
|
Compensation
expense related to stock options for the three and nine months ended September
30, 2009 and 2008 was immaterial. The balance accrued for outstanding
options was $0.1 million as of September 30, 2009 and 2008. The
intrinsic value of outstanding options was not material as of September 30, 2009
and 2008. No non-qualified stock options were exercised during the
three and nine months ended September 30, 2009.
The
following table summarizes information concerning restricted shares granted
through September 30, 2009 (Dollars In Thousands):
|
Grant
Date
|
Number
of Shares Granted
|
Fair
Value on Date of Grant
|
Vesting
Terms
|
Unvested
Shares Outstanding at September 30, 2009
|
||||||
|
January
2, 2008
|
10,000
|
|
$
|
443
|
|
End
of 3 years
|
9,500
|
(1)
|
||
|
January
2, 2008
|
2,100
|
|
$
|
93
|
|
Ratably
over 3 years
|
1,400
|
|||
|
January
26, 2009
|
2,930
|
|
$
|
144
|
|
End
of 3 years
|
2,930
|
|||
|
(1)
|
500
shares were forfeited upon resignation of the employee holding the
shares.
|
The above
shares granted were issued from CH Energy Group’s treasury stock and are
presented in the Consolidated Balance Sheet as an increase in common shares
outstanding and as a reduction in treasury stock. In accordance with
ASC 718-40 (formerly SFAS 123(R)), unvested restricted shares do not impact the
number of common shares outstanding used in the basic EPS calculation and as
such the number of unvested outstanding shares noted above have only been
included in the diluted EPS calculation as of September 30, 2009 and
2008. The total compensation cost related to these restricted shares
was $0.1 million for the three months ended September 30, 2009 and 2008 and $0.2
million for the nine months ended September 30, 2009 and 2008. Total
recognized tax benefits related to these restricted stock awards was immaterial
for the three and nine months ended September 30, 2009 and 2008.
NOTE 12 - COMMITMENTS AND
CONTINGENCIES
Electricity
Purchase Commitments
On March
6, 2007, Central Hudson
entered into an agreement with Entergy Nuclear Power Marketing, LLC to purchase
electricity (but not capacity) on a unit-contingent basis at defined prices from
January 1, 2008 through December 31, 2010. On an annual basis, the
electricity purchased through the Entergy contract represents approximately 22%
of Central Hudson’s full-service customer requirements and costs approximately
$57.5 million. For the nine months ended September 30, 2009 and 2008,
the energy supplied under this agreement cost approximately $40.1 million and
$42.8 million, respectively.
Purchases
under the Entergy contract are supplemented by shorter-term contracts, such as
the Dynegy contract discussed below, contracts for differences, and by purchases
from the NYISO, which oversees the bulk electricity transmission system, and the
capacity market in New York State, and other parties. On January 30,
2008, Central Hudson entered into an 11-month agreement with Dynegy Power
Marketing, Inc. to purchase 589,200 MWh of electricity on a unit-contingent
basis at defined prices from February 1, 2008 to December 31,
2008. The electricity purchased through the Dynegy contract
represented approximately 15% of Central Hudson’s full-service customer
requirements for the nine months ended September 30, 2008 and cost approximately
$36.3 million.
In the
event the above noted counterparties are unable to fulfill their commitments to
deliver under the terms of the agreements, Central Hudson would obtain the
supply from the NYISO market, and under Central Hudson’s current ratemaking
treatment, recover the full cost from customers. As such, there would
be no impact on earnings.
Central
Hudson must also acquire sufficient peak load capacity to meet the peak load
requirements of its full service customers. This capacity is made up
of its own generating capacity, contracts with capacity providers, and purchases
from the NYISO capacity market.
Contingencies
City of
Poughkeepsie
On
January 1, 2001, a fire destroyed a multi-family residence on Taylor Avenue in
the City of Poughkeepsie, New York resulting in several deaths and damage to
nearby residences. Eight separate lawsuits arising out of this
incident have been commenced against Central Hudson and other defendants. The
basis for the claimed liability of Central Hudson in these actions is that it
was allegedly negligent in the supply of natural gas. The suits seek
an aggregate of $528 million in compensatory damages. Central Hudson has
notified its insurance carrier, denied liability, and defended the
lawsuits. On December 10, 2008, Central Hudson entered into a
settlement agreement with the plaintiffs and one remaining
defendant. Under the settlement agreement, Central Hudson has agreed
to make payments to the plaintiffs that will not be material in the
aggregate. The settlement agreement is subject to final approval by
the Court.
Environmental
Matters
Central
Hudson
|
|
Ø
|
Air
|
In
October 1999, Central Hudson was informed by the New York State Attorney General
(“Attorney General”) that the Danskammer Point Steam Electric Generating Station
(“Danskammer Plant”) was included in an investigation by the Attorney General’s
Office into the compliance of eight older New York State coal-fired power plants
with federal and state air emissions rules. Specifically, the
Attorney General alleged that Central Hudson “may have constructed, and
continues to operate, major modifications to the Danskammer Plant without
obtaining certain requisite preconstruction permits.” In March 2000,
the Environmental Protection Agency (“EPA”) assumed responsibility for the
investigation. Central Hudson has completed its production of
documents requested by the Attorney General, the New York State Department of
Environmental Conservation (“DEC”), and the EPA, and believes any permits
required for these projects were obtained in a timely
manner. Notwithstanding Central Hudson’s sale of the Danskammer Plant
on January 30, 2001, Central Hudson could retain liability, depending on the
type of remedy, if any, imposed in connection with this matter. In
March 2009, Dynegy notified Central Hudson that Dynegy had received an
information request pursuant to the Clean Air Act from the EPA for the
Danskammer Plant covering the period beginning January 2000 to
present. At that time, Dynegy also submitted to Central Hudson a
demand for indemnification for any fines, penalties or other losses that may be
incurred by Dynegy arising from the period that Central Hudson owned the
Danskammer Plant. Central Hudson presently has insufficient
information with which to predict the outcome of this matter.
|
|
Ø
|
Former Manufactured Gas Plant
Facilities
|
Like most
late 19th and
early 20th
century utilities in the northeastern United States, Central Hudson and its
predecessors owned and operated manufactured gas plants (“MGPs”) to serve their
customers’ heating and lighting needs. MGPs manufactured gas from
coal and oil. This process produced certain by-products that may pose
risks to human health and the environment.
The DEC,
which regulates the timing and extent of remediation of MGP sites in New York
State, has notified Central Hudson that it believes Central Hudson or its
predecessors at one time owned and/or operated MGPs at eight sites in Central
Hudson’s franchise territory. The DEC has further requested that
Central Hudson investigate and, if necessary, remediate these sites under a
Consent Order, Voluntary Cleanup Agreement, or Brownfield Cleanup
Agreement. The DEC has placed five of these sites on the New York
State Environmental Site Remediation Database. A number of the sites
are now owned by third parties and have been redeveloped for other
uses. The DEC has recently begun inquiries regarding a ninth
site. The status of the sites is as follows:
|
Site
|
Status
|
|||
|
#1
|
Beacon,
NY
|
Remediation
complete. Final Report Approved by the DEC. Awaiting
Decision Document from the DEC and an environmental easement from the
property owner.
|
||
|
#2
|
Newburgh,
NY
|
Remediation
complete in one area under the terms of the DEC-approved
plan. The final Construction Completion Report on this area has
been filed with the DEC. For the remaining areas, the Final
Remedial Design for these areas was approved by the DEC on September 17,
2009. Remediation of the remaining areas to begin in the 4th
quarter of 2009.
|
||
|
#3
|
Laurel
Street
Poughkeepsie,
NY
|
Remediation
work is complete. Preparing Final Report and post-remediation
Site Management Plan. Additional monitoring/recovery wells
requested by the DEC will be installed in the 4th
quarter of 2009.
|
||
|
#4
|
North
Water Street
Poughkeepsie,
NY
|
Additional
land and river investigations have been requested by the DEC. A
work plan for this investigation work will be completed and submitted to
the DEC in the 4th
quarter of 2009. Visible oil sheens occurring in the Hudson
River at the site are being investigated.
|
||
|
#5
|
Kingston,
NY
|
Brownfield
Cleanup Agreement was executed and the Citizen Participation Plan (“CPP”)
was submitted to the DEC. Additional land and river
investigations have been requested by the DEC and a work plan for this
investigation work has been approved by the DEC. This
additional land and river investigation will begin in the 4th
quarter of 2009.
|
||
|
#6
|
Catskill,
NY
|
Site
investigation continues under the DEC-approved Brownfield Cleanup
Agreement. Access agreements for additional investigation work
have been executed and the work began on October 5,
2009.
|
||
|
#7
|
Saugerties,
NY
|
Central
Hudson does not believe it has any liability for this site and is working
with the DEC to confirm this.
|
||
|
#8
|
Bayeaux
Street
Poughkeepsie,
NY
|
Central
Hudson does not believe it has any further liability for this
site.
|
||
|
#9
|
Broad
Street
Newburgh,
NY
|
The
DEC has recently made inquiries about this additional
site. Central Hudson does not believe it has any liability for
this site and has responded to the DEC on June 22, 2009 confirming this
position.
|
||
In the
second quarter of 2008, Central Hudson updated the estimate of potential
remediation and future operating, maintenance and monitoring costs for sites #
2, 3, 4, 5 and 6 indicating that the total cost for the five sites could exceed
$165 million over the next 30 years. The updated estimate for sites #
2 and 3 was based on completed remedial investigations and feasibility
studies. As such, the estimate is subject to change based on the
current investigations, final remedial design (and associated engineering
estimates), DEC and New York State Department of Health (“NYSDOH”) comments and
requests, remedial design changes/negotiations and changed or unforeseen
conditions during remediation. The updated estimates for sites # 4, 5
and 6 were based on partially completed remedial investigations and current DEC
and NYSDOH preferences related to site remediation, and are considered
conceptual and preliminary. The updated estimate reflects updated
cost information along with the latest information from the investigation and
remediation work being done on MGP sites # 2, 3 and 4 and to include site #
6. The cost estimate involves assumptions relating to investigation
expenses, remediation costs, potential future liabilities, and post-remedial
operating, maintenance and monitoring costs, and is based on a variety of
factors including projections regarding the amount and extent of contamination,
the location, size and use of the sites, proximity to sensitive resources,
status of regulatory investigations, and information regarding remediation
activities at other MGP sites in New York State. This cost estimate
also assumes that proposed or anticipated remediation techniques are technically
feasible and that proposed remediation plans receive DEC and NYSDOH
approval. Further, the updated estimate could change materially based
on changes to technology relating to remedial alternatives and changes to
current laws and regulations.
Prior to
2009, Central Hudson recorded a $24.7 million estimated liability for sites # 2
and 3 based on estimates of remediation costs for the proposed clean-up
plans. As of September 30, 2009, $24.2 million of this recorded
estimated liability has not been spent; $12.3 million of this recorded estimated
liability is expected to be spent over the next twelve months.
No
amounts have been recorded in connection with the physical remediation of sites
# 4, 5 and 6, for which Central Hudson has developed estimated future costs
based on conceptual and preliminary plans. Absent DEC-approved
remediation plans, management cannot reasonably estimate what cost, if any, will
actually be incurred. The portion of the $165 million referenced
above that is related to these three sites is approximately $121
million. Prior to 2009, Central Hudson had recorded a $1.5 million
estimated liability in connection with estimated costs for preliminary
investigations, site testing and development of remediation plans for sites # 4,
5 and 6 through 2010. Based on the latest forecast of activities at
these sites, this estimated liability has been increased in 2009 to $2.0
million. As of September 30, 2009, none of this recorded estimated
liability has been spent; $0.5 million of this recorded estimated liability is
expected to be spent over the next twelve months. This estimated
amount may change in the future as additional information is obtained regarding
the results of site-testing, the scope of site investigation plans approved by
the DEC and NYSDOH, and the evolving development of new
technologies. Central Hudson cannot predict the results of site
testing, the nature, timing or extent of comments from the DEC and NYSDOH, or
changes in technology. The impact of these uncertainties on the
estimate cannot be determined.
With
regard to sites # 7, 8 and 9, Central Hudson does not have sufficient
information to estimate its potential remediation cost if any; as previously
stated, Central Hudson believes that it has no liability for these
sites.
Central
Hudson spent $3.2 million in the nine months ended September 30, 2009 related to
site investigation and remediation for sites #2, 3, 4, 5 and 6. Based
on the 2006 Rate Order, on July 1, 2007, Central Hudson started the recovery of
a rate allowance for MGP Site Investigation and Remediation
Costs. This recovery totaled $4.0 million as of September 30, 2009
with $1.5 million recovered in 2009.
Central
Hudson has put its insurers on notice and intends to seek reimbursement from its
insurers for the costs of any liabilities. Certain of these insurers
have denied coverage. Pursuant to the 2006 Rate Order, Central Hudson
is permitted to defer for future recovery the differences between actual costs
for MGP site investigation and remediation and the associated rate allowances,
with carrying charges to be accrued on the deferred balances at the authorized
pre-tax rate of return. The 2009 Rate Order provides recovery of a
rate allowance of $2.8 million during the July 2009 through June 2010 rate
year. Additionally, the 2009 Rate Order authorizes recovery of
certain amounts spent over the rate allowance from the net electric regulatory
liability balance and authorizes continued deferral for all other MGP site
remediation expenditures.
Future
remediation activities, including operating, maintenance and monitoring and
related costs may vary significantly from the assumptions used in Central
Hudson’s current cost estimates, and these costs could have a material adverse
effect (the extent of which cannot be reasonably determined) on the financial
condition, results of operations and cash flows of CH Energy Group and Central
Hudson if Central Hudson were unable to recover all or a substantial portion of
these costs via collection in rates from customers and/or through
insurance.
|
|
Ø
|
Little Britain
Road
|
In
December 1977, Central Hudson purchased property at 610 Little Britain Road, New
Windsor, New York. In 1992, the DEC informed Central Hudson that the
DEC was preparing to conduct a Preliminary Site Assessment (“PSA”) of the site
and in 1995, the DEC issued an Order of Consent in which Central Hudson agreed
to conduct the PSA. In 2000, following completion of the PSA, Central
Hudson and the DEC entered into a Voluntary Cleanup Agreement (“VCA”) whereby
Central Hudson removed approximately 3,100 tons of soil and has conducted a
routine groundwater sampling program since that time. Groundwater
sampling results show the presence of certain contaminants at levels exceeding
DEC criteria. Deep groundwater wells were installed in 2005 and 2006,
which also show contaminants exceeding DEC criteria. The DEC
responded with a request for a plan to address the
contamination. Central Hudson has submitted a proposal to the DEC for
limited additional site work, including an assessment of vapor intrusion into a
building on the site, and closure of the VCA. Negotiations between
DEC and Central Hudson regarding additional site work and closure of the VCA are
ongoing. Central Hudson completed a soil vapor intrusion study and
results indicated that indoor air met Occupational Safety and Health
Administration (“OSHA”) and NYSDOH standards, however, concentrations beneath
the building’s concrete slab warranted installation of a mitigation system. This
mitigation system was installed in 2008. At this time Central Hudson
does not have sufficient information to estimate the need for additional
remediation or potential remediation costs. Central Hudson has put
its insurers on notice regarding this matter and intends to seek reimbursement
from its insurers for amounts, if any, for which it may become
liable. Central Hudson cannot predict the outcome of this
matter.
|
|
Ø
|
Newburgh Consolidated Iron
Works
|
By letter
from the EPA dated November 28, 2001, Central Hudson, among others, was served
with a Request For Information pursuant to the Comprehensive Environmental
Response, Compensation and Liability Act (“CERCLA”) regarding any shipments of
scrap or waste materials that Central Hudson may have made to Consolidated Iron
and Metal Co., Inc. (“Consolidated Iron”), a Superfund site located in Newburgh,
New York. Sampling by the EPA indicated that lead and polychlorinated
biphenyls (or “PCBs”) are present at the site, and the EPA subsequently
commenced a remedial investigation and feasibility study at the
site. No records were found which indicate that the materials shipped
by Central Hudson to Consolidated Iron contained or was a hazardous
substance. In April 2008, Central Hudson received a letter from the
Consolidated Iron Joint Defense Group (“JDG”), a group of potentially
responsible parties asserting a contribution claim against Central
Hudson. The JDG had reached an agreement in principle with the EPA to
resolve claims at the Consolidated Iron site under a consent decree to be filed
with the court. In December 2008, Central Hudson entered into a
settlement agreement with the JDG pursuant to which the consent decree would be
amended to add Central Hudson as an additional settling party, subject to the
approval of the court. The amendment to the consent decree has been
approved by the court. Central Hudson anticipates no further
liability for the site, in which case Management does not expect a material
impact on earnings. However, the consent decree provides the EPA with
the right to reopen the matter under certain circumstances and Central Hudson
cannot predict the outcome of this matter at the present time.
|
|
Ø
|
Asbestos
Litigation
|
As of
September 30, 2009, of the 3,317 asbestos cases brought against Central Hudson,
1,187 remain pending. Of the cases no longer pending against Central
Hudson, 1,978 have been dismissed or discontinued without payment by Central
Hudson, and Central Hudson has settled 152 cases. Central Hudson is
presently unable to assess the validity of the remaining asbestos lawsuits;
accordingly, it cannot determine the ultimate liability relating to these
cases. Based on information known to Central Hudson at this time,
including Central Hudson’s experience in settling asbestos cases and in
obtaining dismissals of asbestos cases, Central Hudson believes that the costs
which may be incurred in connection with the remaining lawsuits will not have a
material adverse effect on the financial position, results of operations or cash
flows of either CH Energy Group or Central Hudson.
CHEC
During
the nine months ended September 30, 2009, Griffith spent $0.1 million on
remediation efforts in Maryland, Virginia and Connecticut. Griffith
is entitled to be reimbursed $0.2 million from the State of Connecticut under an
environmental agreement and has recorded this amount as a
receivable.
Griffith
has a reserve for environmental remediation which is $1.3 million as of
September 30, 2009, of which $0.1 million is expected to be spent in the next
twelve months.
Other
Matters
Central
Hudson and Griffith are involved in various other legal and administrative
proceedings incidental to their businesses, which are in various
stages. While these matters collectively could involve substantial
amounts, it is the opinion of Management that their ultimate resolution will not
have a material adverse effect on either of CH Energy Group’s or the individual
segment’s financial positions, results of operations, or cash
flows.
NOTE 13 - SEGMENTS AND
RELATED INFORMATION
CH Energy
Group's reportable operating segments are the regulated electric utility
business and regulated natural gas utility business of Central Hudson and the
unregulated fuel distribution business of Griffith. Other activities
of CH Energy Group, which do not constitute a business segment include the
investments and business development activities of CH Energy Group and the
renewable energy and investment activities of CHEC, including its ownership
interests in ethanol, wind, landfill gas and biomass energy projects and are
reported under the heading “Other Businesses and Investments.”
Certain
additional information regarding these segments is set forth in the following
tables. General corporate expenses, Central Hudson property common to
both electric and natural gas segments, and the depreciation of Central Hudson’s
common property have been allocated in accordance with practices established for
regulatory purposes.
Central
Hudson’s and Griffith’s operations are seasonal in nature and weather-sensitive
and, as a result, financial results for interim periods are not necessarily
indicative of trends for a twelve-month period. Demand for
electricity typically peaks during the summer, while demand for natural gas and
heating oil typically peaks during the winter.
|
CH
Energy Group Segment Disclosure
|
|||||||||||||||||||
|
(In
Thousands)
|
|||||||||||||||||||
|
Three
Months Ended September 30, 2009
|
|||||||||||||||||||
|
Other
|
|||||||||||||||||||
|
Central
Hudson
|
Businesses
|
||||||||||||||||||
|
Natural
|
and
|
||||||||||||||||||
|
Electric
|
Gas
|
Griffith
|
Investments
|
Eliminations
|
Total
|
||||||||||||||
|
Revenues
from external customers
|
$ | 138,685 | $ | 16,243 | $ | 55,517 | $ | 3,200 | $ | - | $ | 213,645 | |||||||
|
Intersegment
revenues
|
1 | 11 | - | - | (12 | ) | - | ||||||||||||
|
Total
revenues
|
138,686 | 16,254 | 55,517 | 3,200 | (12 | ) | 213,645 | ||||||||||||
|
Interest
and investment income
|
817 | 385 | - | 1,029 | (1,013 | ) | (1) | 1,218 | |||||||||||
|
Interest
expense
|
4,993 | 1,215 | 924 | 947 | (1,013 | ) | (1) | 7,066 | |||||||||||
|
Earnings
before income taxes
|
16,514 | (1,310 | ) | (5,831 | ) | (404 | ) | - | 8,969 | ||||||||||
|
Net
income (loss) attributable to CH Energy Group
|
9,755 | (1,126 | ) | (3,441 | ) | 164 | - | 5,352 | |||||||||||
|
Segment
assets at September 30
|
1,124,163 | 391,846 | 167,476 | 67,400 | (1,394 | ) | (2) | 1,749,491 | |||||||||||
|
(1)
|
This
represents the elimination of inter-company interest income (expense)
generated from lending activities between CH Energy Group (the holding
company), and its subsidiaries (CHEC and
Griffith).
|
|
(2)
|
Includes
non-controlling owner's interest of $1,520 related to
Lyonsdale.
|
|
CH
Energy Group Segment Disclosure
|
|||||||||||||||||||
|
(In
Thousands)
|
|||||||||||||||||||
|
Three
Months Ended September 30, 2008
|
|||||||||||||||||||
|
Other
|
|||||||||||||||||||
|
Central
Hudson
|
Businesses
|
||||||||||||||||||
|
Natural
|
and
|
||||||||||||||||||
|
Electric
|
Gas
|
Griffith
|
Investments
|
Eliminations
|
Total
|
||||||||||||||
|
Revenues
from external customers
|
$ | 179,001 | $ | 21,773 | $ | 97,049 | $ | 2,964 | $ | - | $ | 300,787 | |||||||
|
Intersegment
revenues
|
4 | 28 | - | - | (32 | ) | - | ||||||||||||
|
Total
revenues
|
179,005 | 21,801 | 97,049 | 2,964 | (32 | ) | 300,787 | ||||||||||||
|
Interest
and investment income
|
549 | 413 | 17 | 1,502 | (1,142 | ) | (1) | 1,339 | |||||||||||
|
Interest
expense
|
4,945 | 1,355 | 1,130 | 123 | (1,142 | ) | (1) | 6,411 | |||||||||||
|
Earnings
before income taxes
|
12,848 | (2,375 | ) | (7,395 | ) | 1,310 | - | 4,388 | |||||||||||
|
Net
income (loss) attributable to CH Energy Group
|
7,659 | (1,774 | ) | (4,438 | ) | 1,438 | - | 2,885 | |||||||||||
|
Segment
assets at September 30
|
966,553 | 340,686 | 195,037 | 43,503 | (2,942 | ) | (2) | 1,542,837 | |||||||||||
|
(1)
|
This
represents the elimination of inter-company interest income (expense)
generated from lending activities between CH Energy Group (the holding
company), and its subsidiaries (CHEC and
Griffith).
|
|
(2)
|
Includes
non-controlling owner's interest of $1,474 related to
Lyonsdale.
|
|
CH
Energy Group Segment Disclosure
|
|||||||||||||||||||
|
(In
Thousands)
|
|||||||||||||||||||
|
Nine
Months Ended September 30, 2009
|
|||||||||||||||||||
|
Other
|
|||||||||||||||||||
|
Central
Hudson
|
Businesses
|
||||||||||||||||||
|
Natural
|
and
|
||||||||||||||||||
|
Electric
|
Gas
|
Griffith
|
Investments
|
Eliminations
|
Total
|
||||||||||||||
|
Revenues
from external customers
|
$ | 404,035 | $ | 137,422 | $ | 244,037 | $ | 6,854 | $ | - | $ | 792,348 | |||||||
|
Intersegment
revenues
|
11 | 263 | - | - | (274 | ) | - | ||||||||||||
|
Total
revenues
|
404,046 | 137,685 | 244,037 | 6,854 | (274 | ) | 792,348 | ||||||||||||
|
Interest
and investment income
|
2,465 | 1,348 | 5 | 4,075 | (3,209 | ) | (1) | 4,684 | |||||||||||
|
Interest
expense
|
14,546 | 3,771 | 2,981 | 1,715 | (3,209 | ) | (1) | 19,804 | |||||||||||
|
Earnings
before income taxes
|
30,354 | 8,390 | 7,485 | (1,475 | ) | - | 44,754 | ||||||||||||
|
Net
income attributable to CH Energy Group
|
17,734 | 4,221 | 4,415 | 646 | - | 27,016 | |||||||||||||
|
Segment
assets at September 30
|
1,124,163 | 391,846 | 167,476 | 67,400 | (1,394 | ) | (2) | 1,749,491 | |||||||||||
|
(1)
|
This
represents the elimination of inter-company interest income (expense)
generated from lending activities between CH Energy Group (the holding
company), and its subsidiaries (CHEC and
Griffith).
|
|
(2)
|
Includes
non-controlling owner's interest of $1,520 related to
Lyonsdale.
|
|
CH
Energy Group Segment Disclosure
|
|||||||||||||||||||
|
(In
Thousands)
|
|||||||||||||||||||
|
Nine
Months Ended September 30, 2008
|
|||||||||||||||||||
|
Other
|
|||||||||||||||||||
|
Central
Hudson
|
Businesses
|
||||||||||||||||||
|
|
Natural
|
and
|
|||||||||||||||||
|
Electric
|
Gas
|
Griffith
|
Investments
|
Eliminations
|
Total
|
||||||||||||||
|
Revenues
from external customers
|
$ | 468,659 | $ | 142,267 | $ | 404,680 | $ | 8,626 | $ | - | $ | 1,024,232 | |||||||
|
Intersegment
revenues
|
12 | 230 | - | - | (242 | ) | - | ||||||||||||
|
Total
revenues
|
468,671 | 142,497 | 404,680 | 8,626 | (242 | ) | 1,024,232 | ||||||||||||
|
Interest
and investment income
|
1,982 | 1,308 | 67 | 4,558 | (3,511 | ) | (1) | 4,404 | |||||||||||
|
Interest
expense
|
14,644 | 4,009 | 3,665 | 373 | (3,511 | ) | (1) | 19,180 | |||||||||||
|
Earnings
before income taxes
|
29,531 | 7,746 | (2,179 | ) | 3,716 | - | 38,814 | ||||||||||||
|
Net
income (loss) attributable to CH Energy Group
|
17,486 | 3,852 | (1,308 | ) | 3,826 | - | 23,856 | ||||||||||||
|
Segment
assets at September 30
|
966,553 | 340,686 | 195,037 | 43,503 | (2,942 | ) | (2) | 1,542,837 | |||||||||||
|
(1)
|
This
represents the elimination of inter-company interest income (expense)
generated from lending activities between CH Energy Group (the holding
company), and its subsidiaries (CHEC and
Griffith).
|
|
(2)
|
Includes
non-controlling owner's interest of $1,474 related to
Lyonsdale.
|
|
Central
Hudson Segment Disclosure
|
||||||||||||||||
|
(In
Thousands)
|
||||||||||||||||
|
|
Three
Months Ended September 30, 2009
|
|||||||||||||||
|
|
Electric
|
Natural
Gas
|
Eliminations
|
Total
|
||||||||||||
|
Revenues
from external customers
|
$ | 138,685 | $ | 16,243 | $ | - | $ | 154,928 | ||||||||
|
Intersegment
revenues
|
1 | 11 | (12 | ) | - | |||||||||||
|
Total
revenues
|
138,686 | 16,254 | (12 | ) | 154,928 | |||||||||||
|
Interest
and investment income
|
817 | 385 | - | 1,202 | ||||||||||||
|
Interest
expense
|
4,993 | 1,215 | - | 6,208 | ||||||||||||
|
Income
before income taxes
|
16,514 | (1,310 | ) | - | 15,204 | |||||||||||
|
Income
available for common stock
|
9,755 | (1,126 | ) | - | 8,629 | |||||||||||
|
Segment
assets at September 30
|
1,124,163 | 391,846 | - | 1,516,009 | ||||||||||||
|
Central
Hudson Segment Disclosure
|
||||||||||||||||
|
(In
Thousands)
|
||||||||||||||||
|
Three
Months Ended September 30, 2008
|
||||||||||||||||
|
Electric
|
Natural
Gas
|
Eliminations
|
Total
|
|||||||||||||
|
Revenues
from external customers
|
$ | 179,001 | $ | 21,773 | $ | - | $ | 200,774 | ||||||||
|
Intersegment
revenues
|
4 | 28 | (32 | ) | - | |||||||||||
|
Total
revenues
|
179,005 | 21,801 | (32 | ) | 200,774 | |||||||||||
|
Interest
and investment income
|
549 | 413 | - | 962 | ||||||||||||
|
Interest
expense
|
4,945 | 1,355 | - | 6,300 | ||||||||||||
|
Income
before income taxes
|
12,848 | (2,375 | ) | - | 10,473 | |||||||||||
|
Income
available for common stock
|
7,659 | (1,774 | ) | - | 5,885 | |||||||||||
|
Segment
assets at September 30
|
966,553 | 340,686 | - | 1,307,239 | ||||||||||||
|
Central
Hudson Segment Disclosure
|
||||||||||||||||
|
(In
Thousands)
|
||||||||||||||||
|
|
Nine
Months Ended September 30, 2009
|
|||||||||||||||
|
|
Electric
|
Natural
Gas
|
Eliminations
|
Total
|
||||||||||||
|
Revenues
from external customers
|
$ | 404,035 | $ | 137,422 | $ | - | $ | 541,457 | ||||||||
|
Intersegment
revenues
|
11 | 263 | (274 | ) | - | |||||||||||
|
Total
revenues
|
404,046 | 137,685 | (274 | ) | 541,457 | |||||||||||
|
Interest
and investment income
|
2,465 | 1,348 | - | 3,813 | ||||||||||||
|
Interest
expense
|
14,546 | 3,771 | - | 18,317 | ||||||||||||
|
Income
before income taxes
|
30,354 | 8,390 | - | 38,744 | ||||||||||||
|
Income
available for common stock
|
17,734 | 4,221 | - | 21,955 | ||||||||||||
|
Segment
assets at September 30
|
1,124,163 | 391,846 | - | 1,516,009 | ||||||||||||
|
Central
Hudson Segment Disclosure
|
||||||||||||||||
|
(In
Thousands)
|
||||||||||||||||
|
|
Nine
Months Ended September 30, 2008
|
|||||||||||||||
|
|
Electric
|
Natural
Gas
|
Eliminations
|
Total
|
||||||||||||
|
Revenues
from external customers
|
$ | 468,659 | $ | 142,267 | $ | - | $ | 610,926 | ||||||||
|
Intersegment
revenues
|
12 | 230 | (242 | ) | - | |||||||||||
|
Total
revenues
|
468,671 | 142,497 | (242 | ) | 610,926 | |||||||||||
|
Interest
and investment income
|
1,982 | 1,308 | - | 3,290 | ||||||||||||
|
Interest
expense
|
14,644 | 4,009 | - | 18,653 | ||||||||||||
|
Income
before income taxes
|
29,531 | 7,746 | - | 37,277 | ||||||||||||
|
Income
available for common stock
|
17,486 | 3,852 | - | 21,338 | ||||||||||||
|
Segment
assets at September 30
|
966,553 | 340,686 | - | 1,307,239 | ||||||||||||
NOTE 14 - ACCOUNTING FOR
DERIVATIVE INSTRUMENTS AND HEDGING ACTIVITIES
ASC 815,
Derivatives and Hedging
(formerly SFAS No. 133, Accounting for Derivative
Instruments and Hedging Activities), as amended, established accounting
and reporting requirements for derivative instruments and hedging
activities. ASC 815 requires that an entity recognize the fair value
of all derivative instruments as either assets or liabilities on the balance
sheet with the corresponding unrealized gains or losses recognized in
earnings. ASC 815 permits the deferral of the effective portion of
unrealized gains and losses on derivatives that are properly designated as
hedges under ASC 815.
CH Energy
Group and its subsidiaries enter into derivative instruments for hedging
purposes in conjunction with the Company’s energy risk management program, not
for speculative purposes. Central Hudson uses derivative contracts to
hedge exposure to variability in the prices of natural gas and electricity and
to hedge exposure to variability in interest rates for its variable rate
long-term debt. The types of derivative instruments typically used by
Central Hudson are natural gas futures and swaps to hedge natural gas purchases,
contracts for differences (electricity swaps) to hedge electricity purchases,
and interest rate caps to hedge interest payments on variable rate
debt. Although the use of these instruments is intended to hedge cash
flows, they are not designated as hedges under the provisions of ASC 815, and
the related gains and losses are included as part of Central Hudson's commodity
cost and/or price-reconciled in its natural gas and electricity cost adjustment
charge clauses. Griffith uses derivative instruments to hedge
variability in the price of heating oil purchased for delivery to its
customers. In 2009 and 2008, Griffith purchased call option contracts
to establish ceiling prices to hedge forecasted heating oil supply requirements
for capped price programs not hedged by firm purchase
commitments. The options hedge purchase cash flows related to
commodity price changes. These derivatives are designated as cash
flow hedges under the provisions of ASC 815 and the portion of the change in
fair value of the options that is effective in hedging the purchase cash flow is
included in the cost of sales as the hedged transaction occurs.
At
September 30, 2009, Central Hudson had open derivative contracts to hedge
natural gas prices during November 2009 - March 2010, covering approximately
46.3% of Central Hudson's projected total natural gas supply requirements during
the upcoming winter heating season. In its electric operations,
Central Hudson had open derivative contracts at September 30, 2009 to hedge the
price of approximately 22.5% of its projected electricity requirements for
October - December 2009, and 18.1% of its projected requirements in each of the
years 2010, 2011, and 2012. At September 30, 2009, Griffith had open
OTC call option positions covering approximately 2.2% of its anticipated fuel
oil supply requirements for the period October 2009 – May 2010.
Central
Hudson and Griffith both hold contracts for derivative instruments under master
netting agreements. Of the fourteen total agreements held by both
companies, eleven contain credit-risk related contingent
features. The circumstances that could trigger these features, the
aggregate fair value of the derivative instruments that contain contingent
features and the amount that would be required to settle these instruments on
September 30, 2009 if the contingent features were triggered are described
below.
|
Contingent Contracts
|
||||||||||||
|
(Dollars
In Thousands)
|
||||||||||||
|
|
||||||||||||
|
As
of September 30, 2009
|
||||||||||||
|
Triggering
Event
|
#
of Contracts Containing the Triggering Feature
|
Gross
Fair Value of Contract
|
Cost
to Settle if Contingent Feature is Triggered
(net
of collateral)
|
|||||||||
|
|
|
|
||||||||||
|
Central Hudson:
|
|
|
|
|||||||||
|
Change
in Ownership (CHEG
ownership of CHG&E
falls below 51%)
|
1 | $ | (705 | ) | $ | (705 | ) | |||||
|
Credit
Rating Downgrade (to
below BBB-)
|
5 | (18 | ) | (18 | ) | |||||||
|
Adequate
Assurance(1)
|
2 | (763 | ) | (763 | ) | |||||||
|
Total
Central Hudson
|
8 | (1,486 | ) | (1,486 | ) | |||||||
|
Griffith:
|
||||||||||||
|
Change
in Ownership (CHEG
ownership of CHEC
falls below 51%)
|
1 | 47 | 47 | |||||||||
|
Adequate
Assurance(1)
|
2 | 36 | 36 | |||||||||
|
Total
Griffith
|
3 | 83 | 83 | |||||||||
|
Total
CH Energy Group
|
11 | $ | (1,403 | ) | $ | (1,403 | ) | |||||
|
(1)
|
If
the counterparty has reasonable grounds to believe CHG&E's or
Griffith's creditworthiness or performance has become unsatisfactory, it
can request collateral in an amount determined by the counterparty, not to
exceed the amount required to settle the
contract.
|
CH Energy
Group uses master netting agreements to mitigate the credit risk of financial
derivatives, and in accordance with ASC 210-20, Offsetting (formerly FSP No.
FIN 39-1, Amendment of FASB
Interpretation No. 39), has elected gross presentation for its derivative
contracts under master netting agreements. On September 30, 2009,
neither Central Hudson nor Griffith had collateral posted against the fair value
amount of derivatives under any of these agreements. If collateral
were posted, CH Energy Group’s policy is to also report the collateral positions
on a gross basis.
The fair
value of CH Energy Group’s and Central Hudson’s derivative instruments and their
location in the respective Balance Sheets are described below, followed by a
description of their effect on the respective Statements of
Income. For additional information regarding Central Hudson’s
physical hedges, see the discussion following the caption “Electricity Purchase
Commitments” in Note 12 – “Commitments and Contingencies.”
|
Gross Fair Value of Derivative
Instruments
|
||||||||||||
|
(In
Thousands)
|
||||||||||||
|
|
||||||||||||
|
September 30,
2009
|
December 31,
2008
|
September 30,
2008
|
||||||||||
|
Derivatives in an Asset
Position:
|
|
|
|
|||||||||
|
Not
Designated as Hedging Instruments:(1)
|
|
|
|
|||||||||
|
Central
Hudson electricity swap contracts
|
$ | 103 | $ | - | $ | - | ||||||
|
Central
Hudson natural gas swap contracts
|
77 | - | - | |||||||||
|
Central
Hudson interest rate swap contract
|
- | - | - | |||||||||
|
Total
Central Hudson Derivatives in an Asset Position
|
180 | - | - | |||||||||
|
Designated
as Hedging Instruments under ASC 815 (formerly SFAS 133):
|
||||||||||||
|
Griffith
heating oil call option contracts
|
83 | - | 28 | |||||||||
|
Total
CH Energy Group Derivatives in Asset Position
|
$ | 263 | $ | - | $ | 28 | ||||||
|
Derivatives in a Liability
Position:
|
||||||||||||
|
Not
Designated as Hedging Instruments:(1)
|
||||||||||||
|
Central
Hudson electricity swap contracts
|
$ | (10,698 | ) | $ | (5,538 | ) | $ | (3,807 | ) | |||
|
Central
Hudson natural gas swap contracts
|
(2,189 | ) | (10,221 | ) | (10,273 | ) | ||||||
|
Total
Central Hudson Derivatives in a Liability Position
|
(12,887 | ) | (15,759 | ) | (14,080 | ) | ||||||
|
Total
CH Energy Group Derivatives in Liability Position
|
$ | (12,887 | ) | $ | (15,759 | ) | $ | (14,080 | ) | |||
|
Total
Central Hudson Derivatives - Net
|
$ | (12,707 | ) | $ | (15,759 | ) | $ | (14,080 | ) | |||
|
Total
CH Energy Group Derivatives - Net
|
$ | (12,624 | ) | $ | (15,759 | ) | $ | (14,052 | ) | |||
|
(1)
|
See discussion following tables
for additional information regarding regulatory treatment of gains and
losses on Central Hudson's derivative
contracts.
|
The Effect of Derivative
Instruments on the Statements of Income
(In
Thousands)
CH Energy
Group
Designated as Hedging
Instruments:
|
Derivatives
in ASC 815 (formerly SFAS 133) Cash Flow Hedging
Relationships
|
Amount
of Gain/(Loss)
Recognized
in OCI on Derivative
|
Amount
of Gain/(Loss) Reclassified
from
Accumulated OCI into Income
|
||||||||||||||||||||||||||||||
|
Three
Months Ended
|
Nine
Months Ended
|
Three
Months Ended
|
Nine
Months Ended
|
|||||||||||||||||||||||||||||
|
September 30,
|
September 30,
|
September 30,
|
September 30,
|
|||||||||||||||||||||||||||||
|
2009
|
2008
|
2009
|
2008
|
2009
|
2008
|
2009
|
2008
|
|||||||||||||||||||||||||
|
Griffith
heating oil call option contracts
|
$ | (9 | ) | $ | (188 | ) | $ | 49 | $ | 1,300 | $ | - | $ | - | $ | - | $ | (2,014 | ) | |||||||||||||
|
Total
|
$ | (9 | ) | $ | (188 | ) | $ | 49 | $ | 1,300 | $ | - | $ | - | $ | - | $ | (2,014 | ) | |||||||||||||
For the
three months ended September 30, 2009 and 2008, the amount of loss recognized in
income for Griffith heating oil call option contracts designated as hedging
instruments was immaterial and $0.2 million, respectively. For the
nine months ended September 30, 2009 and 2008, the amount of gain recognized was
$0.1 million and $1.3 million, respectively. The loss reclassified
from Accumulated OCI into income for Griffith's heating oil call option
contracts for all periods presented is located in purchased
petroleum.
Not Designated as Hedging
Instruments:
|
Amount
of Gain/(Loss) Recognized as (Increase)/Decrease in Purchased Electric and
Purchased Natural Gas
|
Location
of Gain/(Loss)
|
||||||||||||
|
Three
Months Ended
|
Nine
Months Ended
|
||||||||||||
|
September 30,
|
September 30,
|
||||||||||||
|
2009
|
2008
|
2009
|
2008
|
||||||||||
|
Central
Hudson electricity swap contracts
|
$ | (9,771 | ) | $ | (2,335 | ) | $ | (20,550 | ) | $ | (1,246 | ) |
Regulatory
asset(1)
|
|
Central
Hudson natural gas swap contracts
|
(388 | ) | - | (11,641 | ) | (1,026 | ) |
Regulatory
asset(1)
|
|||||
|
Central
Hudson interest rate swap contract
|
- | - | - | - |
Regulatory
asset(1)
|
||||||||
|
Total
|
$ | (10,159 | ) | $ | (2,335 | ) | $ | (32,191 | ) | $ | (2,272 | ) | |
|
Central Hudson
|
|||||||||||||
|
Designated as Hedging
Instruments:
|
|||||||||||||
|
None
|
|||||||||||||
|
Not Designated as Hedging
Instruments:
|
|||||||||||||
|
Amount
of Gain/(Loss) Recognized as (Increase)/Decrease in Purchased Electric and
Purchased Natural Gas
|
Location
of Gain/(Loss)
|
||||||||||||
|
Three
Months Ended
|
Nine
Months Ended
|
||||||||||||
|
September 30,
|
September 30,
|
||||||||||||
|
2009
|
2008
|
2009
|
2008
|
||||||||||
|
Electricity
swap contracts
|
$ | (9,771 | ) | $ | (2,335 | ) | $ | (20,550 | ) | $ | (1,246 | ) |
Regulatory
asset(1)
|
|
Natural
gas swap contracts
|
(388 | ) | - | (11,641 | ) | (1,026 | ) |
Regulatory
asset(1)
|
|||||
|
Interest
rate swap contract
|
- | - | - | - |
Regulatory
asset(1)
|
||||||||
|
Total
|
$ | (10,159 | ) | $ | (2,335 | ) | $ | (32,191 | ) | $ | (2,272 | ) | |
|
(1)
|
Realized
gains and losses on Central Hudson’s derivative instruments are conveyed
to or recovered from customers through PSC-authorized deferral accounting
mechanisms, with an offset in revenue and on the balance sheet, and no
impact on results of
operations.
|
Central
Hudson recorded actual net losses of $10.2 million and $32.2 million on such
hedging activities for the three and nine months ended September 30, 2009, as
compared to net losses of $2.3 million and $2.3 million for the same periods in
2008. For more information regarding the fair value of the Company’s
outstanding derivative contracts, see Note 15 – “Financial
Instruments”.
In the
three and nine months ended September 30, 2009 and 2008, Griffith’s call options
were effective with immaterial gains or losses from ineffectiveness recorded.
The assessment of hedge effectiveness for these hedges excludes the change in
the fair value of the premium paid for these derivative
instruments. The total fair value of open derivative instruments at
September 30, 2009 was a net unrealized gain of $0.1 million. The
total fair value at December 31, 2008 and September 30, 2008 was not
material. These amounts were recorded in each period as part of the
cost or price of the related commodity transactions. The fair values
of call options are determined based on the market value of the underlying
commodity. The total net loss including premium expense was
$0.1 million and $0.2 million in the three and nine months ended September 30,
2009. Unrealized losses expected to be reclassified into earnings
over the next twelve months are not material. A total net loss
including premium expense of $0.8 million was recorded in the three months ended
September 30, 2008. A total net gain of $1.1 million was recorded in
the nine months ended September 30, 2008.
In
addition to the above, Griffith uses weather derivative contracts to hedge the
effect on earnings of significant variances in weather conditions from normal
patterns if such contracts can be obtained on reasonable
terms. Weather derivative contracts are accounted for in accordance
with ASC 815-45, Weather
Derivatives, (formerly EITF Issue No. 99-2, Accounting for Weather
Derivatives). In the three months ended September 30, 2009,
Griffith made no settlement payments to and received no payments from
counterparties. In the nine months ended September 30, 2009, Griffith
made a settlement payment of $0.2 million to counterparties and received no
payments from counterparties. In the three and nine months ended
September 30, 2008, Griffith did not make or receive settlement payments to or
from counterparties.
NOTE 15 – FAIR VALUE
MEASUREMENTS
Assets
and Liabilities Recorded at Fair Value
ASC 820
establishes a fair value hierarchy to prioritize the inputs used in valuation
techniques based on observable and unobservable data, but not the valuation
techniques themselves. Observable inputs are inputs that reflect the
assumptions market participants would use in pricing the asset or
liability. Unobservable inputs are inputs that reflect the reporting
entity’s own assumptions about the assumptions market participants would use in
pricing an asset or a liability. Classification of inputs is
determined based on the lowest level input that is significant to the overall
valuation. The fair value hierarchy prioritizes the inputs to
valuation techniques into the three categories described below.
|
|
§
|
Level 1
Inputs: Quoted prices (unadjusted) in active markets for
identical assets or liabilities.
|
|
|
§
|
Level 2
Inputs: Directly or indirectly observable (market-based)
information. This includes quoted prices for similar assets or
liabilities in active markets and quoted prices for identical or similar
assets or liabilities in markets that are not
active.
|
|
|
§
|
Level 3
Inputs: Unobservable inputs for the asset or liability
for which there is either no market data, or for which asset and liability
values are not correlated with market
value.
|
On
September 30, 2009, CH Energy Group reported one major category of assets and
liabilities at fair value; derivative contracts. Derivative contracts
are measured on a recurring basis. The fair value of CH Energy
Group's reportable assets and liabilities at September 30, 2009, December 31,
2008 and September 30, 2008 by category and hierarchy level follows (In
Thousands):
|
Asset
or Liability Category
|
Fair
Value
|
Quoted
Prices in Active Markets for Identical Assets
(Level 1)
|
Significant
Other Observable Inputs
(Level 2)
|
Significant
Unobservable Inputs
(Level
3)
|
||||||||||||
|
As
of September 30, 2009
|
|
|
|
|
||||||||||||
|
Assets
|
|
|
|
|
||||||||||||
|
Derivative
Contracts:
|
|
|
|
|
||||||||||||
|
Central
Hudson - Electric
|
$ | 103 | $ | - | $ | - | $ | 103 | ||||||||
|
Central
Hudson - Natural Gas
|
77 | 77 | - | - | ||||||||||||
|
Griffith
- Heating Oil
|
83 | 83 | - | - | ||||||||||||
|
Total
Assets
|
$ | 263 | $ | 160 | $ | - | $ | 103 | ||||||||
|
Liabilities
|
||||||||||||||||
|
Derivative
Contracts:
|
||||||||||||||||
|
Central
Hudson - Electric
|
$ | (10,698 | ) | $ | - | $ | - | $ | (10,698 | ) | ||||||
|
Central
Hudson - Natural Gas
|
(2,189 | ) | (2,189 | ) | - | - | ||||||||||
|
Total
Liabilities
|
$ | (12,887 | ) | $ | (2,189 | ) | $ | - | $ | (10,698 | ) | |||||
|
As
of December 31, 2008
|
||||||||||||||||
|
Liabilities
|
||||||||||||||||
|
Derivative
Contracts:
|
||||||||||||||||
|
Central
Hudson - Electric
|
$ | (5,538 | ) | $ | - | $ | - | $ | (5,538 | ) | ||||||
|
Central
Hudson - Natural Gas
|
(10,221 | ) | (10,221 | ) | - | - | ||||||||||
|
Total
Liabilities
|
$ | (15,759 | ) | $ | (10,221 | ) | $ | - | $ | (5,538 | ) | |||||
|
As
of September 30, 2008
|
||||||||||||||||
|
Assets
|
||||||||||||||||
|
Derivative
Contracts:
|
||||||||||||||||
|
Griffith
- Heating Oil
|
$ | 28 | $ | 28 | $ | - | $ | - | ||||||||
|
Total
Assets
|
$ | 28 | $ | 28 | $ | - | $ | - | ||||||||
|
Liabilities
|
||||||||||||||||
|
Derivative
Contracts:
|
||||||||||||||||
|
Central
Hudson - Electric
|
$ | (3,807 | ) | $ | - | $ | - | $ | (3,807 | ) | ||||||
|
Central
Hudson - Natural Gas
|
(10,273 | ) | (10,273 | ) | - | - | ||||||||||
|
Total
Liabilities
|
$ | (14,080 | ) | $ | (10,273 | ) | $ | - | $ | (3,807 | ) | |||||
The table
listed below provides a reconciliation of the beginning and ending net balances
for assets and liabilities measured at fair value and classified as Level 3 in
the fair value hierarchy (In Thousands):
|
|
|
|||||||
|
Three
Months Ended
|
||||||||
|
September
30, 2009
|
September
30, 2008
|
|||||||
|
Balance
at Beginning of Period
|
$ | (11,271 | ) | $ | 8,362 | |||
|
Unrealized
gains/(losses)
|
676 | (12,169 | ) | |||||
|
Realized
losses
|
(9,771 | ) | (2,335 | ) | ||||
|
Purchases,
issuances, sales and settlements
|
9,771 | 2,335 | ||||||
|
Transfers
in and/or out of Level 3
|
- | - | ||||||
|
Balance
at End of Period
|
$ | (10,595 | ) | $ | (3,807 | ) | ||
|
The
amount of total gains or losses for the period included in earnings
attributable to the change in unrealized gains or losses relating to
derivatives still held at end of period
|
- | $ | - | |||||
|
Nine
Months Ended
|
||||||||
|
September
30, 2009
|
September
30, 2008
|
|||||||
|
Balance
at Beginning of Period
|
$ | (5,538 | ) | $ | 77 | |||
|
Unrealized
losses
|
(5,057 | ) | (3,884 | ) | ||||
|
Realized
losses
|
(20,550 | ) | (1,246 | ) | ||||
|
Purchases,
issuances, sales and settlements
|
20,550 | 1,246 | ||||||
|
Transfers
in and/or out of Level 3
|
- | - | ||||||
|
Balance
at End of Period
|
$ | (10,595 | ) | $ | (3,807 | ) | ||
|
The
amount of total gains or losses for the period included in earnings
attributable to the change in unrealized gains or losses relating to
derivatives still held at end of period
|
$ | - | $ | - | ||||
For more
information regarding derivative activities of the Company, see Note 14 -
"Accounting for Derivative Instruments and Hedging Activities".
Other
Fair Value Disclosures
The
following methods and assumptions were used to estimate the fair value of each
class of financial instruments for which it is practicable to estimate that
value:
Cash and Cash
Equivalents: The carrying amount approximates fair value
because of the short maturity of those instruments.
Long-term
Debt: The fair value is estimated based on the quoted market
prices for the same or similar issues or to current rates offered to CH Energy
Group or Central Hudson for debt of the same remaining maturities and credit
quality.
Notes
Payable: The carrying amount approximates fair value because
of the short maturity of those instruments.
Notes
Receivable: The carrying value approximates fair value based
on current market rates for notes issued by companies with comparable
credit risk.
|
CH
ENERGY GROUP
|
||||||||||||||||||||||||||||||||
|
Long-term Debt Maturities and Fair
Value
|
||||||||||||||||||||||||||||||||
|
(Dollars
in Thousands)
|
|
|
|
|
|
|
|
|
|
|
|
|
|
|
|
|
|
|
|
|
|
|
|
|
|
|
|
|
|
|||
|
|
|
|
|
|
|
|
|
|
|
|
|
|
|
|
|
|
|
|
|
|
|
|
|
|
|
|
|
|
|
|
|
|
|
September 30, 2009
|
|
|
|
|
|
|
|
|
|
|
|
|
|
|
|
|
|
|
|
|
|
|
|
|
|
|
|
|
|
|
|
|
|
|
Expected
Maturity Date
|
|||||||||||||||||||||||||||||||
|
|
2009
|
|
2010
|
|
2011
|
|
2012
|
|
2013
|
|
Thereafter
|
|
Total
|
|
Fair
Value
|
|||||||||||||||||
|
Fixed
Rate:
|
|
$
|
-
|
|
|
$
|
24,000
|
|
|
$
|
-
|
|
|
$
|
36,000
|
|
|
$
|
30,000
|
|
|
$
|
282,047
|
|
|
$
|
372,047
|
|
|
$
|
390,445
|
|
|
Estimated
Effective Interest Rate
|
|
|
-
|
%
|
|
|
4.38
|
%
|
|
|
-
|
%
|
|
|
6.71
|
%
|
|
|
6.92
|
%
|
|
|
5.95
|
%
|
|
|
6.00
|
%
|
|
|
|
|
|
|
|
|
|
|
|
|
|
|
|
|
|
|
|
|
|
|
|
|
|
|
|
|
|
|
|
|
|
|
|
|
|
|
|
Variable
Rate:
|
|
$
|
-
|
|
|
$
|
-
|
|
|
$
|
-
|
|
|
$
|
-
|
|
|
$
|
-
|
|
|
$
|
115,850
|
|
|
$
|
115,850
|
|
|
$
|
115,850
|
|
|
Estimated
Effective Interest Rate
|
|
|
|
|
|
|
|
|
|
|
|
|
|
|
|
|
|
|
|
|
|
|
0.99
|
%
|
|
|
0.99
|
%
|
|
|
|
|
|
|
|
|
|
|
|
|
|
|
|
|
|
|
|
|
|
|
|
|
|
|
|
|
|
|
|
|
|
|
|
|
|
|
|
|
|
|
|
|
|
|
|
|
|
|
Total
Debt Outstanding
|
|
|
|
$
|
487,897
|
|
|
$
|
506,295
|
|
|||||||||||
|
|
|
|
|
|
|
|
|
|
|
|
Estimated
Effective Interest Rate
|
|
|
|
4.81
|
%
|
|
|
|
|
||||||||||||
|
|
|
|
|
|
|
|
|
|
|
|
|
|
|
|
|
|
|
|
|
|
|
|
|
|
|
|
|
|
|
|
|
|
|
December 31, 2008
|
|
|
|
|
|
|
|
|
|
|
|
|
|
|
|
|
|
|
|
|
|
|
|
|
|
|
|
|
|
|
|
|
|
|
Expected
Maturity Date
|
|||||||||||||||||||||||||||||||
|
|
2009
|
|
2010
|
|
2011
|
|
2012
|
|
2013
|
|
Thereafter
|
|
Total
|
|
Fair
Value
|
|||||||||||||||||
|
Fixed
Rate:
|
|
$
|
20,000
|
|
|
$
|
24,000
|
|
|
$
|
-
|
|
|
$
|
36,000
|
|
|
$
|
30,000
|
|
|
$
|
208,044
|
|
|
$
|
318,044
|
|
|
$
|
296,086
|
|
|
Estimated
Effective Interest Rate
|
|
|
6.06
|
%
|
|
|
4.38
|
%
|
|
|
-
|
%
|
|
|
6.71
|
%
|
|
|
6.92
|
%
|
|
|
5.79
|
%
|
|
|
5.91
|
%
|
|
|
|
|
|
|
|
|
|
|
|
|
|
|
|
|
|
|
|
|
|
|
|
|
|
|
|
|
|
|
|
|
|
|
|
|
|
|
|
Variable
Rate:
|
|
$
|
-
|
|
|
$
|
-
|
|
|
$
|
-
|
|
|
$
|
-
|
|
|
$
|
-
|
|
|
$
|
115,850
|
|
|
$
|
115,850
|
|
|
$
|
115,850
|
|
|
Estimated
Effective Interest Rate
|
|
|
|
|
|
|
|
|
|
|
|
|
|
|
|
|
|
|
|
|
|
|
4.10
|
%
|
|
|
4.10
|
%
|
|
|
|
|
|
|
|
|
|
|
|
|
|
|
|
|
|
|
|
|
|
|
|
|
|
|
|
|
|
|
|
|
|
|
|
|
|
|
|
|
|
|
|
|
|
|
|
|
|
|
Total
Debt Outstanding
|
|
|
|
$
|
433,894
|
|
|
$
|
411,936
|
|
|||||||||||
|
|
|
|
|
|
|
|
|
|
|
|
Estimated
Effective Interest Rate
|
|
|
|
5.43
|
%
|
|
|
|
|
||||||||||||
|
CENTRAL
HUDSON
|
||||||||||||||||||||||||||||||||
|
Long-term Debt Maturities and Fair
Value
|
||||||||||||||||||||||||||||||||
|
(Dollars
in Thousands)
|
|
|
|
|
|
|
|
|
|
|
|
|
|
|
|
|
|
|
|
|
|
|
|
|
|
|
|
|
|
|||
|
|
|
|
|
|
|
|
|
|
|
|
|
|
|
|
|
|
|
|
|
|
|
|
|
|
|
|
|
|
|
|
|
|
|
September 30, 2009
|
|
|
|
|
|
|
|
|
|
|
|
|
|
|
|
|
|
|
|
|
|
|
|
|
|
|
|
|
|
|
|
|
|
|
Expected
Maturity Date
|
|||||||||||||||||||||||||||||||
|
|
2009
|
|
2010
|
|
2011
|
|
2012
|
|
2013
|
|
Thereafter
|
|
Total
|
|
Fair
Value
|
|||||||||||||||||
|
Fixed
Rate:
|
|
$
|
-
|
|
|
$
|
24,000
|
|
|
$
|
-
|
|
|
$
|
36,000
|
|
|
$
|
30,000
|
|
|
$
|
232,047
|
|
|
$
|
322,047
|
|
|
$
|
336,130
|
|
|
Estimated
Effective Interest Rate
|
|
|
-
|
%
|
|
|
4.38
|
%
|
|
|
-
|
%
|
|
|
6.71
|
%
|
|
|
6.92
|
%
|
|
|
5.80
|
%
|
|
|
5.90
|
%
|
|
|
|
|
|
|
|
|
|
|
|
|
|
|
|
|
|
|
|
|
|
|
|
|
|
|
|
|
|
|
|
|
|
|
|
|
|
|
|
Variable
Rate:
|
|
$
|
-
|
|
|
$
|
-
|
|
|
$
|
-
|
|
|
$
|
-
|
|
|
$
|
-
|
|
|
$
|
115,850
|
|
|
$
|
115,850
|
|
|
$
|
115,850
|
|
|
Estimated
Effective Interest Rate
|
|
|
|
|
|
|
|
|
|
|
|
|
|
|
|
|
|
|
|
|
|
|
0.99
|
%
|
|
|
0.99
|
%
|
|
|
|
|
|
|
|
|
|
|
|
|
|
|
|
|
|
|
|
|
|
|
|
|
|
|
|
|
|
|
|
|
|
|
|
|
|
|
|
|
|
|
|
|
|
|
|
|
|
|
Total
Debt Outstanding
|
|
|
|
$
|
437,897
|
|
|
$
|
451,980
|
|
|||||||||||
|
|
|
|
|
|
|
|
|
|
|
|
Estimated
Effective Interest Rate
|
|
|
|
4.60
|
%
|
|
|
|
|
||||||||||||
|
|
|
|
|
|
|
|
|
|
|
|
|
|
|
|
|
|
|
|
|
|
|
|
|
|
|
|
|
|
|
|
|
|
|
December 31, 2008
|
|
|
|
|
|
|
|
|
|
|
|
|
|
|
|
|
|
|
|
|
|
|
|
|
|
|
|
|
|
|
|
|
|
|
Expected
Maturity Date
|
|||||||||||||||||||||||||||||||
|
|
2009
|
|
2010
|
|
2011
|
|
2012
|
|
2013
|
|
Thereafter
|
|
Total
|
|
Fair
Value
|
|||||||||||||||||
|
Fixed
Rate:
|
|
$
|
20,000
|
|
|
$
|
24,000
|
|
|
$
|
-
|
|
|
$
|
36,000
|
|
|
$
|
30,000
|
|
|
$
|
208,044
|
|
|
$
|
318,044
|
|
|
$
|
296,086
|
|
|
Estimated
Effective Interest Rate
|
|
|
6.06
|
%
|
|
|
4.38
|
%
|
|
|
-
|
%
|
|
|
6.71
|
%
|
|
|
6.92
|
%
|
|
|
5.79
|
%
|
|
|
5.91
|
%
|
|
|
|
|
|
|
|
|
|
|
|
|
|
|
|
|
|
|
|
|
|
|
|
|
|
|
|
|
|
|
|
|
|
|
|
|
|
|
|
Variable
Rate:
|
|
$
|
-
|
|
|
$
|
-
|
|
|
$
|
-
|
|
|
$
|
-
|
|
|
$
|
-
|
|
|
$
|
115,850
|
|
|
$
|
115,850
|
|
|
$
|
115,850
|
|
|
Estimated
Effective Interest Rate
|
|
|
|
|
|
|
|
|
|
|
|
|
|
|
|
|
|
|
|
|
|
|
4.10
|
%
|
|
|
4.10
|
%
|
|
|
|
|
|
|
|
|
|
|
|
|
|
|
|
|
|
|
|
|
|
|
|
|
|
|
|
|
|
|
|
|
|
|
|
|
|
|
|
|
|
|
|
|
|
|
|
|
|
|
Total
Debt Outstanding
|
|
|
|
$
|
433,894
|
|
|
$
|
411,936
|
|
|||||||||||
|
|
|
|
|
|
|
|
|
|
|
|
Estimated
Effective Interest Rate
|
|
|
|
5.43
|
%
|
|
|
|
|
||||||||||||
NOTE 16 – SUBSEQUENT
EVENTS
CH Energy
Group has performed an evaluation of subsequent events through November 9, 2009,
the date the financial statements were issued, and noted two events occurring
subsequent to September 30, 2009 and through the date of our evaluation
requiring disclosure. On October 15, 2009, Central Hudson contributed
$8.0 million to its Retirement Plan. On November 4, 2009, Griffith
Energy Services (“Griffith”), a subsidiary of CH Energy Group, entered into an
Asset Purchase Agreement for the sale of its holdings in Rhode Island,
Connecticut and Pennsylvania for approximately $76 million. This
divestiture follows an approximately year-long strategic review and is expected
to reduce the volatility of both earnings and cash flow of the fuel delivery
business segment. The assets to be sold include intangible assets of
$17.6 million, accounts receivable of $12.1 million, net fixed assets of $7.8
million, inventory of $2.2 million, and other current assets of $0.8
million. The liabilities to be sold total are approximately $18.7
million. In accordance with ASC 350 (formerly SFAS 142, Goodwill and Other Intangible
Assets), when a portion of a reporting unit that constitutes a business
is disposed of, goodwill associated with that business shall be included in the
carrying amount of the business in determining the gain or loss on
disposal. A goodwill allocation will be performed upon the sale of
the Griffith holdings. The sale is subject to customary commercial
closing conditions and working capital adjustments. The sale is
expected to be completed in December 2009.
|
ITEM 2
-
|
MANAGEMENT’S
DISCUSSION AND ANALYSIS OF FINANCIAL CONDITION AND RESULTS OF
OPERATIONS
|
EXECUTIVE
SUMMARY
BUSINESS
OVERVIEW
CH Energy
Group is a holding company with four business units:
Business
Segments
(1)
Central Hudson’s regulated electric utility business;
(2)
Central Hudson’s regulated natural gas utility business;
(3)
Griffith’s fuel distribution business; and
Other Businesses and
Investments
|
(4)
|
CHEC’s
investments in renewable energy supply, ethanol production, energy
efficiency, an energy sector venture capital fund, and the holding
company’s activities, which consist primarily of financing its
subsidiaries and business
development.
|
A
breakdown by business unit of CH Energy Group’s operating revenues of $213.6
million and $300.8 million for the three months ended September 30, 2009 and
2008, respectively, is illustrated below.
CH Energy Group Revenue by Business
Unit
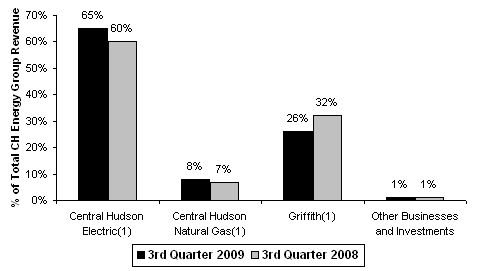
|
|
(1)
|
A
portion of the revenues above represent amounts collected from customers
for the recovery of purchased electric and natural gas costs at Central
Hudson and the cost of purchased petroleum products at Griffith and
therefore have no material impact on net income. A breakout of
these components is as follows:
|
Electric
3rd
Quarter 2009: 28% cost recovery revenues + 37% other revenues = 65%
Electric
3rd
Quarter 2008: 39% cost recovery revenues + 21 % other revenues =
60%
Natural
gas 3rd
Quarter 2009: 3% cost recovery revenues + 5% other revenues = 8%
Natural
gas 3rd
Quarter 2008: 4% cost recovery revenues + 3% other revenues = 7%
Griffith
3rd
Quarter 2009: 22% commodity costs + 4% other revenues = 26%
Griffith
3rd
Quarter 2008: 29% commodity costs + 3% other revenues = 32%
A
breakdown by business unit of CH Energy Group’s operating revenues of $792.3
million and $1,024.2 million for the nine months ended September 30, 2009 and
2008, respectively, is illustrated below.
CH
Energy Group Revenue by Business Unit
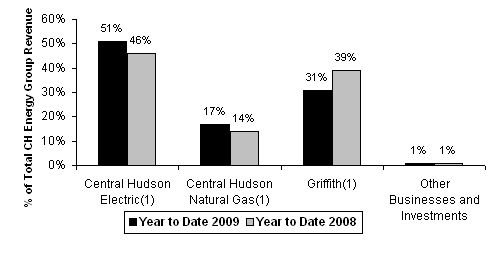
|
|
(1)
|
A
portion of the revenues above represent amounts collected from customers
for the recovery of purchased electric and natural gas costs at Central
Hudson and the cost of purchased petroleum products at Griffith and
therefore have no material impact on net income. A breakout of
these components is as follows:
|
Electric
YTD 2009: 25% cost recovery revenues + 26% other revenues = 51%
Electric
YTD 2008: 28% cost recovery revenues + 18% other revenues = 46%
Natural
gas YTD 2009: 11% cost recovery revenues + 6% other revenues = 17%
Natural
gas YTD 2008: 10% cost recovery revenues + 4% other revenues = 14%
Griffith
YTD 2009: 28% commodity costs + 3% other revenues = 31%
Griffith
YTD 2008: 37% commodity costs + 2% other revenues = 39%
A
breakdown by business unit of CH Energy Group’s net income of $5.4 million and
$2.9 million for the three months ended September 30, 2009 and 2008,
respectively, is illustrated below. The results for the three-month
periods reflect the seasonality of Central Hudson’s natural gas business and
Griffith’s fuel oil distribution business.
CH
Energy Group Net Income by Business Unit
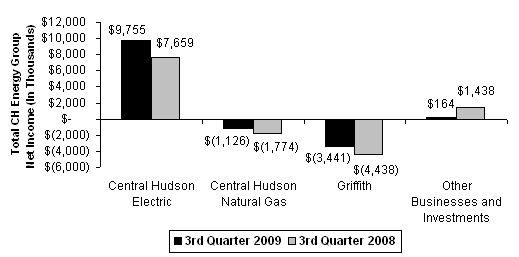
A
breakdown by business unit of CH Energy Group’s net income of $27.0 million and
$23.9 million for the nine months ended September 30, 2009 and 2008,
respectively, is illustrated below.
CH
Energy Group Net Income by Business Unit
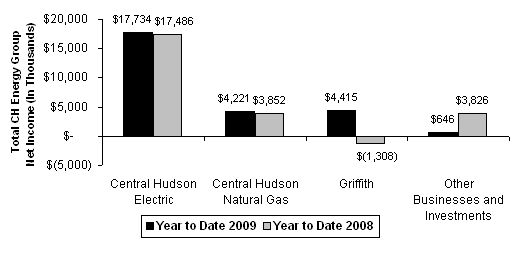
A
breakdown by segment of CH Energy Group’s total assets of $1,749 million as of
September 30, 2009 is illustrated below.
CH
Energy Group Assets at September 30, 2009 by Business Unit
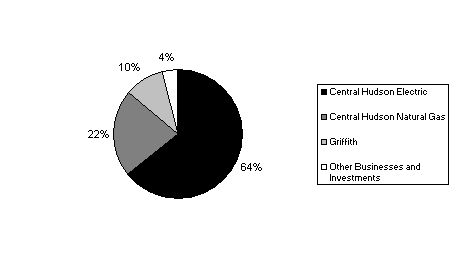
As the
graphs above indicate, as of September 30, 2009, 86% of CH Energy Group’s assets
are employed in the electric and natural gas businesses, which are subject to
regulation by the Public Service Commission (“PSC”) (as discussed in more detail
below), and the remaining 14% of its assets are employed in non-regulated
businesses. Due to the seasonality of the fuel distribution and
natural gas businesses, each business unit’s relative contribution to total
earnings can vary significantly from quarter to quarter. As such, a
more meaningful view of results can be seen on a rolling twelve month
basis. For the twelve months ended September 30, 2009, CH Energy
Group derived 70% of its net income from the regulated electric and natural gas
business and 30% of its net income from the non-regulated
businesses. The unregulated businesses’ contribution to earnings has
increased over the past few years primarily due to the increased earnings of
Griffith combined with Central Hudson’s lower earnings which have resulted from
actual sales volumes falling significantly below the projected levels in the
2006 Rate Order. Despite the relative increase in Griffith’s
contribution to earnings, the large relative proportion of the regulated utility
business is supportive of stability of earnings over the
long-term. CH Energy Group believes that this business profile
appeals to the risk appetite and return expectations of its shareholder
base.
CH Energy
Group’s objective is to deliver value to its shareholders through current
income, in the form of quarterly dividend payments, and share price appreciation
over time, which should result from earnings growth over the
long-term. CH Energy Group seeks to employ its resources in a manner
that supports this objective. The Company regularly considers a range
of strategies that include: acquisitions, alternative financial structures,
operating efficiency improvements, allocation of capital between business units,
entry into new lines of business, and divesting all or portions of existing
lines of business. The mix of strategies or relative emphasis on each
strategy evolves over time, based on the expected contribution of each strategy
to shareholder value. CH Energy Group also believes managing risk is
another important component of its strategy to deliver value to shareholders,
and emphasizes earnings and cash flow stability and
creditworthiness.
During
the third quarter of 2009, the Company continued its business focus on investing
in the regulated electric and natural gas businesses of Central
Hudson. Central Hudson continued to pursue additional opportunities
for investment in its infrastructure, as well as expanded opportunities in
electric and gas transmission, renewable energy production and energy efficiency
services.
Acquisitions
by Griffith remained suspended through the third quarter of 2009, pending
completion of Management’s strategic review which began in late
2008. The review was commenced in light of energy price volatility in
order to determine the best strategy for Griffith to deliver long-term value to
CH Energy Group shareholders. On November 4, 2009, Management
announced the completion of this review with the announcement of its planned
sale of approximately 43% of Griffith’s customer base at a
gain. Management believes this divestiture will reduce the impact of
volatility that Griffith’s operations have on CH Energy Group’s earnings and
cash flow. Concurrent with this announcement, Management announced
its intent to resume its prior acquisition strategy to expand as appropriate
through selected “tuck-in” acquisitions in the Mid-Atlantic region.
During
the second quarter of 2009, CHEC invested in a landfill gas project which
Management believes will be supportive of stable and predictable income streams
and cash flow. This investment is discussed in more detail under
Other Businesses and Investments. CHEC continues to pursue additional
investments with similar characteristics. Based on current market
conditions, the Company does not expect to invest in new ethanol
projects. Additionally, given the volatility of fuel supply prices,
the Company does not expect to invest in new biomass projects.
CH Energy
Group believes access to capital is fundamental to its long-term
success. In the second quarter of 2009, CH Energy Group
privately placed $50 million of senior unsecured notes, at an interest rate of
6.58%, for the first time introducing long-term debt that is expected to be
serviced by non-utility operations and investments. With the
continued growth of Central Hudson and with the development of new opportunities
at CHEC, the Company believes that it may also be appropriate at some point in
the next few years to issue additional shares of common equity as part of the
Company’s financing program. CH Energy Group also expects to consider
selling assets in its portfolio to raise cash and avoid, reduce, or postpone an
issuance of additional shares of common stock, as conditions
warrant.
CENTRAL
HUDSON
Central
Hudson delivers electricity and natural gas to approximately 300,000 electric
customers and 74,000 natural gas customers in a defined service territory in the
Mid-Hudson Valley region of New York State. The rates Central Hudson
charges its customers are set by the PSC. These rates are designed to
recover the cost of providing safe and reliable service to Central Hudson’s
customers and to provide a fair and reasonable return on the capital invested by
shareholders. Central Hudson’s earnings are derived primarily from
the revenue it generates from delivering energy to its
customers. Central Hudson also procures supplies of electricity and
natural gas for customers who have not chosen to utilize an independent third
party supplier. The PSC has authorized Central Hudson to recover the
costs of the electric and gas commodities from customers, without earning a
profit on the commodity costs.
Central
Hudson’s Management seeks to increase shareholder value through obtaining
current recovery of its costs of doing business, increasing its rate base, and
earning an allowed Return on Equity (“ROE”) that provides a fair and reasonable
return for providers of equity capital. Management is committed to
providing safe and reliable service, to customer satisfaction, and to promoting
positive customer and regulatory relations. Management believes these
commitments are important in its efforts to obtain full cost recovery and
reasonable returns for shareholders. Management’s strategies include
effectively managing costs, requesting rate increases to align the revenues from
customers with the cost of providing service, and investing in its energy
delivery infrastructure.
Central
Hudson filed a rate increase request with the PSC in July 2008. A
final, amended, Order was issued by the PSC on June 26, 2009, for rates
beginning July 1, 2009. The Order includes a $39.6 million and $13.8
million increase in electric and gas delivery rates, respectively, a 10.0%
allowed ROE and a common equity layer of 47%. The impact of the
electric rate increase was moderated for customers for the July 1, 2009 to June
30, 2010 rate year with a $20 million electric bill credit recovered from net
regulatory electric liability balances which have been set aside for this
purpose. Additionally, the Order approved electric and gas Revenue
Decoupling Mechanisms (“RDMs”) which should serve to prevent the significant
revenue shortfall such as that which occurred during the last three
years. Although the PSC recognized Central Hudson’s efforts and
performance in terms of high quality of service, productivity improvements and
strong cost management, the PSC’s Order included less than full recovery for
certain elements of Central Hudson’s projected costs, which could result in
Central Hudson earning less than the 10.0% authorized ROE. First, the
PSC disallowed portions of Central Hudson’s labor expense and insurance
costs. Second, the approved rates reflected a $3 million “austerity”
adjustment that the PSC stated was necessary to reduce the impact on customers’
bills in light of the weakness in the financial markets and rising
unemployment. As discussed in more detail under PSC Proceedings,
Central Hudson filed a Petition for Rehearing on certain of the disallowed
costs. Although the outcome of this position cannot be predicted, it
is not expected to have a material impact on Central Hudson’s earnings or cash
flows. Central Hudson also continues to experience relatively high
levels of uncollectible expense. The uncollectible expense incurred
by the Company for the first nine months of 2009 was 50% higher than the same
period in 2008. A significant portion of this expense is due to bad
debt write-offs above those included in rates which Management believes are due
to unfavorable economic conditions, particularly the high unemployment
rate. This expense is expected to continue to have a direct impact on
Central Hudson’s earnings, the magnitude of which Management cannot
predict. For the rate year ended June 30, 2009, the Company’s bad
debt write-offs exceeded the amount recovered through rates by $3.3
million. The Company has received approval from the PSC to defer $0.5
million of this amount for future recovery. A petition requesting
authority to defer the remaining $2.8 million was filed with the PSC on October
30, 2009. If bad debt write-offs continue to exceed the amount
recovered through rates, and the Company believes the PSC’s criteria for
deferral have been met, Central Hudson intends to continue to file petitions
seeking deferral authority for such under recoveries. See further
discussion of other such petitions under PSC Proceedings. Central
Hudson’s Management is working to control its costs in a manner that will
minimize the impact that the cost disallowances, austerity adjustment and
uncollectible accounts have imposed on Central Hudson’s ability to earn its
10.0% authorized ROE.
The
capital intensive nature of Central Hudson’s business and its obligation to
serve all customers in its franchise area require continuous access to capital
on reasonable terms. Central Hudson has historically maintained a
strong capital structure and access to capital through committed and uncommitted
lines of credit.
GRIFFITH
Griffith
provides petroleum products and services to approximately 108,000 customers in a
market area comprised primarily of parts of Connecticut, Delaware, Washington,
D.C., Maryland, Massachusetts, New Jersey, New York, Pennsylvania, Rhode Island,
Virginia, and West Virginia. Griffith’s revenues, cash flows, and
earnings are derived from the sale and delivery of heating oil, gasoline, diesel
fuel, kerosene, and propane and from the installation and maintenance of
heating, ventilating, and air conditioning equipment.
Below is
a breakdown of Griffith’s gross profit of $12.5 million and $12.2 million by
petroleum product and by service and installations for the three months ended
September 30, 2009 and 2008, respectively.
Griffith
Gross Profit by Product & Service Line
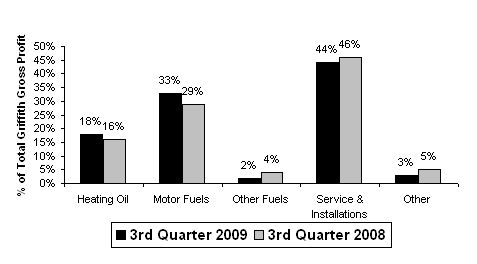
Below is
a breakdown of Griffith’s gross profit of $68.4 million and $61.1 million by
petroleum product and by service and installations for the nine months ended
September 30, 2009 and 2008, respectively.
Griffith
Gross Profit by Product & Service Line
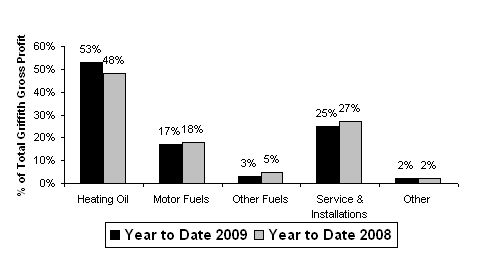
Griffith’s
Management seeks to increase shareholder value primarily through increased
earnings as a result of continued improvements in operations and by providing
its free cash flow to CH Energy Group. Management’s strategies to
achieve these goals include effectively managing costs, minimizing commodity
risk and expanding margins.
Management
believes that Griffith’s strong brand name, effective cost management practices,
and reputation for high quality, dependable service, position it well for future
contributions to CH Energy Group’s earnings and cash flows.
During
2008, Management began a strategic review of Griffith in light of recent energy
price volatility and changes in customer behavior. The review
included an evaluation of each of its products and markets to determine the best
strategy for Griffith to deliver long-term value to CH Energy Group
shareholders. On November 4, 2009, the Company announced the sale of
approximately 43% of Griffith’s customer base at a gain. These assets
are primarily located in Connecticut, Rhode Island and
Pennsylvania. The sale is expected to close in December
2009. With this sale, the Company announced its intention to resume
its prior acquisition strategy to expand as appropriate through selected
“tuck-in” acquisitions in the Mid-Atlantic region. Management
believes this divestiture will reduce the impact of volatility in earnings and
cash flows that Griffith’s operations have on CH Energy Group.
OTHER BUSINESSES AND
INVESTMENTS
In
addition to Griffith, CHEC derives earnings through investments in renewable
energy supply, ethanol production, energy efficiency, and an energy sector
venture capital fund. This business unit also includes the holding
company’s activities, which consist primarily of financing its subsidiaries and
business development.
CHEC’s
investment objectives are to increase earnings and cash flow with a heightened
focus on investments with stable and predictable income streams and cash
flows. From a portfolio perspective, Management seeks to limit
earnings and cash flow volatility through diversification of its
investments. The Company believes that renewable energy markets
provide opportunities that fit well with CHEC’s objectives.
CHEC is
investing in a project under which it will develop, construct, own and operate a
landfill gas to electric project in Auburn, NY. The project will use
methane gas generated by the City of Auburn landfill to produce electricity and
sell to the City. All of the required permits have been received,
allowing construction to begin in the third quarter of 2009.
CHEC’s
wholly-owned subsidiary, CH-Greentree, entered into an agreement in April 2009
to develop, construct and own a molecular gate system to be leased to Beacon
Landfill Gas Holdings (“Beacon”) and installed and operated at Beacon’s
currently operating landfill gas processing plant at the Greentree landfill
facility in western Pennsylvania. The molecular gate will be used to
remove nitrogen from landfill gas produced by the Greentree facility thereby
increasing its energy content and allowing Beacon to sell more of its gas
output. The term of the lease is seven years and construction was
substantially complete on June 30, 2009. This investment is expected
to provide stable, predictable earnings and cash flow as the quarterly lease
payments are fixed for the next seven years and CH-Greentree does not have any
operational responsibilities that would impact earnings or cash
flows.
OVERVIEW OF THIRD QUARTER
RESULTS
The
discussion below presents the change in earnings of CH Energy Group’s business
units in terms of earnings for each share of CH Energy Group’s Common
Stock. Management believes this presentation is useful because these
business units are each wholly owned by CH Energy Group. This
information is considered a non-GAAP financial measure and not an alternative to
earnings per share determined on a consolidated basis, which is the most
directly comparable GAAP measure.
Earnings
for CH Energy Group totaled $0.34 per share in the third quarter of 2009, versus
earnings of $0.18 per share in the same period of 2008. Year-to-date earnings
were $1.71 per share, as compared to $1.51 per share during the first nine
months of 2008.
Third
quarter 2009 results by business unit were as follows:
Central
Hudson
Central
Hudson's contribution to earnings per share was $0.55 per share, $0.18 per share
higher than the third quarter of 2008. New electric and natural gas
delivery rates and the RDMs that took effect July 1, 2009 provided an increase
of $0.43 per share over the third quarter of 2008. This increase
covered the increased operating expenses and negative impacts that both weather
and the weak economy had on sales in the third quarter of 2009 as compared to
2008. Cooler summer weather compared to the same quarter of the prior
year resulted in a decrease in earnings of $0.08 per
share. Management believes that the decrease in use per customer,
which reduced earnings $0.05 per share, and the increase in uncollectible
expense which reduced earnings by $0.05 per share are both indicative of the
weak economy.
Year-to-date,
Central Hudson has earned $1.39 per share compared to $1.35 per share posted for
the first nine months of 2008. The positive effect on year-to-date
earnings of the rate orders that took effect July 1, 2009 and July 1, 2008, as
well as lower storm restoration expenses, was largely offset by higher expenses
during the first nine months of 2009 and the impact of lower sales volumes prior
to the implementation of the RDMs.
Griffith
Griffith
posted a loss of $0.22 per share in the third quarter of 2009, a $0.06 per share
improvement over the third quarter of 2008. This quarterly loss is
expected due to the seasonal nature of Griffith’s fuel delivery
business. The improvement in Griffith’s results over the same quarter
of the prior year was due largely to a reduction in operating
expenses.
Year-to-date,
Griffith has earned $0.28 per share compared to a loss per share of $0.08 posted
for the first nine months of 2008. Griffith’s $0.36 per share
improvement in earnings was due primarily to increased margins on the sale of
petroleum products, colder winter weather and reduced operating expenses in the
first nine months of 2009 as compared to 2008, partially offset by a reduction
in sales volume as a result of customer conservation.
Other
Businesses and Investments
CH Energy
Group (the holding company) and CHEC’s partnerships and other investments
contributed earnings of $0.01 per share toward corporate earnings in the third
quarter of 2009, a decrease of $0.08 per share from the same period in
2008. This reduction in earnings is primarily the result of higher
income taxes and interest expense incurred by the holding company.
Year-to-date
earnings per share for these business units totaled $0.04 per share compared to
$0.24 per share posted for the first nine months of
2008. Year-to-date results were impacted by an equipment repair that
necessitated taking the Lyonsdale facility off line for several weeks in the
second quarter of 2009. The plant is back on line with an improved
capacity factor as a result of the repair. Year-to-date earnings were
also reduced by $0.05 per share due to a reserve recorded in the first quarter
of 2009 related to an ethanol development project of CHEC. The
reserve represents the full amount of the note receivable investment for
development expenditures and this project represented CHEC’s only current
early-stage development project. Higher interest expense at the
holding company also contributed to the reduction in earnings for the first nine
months of 2009 as compared to 2008.
PSC
PROCEEDINGS
ELECTRIC AND NATURAL GAS
RATE INCREASE
(Cases
08-E-0887 and 08-G-0888 - Proceeding on Motion of the PSC as to the Rates,
Charges, Rules and Regulations of Central Hudson Gas & Electric Corporation
for Electric and Gas Service)
Background: On July
31, 2008, Central Hudson filed an electric and natural gas rate case with the
PSC to increase, effective July 1, 2009, electric and natural gas delivery rates
which have been in effect since July 1, 2008, the final term of a three-year
rate plan that took effect on July 1, 2006.
Final Order: On
June 22, 2009, the PSC issued its Order Adopting Recommended Decision with
Modifications which was subsequently modified with an Errata Notice issued on
June 26, 2009 (“2009 Rate Order”). Components of the 2009 Rate Order
include:
|
|
Ø
|
Electric
and gas delivery increases effective July 1, 2009 of $39.6 million and
$13.8 million, respectively. The electric rate increase will be
moderated by a $20.0 million customer bill credit from an excess
depreciation reserve.
|
|
|
Ø
|
Common
equity layer of 47% of permanent
capital
|
|
|
Ø
|
Base
return on equity (“ROE”) of 10.0%
|
|
|
Ø
|
RDMs
for both electric and gas delivery service. While the primary
purpose of the RDMs is to remove a disincentive for the Company to promote
energy efficiency to its customers, they should also serve to prevent a
significant revenue shortfall such as that which occurred during the three
year period of the rate plan which ended on June 30,
2009.
|
|
|
Ø
|
An
austerity expense savings imputation of $3.0 million ($2.4 million
electric and $0.6 million gas, respectively). The 2009 Rate
Order required the Company to supplement its June 15 austerity filing to
identify specific capital and expense reductions that will be used to
implement its austerity program (which is further discussed below in Case
09-M-0435).
|
|
|
Ø
|
Continued
funding for the full recovery of the Company’s current pension and OPEB
costs and continues deferral authorization for pensions, OPEBs, research
and development costs, stray voltage testing, MGP site remediation
expenditures and electric and gas supply cost recovery and variable rate
debt.
|
|
|
Ø
|
New
deferral authorizations for: fixed debt costs; the costs to bring electric
lines into compliance with current height above ground requirements; and
the recently enacted New York State Temporary
Assessment.
|
|
|
Ø
|
Continuation,
with minor modifications, of the Company’s Electric Reliability, Gas
Safety and Customer Service performance
mechanisms
|
|
|
Ø
|
Recovery
through offset against a deferred liability account (non-cash) of the $3.3
million in incremental storm restoration costs incurred from the December
2008 ice storm (which is further discussed
below).
|
PETITION FOR
REHEARING
(Cases
08-E-0887 and 08-G-0888 - Proceeding on Motion of the PSC as to the Rates,
Charges, Rules and Regulations of Central Hudson Gas & Electric Corporation
for Electric and Gas Service)
Background: On July
22, 2009, Central Hudson filed a Petition for Rehearing on certain portions of
the 2009 Rate Order. In addition to a technical correction and
request for clarification on the application of carrying charges, the petition
sought rehearing on the following:
|
|
Ø
|
The
accounting treatment and level of expense associated with the cost of
removal for gas main replacements.
|
|
|
Ø
|
The
disallowance of 50% of Central Hudson’s Directors and Officers
insurance.
|
|
|
Ø
|
Inadequate
recovery of non-MGP environmental
expenses.
|
|
|
Ø
|
Inconsistency
of the carrying charge rate for RDMs relative to other comparable deferred
items.
|
Central
Hudson pointed out that the impact of the above items results in Central Hudson
not having a reasonable opportunity to earn the allowed ROE approved in the 2009
Rate Order.
Potential
Impacts: The Commission has not yet acted on this Petition and
no prediction can be made regarding the outcome to this proceeding at this time,
however Management does not expect this to have a material impact.
NEW ELECTRIC AND NATURAL GAS
RATE FILING REQUEST
Background: On July
31, 2009, Central Hudson filed an electric and natural gas rate case with the
PSC seeking to increase, effective July 1, 2010 electric and natural gas
delivery rates, which have been in effect since July 1, 2009.
A summary
of the most significant components of the filing include:
|
|
Ø
|
A
proposed one-year increase of $15.2 million and $3.9 million of electric
and natural gas delivery rates,
respectively.
|
|
|
Ø
|
Common
equity layer of 48% and a base return on equity (“ROE”) of
10.0%. The 10.0% ROE reflects the result of the Commission’s
decision on the Company’s allowed ROE in the 2009 Rate
Order. Central Hudson reserves its rights to file an update to
increase or reduce the requested rate of return should economic conditions
change. The current Rate Order permits a common equity layer of
47% with an allowed base ROE of
10.0%.
|
The
filing is being made in order to align electric and natural gas delivery rates
with the projected costs of providing electric and gas service to our
customers. Factors contributing to the need for an increase in rates
include the following:
|
|
Ø
|
Higher
operating costs
|
|
|
Ø
|
Regulatory
mandates
|
|
|
Ø
|
Ongoing
need for electric and natural gas system infrastructure
improvements
|
|
|
Ø
|
Rising
property taxes
|
The
filing also seeks to recover projected expenditures associated with the
following:
|
|
Ø
|
MGP
site remediation
|
|
|
Ø
|
Stray
voltage testing of Central Hudson owned and municipally owned electric
facilities
|
|
|
Ø
|
Distribution
line tree trimming
|
|
|
Ø
|
Enhanced
electric transmission right of way management
practices
|
On
September 28, 2009, a Procedural Ruling was issued by the Administrative Law
Judge (“ALJ”) adopting a case schedule. PSC Staff and Intervenor
testimony is to be filed by November 17, 2009 with either rebuttal or a joint
proposal due on December 23, 2009. From that point forward, either of
two procedural schedules will follow for litigated or settlement
tracks. The litigated track, if no joint proposal is filed by
December 23, 2009, consists of evidentiary hearings beginning January 12, 2010,
Initial Briefs due by February 1, 2010 and Reply Briefs due March 4,
2010. If a joint proposal is filed by December 23, 2009, the
settlement track includes supporting and opposing statements due January 13,
2010, evidentiary hearings beginning January 19, 2010, and Initial Briefs and
Reply Briefs due February 22 and March 8, 2010, respectively. A PSC
Order establishing new rates is not expected until the second quarter of
2010. No prediction can be made as to the final outcome of the rate
filing.
NEW YORK STATE TEMPORARY
ASSESSMENT
(Case
09-M-0311 - Implementation of Chapter 59 of the Laws of 2009 Establishing a
Temporary Annual Assessment Pursuant to Public Service Law §18-a(6)
Background: On
April 7, 2009, NYS enacted the NYS Budget of 2009-2010, which in part requires
the PSC to collect a Temporary State Energy and Utility Service Conservation
Assessment (“Temporary State Assessment”) from April 4, 2009 to March 31,
2014. On June 19, 2009, an Order was issued in the above proceeding
authorizing recovery by utilities of the revenues required for payments of the
Temporary State Assessment, including carrying charges, subject to
reconciliation over five years, July 1, 2009 through June 30,
2014. The Temporary State Assessment imposes a charge of 2% of gross
intrastate operating revenues, less the amounts assessed for the PSC General
Assessment to be collected from customers in a separately stated surcharge on
customer bills effective July 1, 2009. The Company submitted its
compliance filing in this proceeding on June 29, 2009.
DEVELOPMENT OF UTILITY
AUSTERITY PROGRAMS
(Case
09-M-0435 – Proceeding on the Motion of the Commission Regarding the Development
of Utility Austerity Programs)
Background: On May
15, 2009, the PSC issued a Notice directing each utility to closely examine its
capital expenditures, operation and maintenance expenses and any other expense
area over which it has discretion, to identify costs that may be reduced without
impairing the ability to provide safe and adequate service. The
Notice also directed each utility to report to the PSC by June 15, 2009
concerning actions taken by the utility since September 2008 to respond to the
need for austerity, the utility’s plans for austerity in the future, the
appropriate allocation of the austerity cost savings between customers and
shareholders, and the mechanisms proposed to deliver the customer portion of the
savings to customers as promptly as possible.
Notable
Activity:
2009
|
|
Ø
|
June
15, 2009 – Central Hudson filed its response, describing the financial
austerity conditions it had been operating under throughout the term of
the 2006 Rate Order, and identifying capital costs it may avoid or defer
to the next year and expense reductions that could be taken as further
austerity measures without impairing our ability to provide safe and
adequate service.
|
|
|
Ø
|
June
22, 2009 – The PSC incorporated $3 million in austerity reductions into
Central Hudson’s rates that were approved in the 2009 Rate Order for rates
beginning July 1, 2009.
|
|
|
Ø
|
July
7, 2009 – Central Hudson filed its required Supplemental Austerity filing
for PSC approval. The filing identified electric, gas and
common capital reductions that equate to $980,000 of the $2.4 million
electric and $360,000 of the $600,000 gas Economic Austerity Imputations
established in the 2009 Rate Order. To address the balance of
the austerity imputation, Central Hudson proposed a total of $1.48 million
of gas and electric expense reductions to several expense items including
research and development activities; certain maintenance expenditures; and
informational and institutional advertising. Central Hudson
also proposed executive salary freezes during 2010 and funding the
allowance for the approved transmission enhanced infrastructure
maintenance program through charges to its remaining electric excess
depreciation reserve. None of the measures proposed by the
Company are expected to materially affect the Company’s ability to provide
safe and adequate service in the rate
year.
|
Potential
Impacts: The incorporation of the $3 million austerity
reduction into the 2009 Rate Order could result in Central Hudson earning less
than the 10.0% ROE allowed in the 2009 Rate Order. No prediction can
be made regarding the outcome to this proceeding at this time.
OTHER
PSC PROCEEDINGS AND ADMINISTRATION INITIATIVES
CH Energy
Group and Central Hudson continue to monitor a number of generic and specific
regulatory proceedings. Neither CH Energy Group nor Central Hudson
can predict the final outcome of New York State’s energy policies, or the
following PSC proceedings.
ENERGY EFFICIENCY PORTFOLIO
STANDARD AND STATE ENERGY PLANNING
(Case
07-M-0548 – Proceeding on Motion of the PSC Regarding an Energy Efficiency
Portfolio Standard and Governor Paterson’s Executive Order issued April 9,
2008)
Background: Governor
Paterson affirmed his support for the previous administration’s goal of
substantially reducing electricity usage. In support of this goal,
the PSC is investigating various approaches to reduce customers’ demand for
energy and to provide utility incentives for meeting specified energy savings
targets.
Notable
Activity:
2008
|
|
Ø
|
State
Energy Plan
|
|
|
·
|
Governor
Paterson issued an Executive Order establishing a State Energy Planning
Board and authorizing the creation and implementation of a State Energy
Plan (“SEP”).
|
|
|
·
|
Central
Hudson submitted its own comments on the draft scope of the State Energy
Plan and joined those submitted by the Energy Association of New York
State Member Companies’ comments. Central Hudson also provided
briefing papers to the SEP working group on pressing issues facing Central
Hudson for consideration in developing the
SEP.
|
|
|
Ø
|
PSC
|
|
|
·
|
Central
Hudson has filed comments with the PSC supporting the opportunity to
establish energy efficiency businesses, with corresponding opportunities
to contribute to the state energy goal of reducing electricity consumption
by 15% by 2015 and provide meaningful earnings for investors from energy
efficiency services.
|
|
|
·
|
The
PSC established energy efficiency targets to be achieved by individual
utilities through 2011 that included three utility administered fast track
programs and five fast track programs to be administered by the New York
State Energy Research and Development Authority
(“NYSERDA”). Central Hudson has filed its plans to implement
its programs with the PSC.
|
|
|
·
|
Effective
October 1, 2008, the PSC ordered the creation of a gas System Benefit
Charge and increased electric System Benefit Charges to invest in funding
these energy efficiency programs.
|
2009
|
|
·
|
On
January 7, 2009, Governor Paterson outlined various strategies and policy
goals in his State of the State address, including one of the most
aggressive clean energy goals in the country, with a goal for New York to
meet 45% of its electricity needs by 2015 (“45 x 15”) through improved
energy efficiency and clean renewable energy production. This would
be accomplished by expanding the Renewable Portfolio Standard from 25% by
2013 to 30% by 2015 and decreasing electric usage by 15% by
2015.
|
|
|
·
|
A
SEP Interim Report was issued for comment on March 31,
2009. Central Hudson filed comments on May 15, 2009 in support
of policies and efforts with potential to promote economic development and
job creation, foster private investment, increase the tax base, enhance
energy reliability, lower customer bills and protect public health, safety
and the environment. The SEP schedule has been modified to
provide for the issuance of a 2009 Draft SEP on August 10, with a Final
2009 SEP to be issued in December of
2009.
|
|
|
·
|
The
PSC will continue to work on additional issues of the energy efficiency
program design with participation by interested parties in various working
groups that include utility performance incentives, on-bill financing,
demand response and peak reduction and impacts on low-income and rental
customers.
|
Potential Impacts: This PSC
proceeding could result in opportunities for increased earnings from incentives
associated with achieving energy efficiency targets or negative rate adjustments
if the 70% performance criterion is not met. No prediction can be
made regarding the final outcome of this matter, however, any earnings
variations are not likely to be material.
REQUESTS FOR DEFERRAL OF
INCREMENTAL COSTS
(Case
09-M-0009 – Petition of Central Hudson Gas & Electric Corporation for
Authority to Defer Incremental Costs Related to the December 11, 2008 Ice
Storm)
Background and
Impact: In December 2008, Central Hudson filed a petition with
the PSC seeking approval to defer certain incremental and material storm
restoration expenses resulting from a severe ice storm in December 2008 that
disrupted service to approximately 72,000 of Central Hudson’s customers.
The initial petition sought PSC authorization to defer $3.1 million of
incremental expenses at December 31, 2008. An updated schedule
showing total costs incurred at $3.3 million was provided to the PSC as of March
31, 2009. The PSC authorized the deferral request and agreed that the
incremental storm costs would be included on the electric offset list for the
rate year in Central Hudson’s rate increase proceeding which was discussed
earlier in this section.
(Case
09-M-0140 – Petition of Central Hudson Gas & Electric Corporation for
Authority to Defer Bad Debt Net Write-Off Expense for the Year Ended December
31, 2008)
Background and
Impact: In February 2009, Central Hudson filed a petition with
the PSC seeking approval to defer $1.28 million of incremental electric and
$541,000 of gas net bad debt write-off expense incurred during the twelve months
ended December 31, 2008 over the amounts provided for in rates during that
period. In an Order issued August 24, 2009, the Commission granted
authority to defer the gas incremental bad debt write-off expense of $541,000,
but denied the Company’s deferral request for the electric incremental expense
on the basis that it did not meet the Commission’s materiality standard for
deferral.
(Case
09-G-0139 – Petition of Central Hudson Gas & Electric Corporation for
Authority to Defer Gas Leak Repairs Expense for the Year Ended December 31,
2008)
Background and
Impact: In February 2009, Central Hudson filed a petition with
the PSC seeking approval to defer $479,000 of incremental gas non-labor expense
related to leak repairs incurred during the twelve months ended December 31,
2008 over the amounts provided for in rates during that period. In an
Order issued August 20, 2009, the Commission denied the Company’s request
concluding that the request did not meet the Commission’s requirement that an
item must be extraordinary in nature, in order to qualify for deferral
accounting treatment.
(Case
09-M-0788 – Petition of Central Hudson Gas & Electric Corporation for
Authority to Defer Gas Debt Net Write-Off Expense for the Twelve Months Ended
June 30, 2009)
Background: In
October 2009, Central Hudson filed a petition with the PSC seeking approval to
defer $2.339 million of incremental electric and $447,000 of incremental gas net
bad debt write-off expense incurred during the twelve months ended June 30, 2009
(Rate Year 3 of the 2005 Rate Plan) over the amounts provided for in our rates
during that time period and over the gas deferral amount provided in Case
09-M-0140.
Potential Impacts: The $2.786
million of incremental gas and electric net bad debt write-off expenses were
reflected in Central Hudson’s earnings and cash flows in 2008 and
2009. This PSC proceeding could result in deferral of these
incremental uncollectible expenses which would result in an increase in earnings
and upon future recovery, an increase in cash flows. Central Hudson
believes it has made a strong demonstration in support of its deferral request
and given recent Commission decisions with positive outcomes regarding the ice
storm and the gas portion of the 2008 net bad debt deferral petition; however,
Management cannot predict the outcome of this filing.
ADVANCED METERING
INFRASTRUCTURE
(Case
09-M-0074 - Proceeding on Matter of Advanced Metering
Infrastructure)
Background: On
February 13, 2009, the PSC issued an Order establishing minimum functional
requirements for Advanced Metering Infrastructure (“AMI”) in New York State and
creating a process for the development of a generic approach to the benefit/cost
analysis of AMI. The February 13th
Order directs Central Hudson to file an AMI pilot program within 60
days. The filing requirements set forth by the PSC in the Order were
designed to put utilities on track to potentially receive federal financial
assistance that may become available under the American Recovery and
Reinvestment Act of 2009’s (“ARRA”) Department of Energy (“DOE”) administered
program for Electricity Delivery and Energy Reliability (“EDER”). The
DOE may provide grants to successful applicants under the EDER program in an
amount equal to not more than 50% of the costs of qualifying
investments.
Notable
Activity:
2009
|
|
·
|
On
April 14, 2009 Central Hudson filed its AMI and Smart Grid Proposal with
the PSC.
|
|
|
·
|
On
April 14, 2009, the PSC issued its “Proposed Framework for the
Benefit-Cost Analysis of Advanced Metering Infrastructure”. A
Notice Seeking Comment on the proposal was also issued directing parties
to file comments on the generic benefit-cost framework by June 15,
2009.
|
|
|
·
|
The
Company filed comments on June 15,
2009.
|
|
|
·
|
In
an AMI / ARRA Order issued July 27, 2009, the Commission approved the
Company’s project proposals, which allows the Company to demonstrate on
application to the DOE, a ratepayer commitment, through cost recovery via
a surcharge, for the portion of eligible project costs not covered by the
DOE grant. This PSC funding approval was necessary for the
Company to proceed with its DOE
filing.
|
|
|
·
|
On
August 4, 2009, Central Hudson submitted its grant application with the
DOE.
|
|
|
·
|
On
October 27, 2009, the DOE notified Central Hudson that the Company’s
application submitted in response to the Smart Grid Investment Grant
funding opportunity was not selected for
award.
|
|
|
·
|
The
Company is currently reviewing and reconsidering its AMI / Smart Grid
position. No prediction can be made regarding future steps at
this time.
|
THE ARRA PROJECT
FUNDING
(Case
09-E-0310 – In the Matter of American Recovery and Reinvestment Act of 2009 –
Utility Filings for New York Economic Stimulus)
Background: ARRA
includes a DOE administered program for EDER. The sum of $4.5 billion
is appropriated by ARRA for the EDER program to be dispersed by DOE through a
competitive grant process. Additional funds may also be available
through programs such as Transportation Electrification.
Notable
Activity:
2009
|
|
·
|
The
PSC on April 2, 2009 sent a letter to the state’s regulated utilities
requesting a submittal of project lists from the utilities that are being
considered for application for ARRA
funding.
|
|
|
·
|
Regulated
utilities, New York Power Authority (“NYPA”), Long Island Power Authority
(“LIPA”), NYSERDA and NYISO, along with other parties have been discussing
potential collaborative project filings, some of which are in
development.
|
|
|
·
|
The
ARRA funding in some cases only covers a portion of the project costs and
therefore will require other funding sources which may include ratepayer
funds for which PSC approval is
required.
|
|
|
·
|
Central
Hudson submitted its current project list to PSC on April 17, 2009 and
filed its updated stimulus plans with the PSC on July 2,
2009.
|
|
|
·
|
In
an AMI / ARRA Order issued July 27, 2009, the Commission approved the
Company’s project proposals, which allows the Company to demonstrate on
application to the DOE, a ratepayer commitment, through cost recovery via
a surcharge, for the portion of eligible project costs not covered by the
DOE grant. This PSC funding approval was necessary for the
Company to proceed with its DOE
filing.
|
|
|
·
|
On
August 4, 2009, Central Hudson submitted its grant application with the
DOE.
|
|
|
·
|
On
October 27, 2009, the DOE notified Central Hudson that the Company’s
application submitted in response to the Smart Grid Investment Grant
funding opportunity was not selected for
award.
|
|
|
·
|
The
Company is currently reviewing and reconsidering its AMI / Smart Grid
position. No prediction can be made regarding future steps at
this time.
|
CENTRAL HUDSON GAS &
ELECTRIC FINANCING PETITION
(Case
09-M-0308 – Petition of Central Hudson Gas & Electric Corporation for
Authority to enter into multi-year committed credit agreements and issue and
sell long-term debt)
Background: On
March 26, 2009, Central Hudson filed a petition with the PSC seeking approval to
(a) enter into multi-year committed credit agreements to provide committed
funding to meet expected liquidity needs, in amounts not to exceed $175 million
in the aggregate and maturities not to exceed five years, and (b) approval to
issue and sell long-term debt, commencing immediately upon issuance of an order
regarding the petition, and from time to time through December 31, 2012, in an
amount not to exceed $250 million in the aggregate.
Notable
Activity:
2009
|
|
·
|
Central
Hudson filed its petition on March 26,
2009.
|
|
|
·
|
An
order approving the above requests was received on September 22,
2009.
|
Impacts: Central
Hudson’s ability to seek a higher level of committed credit will enable greater
liquidity to support construction forecasts, known seasonality, volatile energy
markets, adverse borrowing environments, and other unforeseen
events. The approval to issue and sell $250 million of long-term debt
will support Central Hudson’s ability to finance its construction expenditures,
refund maturing long-term debt, and potentially refinance $116 million of
multi-modal long-term NYSERDA bonds, which are currently in auction rate
mode.
CAPITAL
RESOURCES AND LIQUIDITY
The
growth of CH Energy Group's retained earnings in the nine months ended September
30, 2009, contributed to the increase in the book value per share of its Common
Stock from $33.17 at December 31, 2008, to $33.27 at September 30,
2009. Common equity comprised 49.9% of total capital (including
short-term debt) at September 30, 2009, a decrease from 51.6% at December
31, 2008. Book value per share at September 30, 2008 was $33.00
and the common equity ratio was 52.2%.
Both CH
Energy Group’s and Central Hudson’s liquidity reflect cash flows from operating,
investing, and financing activities, as shown on their respective Statements of
Cash Flows, and as discussed below.
The
principal factors affecting CH Energy Group’s liquidity are the net cash flows
resulting from the operations of its subsidiaries, subsidiary capital
expenditures and investments, the external financing of its subsidiaries, and
the dividends CH Energy Group pays to its shareholders.
Central
Hudson’s cash flows from operating activities reflect principally its energy
deliveries and costs of operations. Variations in the volume of
energy deliveries are primarily driven by factors external to Central Hudson,
such as weather and economic conditions, including the price of energy and the
resulting changes in customer usage. Prices at which Central Hudson
delivers energy to its customers are determined in accordance with rate plans
approved by the PSC. In general, changes in the cost of purchased
electricity and natural gas may affect the timing of cash flows but do not
directly impact net income, as these costs are fully recoverable through Central
Hudson’s electric and natural gas cost adjustment mechanisms. Higher
energy prices also increase accounts receivable, which along with generally
unfavorable economic conditions, can have an impact on customers’ ability to pay
their bills on time, potentially resulting in a higher number of uncollectible
accounts and an unfavorable impact on cash flows and results of
operations. Also, changes in energy prices and other factors may
cause customers to use more or less energy than projected in the current rate
plan. Under the terms of the current rate plan, such variations are
deferred for future recovery from or refund to customers. If the deferral
amounts reach $4.0 million for electric delivery revenue and $2.0 million for
natural gas delivery, recovery or refund will begin, allowing recovery or
refunding of the balance over the subsequent twelve months. These trigger points
limit the cash impact of such sales variations, although the timing of these
cash flows may differ from those that would have been received from actual
sales.
Central
Hudson’s cash flows are also affected by capital expenditures, long-term
financing for its growing asset base, fluctuations in working capital primarily
caused by weather, energy prices, the level of customer accounts receivable, and
other regulatory deferral mechanisms that may result in cash being expended in
one period and recovered from customers in a subsequent period.
CH ENERGY GROUP - CASH FLOW
SUMMARY
Changes
in CH Energy Group’s cash and cash equivalents resulting from operating,
investing, and financing activities are summarized in the following chart (In
Millions):
|
Nine
Months Ended September 30,
|
||||||||
|
2009
|
2008
|
|||||||
|
Net
Cash Provided By/(Used In):
|
|
|||||||
|
Operating
Activities
|
$ | 121.0 | $ | 78.7 | ||||
|
Investing
Activities
|
(97.4 | ) | (67.2 | ) | ||||
|
Financing
Activities
|
8.8 | (11.5 | ) | |||||
|
Net
change for the period
|
32.4 | - | ||||||
|
Balance
at beginning of period
|
19.8 | 11.3 | ||||||
|
Balance
at end of period
|
$ | 52.2 | $ | 11.3 | ||||
CH Energy
Group’s cash and cash equivalents increased by $32.4 million for the nine months
ended September 30, 2009 and remained flat for the nine months ended September
30, 2008. For each of these periods, CH Energy Group’s working
capital needs were provided by cash from operations and supplemented seasonally
with short-term financing as needed. Capital expenditures,
investments and dividends in both years, as well as acquisitions in 2008, were
partially funded with cash from operations in excess of expenses and working
capital needs. The remainder of the funding for investing activities
was provided by long-term debt issued by Central Hudson and CH Energy Group and
supplemented in 2008 with proceeds from the sale of short-term
investments.
Net cash
provided by operations was $121.0 million and $78.7 million for the nine months
ended September 30, 2009 and 2008, respectively. Cash provided by
sales exceeded the period’s expenses and working capital needs for each year,
particularly in 2009 when lower energy prices resulted in a significant return
of working capital. In the third quarter of 2009, Central Hudson paid
$17.7 million to the PSC for a new tax surcharge instituted in April
2009. This charge represented a full year assessment, however, only
$3.1 million of this surcharge has been collected from customers to
date. The remainder, which is being collected over the next six
months, increased Central Hudson’s working capital needs in the current period,
requiring financing. Central Hudson also paid $1.1million to the PSC
for the bi-annual general assessment, of which $0.2 million has been collected
to date. In March 2010, Central Hudson will begin making bi-annual
installments of approximately $8.9 million for this surcharge and will collect
the amounts from customers on an on-going basis.
Net cash
used in investing activities was $97.4 million and $67.2 million in the nine
months ended September 30, 2009 and 2008, respectively. Cash was used
primarily to fund investments in Central Hudson’s electric and natural gas
systems. In June 2009, Central Hudson closed on the purchase of
certain real-estate in Kingston, NY resulting in an increase of approximately
$13 million to plant additions and a reduction to liabilities. Other
increases in capital expenditures at Central Hudson in the current year relate
primarily to maintenance and proactive repairs to transmission and distribution
infrastructure. In 2008, cash was also used for acquisitions made by
Griffith and was partially offset by proceeds from the liquidation of short-term
investments held by the holding company.
Net cash
provided by (used in) financing activities was $8.8 million and ($11.5) million
for the nine months ended September 30, 2009 and 2008,
respectively. Financing activities have consistently included
dividends of $25.6 million. In 2008, the use of cash overdraft due to
increased interest rates at Central Hudson and the proceeds of short-term debt
at Griffith were used to supplement working capital needs and to pay dividends
in 2008. Central Hudson’s and Griffith’s cash flows benefited from
lower energy prices in the first 9 months of 2009. Cash from
operations in excess of expenses and working capital needs was used to repay
short-term borrowings in 2009 and redeem Central Hudson’s long-term debt of
$20.0 million at maturity in January 2009. In addition, CH Energy
Group sold $50 million of 5-year notes in the second quarter of 2009 to provide
long-term debt financing for CHEC. Central Hudson issued $24 million
of 30-year notes in September 2009, the proceeds of which were used primarily
for the repayment of short-term debt incurred as interim financing for capital
expenditures.
CENTRAL HUDSON - CASH FLOW
SUMMARY
Changes
in Central Hudson’s cash and cash equivalents resulting from operating,
investing, and financing activities are summarized in the following chart (In
Millions):
|
Nine
Months Ended September 30,
|
||||||||
|
2009
|
2008
|
|||||||
|
Net
Cash Provided By/(Used In):
|
|
|||||||
|
Operating
Activities
|
$ | 89.2 | $ | 57.0 | ||||
|
Investing
Activities
|
(89.8 | ) | (59.4 | ) | ||||
|
Financing
Activities
|
19.4 | (1.0 | ) | |||||
|
Net
change for the period
|
18.8 | (3.4 | ) | |||||
|
Balance
at beginning of period
|
2.5 | 3.6 | ||||||
|
Balance
at end of period
|
$ | 21.3 | $ | 0.2 | ||||
Central
Hudson’s cash and cash equivalents increased by $18.8 million and decreased by
$3.4 million for the nine months ended September 30, 2009 and 2008,
respectively. For each of these periods, Central Hudson’s working
capital needs were provided by cash from operations and supplemented seasonally
with short-term financing as needed. Cash from operations in excess
of expenses and working capital needs provided partial funding for capital
expenditures in both 2009 and 2008. The remainder of the funding for
capital expenditures was provided by an equity investment from CH Energy Group
and long-term debt issued by Central Hudson.
Net cash
provided by operations was $89.2 million and $57.0 million for the nine months
ended September 30, 2009 and 2008, respectively. Cash provided by
sales exceeded the period’s expenses and working capital needs in both periods,
particularly in 2009 when lower energy prices resulted in a significant return
of working capital. In the third quarter of 2009, Central
Hudson paid $17.7 million to the PSC for a new tax surcharge instituted in April
2009. This charge represented a full year assessment, however, only
$3.1 million of this surcharge has been collected from customers to
date. The remainder, which is being collected over the next six
months, increased Central Hudson’s working capital needs in the current period,
requiring financing. Central Hudson also paid $1.1 million to the PSC
for the bi-annual general assessment, of which $0.2 million has been collected
to date. In March 2010, Central Hudson will begin making bi-annual
installments of approximately $8.9 million for this surcharge and will collect
the amounts from customers on an on-going basis.
Net cash
used in investing activities of $89.8 million and $59.4 million in the nine
months ended September 30, 2009 and 2008, respectively, was primarily for
investments in its electric and natural gas systems. In June 2009,
Central Hudson closed on the purchase of certain real-estate in Kingston, NY
resulting in an increase of approximately $13 million to plant additions and a
reduction to liabilities. Other increases in capital expenditures at
Central Hudson in the current year relate primarily to maintenance and proactive
repairs to transmission and distribution infrastructure.
Net cash
provided by (used in) financing activities was $19.4 million and ($1.0) million
in the nine months ended September 30, 2009 and 2008,
respectively. During these periods, Central Hudson retained its net
income to invest in its transmission and distribution systems. In
2008, the repayment of $6.0 million of short term debt was partially offset by
the use of a temporary cash overdraft of $5.8 million, which was the preferred
financing mechanism due to increased interest rates on short-term
debt. Central Hudson’s cash flow benefited from lower energy prices
in the first nine months of 2009. Cash from operations in excess of
expenses and working capital needs were used to repay short-term borrowings in
2009 and redeem its long-term debt of $20.0 million at maturity in January
2009. Additionally, an investment of $25.0 million from CH Energy
Group in April of 2009 and the proceeds from the issuance of $24 million of
30-year notes supplemented the funding of capital expenditures.
CAPITALIZATION – COMMON
STOCK REPURCHASE PROGRAM
On July
27, 2007, the Board of Directors of CH Energy Group extended and amended the
Common Stock Repurchase Program of the Company, which was originally authorized
on July 25, 2002 and further disclosed in the caption “Repurchase Program” of
Note 8 – “Capitalization – Common and Preferred Stock” to the Financial
Statements of the Corporations’ 10-K Annual Report.
No common
stock was repurchased during the nine months ended September 30,
2009.
CAPITALIZATION – EQUITY
INVESTMENT
In April
2009, CH Energy Group invested $25 million in Central Hudson, which was recorded
as additional paid-in capital. Central Hudson paid no common stock
dividends in the first nine months of 2009 and expects to maintain its current
equity ratio of 48%, excluding short-term debt.
CAPITALIZATION – ISSUANCE OF
TREASURY STOCK
Effective
January 26, 2009, CH Energy Group granted 2,930 restricted shares to certain
officers and key employees of Griffith. Effective October 1, 2009, CH
Energy Group granted 14,375 restricted shares to a new CH Energy Group executive
officer. These restricted shares granted were issued from CH Energy
Group’s treasury stock.
On May 1,
2009, performance shares earned as of December 31, 2008 for the award cycle with
a grant date of April 25, 2006 were issued to participants. Those
recipients electing not to defer this compensation under the CH Energy Group
Directors and Executives Deferred Compensation Plan received shares issued from
CH Energy Group’s treasury stock. A total of 4,560 shares were issued
from CH Energy Group’s treasury stock on May 1, 2009. Additionally,
due to the retirement of one of Central Hudson’s executive officers on January
1, 2009, a pro-rated number of shares under the January 25, 2007 and January 24,
2008 grants were paid to this individual on July 2, 2009. An
additional 294 shares were issued from CH Energy Group’s treasury stock on this
date in satisfaction of these awards.
For
further information regarding the above equity compensation, see Note 11 –
“Equity Based Compensation” of this Quarterly Report on Form
10-Q. The Company intends to continue to utilize shares issued from
CH Energy Group’s treasury stock for the payout of future performance
awards.
CONTRACTUAL
OBLIGATIONS
Other
contractual obligations and commitments of CH Energy Group are disclosed in Note
12 – “Commitments and Contingencies” of this Quarterly Report on Form 10-Q under
the caption “Electric Purchase Commitments.”
Central
Hudson determines the amount it will contribute to its pension plan (the
“Retirement Plan”) based on several factors, including the value of plan assets
relative to plan liabilities, legislative requirements, regulatory
considerations, and available corporate resources. The amount of the
Retirement Plan’s liabilities is affected by the discount rate used to determine
benefit obligations and the accrual of additional benefits. Central
Hudson considers the provisions of the Pension Protection Act of 2006 in
determining its funding for the Retirement Plan for the near-term and future
periods. Despite recent gains in the financial markets, Central
Hudson cannot predict the funding impact of these gains on the Plan because the
annual valuation driving contributions was performed as of October 1, 2008, the
Retirement Plan year-end and has not been updated for the current plan year at
this time. Funding for the Retirement Plan totaled $14.6 million and
$12.5 million for the nine months ended September 30, 2009 and 2008,
respectively. On October 15, 2009, Central Hudson made an additional
contribution of $8.0 million to the Retirement Plan. Central Hudson
does not anticipate making any additional contributions to the Retirement Plan
in 2009.
Employer
contributions for OPEB plans were $1.3 million during the nine months ended
September 30, 2009 and $4.2 million during the nine months ended September 30,
2008. The determination of future funding depends on a number of
factors, including the discount rate, expected return on plan assets, medical
claims assumptions used, benefit changes and corporate
resources. Funding for the remainder of 2009 is expected to be
approximately $2.2 million.
Adverse
conditions in the economy and financial markets over the past year,
significantly reduced the values of the assets held in the Retirement Plan and
the OPEB Plans, and had a negative impact on the funded status of the
plans. If future market conditions do not improve sufficiently to
offset these changes, additional contributions will likely be required in future
years. Management expects that such contributions will be
incorporated in Central Hudson’s rate making process over
time. Central Hudson has investment policies for these plans, which
include asset allocation ranges designed to achieve a reasonable return over the
long-term, recognizing the impact of market volatility. Management
cannot currently predict what impact the recent performance of the financial
markets may have on the expected rate of return on plan assets or on future
funding decisions.
FINANCING
PROGRAM
CH Energy
Group believes that it is well positioned with a strong balance sheet and strong
liquidity. Significant capacity remains on CH Energy Group’s and
Central Hudson’s committed credit facilities. Central Hudson’s strong
investment-grade credit ratings help facilitate access to long-term
debt. However, Management can make no assurance in regards to the
continued availability of financing or the terms and costs. With the
exception of the use of treasury shares for several restricted share grants and
performance share awards earned, no significant equity issuance is currently
planned for 2009. CH Energy Group Common Stock has maintained a
market premium to its book value.
At
September 30, 2009, CH Energy Group and its subsidiaries maintained credit
facilities with JPMorgan Chase Bank, N.A., Bank of America, N.A., HSBC Bank USA,
N.A. and Key Bank National Association. If these lenders are unable
to fulfill their commitment under these facilities, funding may not be available
as needed.
At
September 30, 2009, CH Energy Group, on a consolidated basis, had $41.0 million
of short-term debt and had cash and cash equivalents of $52.2
million.
CH Energy
Group has a $150 million revolving credit facility with several commercial
banks. As of September 30, 2009 and December 31, 2008, there were no
borrowings under this CH Energy Group revolving credit facility. As
of September 30, 2008, under this facility $15.0 million was
outstanding.
Central
Hudson maintains a revolving credit facility with several commercial banks,
pursuant to PSC authorization, in the amount of $125 million, for a five-year
term ending January 2, 2012. As of September 30, 2009 and December
31, 2008, there were no borrowings under this facility. As of
September 30, 2008, Central Hudson’s outstanding loan balance under this
agreement was $15 million.
Central
Hudson also maintains certain uncommitted lines of credit that diversify its
sources and provide competitive options to minimize its cost of short-term
debt. As of September 30, 2009, $17.0 million was outstanding under
these lines of credit. As of December 31, 2008 and September 30,
2008, Central Hudson’s outstanding balance on these lines of credit, in
aggregate, was $25.5 million and $21.5 million, respectively.
Central
Hudson’s current senior unsecured debt rating/outlook is ‘A’/stable by both
Standard & Poor’s Rating Services (“Standard & Poor’s”) and Fitch
Ratings and ‘A3’/negative by Moody’s Investors Service (“Moody’s”).4 On
September 9, 2009, Moody’s downgraded Central Hudson’s senior unsecured debt and
issuer ratings to ‘A3’ from ‘A2’. Moody’s has stated that the downgrade was due
to weakness in the company’s financial performance through the year ended June
30, 2009. Moody’s maintained the outlook at negative to reflect the
current weakness in financial metrics and the company’s ongoing need for rate
relief to support planned capital expenditures. The downgrade is not
expected to have a material impact on Central Hudson’s financial
performance.
In
January 2008, Griffith established an uncommitted line of credit of up to $25
million with a commercial bank for the purpose of funding seasonal working
capital. As of April 30, 2009, Griffith allowed its uncommitted line
of credit to expire. As of December 31, 2008, there were borrowings
under this facility of $10.0 million. As of September 30, 2008, there were no
borrowings under this facility. Griffith may seek to replace the credit line
with credit from a commercial bank or an intercompany borrowing agreement with
CH Energy Group.
CH Energy
Group and Central Hudson believe they will be able to meet their reasonably
likely short-term and long-term cash requirements, assuming that Central
Hudson’s future rate plans reflect the costs of service, including a reasonable
return on invested capital.
On March
27, 2009, Central Hudson filed with the Public Service Commission of the State
of New York a Financing Petition seeking authorization to increase its
multi-year committed credit to $175 million and to issue up to $250 million of
long-term debt through December 31, 2012. An order was issued on
September 22, 2009. The order authorizes Central Hudson to seek a higher level
of committed credit, which will enable greater liquidity to support construction
forecasts, known seasonality, volatile energy markets, adverse borrowing
environments, and other unforeseen events. Additionally, the approval to issue
and sell $250 million of long-term debt will support Central Hudson’s ability to
finance its construction expenditures, refund maturing long-term debt, and
potentially refinance $115.9 million of multi-modal long-term NYSERDA bonds,
which are currently in auction rate mode. Central Hudson plans to
register a new series of bonds pursuant to the authority granted by the
PSC.
______________________________
4 These
ratings reflect only the views of the rating agency issuing the rating, are not
recommendations to buy, sell, or hold securities of Central Hudson and may be
subject to revision or withdrawal at any time by the rating agency issuing the
rating. Each rating should be evaluated independently of any other
rating.
Central
Hudson has five debt series that were issued in conjunction with the sale of
tax-exempt pollution control revenue bonds by NYSERDA. These NYSERDA
bonds, totaling $166 million, are insured by Ambac. The current
underlying rating and outlook on these bonds and Central Hudson’s other senior
unsecured debt is ‘A’/stable by Standard & Poor’s and Fitch Ratings and
‘A3’/negative by Moody’s.5
Central
Hudson’s 1998 NYSERDA Series A Bonds, totaling $16.7 million, were re-marketed
on December 1, 2008. Under the terms of the applicable indenture, the
bonds were converted to a fixed rate of 6.5%, which will continue until their
maturity in December 2028.
Central
Hudson’s 1999 NYSERDA Series A Bonds, totaling $33.4 million, have an interest
rate that is fixed to maturity in 2027 at 5.45%.
Central
Hudson’s 1999 NYSERDA Bonds, Series B, C, and D, totaling $115.9 million, are
multi-modal bonds that are currently in auction rate mode. Beginning
in 1999 when the bonds were issued, the bonds’ interest rate has been reset
every 35 days in a dutch auction. Auctions in the market for
municipal auction rate securities have experienced widespread failures since
early in 2008. Generally, an auction failure occurs because there is
an insufficient level of demand to purchase the bonds and the bondholders who
want to sell must hold the bonds for the next interest rate
period. Since February 2008, all auctions for Central Hudson’s three
series of auction rate bonds have failed. As a consequence, the
interest rate paid to the bondholders has been set to the then prevailing
maximum rate defined in the trust indenture. Central Hudson’s maximum
rate results in interest rates that are generally higher than expected results
from the auction process. For the foreseeable future, Central Hudson
expects the interest rate to be set at the maximum rate, determined on the date
of each auction as 175% of the yield on an index of tax-exempt short-term debt,
or its approximate equivalent. In the third quarter of 2009, the
average maximum rate applicable on the bonds was 0.65%. In its
Orders, the PSC has authorized deferral accounting treatment for the interest
costs from Central Hudson’s three series of variable rate 1999 NYSERDA
Bonds. As a result, variations in interest rates on these bonds are
deferred for future recovery from or refund to customers and Central Hudson does
not expect the auction failures to have any adverse impact on
earnings. To mitigate the potential impact of unexpected increases in
short-term interest rates, Central Hudson purchases interest rate caps based on
an index for short-term tax-exempt debt. Effective April 1, 2009,
Central Hudson entered into a one-year rate cap with Key Bank National
Association to protect against unexpected short-term interest rate
increases. The cap is based on the monthly weighted average of an
index of tax-exempt variable rate debt, multiplied by 175% to align with the
maximum rate formula of the three series of variable rate 1999 NYSERDA
Bonds. Central Hudson would receive a payout if the bonds reset at
rates above 4.375%.
__________________________________________
5 These
ratings reflect only the views of the rating agency issuing the rating, are not
recommendations to buy, sell, or hold securities of Central Hudson and may be
subject to revision or withdrawal at any time by the rating agency issuing the
rating. Each rating should be evaluated independently of any other
rating.
Central
Hudson is currently evaluating what actions, if any, it may take in the future
in connection with its 1999 NYSERDA Bonds, Series B, C and D. Potential actions
may include converting the debt from auction rate to another interest rate mode
or refinancing with taxable bonds.
In the
second quarter of 2009, CH Energy Group privately placed exempt from
registration under the Securities Act of 1933, $50 million of senior unsecured
notes. The notes bear interest at the rate of 6.58% per annum and
mature on April 17, 2014. CH Energy Group completed the sale of $35
million in principal amount of the notes on April 17, 2009, and $15 million in
principal amount on June 15, 2009. CH Energy Group will use the
proceeds from the sale of the notes to repay short-term debt and for general
corporate purposes.
On
September 30, 2009, Central Hudson issued $24 million of 30-year, 5.80% Series F
notes. The proceeds from this issuance will be used for general corporate
purposes including the pay down of short-term debt outstanding, funding
construction expenditures and working capital requirements. Central
Hudson has $20 million remaining on its Series F notes, but does not expect to
issue additional notes in 2009.
For
additional information related to CH Energy Group’s and Central Hudson’s
financing program, please see Note 7 – “Short-term Borrowing Arrangements”, Note
8 – “Capitalization – Common and Preferred Stock”, and Note 9 – “Capitalization
– Long-term Debt” to the Financial Statements of the Corporations’ 10-K Annual
Report.
EARNINGS
PER SHARE
The
following discussion and analyses include explanations of significant changes in
revenues and expenses between the quarters and nine month ended September 30,
2009, and September 30, 2008, for Central Hudson’s regulated electric and
natural gas businesses, Griffith, and the Other Businesses and
Investments.
The
discussions and tables below present the change in earnings of CH Energy Group’s
business units in terms of earnings for each share of CH Energy Group’s Common
Stock. Management believes this presentation is useful because these
business units are each wholly owned by CH Energy Group. This
information is considered a non-GAAP financial measure and not an alternative to
earnings per share determined on a consolidated basis, which is the most
directly comparable GAAP measure. A reconciliation of each business
unit’s earnings per share to CH Energy Group’s earnings per share, determined on
a consolidated basis, is included in the table below.
CH ENERGY GROUP
CONSOLIDATED
Earnings per Share
(Basic)
|
|
Three
Months Ended September 30,
|
|
||||||||||
|
|
2009
|
2008
|
Change
|
|||||||||
|
Central
Hudson - Electric
|
$ | 0.62 | $ | 0.49 | $ | 0.13 | ||||||
|
Central
Hudson - Natural Gas
|
(0.07 | ) | (0.12 | ) | 0.05 | |||||||
|
Griffith
|
(0.22 | ) | (0.28 | ) | 0.06 | |||||||
|
Other
Businesses and Investments
|
0.01 | 0.09 | (0.08 | ) | ||||||||
|
|
$ | 0.34 | $ | 0.18 | $ | 0.16 | ||||||
|
|
||||||||||||
|
|
Nine
Months Ended September 30,
|
|||||||||||
|
|
2009 | 2008 |
Change
|
|||||||||
|
Central
Hudson - Electric
|
$ | 1.12 | $ | 1.11 | $ | 0.01 | ||||||
|
Central
Hudson - Natural Gas
|
0.27 | 0.24 | 0.03 | |||||||||
|
Griffith
|
0.28 | (0.08 | ) | 0.36 | ||||||||
|
Other
Businesses and Investments
|
0.04 | 0.24 | (0.20 | ) | ||||||||
|
|
$ | 1.71 | $ | 1.51 | $ | 0.20 | ||||||
Earnings
for CH Energy Group totaled $0.34 per share in the third quarter of 2009, versus
earnings of $0.18 per share in the same period of 2008. Year-to-date earnings
were $1.71 per share, as compared to $1.51 per share during the first nine
months of 2008.
New
electric and natural gas delivery rates and the RDMs that took effect July 1,
2009 enable Central Hudson to better recover the costs incurred to provide safe
and reliable service to customers and provide an opportunity to achieve a higher
level of shareholder return. Prior to July 1, 2009, Central Hudson’s
earnings were negatively impacted by actual sales volumes that were
significantly below the projected levels in the 2006 Rate
Order. However, the favorable impacts of weather in the first quarter
of 2009 outweighed the lower use per customer in 2009 prior to the
implementation of the RDMs.
Third
quarter 2009 results by business unit were as follows:
CENTRAL
HUDSON
Earnings per Share
(Basic)
|
|
Three
Months Ended September 30,
|
|
||||||||||
|
|
2009
|
2008
|
Change
|
|||||||||
|
Electric
|
$ | 0.62 | $ | 0.49 | $ | 0.13 | ||||||
|
Natural
Gas
|
(0.07 | ) | (0.12 | ) | 0.05 | |||||||
|
|
$ | 0.55 | $ | 0.37 | $ | 0.18 | ||||||
Earnings
from Central Hudson's electric and natural gas operations increased $0.18 per
share in the three months ended September 30, 2009 compared to the same period
in 2008 due to the following:
|
Regulatory
Mechanisms and Unusual Events:
|
|
|||
|
Uncollectible
deferral
|
$ | 0.03 | ||
|
Rate
Orders
|
0.43 | |||
|
Weather
impact on sales (including hedging)
|
(0.08 | ) | ||
|
Weather
normalized sales
|
(0.05 | ) | ||
|
Higher
uncollectible accounts
|
(0.05 | ) | ||
|
Higher
depreciation
|
(0.03 | ) | ||
|
Higher
property and other taxes
|
(0.02 | ) | ||
|
Lower
tree trimming
|
0.01 | |||
|
Higher
interest expense and carrying charges
|
(0.01 | ) | ||
|
Higher
storm restoration expense
|
(0.01 | ) | ||
|
Other
|
(0.04 | ) | ||
| $ | 0.18 | |||
|
|
Nine
Months Ended September 30,
|
|
||||||||||
|
|
2009
|
2008
|
Change
|
|||||||||
|
Electric
|
$ | 1.12 | $ | 1.11 | $ | 0.01 | ||||||
|
Natural
Gas
|
0.27 | 0.24 | 0.03 | |||||||||
|
|
$ | 1.39 | $ | 1.35 | $ | 0.04 | ||||||
Central
Hudson’s earnings increased $0.04 per share in the first nine months of 2009
compared to the same period in 2008, due to the following:
|
Regulatory
Mechanisms and Unusual Events:
|
|
|||
|
Uncollectible
deferral
|
$ | 0.03 | ||
|
Cable
attachment rents in 2008
|
(0.03 | ) | ||
|
Rate
Orders
|
0.52 | |||
|
Weather
impact on sales (including hedging)
|
(0.02 | ) | ||
|
Weather
normalized sales
|
(0.13 | ) | ||
|
Higher
uncollectible accounts
|
(0.15 | ) | ||
|
Higher
depreciation
|
(0.10 | ) | ||
|
Higher
property and other taxes
|
(0.05 | ) | ||
|
Higher
tree trimming
|
(0.03 | ) | ||
|
Higher
interest expense and carrying charges
|
(0.06 | ) | ||
|
Lower
storm restoration expense
|
0.07 | |||
|
Other
|
(0.01 | ) | ||
| $ | 0.04 | |||
Central
Hudson's contribution to earnings per share was $0.55 per share, $0.18 per share
higher than the third quarter of 2008. New electric and natural gas
delivery rates and the RDMs that took effect July 1, 2009 provided an increase
of $0.43 per share over the third quarter of 2008. This increase
covered the increased operating expenses and negative impacts that both weather
and the weak economy had on sales in the third quarter of 2009 as compared to
2008. Cooler summer weather compared to the same quarter of the prior
year resulted in a decrease in earnings of $0.08 per
share. Management believes that the decrease in use per customer,
which reduced earnings $0.05 per share, and the increase in uncollectible
expense which reduced earnings by $0.05 per share are both indicative of the
weak economy.
Year-to-date,
Central Hudson has earned $1.39 per share compared to $1.35 per share posted for
the first nine months of 2008. The positive effect on year-to-date
earnings of the rate orders that took effect July 1, 2009 and July 1, 2008, as
well as lower storm restoration expenses, was largely offset by higher expenses
during the first nine months of 2009 and the impact of lower sales volumes prior
to the implementation of the RDMs.
GRIFFITH
| Earnings per Share (Basic) | ||||||||||||
|
|
Three
Months Ended September 30,
|
|
||||||||||
|
|
2009
|
2008
|
Change
|
|||||||||
|
|
$ | (0.22 | ) | $ | (0.28 | ) | $ | 0.06 | ||||
Griffith’s
earnings increased $0.06 per share in the three months ended September 30, 2009
compared to the same period in 2008 due to the following:
|
Margin
on petroleum sales and services
|
$ | 0.03 | ||
|
Weather
normalized sales (including conservation)
|
(0.05 | ) | ||
|
Weather
impact on sales (including hedging)
|
0.01 | |||
|
Operating
expenses
|
0.03 | |||
|
Acquisitions(1)
|
0.01 | |||
|
Other
|
0.03 | |||
| $ | 0.06 |
|
|
Nine
Months Ended September 30,
|
|
||||||||||
|
|
2009
|
2008
|
Change
|
|||||||||
|
|
$ | 0.28 | $ | (0.08 | ) | $ | 0.36 | |||||
Griffith’s
earnings increased $0.36 per share in the first nine months of 2009 compared to
2008, due to the following:
|
Margin
on petroleum sales and services
|
$ | 0.28 | ||
|
Weather
normalized sales (including conservation)
|
(0.25 | ) | ||
|
Weather
impact on sales (including hedging)
|
0.15 | |||
|
Operating
expenses
|
0.08 | |||
|
Acquisitions(1)
|
0.03 | |||
|
Other
|
0.07 | |||
| $ | 0.36 |
|
(1)
|
For
the purposes of the above charts, “Acquisitions” reflects the incremental
affect of acquisitions made by Griffith in
2008.
|
Griffith
posted a loss of $0.22 per share in the third quarter of 2009, a $0.06 per share
improvement over the third quarter of 2008. This quarterly loss is
expected due to the seasonal nature of Griffith’s fuel delivery
business. The improvement in Griffith’s results over the same quarter
of the prior year was due largely to a reduction in operating
expenses.
Year-to-date,
Griffith has earned $0.28 per share compared to a loss per share of $0.08 posted
for the first nine months of 2008. Griffith’s $0.36 per share
improvement in earnings was due primarily to increased margins on the sale of
petroleum products, colder winter weather and reduced operating expenses in the
first nine months of 2009 as compared to 2008, partially offset by a reduction
in sales volume as a result of customer conservation.
OTHER BUSINESSES AND
INVESTMENTS
| Earnings per Share (Basic) | ||||||||||||
|
|
Three
Months Ended September 30,
|
|
||||||||||
|
|
2009
|
2008
|
Change
|
|||||||||
|
|
$ | 0.01 | $ | 0.09 | $ | (0.08 | ) | |||||
The
variation in earnings per share from CH Energy Group (the holding company) and
CHEC’s partnership and other investment interests in the three months ended
September 30, 2009 compared to the same period in 2008 is due to the
following:
|
Lyonsdale
investment
|
$ | 0.01 | ||
|
Holding
company interest expense
|
(0.03 | ) | ||
|
Higher
income taxes
|
(0.03 | ) | ||
|
Other
|
(0.03 | ) | ||
|
|
$ | (0.08 | ) |
|
|
Nine
Months Ended September 30,
|
|
||||||||||
|
|
2009
|
2008
|
Change
|
|||||||||
|
|
$ | 0.04 | $ | 0.24 | $ | (0.20 | ) | |||||
The
variation in earnings per share from CH Energy Group (the holding company) and
CHEC’s partnership and other investment interests in the first nine months of
2009 compared to the same period in 2008 is due to the following:
|
Buckeye
investment
|
$ | (0.05 | ) | |
|
Lyonsdale
investment
|
(0.04 | ) | ||
|
Holding
company interest expense
|
(0.05 | ) | ||
|
Higher
income taxes
|
(0.02 | ) | ||
|
Other
|
(0.04 | ) | ||
|
|
$ | (0.20 | ) |
CH Energy
Group (the holding company) and CHEC’s partnerships and other investments
contributed earnings of $0.01 per share toward corporate earnings in the third
quarter of 2009, a decrease of $0.08 per share from the same period in
2008. This reduction in earnings is primarily the result of higher
income taxes and interest expense incurred by the holding company.
Year-to-date
earnings per share for these business units totaled $0.04 per share compared to
$0.24 per share posted for the first nine months of
2008. Year-to-date results were impacted by an equipment repair that
necessitated taking the Lyonsdale facility off line for several weeks in the
second quarter of 2009. The plant is back on line with an improved
capacity factor as a result of the repair. Year-to-date earnings were
also reduced by $0.05 per share due to a reserve recorded in the first quarter
of 2009 related to an ethanol development project of CHEC. The
reserve represents the full amount of the note receivable investment for
development expenditures and this project represented CHEC’s only current
early-stage development project. Higher interest expense at the
holding company also contributed to the reduction in earnings for the first nine
months of 2009 as compared to 2008.
RESULTS
OF OPERATIONS
CENTRAL
HUDSON
The
following discussions and analyses include explanations of significant changes
in revenues and expenses between the three and nine months ended September 30,
2009 and the three and nine months ended September 30, 2008 for Central Hudson’s
regulated electric and natural gas businesses.
|
Income Statement Variances
|
|
|
|
|
||||||||||||
|
(Dollars
In Thousands)
|
|
|
|
|
||||||||||||
|
|
Three
Months Ended
|
Nine
Months Ended
|
||||||||||||||
|
|
September
30, 2009
|
September
30, 2009
|
||||||||||||||
|
|
Over/(Under)
same period
|
Over/(Under)
same period
|
||||||||||||||
|
|
in
2008
|
in
2008
|
||||||||||||||
|
|
Amount
|
Percent
|
Amount
|
Percent
|
||||||||||||
|
Operating
Revenues
|
$ | (45,846 | ) | (23 | )% | $ | (69,469 | ) | (11 | )% | ||||||
|
Operating
Expenses:
|
||||||||||||||||
|
Purchased
electricity, fuel andnatural gas
|
(63,003 | ) | (49 | )% | (93,458 | ) | (24 | )% | ||||||||
|
Depreciation
and amortization
|
449 | 6 | % | 1,633 | 7 | % | ||||||||||
|
Other
operating expenses
|
11,479 | 24 | % | 18,919 | 13 | % | ||||||||||
|
Total
Operating Expenses
|
(51,075 | ) | (28 | )% | (72,906 | ) | (13 | )% | ||||||||
|
Operating
Income
|
5,229 | 33 | % | 3,437 | 7 | % | ||||||||||
|
Other
Income, net
|
(590 | ) | (55 | )% | (2,306 | ) | (60 | )% | ||||||||
|
Interest
Charges
|
(92 | ) | (1 | )% | (336 | ) | (2 | )% | ||||||||
|
Income
Before Income Taxes
|
4,731 | 45 | % | 1,467 | 4 | % | ||||||||||
|
Income
Taxes
|
1,987 | 46 | % | 850 | 6 | % | ||||||||||
|
Net
Income
|
$ | 2,744 | 45 | % | $ | 617 | 3 | % | ||||||||
The
following discusses variations and the primary drivers of the changes in
operating revenues, operating expenses, volumes delivered, other income,
interest charges, and income taxes for Central Hudson’s regulated electric and
natural gas businesses.
Delivery
Volumes
Delivery
volumes for Central Hudson vary in response to weather conditions and customer
behavior. Electric deliveries peak in the summer and deliveries of
natural gas used for heating purposes peak in the winter. Delivery
volumes also vary as customers respond to the price of the particular energy
product and changes in local economic conditions.
The
following chart reflects the change in the level of electric and natural gas
deliveries for Central Hudson in the three and nine months ended September 30,
2009, compared to the same period in 2008. Deliveries of electricity
and natural gas to residential and commercial customers have historically
contributed the most to Central Hudson's earnings. Effective July 1,
2009, Central Hudson’s delivery rate structure includes a revenue decoupling
mechanism which provides the ability to record revenues equal to those
forecasted in the development of current rates for most of Central Hudson’s
customers. As a result, fluctuations in actual delivery volumes do
not have a significant impact on the Company’s earnings. Industrial
sales and interruptible sales have a negligible impact on earnings.
|
Actual Deliveries
|
|
|
|
|
||||||||||||
|
|
Three
Months Ended
|
Nine
Months Ended
|
||||||||||||||
|
|
September
30, 2009
|
September
30, 2009
|
||||||||||||||
|
|
Increase/(Decrease)
from
|
Increase/(Decrease)
from
|
||||||||||||||
|
|
same
period in 2008
|
same
period in 2008
|
||||||||||||||
|
|
Electric
|
Natural
Gas
|
Electric
|
Natural
Gas
|
||||||||||||
|
Residential
|
(10 | )% | 4 | % | (4 | )% | 2 | % | ||||||||
|
Commercial
|
(7 | )% | 3 | % | (5 | )% | 3 | % | ||||||||
|
Industrial
and other(1)
|
(11 | )% | (15 | )% | (9 | )% | (15 | )% | ||||||||
|
Total
Deliveries
|
(9 | )% | (3 | )% | (5 | )% | (1 | )% | ||||||||
|
(1)
|
Includes
interruptible natural gas
deliveries.
|
|
Weather Normalized
Deliveries
|
|
|
|
|||||||||||||
|
Three
Months Ended
|
Nine
Months Ended
|
|||||||||||||||
|
September
30, 2009
|
September
30, 2009
|
|||||||||||||||
|
Increase/(Decrease)
from
|
Increase/(Decrease)
from
|
|||||||||||||||
|
same
period in 2008
|
same
period in 2008
|
|||||||||||||||
|
Electric
|
Natural
Gas
|
Electric
|
Natural
Gas
|
|||||||||||||
|
Residential
|
(3 | )% | 1 | % | (2 | )% | (1 | )% | ||||||||
|
Commercial
|
(5 | )% | 1 | % | (4 | )% | 1 | % | ||||||||
|
Industrial
and other (2)
|
(11 | )% | (15 | )% | (9 | )% | (15 | )% | ||||||||
|
Total
Deliveries
|
(6 | )% | (4 | )% | (4 | )% | (3 | )% | ||||||||
|
(2)
|
Excludes
interruptible natural gas
deliveries.
|
|
Note:
|
Due
to a warming trend in actual weather over the past 30 years, Central
Hudson developed linear trend normal weather values for its electric and
natural gas businesses. This trend analysis has resulted in
approximately 330 and 300 fewer heating degree days compared to a rolling
30-year average for electric and natural gas, respectively. In
the third quarter, Central Hudson began using a 10-year average consistent
with the weather normalization calculation reflected in the 2009 Rate
Order. The 10-year average calculation resulted in
approximately 270 and 232 fewer heating degree days compared to a rolling
30-year average for electric and natural gas,
respectively.
|
Electric
deliveries to residential customers during the three and nine months ended
September 30, 2009 were negatively impacted by lower use per customer, as well
as the cooler than normal weather, compared to the same periods in
2008.
Natural
gas deliveries to residential customers increased for both the three and nine
months ended September 30, 2009 as compared to 2008. Use per customer
increased slightly for the three months ended September 30, 2009 as compared to
the same period of 2008, however on a year-to-date basis our use per customer is
still down from the same period in the prior year. The cooler than
normal weather in the three and nine month period ended September 30, 2009,
favorably impacted deliveries to residential customers and outweighed the
unfavorable impacts of lower use per customer for the nine month period ended
September 30, 2009 as compared to 2008.
Revenues
Central
Hudson’s revenues consist of two major categories: those which offset specific
expenses in the current period (matching revenues), and those that impact
earnings. Matching revenues recover Central Hudson's actual costs for
particular expenses. Any difference between these revenues and the actual
expenses incurred is deferred for future recovery from or refund to customers
and therefore does not impact earnings.
|
Change in Central Hudson
Revenues
|
|
|
|
|||||||||
|
(In
Thousands)
|
|
|
|
|||||||||
|
Three
Months Ended September 30, 2009
|
||||||||||||
|
Increase/(Decrease)
from same period in 2008
|
||||||||||||
|
Electric
|
Natural
Gas
|
Total
|
||||||||||
|
Revenues
with Matching Expense Offsets:(1)
|
|
|
|
|||||||||
|
Energy
cost adjustment
|
$ | (54,476 | ) | $ | (4,973 | ) | $ | (59,449 | ) | |||
|
Sales
to others for resale
|
(920 | ) | (2,853 | ) | (3,773 | ) | ||||||
|
Other
revenues with matching offsets
|
8,893 | 574 | 9,467 | |||||||||
|
Subtotal
|
(46,503 | ) | (7,252 | ) | (53,755 | ) | ||||||
|
Revenues
Impacting Earnings:
|
||||||||||||
|
Customer
sales
|
1,244 | 1,330 | 2,574 | |||||||||
|
RDM
and other regulatory mechanisms
|
5,557 | (103 | ) | 5,454 | ||||||||
|
Finance
charges
|
(118 | ) | 33 | (85 | ) | |||||||
|
Weather-hedging
contracts
|
(438 | ) | - | (438 | ) | |||||||
|
Other
revenues
|
(58 | ) | 462 | 404 | ||||||||
|
Subtotal
|
6,187 | 1,722 | 7,909 | |||||||||
|
Total
|
$ | (40,316 | ) | $ | (5,530 | ) | $ | (45,846 | ) | |||
|
Nine
Months Ended September 30, 2009
|
||||||||||||
|
Increase/(Decrease)
from same period in 2008
|
||||||||||||
|
Electric
|
Natural
Gas
|
Total
|
||||||||||
|
Revenues
with Matching Expense Offsets:(1)
|
||||||||||||
|
Energy
cost adjustment
|
$ | (84,995 | ) | $ | (7,924 | ) | $ | (92,919 | ) | |||
|
Sales
to others for resale
|
(379 | ) | (789 | ) | (1,168 | ) | ||||||
|
Other
revenues with matching offsets
|
14,530 | 1,374 | 15,904 | |||||||||
|
Subtotal
|
(70,844 | ) | (7,339 | ) | (78,183 | ) | ||||||
|
Revenues
Impacting Earnings:
|
||||||||||||
|
Customer
sales
|
2,069 | 1,668 | 3,737 | |||||||||
|
RDM
and other regulatory mechanisms
|
4,563 | 136 | 4,699 | |||||||||
|
Pole
attachments and other rents
|
(639 | ) | - | (639 | ) | |||||||
|
Finance
charges
|
110 | 189 | 299 | |||||||||
|
Other
revenues
|
117 | 501 | 618 | |||||||||
|
Subtotal
|
6,220 | 2,494 | 8,714 | |||||||||
|
Total
|
$ | (64,624 | ) | $ | (4,845 | ) | $ | (69,469 | ) | |||
|
(1)
|
Revenues
with matching offsets do not affect earnings since they offset related
costs, the most significant being energy cost adjustment revenues, which
provide for the recovery of purchased electricity and natural gas
costs. Other related costs are pensions, OPEB, and the cost of
special programs authorized by the PSC, which are funded with certain
available credits. Changes in revenues from electric sales to
other utilities also do not affect earnings since any related profits or
losses are returned or charged, respectively, to customers. For
natural gas sales to other entities for resale, 85% of such profits are
returned to customers.
|
Electric
revenues decreased in the three and nine months ended September 30, 2009, as
compared to the same periods in 2008, due to lower energy cost adjustment
revenues resulting from both lower wholesale prices and lower delivery
volumes. These decreases were partially offset by an increase in
other revenues with matching expense offsets resulting from an increase in rates
related to increased pension costs, New York State (“NYS”) energy efficiency
programs and a new tax surcharge implemented by the PSC. The reasons for the
increase in revenues with matching expense offsets are discussed in more detail
under operating expenses. The decrease in energy cost adjustment
revenues was also partially offset by the impact of the increase in delivery
rates on customer sales and the RDM, both of which became effective July 1,
2009.
Natural
gas revenues decreased for the three and nine months ended September 30, 2009,
as compared to the same period in 2008, primarily due to a decrease in energy
cost adjustment revenues driven by lower net gas costs, as well as lower
revenues from gas sales to others for resale. These decreases were
partially offset by the impact of the increase in delivery rates on customer
sales which became effective in the third quarter of 2009. An
increase in other revenues with matching offsets resulting from increased rates
for pension, energy efficiency programs and the new tax surcharge also offset
the decrease in energy cost adjustment revenues for the nine months ended
September 30, 2009.
Operating
Expenses
The most
significant elements of Central Hudson’s operating expenses are purchased
electricity and purchased natural gas; however, changes in these costs do not
affect earnings since they are offset by changes in related revenues recovered
through Central Hudson’s energy cost adjustment
mechanisms. Additionally, there are other costs that are matched to
revenues largely from customer billings, notably the cost of NYS energy
efficiency programs, PSC tax surcharge, pensions and OPEBs.
Total
utility operating expenses decreased 28% and 13% for the three and nine months
ended September 30, 2009, compared to the same periods in 2008. The
following summarizes the change in operating expenses:
|
Change in Central Hudson Operating
Expenses
|
|
|||||||
|
(In
Thousands)
|
|
|
||||||
|
Three
Months Ended
|
Nine
Months Ended
|
|||||||
|
September
30, 2009
|
September
30, 2009
|
|||||||
|
Increase
/ (Decrease) from
|
Increase
/ (Decrease) from
|
|||||||
|
same
period in 2008
|
same
period in 2008
|
|||||||
|
Expenses
Currently Matched to Revenues:(1)
|
|
|
||||||
|
Purchased
electricity
|
$ | (55,396 | ) | $ | (85,374 | ) | ||
|
Purchased
natural gas
|
(7,826 | ) | (8,713 | ) | ||||
|
Pension
|
4,016 | 3,754 | ||||||
|
PSC
tax surcharge
|
3,084 | 3,084 | ||||||
|
NYS
energy programs
|
2,624 | 8,574 | ||||||
|
Other
matched expenses
|
(257 | ) | 492 | |||||
|
Subtotal
|
(53,755 | ) | (78,183 | ) | ||||
|
Other
Expense Variations:
|
||||||||
|
Tree
trimming
|
(357 | ) | 677 | |||||
|
Uncollectible
expense
|
1,117 | 3,180 | ||||||
|
Uncollectible
deferral
|
(541 | ) | (541 | ) | ||||
|
Purchased
natural gas incentive arrangements
|
219 | 629 | ||||||
|
Storm
restoration expenses
|
265 | (1,848 | ) | |||||
|
Depreciation
and amortization
|
449 | 1,633 | ||||||
|
Other
expenses
|
1,528 | 1,547 | ||||||
|
Subtotal
|
2,680 | 5,277 | ||||||
|
Total
Decrease in Operating Expenses
|
$ | (51,075 | ) | $ | (72,906 | ) | ||
|
(1)
|
Includes
expenses that, in accordance with the 2006 Rate Order and the 2009 Rate
Order, are adjusted in the current period to equal the revenues earned for
the applicable expenses.
|
In
addition to the required adjustment to match revenues collected from customers,
the variation in purchased electric and natural gas expense in the first three
and nine months of 2009 reflects the effects of lower wholesale prices for
electricity and natural gas, as well as lower volumes delivered to electric
customers. The increase in pensions is due to an increase in the
level of expenses recorded with a corresponding increase in revenues resulting
from the increase in delivery rates that became effective July 1,
2009. The increase in the PSC tax surcharge is due to a new tax
surcharge instituted by the PSC in April 2009. Effective July 1,
2009, the surcharge is being collected from customers and is expected to total
approximately $18 million per year. The increase in NYS energy
program expenses relates to the costs of energy efficiency programs under
the Energy Efficiency Portfolio Standard which began in October 2008, as well
as, higher spending levels associated with other energy programs as authorized
by the 2006 Rate Order.
The
decrease in storm restoration costs for the first nine months of 2009 as
compared to 2008 was the result of lower and less severe storm activity this
year. Uncollectible
expense increased for the three and nine months ended September 30, 2009 as
compared to the same periods in 2008 which management believes is a result of
the unfavorable economic conditions, particularly the rise in unemployment
rates.
Other
Income
Other
income and deductions for Central Hudson for the three and nine months ended
September 30, 2009, decreased $0.6 million and $2.3 million, respectively,
compared to the same periods in 2008, primarily due to a decrease in regulatory
carrying charges due from customers related to pension costs and regulatory
adjustments resulting from changes in interest costs on Central Hudson’s
variable rate long-term debt. The latter adjustment offsets the
decrease in interest on the variable rate debt, as discussed under the caption
“Interest Charges.”
Interest
Charges
Central
Hudson’s interest charges for the three and nine months ended September 30,
2009, as compared to the same periods in 2008, decreased $0.1 million and $0.3
million, respectively. Increases resulting from higher outstanding
debt balances and increased carrying charges due to customers were offset
primarily by a decrease in interest rates on variable rate notes and short-term
borrowings. The issuance of $30 million medium-term notes in November
2008 to finance capital improvements, and the redemption of $20 million
medium-term notes in January 2009 resulted in a net increase in debt outstanding
during the first three and nine months ended September 30, 2009, as compared to
the same periods in 2008. Lower working capital requirements as a
result of decreasing energy prices at the end of 2008 and through the beginning
of 2009 allowed Central Hudson to absorb the redemption of the long-term debt at
its maturity in January 2009 without refinancing and to repay short-term
borrowings, thereby, reducing its interest expense. The increase in
carrying charges due to customers was primarily related to an increase in the
underlying reserve balance for other post-retirement benefits for the nine
months ended September 30, 2009 and carrying charges beginning July 1, 2009 on
the net regulatory electric liability set aside for future customer benefit for
the three and nine months ended September 30, 2009.
Income
Taxes
Income
taxes for Central Hudson increased $2.0 million and $0.9 million for the three
and nine months ended September 30, 2009 when compared to the same periods in
2008 primarily due to an increase in pre-tax book income.
CH ENERGY
GROUP
In
addition to the impacts of Central Hudson discussed above, CH Energy Group’s
sales volumes, revenues and operating expenses, income taxes and other income
were impacted by Griffith and the other businesses described
below. The results of Griffith and the other businesses described
below exclude inter-company interest income and expense which are eliminated in
consolidation.
|
Income Statement Variances
|
|
|
|
|
||||||||||||
|
(Dollars
In Thousands)
|
|
|
|
|
||||||||||||
|
|
Three
Months Ended
|
Nine
Months Ended
|
||||||||||||||
|
|
September
30, 2009
|
September
30, 2009
|
||||||||||||||
|
|
Over/(Under)
same period
|
Over/(Under)
same period
|
||||||||||||||
|
|
in
2008
|
in
2008
|
||||||||||||||
|
|
Amount
|
Percent
|
Amount
|
Percent
|
||||||||||||
|
Operating
Revenues
|
$ | (87,142 | ) | (29) | % | $ | (231,884 | ) | (23) | % | ||||||
|
Operating
Expenses:
|
||||||||||||||||
|
Purchased
electricity, fuel, natural gas and petroleum
|
(104,872 | ) | (49) | % | (262,529 | ) | (36) | % | ||||||||
|
Depreciation
and amortization
|
564 | 6 | % | 1,839 | 6 | % | ||||||||||
|
Other
operating expenses
|
10,268 | 15 | % | 17,181 | 8 | % | ||||||||||
|
Total
Operating Expenses
|
(94,040 | ) | (32) | % | (243,509 | ) | (25) | % | ||||||||
|
Operating
Income
|
6,898 | 74 | % | 11,625 | 22 | % | ||||||||||
|
Other
Income, net
|
(1,662 | ) | (117) | % | (5,061 | ) | (108) | % | ||||||||
|
Interest
Charges
|
655 | 10 | % | 624 | 3 | % | ||||||||||
|
Income
before income taxes, non-controlling interest and preferred dividends of
subsidiaries
|
4,581 | 104 | % | 5,940 | 15 | % | ||||||||||
|
Income
Taxes
|
2,134 | 179 | % | 3,050 | 22 | % | ||||||||||
|
Net
Income
|
2,447 | 77 | % | 2,890 | 12 | % | ||||||||||
|
Net
loss attributable to non-controlling interest
|
(20 | ) | (6) | % | (270 | ) | (32) | % | ||||||||
|
Net
income attributable to CH Energy Group
|
$ | 2,467 | 86 | % | $ | 3,160 | 13 | % | ||||||||
GRIFFITH
Sales
Volumes
Delivery
and sales volumes for Griffith vary in response to weather conditions and
customer behavior. Deliveries of petroleum products used for heating
purposes peak in the winter. Sales also vary as customers respond to
the price of the particular energy product and changes in local economic
conditions.
Changes
in sales volumes of petroleum products, including the impact of acquisitions,
are set forth below.
|
Actual Deliveries
|
|
|
|
|
||||||||||||
|
|
Three
Months Ended
|
Nine
Months Ended
|
||||||||||||||
|
|
September
30, 2009
|
September
30, 2009
|
||||||||||||||
|
|
%
Change
from
same period in 2008
|
2009
Volumes
as % of Total Volume
|
%
Change
from
same period in 2008
|
2009
Volumes
as % of Total Volume
|
||||||||||||
|
Heating
Oil
|
|
|
|
|
||||||||||||
|
Base
company volume(1)
|
12 | % | 23 | % | 3 | % | 50 | % | ||||||||
|
Acquisitions
volume(2)
|
(1) | % | 1 | % | 1 | % | 3 | % | ||||||||
|
Total
Heating Oil
|
11 | % | 24 | % | 4 | % | 53 | % | ||||||||
|
|
||||||||||||||||
|
Motor
Fuels
|
||||||||||||||||
|
Base
company volume
|
(14) | % | 75 | % | (17) | % | 45 | % | ||||||||
|
Acquisitions
volume
|
- | % | - | % | - | % | - | % | ||||||||
|
Total
Motor Fuels
|
(14) | % | 75 | % | (17) | % | 45 | % | ||||||||
|
|
||||||||||||||||
|
Propane
and Other
|
||||||||||||||||
|
Base
company volume
|
(40) | % | 1 | % | 1 | % | 2 | % | ||||||||
|
Acquisitions
volume
|
- | % | - | % | - | % | - | % | ||||||||
|
Total
Propane and Other
|
(40) | % | 1 | % | 1 | % | 2 | % | ||||||||
|
|
||||||||||||||||
|
Total
|
||||||||||||||||
|
Base
company volume
|
(9) | % | 99 | % | (8) | % | 97 | % | ||||||||
|
Acquisitions
volume
|
(1) | % | 1 | % | 1 | % | 3 | % | ||||||||
|
Total
|
(10) | % | 100 | % | (7) | % | 100 | % | ||||||||
|
(1)
|
For
the purposes of this chart, “Base company” means Griffith as constituted
at January 1, 2008 (i.e., without any impact from acquisitions made by
Griffith in 2008).
|
|
(2)
|
For
the purposes of this chart, “Acquisitions” represent the incremental
effect of acquisitions made by Griffith in
2008.
|
|
Weather Normalized
Deliveries
|
|
|
|
|||||||||||||
|
Three
Months Ended
|
Nine
Months Ended
|
|||||||||||||||
|
September
30, 2009
|
September
30, 2009
|
|||||||||||||||
|
%
Change
from
same period in 2008
|
2009
Volumes
as % of Total Volume
|
%
Change
from
same period in 2008
|
2009
Volumes
as % of Total Volume
|
|||||||||||||
|
Heating
Oil
|
|
|
|
|
||||||||||||
|
Base
company volume(1)
|
4 | % | 22 | % | (10) | % | 49 | % | ||||||||
|
Acquisitions
volume(2)
|
(1) | % | 1 | % | 1 | % | 2 | % | ||||||||
|
Total
Heating Oil
|
3 | % | 23 | % | (9) | % | 51 | % | ||||||||
|
Motor
Fuels
|
||||||||||||||||
|
Base
company volume
|
(14) | % | 76 | % | (17) | % | 47 | % | ||||||||
|
Acquisitions
volume
|
- | % | - | % | - | % | - | % | ||||||||
|
Total
Motor Fuels
|
(14) | % | 76 | % | (17) | % | 47 | % | ||||||||
|
Propane
and Other
|
||||||||||||||||
|
Base
company volume
|
(47) | % | 1 | % | (11) | % | 2 | % | ||||||||
|
Acquisitions
volume
|
- | % | - | % | 1 | % | - | % | ||||||||
|
Total
Propane and Other
|
(47) | % | 1 | % | (10) | % | 2 | % | ||||||||
|
Total
|
||||||||||||||||
|
Base
company volume
|
(11) | % | 99 | % | (13) | % | 98 | % | ||||||||
|
Acquisitions
volume
|
- | % | 1 | % | - | % | 2 | % | ||||||||
|
Total
|
(11) | % | 100 | % | (13) | % | 100 | % | ||||||||
|
(1)
|
For
the purposes of this chart, "Base company" means Griffith as constituted
at January 1, 2008 (i.e. without any impact from acquisitions made by
Griffith in 2008).
|
|
(2)
|
For
the purposes of this chart, "Acquisitions" represent the incremental
effect of acquisitions made by Griffith in
2008.
|
|
Note:
|
Due
to a warming trend in actual weather over the past 30 years, Griffith has
developed a trend normal weather value. This trend analysis has
resulted in approximately 670 and 150 less heating degree days as compared
to a standard 30-year average for Griffith's customers in the Northeast
and Mid-Atlantic regions, respectively. The above chart of
weather normalized deliveries was determined using Griffith's trend normal
weather value.
|
Sales of
petroleum products decreased 10% and 7% in the three and nine months ended
September 30, 2009 compared to the same periods in 2008. The decrease
was due primarily to a significant decrease in the sale of motor fuels related
to the downturn in the economy and continued reduced consumption per residential
heating oil customer. This decrease was partially offset by an
increase in the sale of heating oil due to colder weather in 2009 compared to
2008. This increase was due to weather that was 16% colder in the
first nine months of 2009 in comparison to 2008 as measured by heating degree
days. Degree-day variation is adjusted for the delay between the time
the actual weather occurs, and the time of product delivery.
Revenues
|
Change in Griffith Revenues
|
|
|
||||||
|
(In
Thousands)
|
|
|
||||||
|
Three
Months Ended
|
Nine
Months Ended
|
|||||||
|
September
30, 2009
|
September
30, 2009
|
|||||||
|
Increase
/ (Decrease) from
same
period in 2008
|
Increase
/ (Decrease) from
same
period in 2008
|
|||||||
|
Heating
Oil
|
|
|
||||||
|
Base
company(1)
|
$ | (6,441 | ) | $ | (54,750 | ) | ||
|
Acquisitions(2)
|
(355 | ) | (786 | ) | ||||
|
Total
Heating Oil
|
$ | (6,796 | ) | $ | (55,536 | ) | ||
|
Motor
Fuels
|
||||||||
|
Base
company
|
$ | (33,603 | ) | $ | (104,600 | ) | ||
|
Acquisitions
|
(86 | ) | (160 | ) | ||||
|
Total
Motor Fuels
|
$ | (33,689 | ) | $ | (104,760 | ) | ||
|
Service
Revenues
|
||||||||
|
Base
company
|
$ | (248 | ) | $ | (46 | ) | ||
|
Acquisitions
|
90 | 784 | ||||||
|
Total
Service Revenues
|
$ | (158 | ) | $ | 738 | |||
|
Other
|
||||||||
|
Propane
|
$ | (635 | ) | $ | (909 | ) | ||
|
Weather-hedging
contracts
|
- | (230 | ) | |||||
|
Other
|
(254 | ) | 54 | |||||
|
Total
Other
|
$ | (889 | ) | $ | (1,085 | ) | ||
|
Total
Revenues
|
$ | (41,532 | ) | $ | (160,643 | ) | ||
|
(1)
|
For
the purposes of this chart, “Base company” means Griffith as constituted
at January 1, 2008 (i.e., without any impact from acquisitions made by
Griffith in 2008).
|
|
(2)
|
For
the purposes of this chart, “Acquisitions” represents the incremental
effect of acquisitions made by Griffith in
2008.
|
Revenues,
net of the effect of weather hedging contracts, decreased in the three and nine
months ended September 30, 2009 compared to the same periods in 2008, due
primarily to a decrease in the selling price for both motor fuels and heating
oil and a decline in sales volume for motor fuels.
Operating
Expenses
For the
three months ended September 30, 2009, operating expenses decreased $43.1
million, or 42%, from $103.5 million in 2008 to $60.4 million in
2009. The cost of petroleum products decreased $41.7 million, or 51%,
due to lower wholesale market prices and reduced sales volumes.
Other
operating expenses decreased $1.4 million for the three months ended September
30, 2009 due primarily to reduced operating expenses associated with reduced
sales volumes.
For the
nine months ended September 30, 2009, operating expenses decreased $169.9
million, or 42%, from $403.6 million in 2008 to $233.7 million in
2009. The cost of petroleum products decreased $167.8 million, or
50%, due primarily to lower wholesale market prices and reduced sales
volumes.
Other
operating expenses decreased $2.1 million for the nine months ended September
30, 2009 due primarily to reduced operating expenses associated with reduced
sales volumes.
OTHER BUSINESSES AND
INVESTMENTS
Revenues
and Operating Expenses
The
operating results of Lyonsdale and CH-Greentree are consolidated in the
Consolidated Financial Statements of CH Energy Group. These results
for the three months ended September 30, 2009 compared to the same period in
2008 reflect an increase in operating revenues of $0.2 million and essentially
no change in operating expenses with a net increase in CH Energy Group’s net
income of $0.2 million. This is primarily due to the inclusion of
CH-Greentree revenues and the increased capacity at Lyonsdale resulting from the
equipment repairs completed in the second quarter of 2009. CH-Greentree became operational in
the third quarter of 2009. Results for the nine months ended
September 30, 2009 compared to the same period in 2008 reflect a decrease in
operating revenues of $1.8 million and decreased total operating expenses of
$1.0 million with a net decrease in CH Energy Group’s net income of $0.4
million. This decrease is primarily attributable to the outage for
equipment repairs at Lyonsdale in the second quarter of 2009.
Other
Income and Interest Charges
Other
income and deductions and interest charges for the balance of CH Energy Group,
primarily the holding company and CHEC’s investments in partnerships and other
investments (other than Griffith), decreased $1.6 million and $4.1 million for
the three and nine months ended September 30, 2009, when compared to the same
periods in 2008. The decrease for the three months ended September
30, 2009 is due to an increase to interest expense on the private placement of
debt at the holding company in the second quarter of 2009 and lower earnings at
the partnerships. The results for the nine months ended September 30,
2009 also include the reserve of $1.3 million recorded in the first quarter of
2009 for the full amount of an outstanding loan to Buckeye Biopower,
LLC.
CH ENERGY GROUP – INCOME
TAXES
Income
taxes for CH Energy Group increased $2.1 million and $3.1 million for the three
and nine months ended September 30, 2009, respectively, when compared to the
same periods in 2008 due primarily to an increase in pre-tax book income at
Central Hudson and Griffith.
COMMON
STOCK DIVIDENDS
CH Energy
Group’s ability to pay dividends may be affected by the ability of its
subsidiaries to pay dividends. The Federal Power Act limits the payment of
dividends by Central Hudson to its retained earnings. More
restrictive is the PSC’s limit on the dividends Central Hudson may pay to CH
Energy Group which is 100% of the average annual income available for common
stock, calculated on a two-year rolling average basis. Based on this
calculation as of September 30, 2009, Central Hudson would be able to pay a
maximum of $28.3 million in dividends to CH Energy Group without violating the
restriction by the PSC. Central Hudson’s dividend would be reduced to
75% of its average annual income in the event of a downgrade of its senior debt
rating below “BBB+” by more than one rating agency if the stated reason for the
downgrade is related to CH Energy Group or any of Central Hudson’s
affiliates. Further restrictions are imposed for any downgrades below
this level. Central Hudson’s current senior unsecured debt
rating/outlook is ‘A’/stable by both Standard & Poor’s Rating Services
(“Standard & Poor’s”) and Fitch Ratings and ‘A3’/negative by Moody’s
Investors Service (“Moody’s”).6 CH Energy
Group’s other subsidiaries do not have express restrictions on their ability to
pay dividends.
Reference
is made to the caption “Common Stock Dividends and Price Ranges” of Part II,
Item 7 of the Corporations’ 10-K Annual Report for a discussion of CH
Energy Group's dividend payments. On September 30, 2009, the Board of
Directors of CH Energy Group declared a quarterly dividend of $0.54 per share,
payable November 2, 2009, to shareholders of record as of October 13,
2009.
__________________________________________
6 These
ratings reflect only the views of the rating agency issuing the rating, are not
recommendations to buy, sell, or hold securities of Central Hudson and may be
subject to revision or withdrawal at any time by the rating agency issuing the
rating. Each rating should be evaluated independently of any other
rating.
OTHER
MATTERS
CHANGES IN ACCOUNTING
STANDARDS
See Note
1 – “Summary of Significant Accounting Policies” and Note 3 – “New Accounting
Standards and Other FASB Projects” for discussion of relevant changes, which
discussion is incorporated by reference herein.
CLIMATE
While
there is growing consensus that some form of global climate change program will
be adopted at the federal level, it is too early to determine what impact such
program will have on CH Energy Group. It should be noted, however, that
the Company's calculated CO2 emission
levels are relatively small, primarily because the Company does not generate
electricity in significant quantities. Therefore, federally mandated
greenhouse gas reductions or limits on CO2 emissions
are not expected to have a material impact on the Company’s financial position
or results of operations. However, the Company can make no prediction
as to the outcome of this matter.
FORWARD-LOOKING
STATEMENTS
Statements
included in this Quarterly Report on Form 10-Q and any documents incorporated by
reference which are not historical in nature are intended to be, and are hereby
identified as, “forward-looking statements” for purposes of the safe harbor
provided by Section 21E of the Exchange Act. Forward-looking
statements may be identified by words including “anticipates,” “intends,”
“estimates,” “believes,” “projects,” “expects,” “plans,” “assumes,” “seeks,” and
similar expressions. Forward-looking statements including, without
limitation, those relating to CH Energy Group’s and Central Hudson’s future
business prospects, revenues, proceeds, working capital, liquidity, income, and
margins, are subject to certain risks and uncertainties that could cause actual
results to differ materially from those indicated in the forward-looking
statements, due to several important factors, including those identified from
time-to-time in the forward-looking statements. Those factors
include, but are not limited to: deviations from normal seasonal weather and
storm activity; fuel prices; plant capacity factors; energy supply and demand;
potential future acquisitions; legislative, regulatory, and competitive
developments; interest rates; access to capital; market risks; corn and ethanol
prices; electric and natural gas industry restructuring and cost recovery; the
ability to obtain adequate and timely rate relief; changes in fuel supply or
costs including future market prices for energy, capacity, and ancillary
services; the success of strategies to satisfy electricity, natural gas, fuel
oil, and propane requirements; the outcome of pending litigation and certain
environmental matters, particularly the status of inactive hazardous waste
disposal sites and waste site remediation requirements; and certain presently
unknown or unforeseen factors, including, but not limited to, acts of
terrorism. CH Energy Group and Central Hudson undertake no obligation
to update publicly any forward-looking statements, whether as a result of new
information, future events, or otherwise.
Given
these uncertainties, undue reliance should not be placed on the forward-looking
statements.
|
ITEM 3
–
|
QUANTITATIVE AND
QUALITATIVE DISCLOSURES ABOUT MARKET
RISK
|
Reference
is made to Part II, Item 7A of the Corporations’ 10-K Annual Report for a
discussion of market risk. 2009 has continued to be a challenging
time in the financial markets with volatility of commodity prices and interest
rates. The practices employed by CH Energy Group and Central Hudson
to mitigate these risks discussed in the Corporations’ 10-K Annual Report
continue to operate effectively. For related discussion on this
activity, see, in the Financial Statements of the Corporations’ 10-K Annual
Report, Note 14 – “Accounting for Derivative Instruments and Hedging Activities”
and Item 7 – “Management’s Discussion and Analysis of Financial Condition
and Results of Operations” under the sub-caption “Capital Resources and
Liquidity,” and Note 9 – Capitalization - Long-Term Debt and Item 7A –
“Management’s Discussion and Analysis of Financial Condition and Results of
Operations” under the sub-caption “Financing Program” of this Quarterly Report
on Form 10-Q.
|
ITEM 4
–
|
CONTROLS AND
PROCEDURES
|
The Chief
Executive Officer and Chief Financial Officer of CH Energy Group and Central
Hudson evaluated the effectiveness of the disclosure controls and procedures (as
defined in Rule 13a-15(e) under the Securities Exchange Act of 1934, as amended)
as of the end of the period covered by this Quarterly Report on Form 10-Q and
based on the evaluation, concluded that, as of the end of the period covered by
this Quarterly Report on Form 10-Q, the Corporations’ controls and procedures
are effective.
There
were no changes to the Corporations’ internal control over financial reporting
that occurred during the Corporations’ last fiscal quarter that have materially
affected, or are reasonably likely to materially affect, the Corporations’
internal control over financial reporting.
PART
II – OTHER INFORMATION
|
ITEM 1
-
|
LEGAL
PROCEEDINGS
|
For
information about developments regarding certain legal proceedings, see Item 3
(“Legal Proceedings”) of the Corporations’ 10-K Annual Report, and Note 12 –
“Commitments and Contingencies” of that 10-K and/or Note 12 – “Commitments and
Contingencies” of this Quarterly Report on Form 10-Q.
CENTRAL
HUDSON:
Former
Manufactured Gas Plant Facilities
Little
Britain Road
Newburgh
Consolidated Iron Works
Asbestos
Litigation
|
ITEM 1A
-
|
RISK
FACTORS
|
For a
discussion identifying risk factors that could cause actual results to differ
materially from those anticipated, see the discussion under “Item 1A – Risk
Factors” of the Corporations’ 10-K Annual Report.
Central
Hudson’s Rates Limit its Ability to Recover Increased Costs from its
Customers
Description
and Sources of Risk: Central
Hudson’s retail rates are regulated by the PSC. Rates generally may
not be changed during their respective terms. Therefore, rates cannot
be modified for higher expenses than those assumed in the current rates, absent
circumstances such as an increase in expenses that meet the PSC’s threshold
requirements for filing for approval of deferral accounting. Central
Hudson is operating under a single year rate plan approved by the PSC effective
July 1, 2009. The following could unfavorably impact Central Hudson’s
financial results:
|
|
o
|
Higher
expenses than reflected in current rates. Higher expenses could
result from, among other things, increases in state and local taxes, storm
restoration expense, and/or other expense components such as labor, health
care benefits and/or higher levels of uncollectible receivables from
customers.
|
|
|
o
|
Higher
electric and natural gas capital project costs resulting from escalation
of material and equipment prices, as well as potential delays in the
siting and legislative and/or regulatory approval requirements associated
with these projects.
|
|
|
o
|
A
determination by the PSC that the cost to place a project in service is
above a level which is deemed
prudent.
|
|
|
o
|
Penalties
imposed by the PSC for the failure to achieve performance metrics
established in rate proceedings.
|
Potential
Impacts: Central Hudson
could have lower earnings and/or reduced cash flows if cost management and/or
regulatory relief are not sufficient to alleviate the impact of higher
costs.
The
Profitability of CHEC’s Investments in Ethanol Projects May Be Adversely
Impacted by Commodity Price Changes or the Lack of Capital Available to Project
Developers to Complete New Projects
Description and
Sources of Risk: CHEC’s management believes that increases in
wholesale corn prices and/or natural gas prices and/or decreases in ethanol
prices and/or distillers grains are caused by a variety of factors, including,
but not limited to the following:
|
|
o
|
Actions
by the federal government that reduce the demand for, or increase the
supply of, ethanol. Such actions could include, but are not
limited to, a reduction in the required level of ethanol blending or weak
enforcement of existing requirements, decreases in tax credits to refiners
and/or reductions in tariffs on imported
ethanol.
|
|
|
o
|
Imbalances
in the supply of and demand for corn. This could be caused by,
among other things (1) drought or other acts of nature, (2) increased
construction of new ethanol production facilities, (3) governmental
actions that discourage raising corn for use in ethanol production (such
as providing tax credits for corn grown for human consumption) or (4)
changes in agricultural markets, technology or
regulations.
|
|
|
o
|
Volatility
in domestic and/or foreign markets.
|
Potential
Impacts: Prolonged
periods of high corn and/or natural gas prices and/or depressed ethanol and/or
distillers grain prices could result in reduced net margins and have a material
adverse impact on the earnings of Cornhusker Holdings that could, in turn, lead
to an impairment of CHEC’s investment in the company.
Additionally,
the adverse conditions described above could reduce cash flows of Cornhusker
Holdings which, in turn, could lead to loan defaults. CHEC holds
subordinated notes totaling $10.2 million, including interest, and has an equity
investment of $2.2 million in Cornhusker as of September 30,
2009. During the nine months ended September 30, 2009, CHEC accrued
$0.7 million of interest income associated with these notes. In
response to the continuation of lower than expected crush margins, Management
stopped accruing interest on the subordinated debt and will record such interest
on the cash basis until the current outstanding balance of interest has been
paid. CHEC held subordinated notes totaling $9.5 million, including
interest, and had an equity investment of $3.0 million in Cornhusker as of
December 31, 2008. Cornhusker Energy Lexington, LLC (“CEL”)
re-negotiated the deadline in its senior note agreement for completing the
expansion of plant capacity and output to December 31,
2009. Management expects the expansion of the plant’s capacity to be
completed by that date, but believes the output required under the terms of the
note agreement may not be achieved until the first quarter of
2010. If the expanded output is not achieved by December, 31, 2009
(and following any cure period as provided for under the terms of the
agreement), CEL may request a waiver to extend the deadline, and if CEL is
unable to obtain a waiver by December 31, 2009, the senior note holder may have
the right to accelerate all amounts due under the senior note.
CHEC also
has an outstanding loan to Buckeye Biopower, LLC (“Buckeye”) in the amount of
$1.2 million for the development of a 110 million gallon per year corn ethanol
plant. During the first quarter of 2009, a reserve was established
for the full outstanding loan balance. If circumstances do not change
sufficiently to allow for repayment, this could adversely impact CHEC’s ability
to ultimately collect the $1.2 million of cash that is due under the terms of
the loan agreement. CHEC has notified the developers that the loan is
past due and has demanded payment. Buckeye has not yet obtained
financing to develop the project.
|
ITEM 6 -
|
EXHIBITS
|
Incorporated
herein by reference to the Exhibit Index for this Quarterly Report on Form
10-Q, which is located immediately after the signature pages to this
report.
Pursuant
to the requirements of the Securities Exchange Act of 1934, the registrants have
duly caused this report to be signed on their behalf by the undersigned
thereunto duly authorized.
|
CH
ENERGY GROUP, INC.
|
||
|
(Registrant)
|
||
|
By:
|
/s/
Kimberly J. Wright
|
|
|
Kimberly
J. Wright
|
||
|
Vice
President - Accounting and Controller
|
||
|
CENTRAL
HUDSON GAS & ELECTRIC CORPORATION
|
||
|
(Co-Registrant)
|
||
|
By:
|
/s/
Kimberly J. Wright
|
|
|
Kimberly
J. Wright
|
||
|
Controller
|
Dated:
November 9, 2009
EXHIBIT
INDEX
Following
is the list of Exhibits, as required by Item 601 of Regulation S-K, filed
as part of this Quarterly Report on Form 10-Q:
|
Exhibit No.
Regulation
S-K
Item 601
Designation
|
Exhibit Description
|
|
|
Employment
Agreement, dated October 1, 2009, between CH Energy Group, Inc. and John
Gould.
|
||
|
Statements
Showing Computation of the Ratio of Earnings to Fixed Charges and the
Ratio of Earnings to Combined Fixed Charges and Preferred Stock
Dividends.
|
||
|
Rule
13a-14(a)/15d-14(a) Certification by
Mr. Lant.
|
||
|
Rule
13a-14(a)/15d-14(a) Certification by
Mr. Capone.
|
||
|
Section 1350
Certification by Mr. Lant.
|
||
|
Section 1350
Certification by Mr. Capone.
|
- 119
-