Attached files
| file | filename |
|---|---|
| 8-K - CURRENT REPORT ON FORM 8-K - SUN MICROSYSTEMS, INC. | d8k.htm |
| EX-99.1 - SUN MICROSYSTEMS, INC. CONDENSED CONSOLIDATED FINANCIAL STATEMENTS - SUN MICROSYSTEMS, INC. | dex991.htm |
 Investor
Relations SUN MICROSYSTEMS Q110 Results Financial Slides Exhibit 99.2 http://www.sun.com/investors |
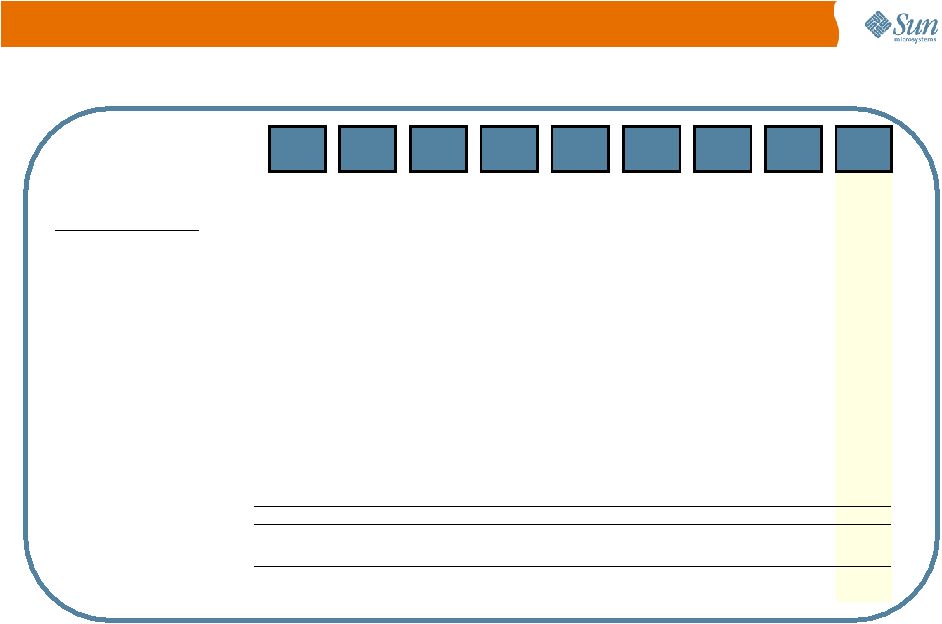
 2 Top Level P&L Revenue 2,990 2,625 2,243 (382) (15%) (747) (25%) Gross Margin 1,201 1,064 973 (91) (9%) (228) (19%) Gross Margin % 40.2% 40.5% 43.4% 2.9 3.2 Operating Expenses ** 2,851 1,282 1,073 (209) (16%) (1,778) (62%) Operating Income (1,650) (218) (100) 118 54% 1,550 94% Net Income (1,681) (154) (120) 34 22% 1,561 93% Operating Margin % (55.2%) (8.3%) (4.5%) 3.8 50.7 EPS GAAP ($2.24) ($0.21) ($0.16) $0.05 24% $2.08 93% Non-GAAP Net Income *** (62) (21) 15 36 171% 77 124% EPS Non-GAAP *** ($0.08) ($0.03) $0.02 $0.05 167% $0.10 125% Q109 Actuals* Q409 Actuals* Q110 Actuals Q-Q Change Q-Q %Change Y-Y Change Y-Y %Change Pts Pts Pts Pts *Amounts presented for this period have been adjusted as a result of our adoption of new
standards that changed the accounting for convertible debt instruments. We
adopted the new standards in the first quarter of fiscal 2010 and they required retrospective application. Additional details regarding the new standards are provided in our Form 10-Q for the fiscal quarter ended September 27,
2009. **Total Operating Expenses includes SG&A, R&D, Purchase IPRD,
Restructuring, & Intangible Impairment charges. *** See Slide 14 for a reconciliation of GAAP Net Income and EPS GAAP to Non-GAAP Net Income and EPS Non-GAAP, respectively. |
 PRODUCTS/SERVICES Year/Year Change Revenue Products Revenue down (33)% Y/Y Services Revenue down (14)% Y/Y Fiscal Quarter Services Revenue (% of Total) Products Revenue (% of Total) 3 Q108 Q208 Q308 Q408 Q109 Q209 Q309 Q409 Q110 $0 $1,000 $2,000 $3,000 $4,000 38% 62% 62% 1% 38% 62% 62% 1% 39% 61% 61% (1)% 37% 63% 63% (1)% 41% 59% 59% (7)% 40% 60% 60% (11)% 42% 58% 58% (20)% 47% 53% 53% (31)% (25)% 44% 56% 56% |
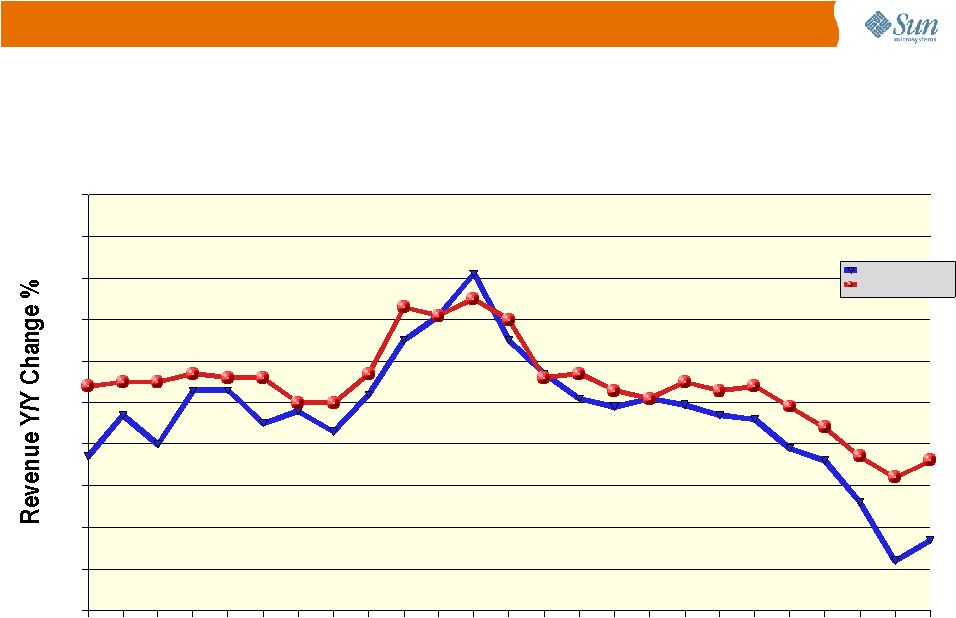 Revenue 4 PRODUCTS/SERVICES Year/Year Change Q104 Q204 Q304 Q404 Q105 Q205 Q305 Q405 Q106 Q206 Q306 Q406 Q107 Q207 Q307 Q407 Q108 Q208 Q308 Q408 Q109 Q209 Q309 Q409 Q110 -50% -40% -30% -20% -10%-13% 0% 10% 20% 30% 40% 50% -3% -10% 3% 3% -5% -2% -7% 2% 15% 21% 31% 15% 7% 1% -1% 1% -1% -3% -4% -11% -14% -24% -38% -33% 4% 5% 5% 7% 6% 6% 0% 0% 7% 23% 21% 25% 20% 6% 7% 3% 1% 5% 3% 4% -1% -6% -13% -18% -14% Products Revenue Services Revenue Fiscal Quarter |
 5 Billings Disclosure by Category* ($Millions) Q108 Q208 Q308 Q408 FY08 Q109 Q209 Q309 Q409 FY09 Q110 Systems Billings Solaris SPARC Enterprise Servers 793 978 702 939 3,413 576 662 504 435 2,177 343 Change % Y/Y 23 8 -8 -13 1 -27 -32 -28 -54 -36 -40 Solaris SPARC CMT Servers 185 282 299 353 1,119 338 369 309 355 1,370 272 Change % Y/Y 70 105 110 61 84 83 31 3 0 22 -20 X64 Servers 169 157 186 195 707 176 175 145 178 675 159 Change % Y/Y 10 -11 14 1 3 4 11 -22 -9 -5 -10 Other Systems Products 356 367 282 286 1,292 156 130 83 65 434 50 Change % Y/Y -15 -21 -27 -38 -26 -56 -65 -70 -77 -66 -68 Subtotal*** 1,503 1,785 1,469 1,774 6,530 1,246 1,336 1,041 1,033 4,657 824 Change % Y/Y 13 6 1 -9 2 -17 -25 -29 -42 -29 -34 Software Billings Java 29 45 57 88 220 34 67 73 108 281 54 Change % Y/Y 21 10 -4 -6 1 18 47 27 22 28 57 25 52 40 91 208 52 81 80 100 313 53 Change % Y/Y -17 16 -20 24 5 111 55 101 10 51 2 44 59 49 64 216 38 42 34 45 159 24 Change % Y/Y -12 -10 -4 16 -2 -14 -29 -30 -29 -26 -36 Subtotal*** 97 156 147 244 644 124 189 187 253 754 131 Change % Y/Y -6 3 -9 9 1 27 21 28 4 17 6 -126 -347 -142 -295 -910 -114 -156 -135 -187 -591 -93 Total Computer Systems Revenue*** 1,475 1,594 1,473 1,722 6,264 1,257 1,369 1,094 1,099 4,819 862 Storage Billings Disks & Storage Arrays 302 407 350 468 1,528 311 386 233 242 1,172 196 Change % Y/Y 3 6 1 21 8 3 -5 -34 -48 -23 -37 Open Storage 9 26 23 33 91 25 31 38 51 145 35 Change % Y/Y 55 155 37 83 162 21 63 57 59 40 Tape 196 282 195 279 953 188 245 202 149 784 140 Change % Y/Y -4 2 -19 5 -4 -4 -13 3 -47 -18 -25 Other Storage 14 17 16 12 58 11 8 6 5 30 4 Change % Y/Y 69 41 458 -44 55 -16 -54 -62 -55 -48 -66 -17 -77 -54 -128 -276 -28 -100 -53 -66 -246 -50 Total Storage Revenue*** 505 655 530 664 2,354 507 570 425 383 1,885 325 Total Products Revenue 1,980 2,249 2,003 2,386 8,618 1,764 1,939 1,519 1,482 6,704 1,187 Services Revenue 979 1,041 961 1,042 4,023 963 946 853 886 3,648 852 Change % Y/Y -1 4 1 2 2 -2 -9 -11 -15 -9 -12 Professional and Education Services 260 325 302 352 1,239 263 335 242 257 1,097 204 Change % Y/Y 7 7 11 10 9 1 3 -20 -27 -11 -22 Total Services Revenue 1,239 1,366 1,263 1,394 5,262 1,226 1,281 1,095 1,143 4,745 1,056 Total Sun Revenue 3,219 3,615 3,266 3,780 13,880 2,990 3,220 2,613 2,625 11,449 2,243 Notes: Blade Servers Billings (includes CMT, X64, and Netra) 55 44 69 73 241 61 71 55 66 254 62 Change % Y/Y 638 122 162 71 151 11 62 -19 -9 5 2 • Solaris SPARC Enterprise Servers includes the Datacenter & Midrange server systems • Solaris SPARC CMT Servers includes all CMT Servers, including CMT Blades and CMT Netra products • X64 Servers includes X64 Rack, X64 Blades and X64 Netra products and excludes products categorized under Open Storage • Other Systems Products includes Workstations, Volume SPARC, Netra SPARC, Integrated Products and Networking products • Open Storage includes the Sun Storage 7110,7210, and 7410, Sun Fire X4500, Sun Fire X4540, J4200, J4400 and
J4500 products • Other Storage includes the NAS products minus Sun Storage 7110,7210, and 7410 MySQL / Infrastructure Solaris, Management and Virtualization Computer Systems Reserves and Adjustments ** Storage Reserves and Adjustments ** Hardware, Software Support (Including Solaris & Other Software) *Billings represent the amount invoiced to customers for products and are subject to cancellation. Billings
is not a GAAP financial measurement, and therefore is not an audited number. Billings differs from revenue in that billings are not adjusted for any reserves and are not subject to any of the
conditions under GAAP that must be met before revenue is recognized. Accordingly, amounts billed may not lead to revenue and billings should not be viewed as equivalent to, or a substitute
for, GAAP revenue. **Reserves and adjustments represent deferrals, reserves and other reductions of invoiced amounts required
under GAAP before revenue is recognized. ***Excludes service revenue attributable to
Systems, Software, and Storage including maintenance and support shown in the Hardware, Software Support line under Services Revenue |
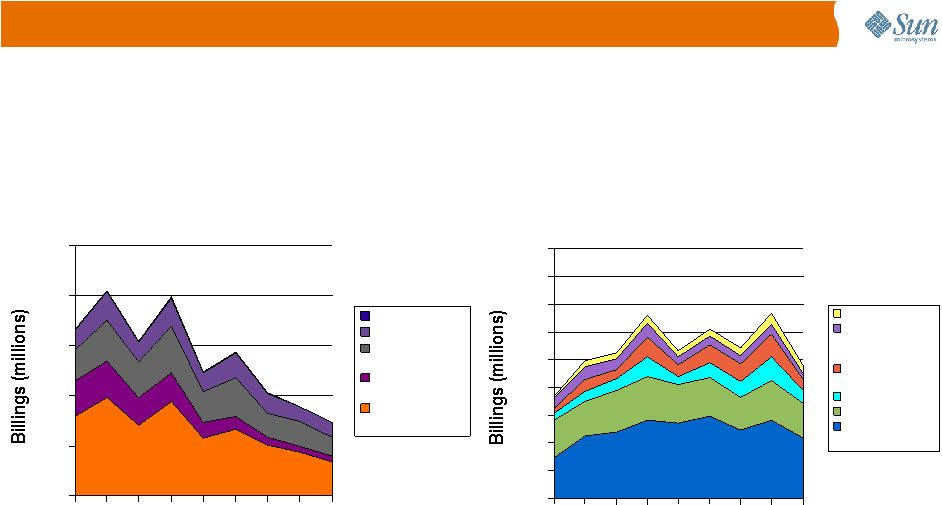 6 Billings Trends* Q108 Q208 Q308 Q408 Q109 Q209 Q309 Q409 Q110 0 125 250 375 500 625 750 875 1,000 1,125 Growth Categories Open Storage Solaris, Man- agement and Vir- tualization MySQL / Infrastruc- ture Java X64 Servers Solaris SPARC CMT Servers Q108 Q208 Q308 Q408 Q109 Q209 Q309 Q409 Q110 0 500 1,000 1,500 2,000 2,500 Traditional Categories Other Storage Tape Disks & Storage Arrays Other Systems Products Solaris SPARC En - terprise Servers Fiscal Quarter Fiscal Quarter *Billings represent the amount invoiced to customers for products and are
subject to cancellation. Billings is not a GAAP financial measurement, and therefore is not an audited number. Billings differs from revenue in that billings are not adjusted for any reserves and are not subject to any of the conditions under GAAP that must be met before revenue is recognized. Accordingly, amounts billed may not lead to revenue and billings should not be viewed as equivalent to, or a substitute for, GAAP revenue. |
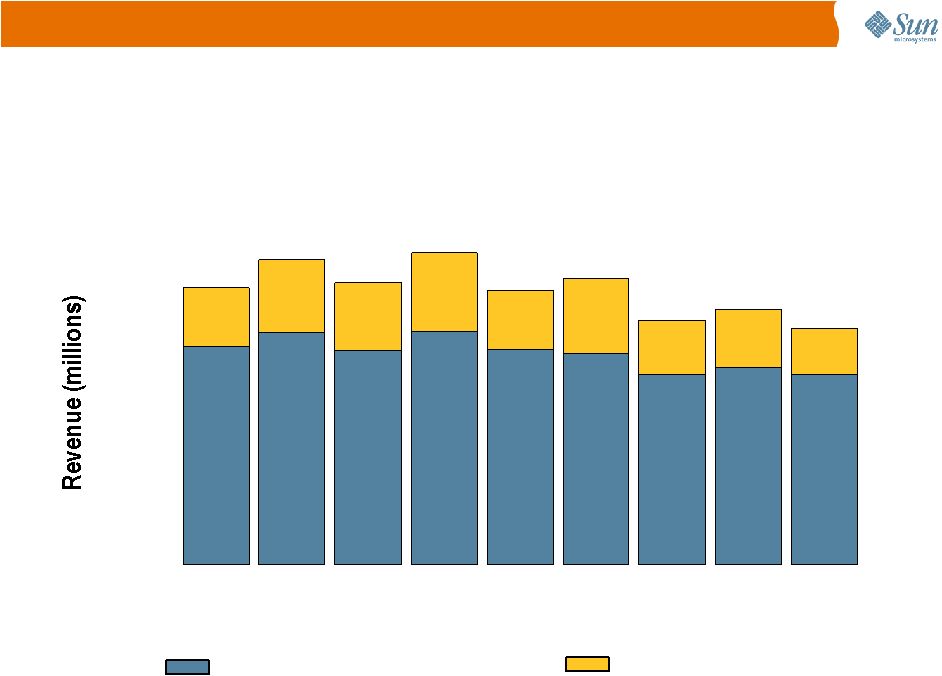 7 Q108 Q208 Q308 Q408 Q109 Q209 Q309 Q409 Q110 $0 $500 $1,000 $1,500 TOTAL SERVICES REVENUE Fiscal Quarter Year/Year Change Services Revenue Professional Services/Edu Services Revenue (% of Total Services) Support Services Revenue (% of Total Services) Support Services down (12)% Y/Y Professional Services/Edu Services down (22)% Y/Y 79% 79% 21% 1% 76% 76% 24% 5% 76% 76% 24% 3% 4% 75% 75% 25% (1)% 79% 79% 21% 26% 74% 74% (6)% (13)% 78% 78% 22% (18)% 78% 78% 22% 19% 81% 81% (14)% |
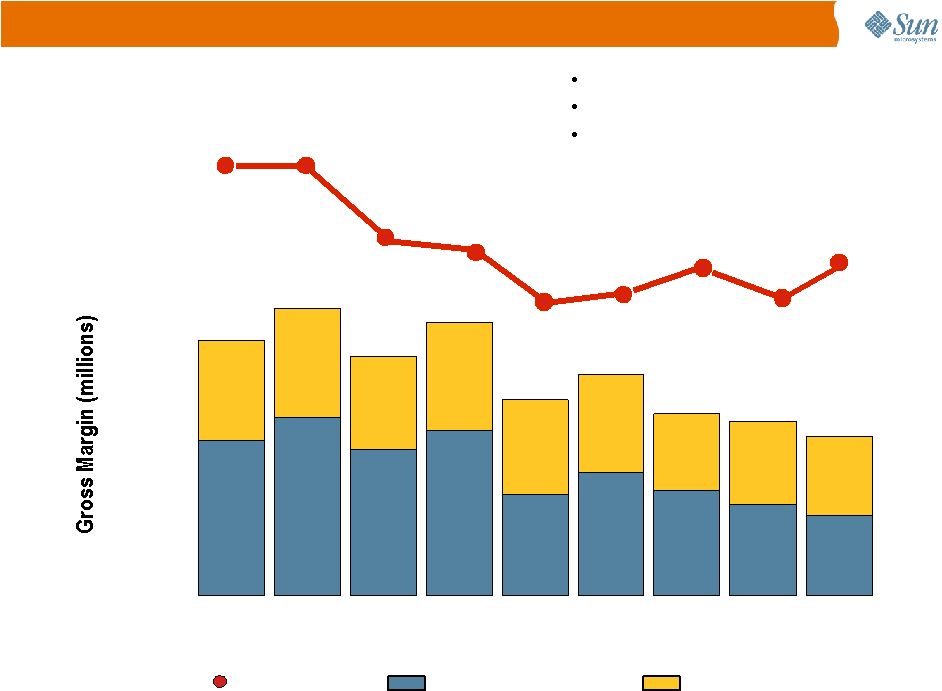 8 Q108 Q208 Q308 Q408 Q109 Q209 Q309 Q409 Q110 $0 $500 $1,000 $1,500 $2,000 Fiscal Quarter PRODUCTS/SERVICES Gross Margin %-Services Gross Margin %-Products Gross Margin % Products Margin up 6.2 pts Y/Y Services Margin down 1.8 pts Y/Y Total Margin up 3.2 pts Y/Y Gross Margin 48.5% 49.2% 48.0% 48.0% 1,561 48.7% 48.4% 48.4% 1,753 44.9% 45.2% 44.8% 44.8% 1,468 48.5% 47.3% 42.5% 42.5% 1,673 44.3% 40.2% 35.2% 35.2% 47.3% 1,201 46.1% 39.1% 39.1% 1,350 41.9% 42.3% 42.3% 43.3% 1,116 42.7% 37.7% 37.7% 44.3% 1,064 40.5% 43.4% 973 41.4% 41.4% 45.5% |
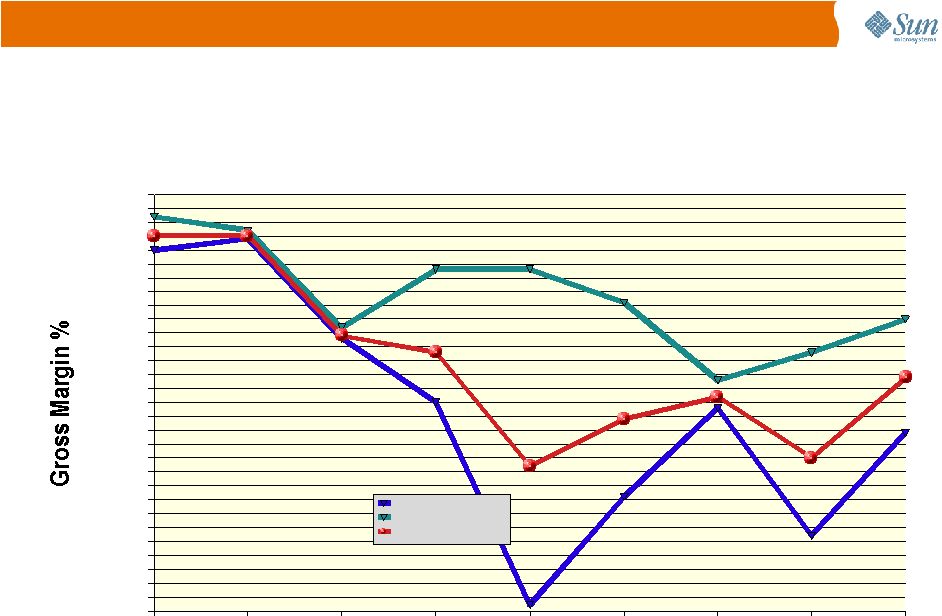 9 PRODUCTS/SERVICES Gross Margin % Q108 Q208 Q308 Q408 Q109 Q209 Q309 Q409 Q110 35.0% 36.0% 37.0% 38.0% 39.0% 40.0% 41.0% 42.0% 43.0% 44.0% 45.0% 46.0% 47.0% 48.0% 49.0% 50.0% 48.0% 48.4% 44.8% 42.5% 35.2% 39.1% 42.3% 37.7% 41.4% 49.2% 48.7% 45.2% 47.3% 47.3% 46.1% 43.3% 44.3% 45.5% 48.5% 48.5% 44.9% 44.3% 40.2% 41.9% 42.7% 40.5% 43.4% Products Gross Margin Services Gross Margin Total Gross Margin Fiscal Quarter |
 10 Q108 Q208 Q308 Q408 Q109 Q209 Q309 Q409 Q110 $0 $300 $600 $900 $1,200 $1,500 $1,800 $446 $463 $457 $468 $423 $411 $393 $421 $354 $939 $995 $989 $1,032 $920 $916 $843 $782 $668 Fiscal Quarter * Total Operating Expenses differ from SG&A and R&D Expenses because Total
Operating Expenses includes IPRD, Restructuring, & Intangible
Impairment charges. Year/Year Change R&D / SG&A Expense* SG&A R&D (24)% Y/Y decrease (3)% (2)% (2)% 2% (3)% (9)% (15)% (20)% (24)% |
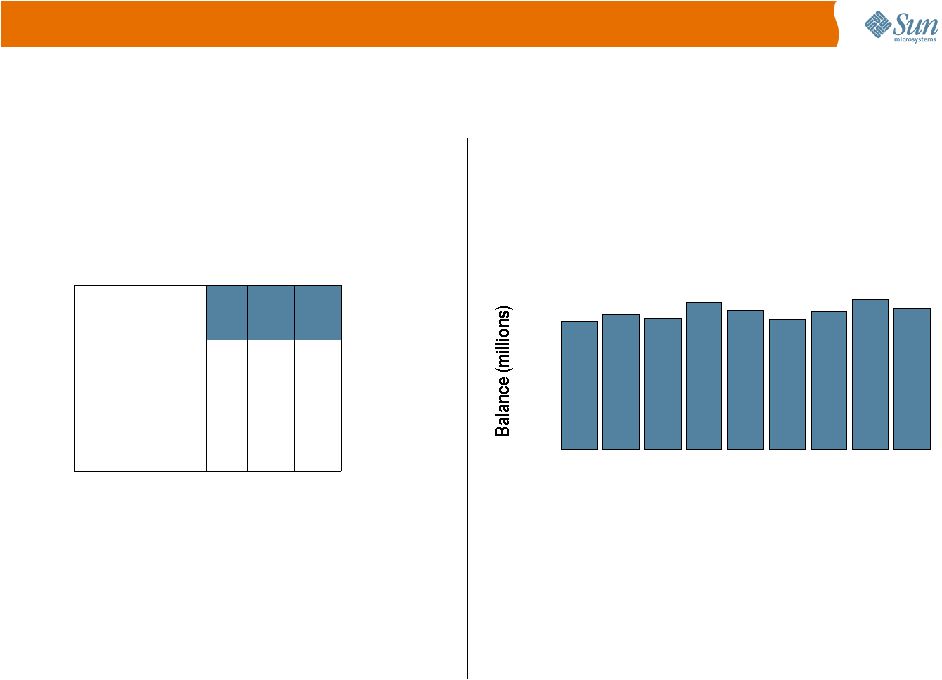 11 Year/Year Growth Q108 Q208 Q308 Q408 Q109 Q209 Q309 Q409 Q110 0 500 1,000 1,500 2,000 2,500 3,000 Fiscal Quarter Deferred Revenue at $2.8B Demand Metrics * Book to Bill Ratio assumes Services ratio 1:1 ** Services Backlog based on three month backlog horizon Book to Bill Ratio & Backlog 14% 24% 6% 8% 9% (4)% 5% 2% 1% Q109 Q409 Q110 Book to Bill Ratio* 1.00 0.99 1.00 $1,922 $1,785 $1,836 Product & Services Backlog ($M) ** |
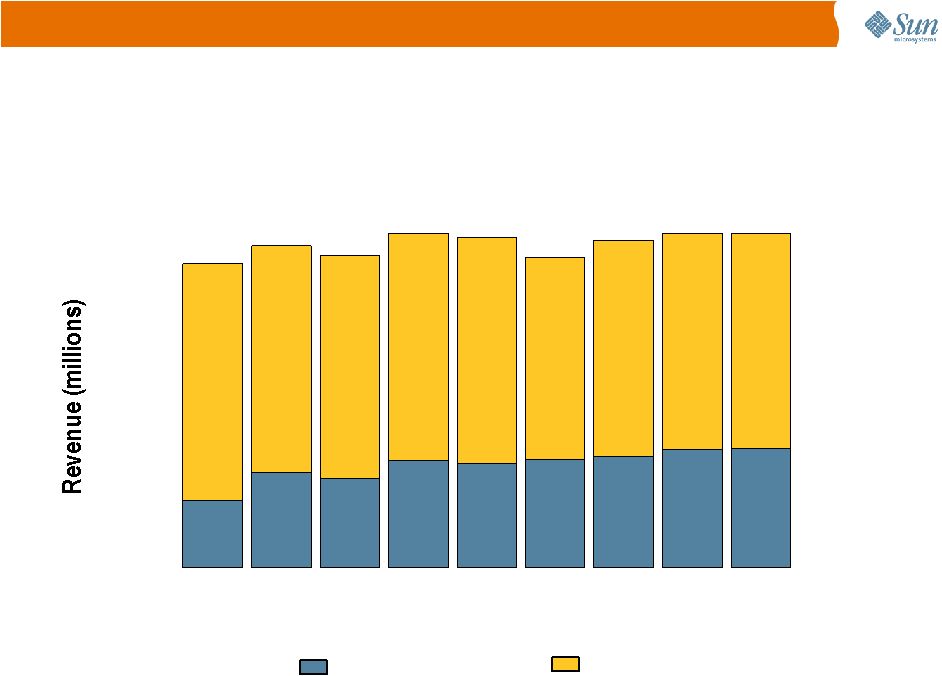 12 Q108 Q208 Q308 Q408 Q109 Q209 Q309 Q409 Q110 $0 $700 $1,400 $2,100 $2,800 PRODUCTS/SERVICES Fiscal Quarter Year/Year Change Deferred Revenue Services Deferred Revenue (% of Total) Products Deferred Revenue (% of Total) Products Deferred Revenue up 15% Y/Y Services Deferred Revenue down (5)% Y/Y 14% 22% 22% 78% 24% 71% 29% 29% 6% 71% 29% 29% 8% 69% 31% 31% 9% 69% 31% 31% (4)% 65% 35% 35% 5% 66% 34% 34% 2% 67% 33% 33% 1% 64% 36% 36% |
 13 Q108 Q208 Q308 Q408 Q109 Q209 Q309 Q409 Q110 $0 $1,000 $2,000 $3,000 $4,000 Fiscal Quarter North America/ Europe/ Emerging Markets/ APAC* Revenue -Europe (% of Total) Revenue -APAC (% of Total) Revenue -North America (% of Total) Revenue - Geo North America down (19)% Y/Y Europe down (29)% Y/Y Emerging Markets down (33)% Y/Y APAC down (23)% Y/Y * Effective Q1FY09, we began utilizing revised geographic groupings. Percentage of total
revenue figures have been adjusted to reflect the change in the compilation of the countries that make up each of our geographic regions. 3,219 43% 43% 32% 13% 12% 12% 3,615 12% 12% 34% 15% 39% 39% 3,266 13% 13% 34% 14% 39% 39% 3,780 12% 12% 33% 14% 41% 41% Revenue -Emerging Markets (% of Total) 12% 12% 32% 15% 41% 41% 2,990 3,220 11% 11% 33% 17% 39% 39% 2,614 12% 12% 32% 16% 40% 40% 2,625 12% 12% 34% 14% 40% 40% 2,243 44% 44% 30% 14% 12% 12% |
 14 Non-GAAP Calculation of Net Income *Amounts presented for this period have been adjusted as a result of our adoption of new
standards that changed the accounting for convertible debt instruments. We adopted the new standards in the first quarter of fiscal 2010 and they required retrospective application.
Additional details regarding the new standards are provided in our Form 10-Q for the fiscal quarter ended September 27, 2009. GAAP net income (loss) 85 256 (38) 81 (1,681) (218) (208) (154) (120) Non-GAAP adjustments: Purchased IPRD 0 1 24 6 0 0 3 0 0 74 74 76 86 80 72 72 72 52 Accretion of discounts on convertible debt 6 7 7 7 7 7 7 7 7 Stock based compensation 48 52 57 57 49 52 49 42 41 Restructuring charges 113 32 14 104 63 222 46 64 45 0 0 0 0 1,445 0 0 15 6 (Gain) loss on equity investments, net (22) 0 0 (10) (8) 3 (3) 0 2 Settlement income 0 0 0 (45) 0 0 0 (47) 0 Tax effect of non-GAAP adjustments (17) (10) (5) (11) (17) (26) (18) (20) (18) Non-GAAP net income (loss) 287 412 135 275 (62) 112 (52) (21) 15 $0.32 $0.50 $0.17 $0.35 ($0.08) $0.15 ($0.07) ($0.03) $0.02 190.9% 56.3% (5.6%) (30.0%) (125.0%) (70.0%) (141.2%) (108.6%) 125.0% (36.0%) 56.3% (66.0%) 105.9% (122.9%) 287.5% (146.7%) 57.1% 166.7% Q108 Actuals* Q208 Actuals* Q308 Actuals* Q408 Actuals* Q109 Actuals* Q209 Actuals* Q309 Actuals* Q409 Actuals* Q110 Actuals Amortization of acquisition related intangibles Impairment of goodwill and Acquistition – related intangible assets Diluted Non-GAAP net income (loss) per share Change vs. prior year (%) Change vs. prior quarter (%) |
 15 Server Metrics Q108 Q208 Q308 Q408 Q109 Q209 Q309 Q409 Q110 0 20 40 60 80 100 120 Total Server Units Year/Year Change Q108 Q208 Q308 Q408 Q109 Q209 Q309 Q409 Q110 0 5 10 15 20 25 30 35 x64* Server Units Year/Year Change Fiscal Quarter Fiscal Quarter * x64 servers include x86 32-bit and x64 64-bit servers and blades 7% (5)% 13% 1% 26% 6% 2% 28% 2% 39% 15% (9)% (26)% (14)% (34)% (13)% (41)% (30)% |
 12 Investor Relations http://www.sun.com/investors Investor Relations http://www.sun.com/in vestors |