Attached files
| file | filename |
|---|---|
| 8-K - 8-K - FEDERAL HOME LOAN MORTGAGE CORP | f71165e8vk.htm |
| EX-99.2 - EXHIBIT 99.2 - FEDERAL HOME LOAN MORTGAGE CORP | f71165exv99w2.htm |
| EX-99.1 - EXHIBIT 99.1 - FEDERAL HOME LOAN MORTGAGE CORP | f71165exv99w1.htm |
| Third Quarter 2009 Financial Results Supplement November 6, 2009 |
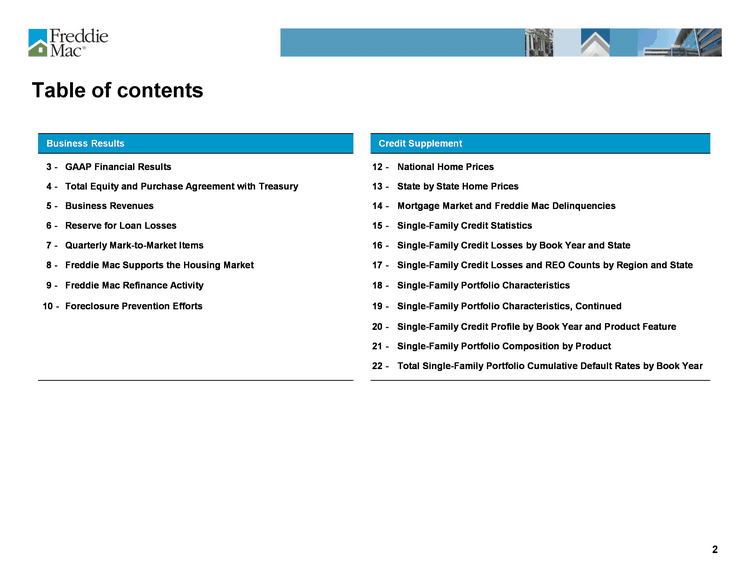
| Table of contents |
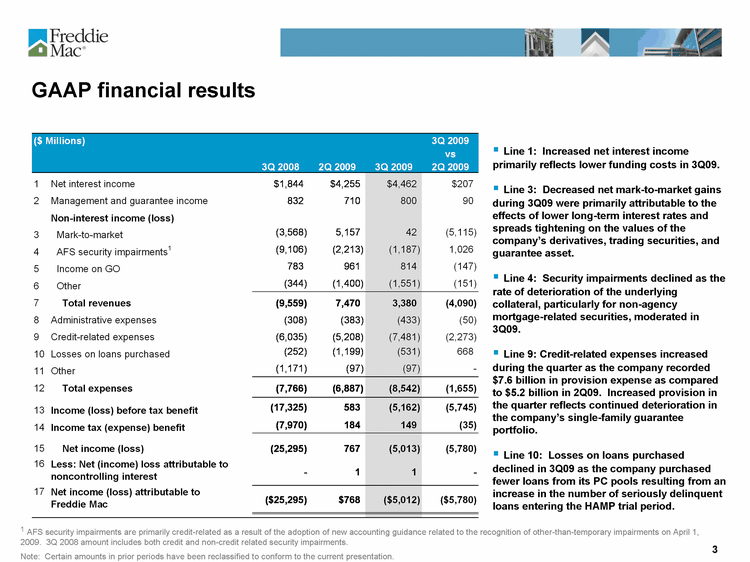
| GAAP financial results Line 1: Increased net interest income primarily reflects lower funding costs in 3Q09. Line 3: Decreased net mark-to-market gains during 3Q09 were primarily attributable to the effects of lower long-term interest rates and spreads tightening on the values of the company's derivatives, trading securities, and guarantee asset. Line 4: Security impairments declined as the rate of deterioration of the underlying collateral, particularly for non-agency mortgage-related securities, moderated in 3Q09. Line 9: Credit-related expenses increased during the quarter as the company recorded $7.6 billion in provision expense as compared to $5.2 billion in 2Q09. Increased provision in the quarter reflects continued deterioration in the company's single-family guarantee portfolio. Line 10: Losses on loans purchased declined in 3Q09 as the company purchased fewer loans from its PC pools resulting from an increase in the number of seriously delinquent loans entering the HAMP trial period. 1 AFS security impairments are primarily credit-related as a result of the adoption of new accounting guidance related to the recognition of other-than-temporary impairments on April 1, 2009. 3Q 2008 amount includes both credit and non-credit related security impairments. Note: Certain amounts in prior periods have been reclassified to conform to the current presentation. |
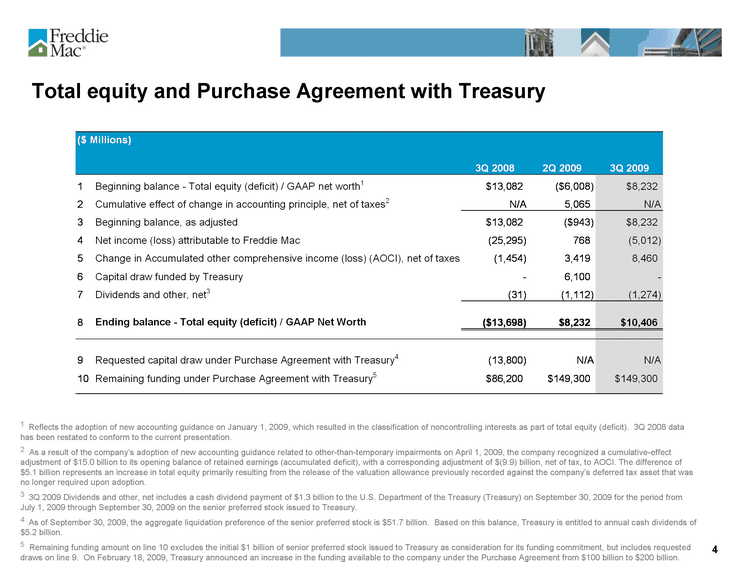
| Total equity and Purchase Agreement with Treasury 1 Reflects the adoption of new accounting guidance on January 1, 2009, which resulted in the classification of noncontrolling interests as part of total equity (deficit). 3Q 2008 data has been restated to conform to the current presentation. 2 As a result of the company's adoption of new accounting guidance related to other-than-temporary impairments on April 1, 2009, the company recognized a cumulative-effect adjustment of $15.0 billion to its opening balance of retained earnings (accumulated deficit), with a corresponding adjustment of $(9.9) billion, net of tax, to AOCI. The difference of $5.1 billion represents an increase in total equity primarily resulting from the release of the valuation allowance previously recorded against the company's deferred tax asset that was no longer required upon adoption. 3 3Q 2009 Dividends and other, net includes a cash dividend payment of $1.3 billion to the U.S. Department of the Treasury (Treasury) on September 30, 2009 for the period from July 1, 2009 through September 30, 2009 on the senior preferred stock issued to Treasury. 4 As of September 30, 2009, the aggregate liquidation preference of the senior preferred stock is $51.7 billion. Based on this balance, Treasury is entitled to annual cash dividends of $5.2 billion. 5 Remaining funding amount on line 10 excludes the initial $1 billion of senior preferred stock issued to Treasury as consideration for its funding commitment, but includes requested draws on line 9. On February 18, 2009, Treasury announced an increase in the funding available to the company under the Purchase Agreement from $100 billion to $200 billion. |
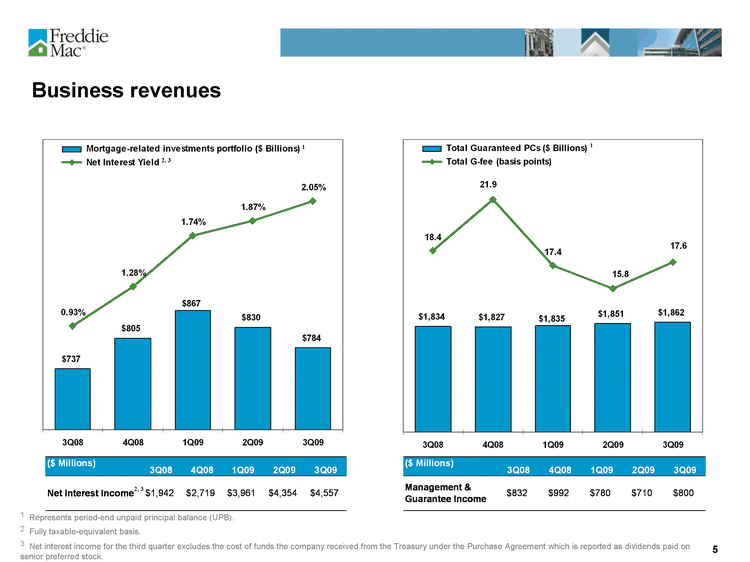
| Business revenues 1 Represents period-end unpaid principal balance (UPB). 2 Fully taxable-equivalent basis. 3 Net interest income for the third quarter excludes the cost of funds the company received from the Treasury under the Purchase Agreement which is reported as dividends paid on senior preferred stock. 2, 3 2, 3 1 1 |
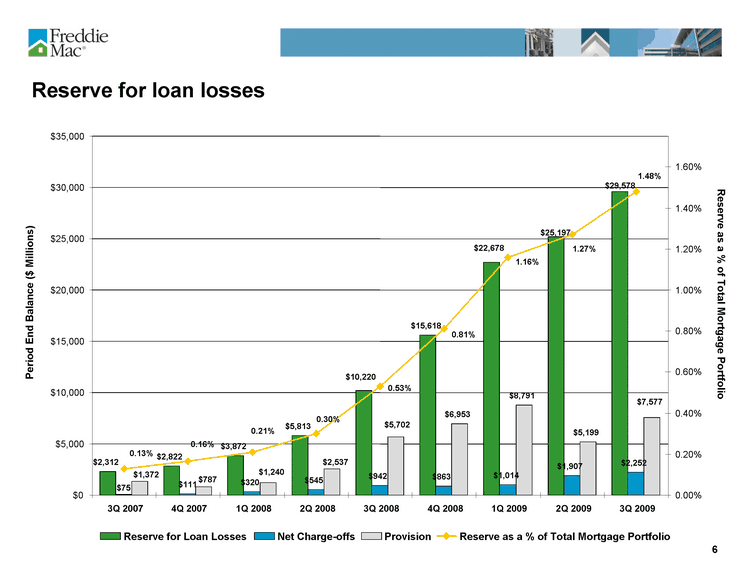
| Reserve for loan losses $2,312 $2,822 $3,872 $5,813 $15,618 $320 $545 $942 $863 $1,014 $1,907 $2,252 $6,953 $8,791 $5,199 $25,197 $29,578 $22,678 $10,220 $75 $111 $5,702 $2,537 $1,240 $787 $1,372 $7,577 1.27% 1.48% 0.13% 0.16% 0.21% 0.53% 0.81% 1.16% 0.30% $0 $5,000 $10,000 $15,000 $20,000 $25,000 $30,000 $35,000 3Q 2007 4Q 2007 1Q 2008 2Q 2008 3Q 2008 4Q 2008 1Q 2009 2Q 2009 3Q 2009 Period End Balance ($ Millions) 0.00% 0.20% 0.40% 0.60% 0.80% 1.00% 1.20% 1.40% 1.60% Reserve as a % of Total Mortgage Portfolio Reserve for Loan Losses Net Charge-offs Provision Reserve as a % of Total Mortgage Portfolio |
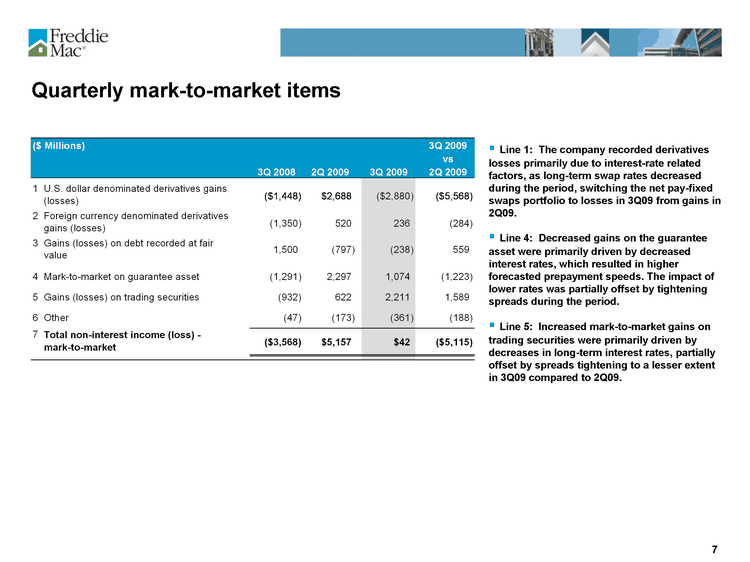
| Quarterly mark-to-market items Line 1: The company recorded derivatives losses primarily due to interest-rate related factors, as long-term swap rates decreased during the period, switching the net pay-fixed swaps portfolio to losses in 3Q09 from gains in 2Q09. Line 4: Decreased gains on the guarantee asset were primarily driven by decreased interest rates, which resulted in higher forecasted prepayment speeds. The impact of lower rates was partially offset by tightening spreads during the period. Line 5: Increased mark-to-market gains on trading securities were primarily driven by decreases in long-term interest rates, partially offset by spreads tightening to a lesser extent in 3Q09 compared to 2Q09. |
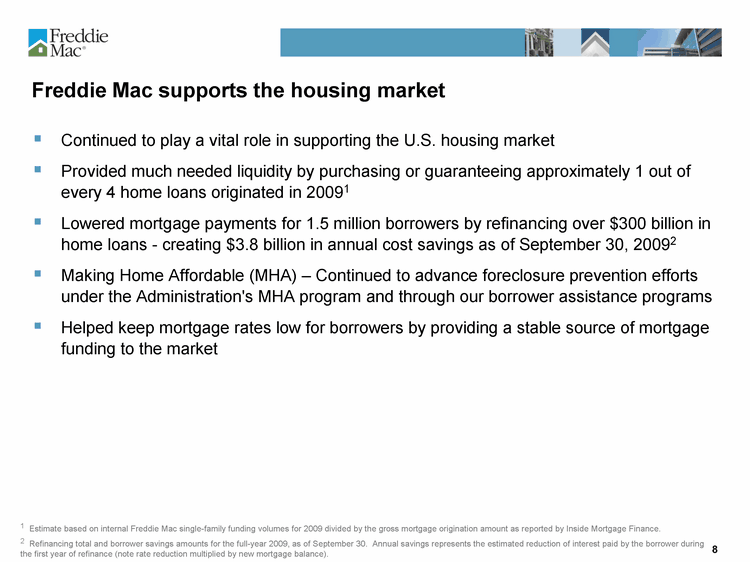
| Freddie Mac supports the housing market 1 Estimate based on internal Freddie Mac single-family funding volumes for 2009 divided by the gross mortgage origination amount as reported by Inside Mortgage Finance. 2 Refinancing total and borrower savings amounts for the full-year 2009, as of September 30. Annual savings represents the estimated reduction of interest paid by the borrower during the first year of refinance (note rate reduction multiplied by new mortgage balance). Continued to play a vital role in supporting the U.S. housing market Provided much needed liquidity by purchasing or guaranteeing approximately 1 out of every 4 home loans originated in 20091 Lowered mortgage payments for 1.5 million borrowers by refinancing over $300 billion in home loans - creating $3.8 billion in annual cost savings as of September 30, 20092 Making Home Affordable (MHA) - Continued to advance foreclosure prevention efforts under the Administration's MHA program and through our borrower assistance programs Helped keep mortgage rates low for borrowers by providing a stable source of mortgage funding to the market |
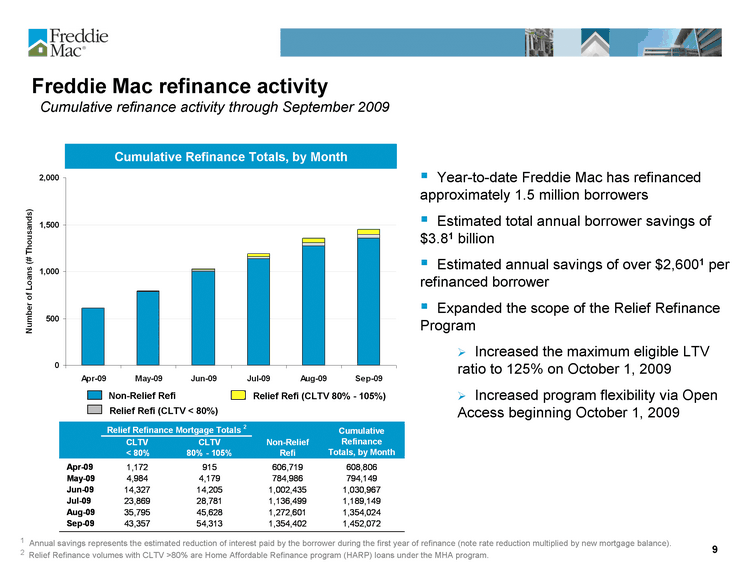
| Year-to-date Freddie Mac has refinanced approximately 1.5 million borrowers Estimated total annual borrower savings of $3.81 billion Estimated annual savings of over $2,6001 per refinanced borrower Expanded the scope of the Relief Refinance Program Increased the maximum eligible LTV ratio to 125% on October 1, 2009 Increased program flexibility via Open Access beginning October 1, 2009 Cumulative Refinance Totals, by Month Relief Refi (CLTV 80% - 105%) Non-Relief Refi Relief Refi (CLTV < 80%) 1 Annual savings represents the estimated reduction of interest paid by the borrower during the first year of refinance (note rate reduction multiplied by new mortgage balance). 2 Relief Refinance volumes with CLTV >80% are Home Affordable Refinance program (HARP) loans under the MHA program. Freddie Mac refinance activity Cumulative refinance activity through September 2009 |
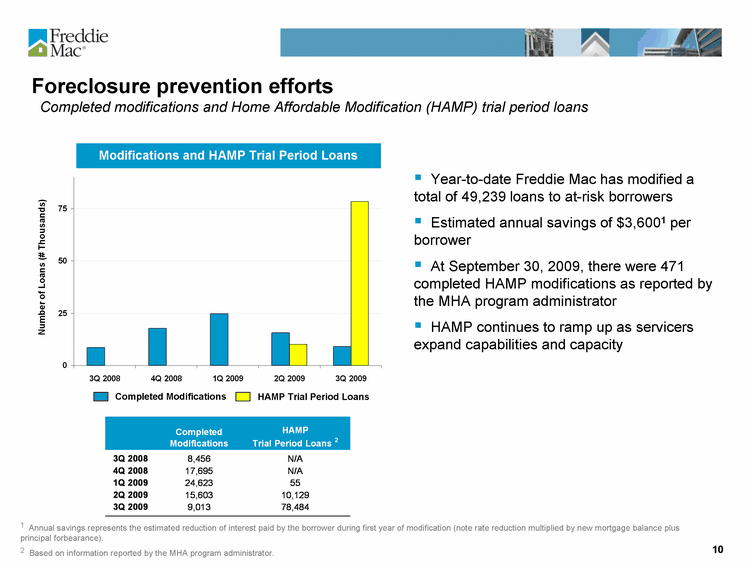
| Foreclosure prevention efforts Completed modifications and Home Affordable Modification (HAMP) trial period loans Completed Modifications HAMP Trial Period Loans Year-to-date Freddie Mac has modified a total of 49,239 loans to at-risk borrowers Estimated annual savings of $3,6001 per borrower At September 30, 2009, there were 471 completed HAMP modifications as reported by the MHA program administrator HAMP continues to ramp up as servicers expand capabilities and capacity Modifications and HAMP Trial Period Loans 1 Annual savings represents the estimated reduction of interest paid by the borrower during first year of modification (note rate reduction multiplied by new mortgage balance plus principal forbearance). 2 Based on information reported by the MHA program administrator. |

| Credit Supplement |
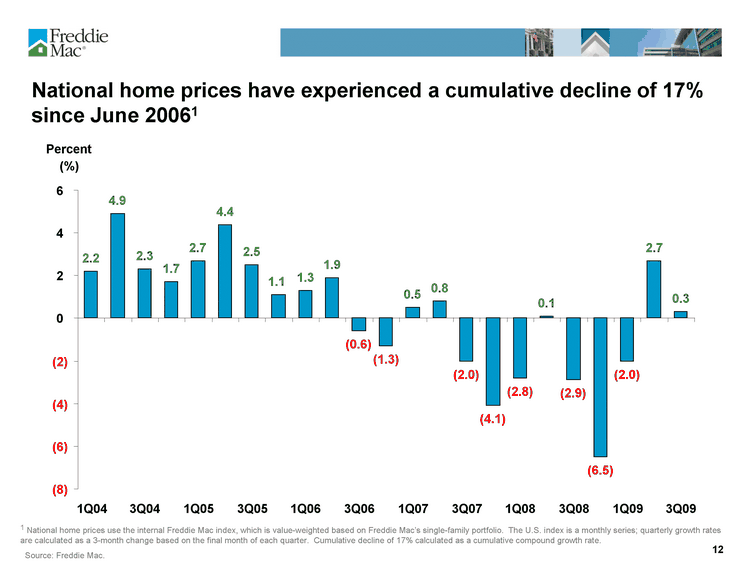
| National home prices have experienced a cumulative decline of 17% since June 20061 1 National home prices use the internal Freddie Mac index, which is value-weighted based on Freddie Mac's single-family portfolio. The U.S. index is a monthly series; quarterly growth rates are calculated as a 3-month change based on the final month of each quarter. Cumulative decline of 17% calculated as a cumulative compound growth rate. Source: Freddie Mac. Percent (%) (0.6) (1.3) (2.0) (4.1) (2.9) (6.5) (2.0) 0.1 (2.8) 0.3 2.7 1.1 0.5 0.8 1.3 4.9 2.2 2.3 1.7 2.7 4.4 2.5 1.9 (8) (6) (4) (2) 0 2 4 6 1Q04 3Q04 1Q05 3Q05 1Q06 3Q06 1Q07 3Q07 1Q08 3Q08 1Q09 3Q09 |
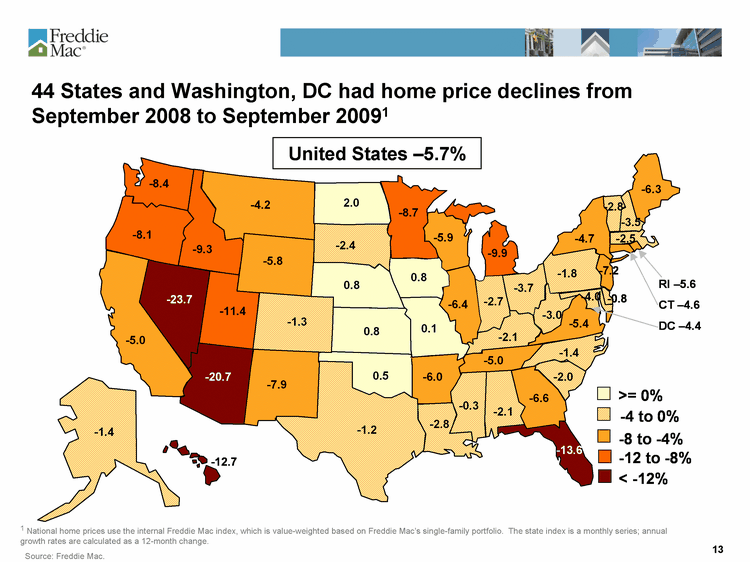
| 44 States and Washington, DC had home price declines from September 2008 to September 20091 1 National home prices use the internal Freddie Mac index, which is value-weighted based on Freddie Mac's single-family portfolio. The state index is a monthly series; annual growth rates are calculated as a 12-month change. Source: Freddie Mac. United States -5.7% |
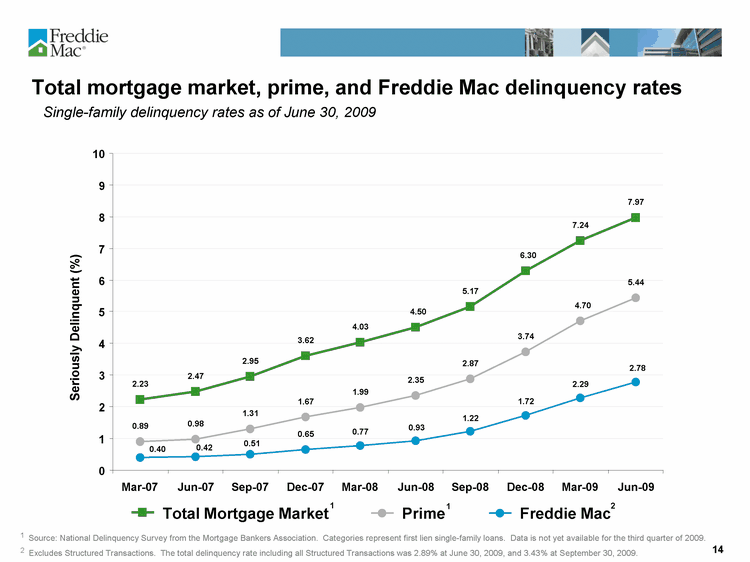
| Total mortgage market, prime, and Freddie Mac delinquency rates Single-family delinquency rates as of June 30, 2009 1 Source: National Delinquency Survey from the Mortgage Bankers Association. Categories represent first lien single-family loans. Data is not yet available for the third quarter of 2009. 2 Excludes Structured Transactions. The total delinquency rate including all Structured Transactions was 2.89% at June 30, 2009, and 3.43% at September 30, 2009. 2.23 2.47 2.95 3.62 4.03 4.50 5.17 6.30 7.24 7.97 0.89 0.98 1.31 1.67 1.99 2.35 2.87 3.74 4.70 5.44 0.51 0.65 0.77 0.93 1.22 1.72 2.29 2.78 0.42 0.40 0 1 2 3 4 5 6 7 8 9 10 Mar-07 Jun-07 Sep-07 Dec-07 Mar-08 Jun-08 Sep-08 Dec-08 Mar-09 Jun-09 Seriously Delinquent (%) Total Mortgage Market Prime Freddie Mac 1 2 1 |
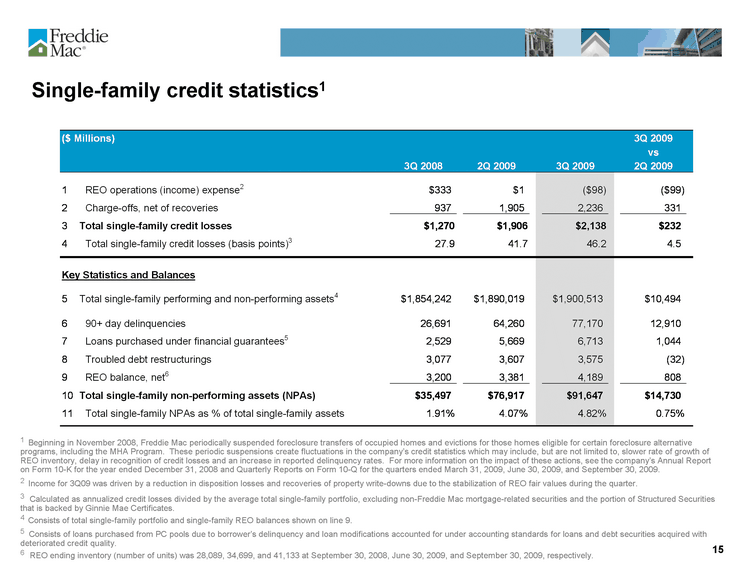
| Single-family credit statistics1 1 Beginning in November 2008, Freddie Mac periodically suspended foreclosure transfers of occupied homes and evictions for those homes eligible for certain foreclosure alternative programs, including the MHA Program. These periodic suspensions create fluctuations in the company's credit statistics which may include, but are not limited to, slower rate of growth of REO inventory, delay in recognition of credit losses and an increase in reported delinquency rates. For more information on the impact of these actions, see the company's Annual Report on Form 10-K for the year ended December 31, 2008 and Quarterly Reports on Form 10-Q for the quarters ended March 31, 2009, June 30, 2009, and September 30, 2009. 2 Income for 3Q09 was driven by a reduction in disposition losses and recoveries of property write-downs due to the stabilization of REO fair values during the quarter. 3 Calculated as annualized credit losses divided by the average total single-family portfolio, excluding non-Freddie Mac mortgage-related securities and the portion of Structured Securities that is backed by Ginnie Mae Certificates. 4 Consists of total single-family portfolio and single-family REO balances shown on line 9. 5 Consists of loans purchased from PC pools due to borrower's delinquency and loan modifications accounted for under accounting standards for loans and debt securities acquired with deteriorated credit quality. 6 REO ending inventory (number of units) was 28,089, 34,699, and 41,133 at September 30, 2008, June 30, 2009, and September 30, 2009, respectively. |
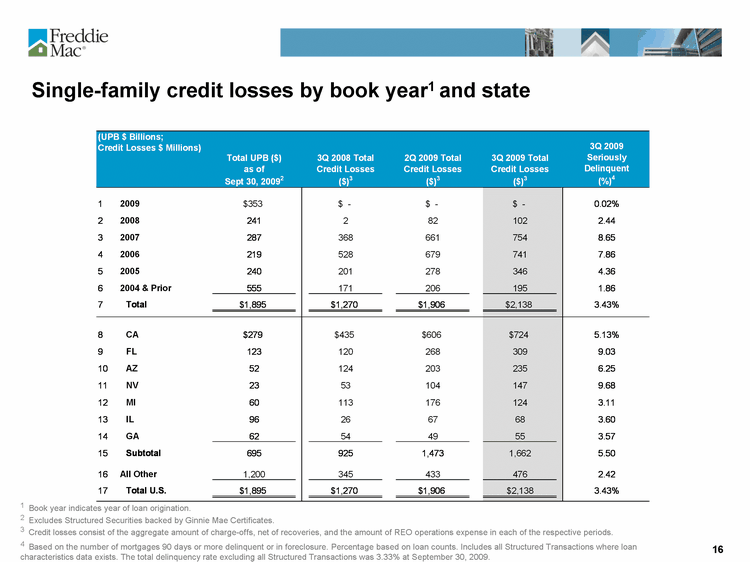
| Single-family credit losses by book year1 and state 1 Book year indicates year of loan origination. 2 Excludes Structured Securities backed by Ginnie Mae Certificates. 3 Credit losses consist of the aggregate amount of charge-offs, net of recoveries, and the amount of REO operations expense in each of the respective periods. 4 Based on the number of mortgages 90 days or more delinquent or in foreclosure. Percentage based on loan counts. Includes all Structured Transactions where loan characteristics data exists. The total delinquency rate excluding all Structured Transactions was 3.33% at September 30, 2009. |
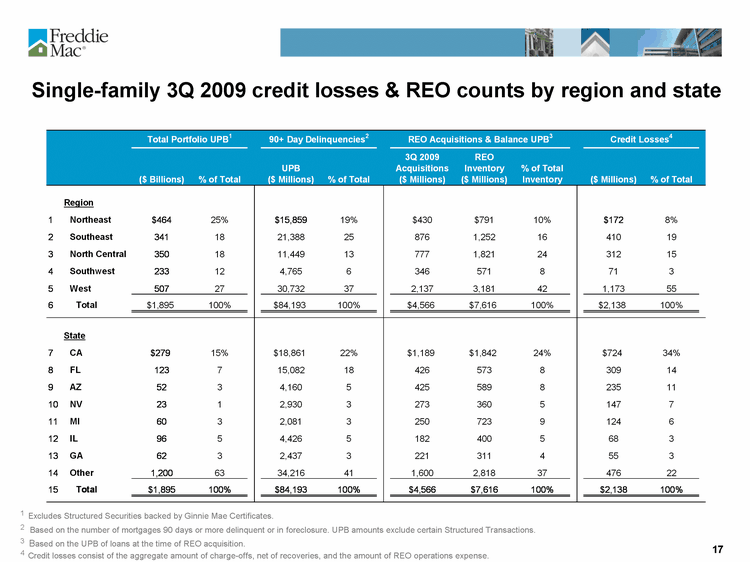
| 1 Excludes Structured Securities backed by Ginnie Mae Certificates. 2 Based on the number of mortgages 90 days or more delinquent or in foreclosure. UPB amounts exclude certain Structured Transactions. 3 Based on the UPB of loans at the time of REO acquisition. 4 Credit losses consist of the aggregate amount of charge-offs, net of recoveries, and the amount of REO operations expense. Single-family 3Q 2009 credit losses & REO counts by region and state |
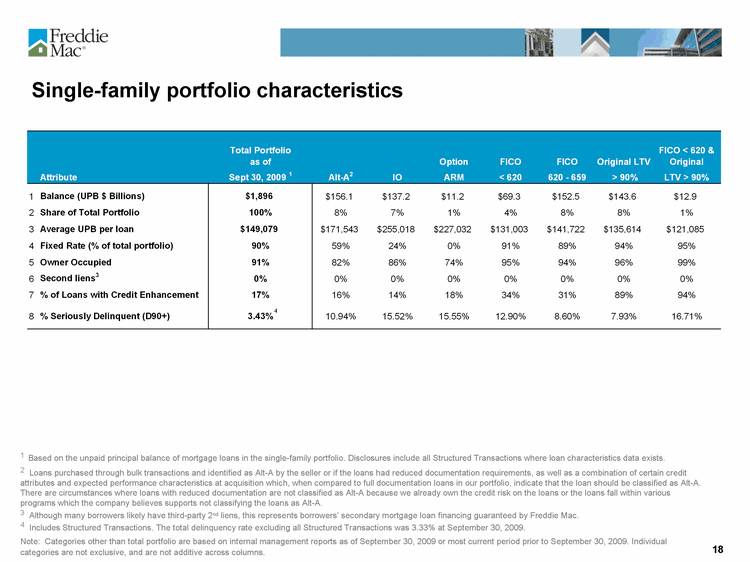
| Single-family portfolio characteristics 1 Based on the unpaid principal balance of mortgage loans in the single-family portfolio. Disclosures include all Structured Transactions where loan characteristics data exists. 2 Loans purchased through bulk transactions and identified as Alt-A by the seller or if the loans had reduced documentation requirements, as well as a combination of certain credit attributes and expected performance characteristics at acquisition which, when compared to full documentation loans in our portfolio, indicate that the loan should be classified as Alt-A. There are circumstances where loans with reduced documentation are not classified as Alt-A because we already own the credit risk on the loans or the loans fall within various programs which the company believes supports not classifying the loans as Alt-A. 3 Although many borrowers likely have third-party 2nd liens, this represents borrowers' secondary mortgage loan financing guaranteed by Freddie Mac. 4 Includes Structured Transactions. The total delinquency rate excluding all Structured Transactions was 3.33% at September 30, 2009. Note: Categories other than total portfolio are based on internal management reports as of September 30, 2009 or most current period prior to September 30, 2009. Individual categories are not exclusive, and are not additive across columns. 4 |
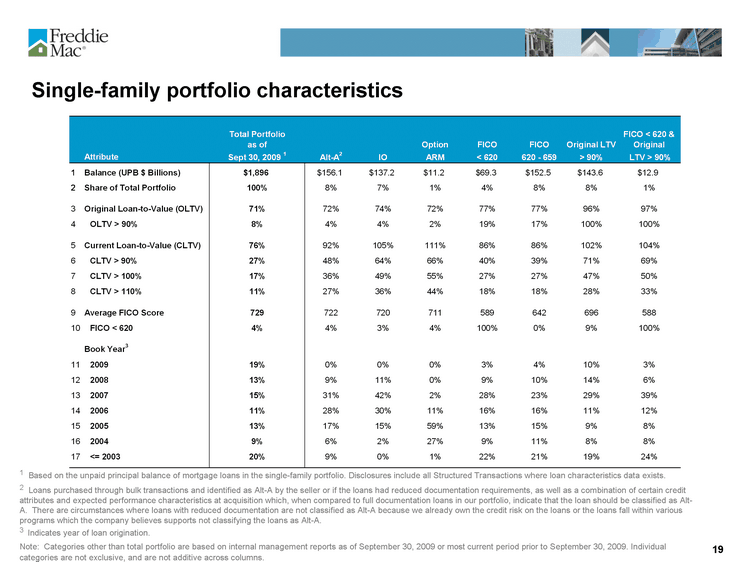
| Single-family portfolio characteristics 1 Based on the unpaid principal balance of mortgage loans in the single-family portfolio. Disclosures include all Structured Transactions where loan characteristics data exists. 2 Loans purchased through bulk transactions and identified as Alt-A by the seller or if the loans had reduced documentation requirements, as well as a combination of certain credit attributes and expected performance characteristics at acquisition which, when compared to full documentation loans in our portfolio, indicate that the loan should be classified as Alt- A. There are circumstances where loans with reduced documentation are not classified as Alt-A because we already own the credit risk on the loans or the loans fall within various programs which the company believes supports not classifying the loans as Alt-A. 3 Indicates year of loan origination. Note: Categories other than total portfolio are based on internal management reports as of September 30, 2009 or most current period prior to September 30, 2009. Individual categories are not exclusive, and are not additive across columns. |
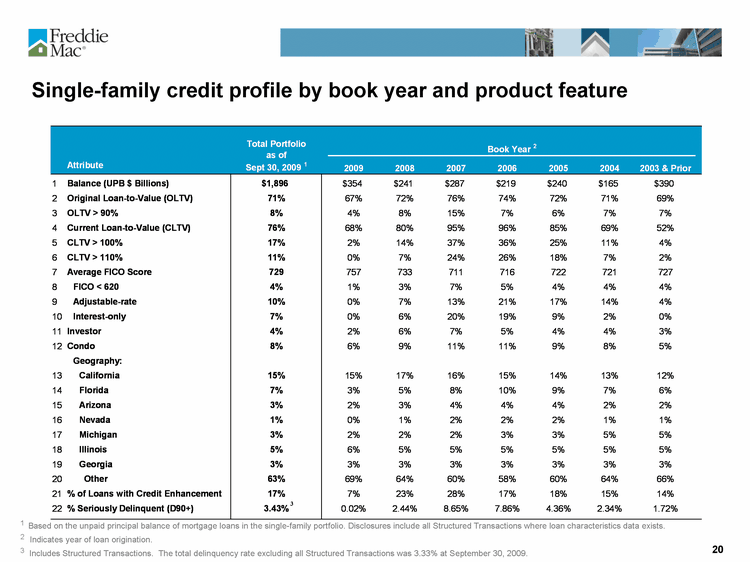
| Single-family credit profile by book year and product feature 1 Based on the unpaid principal balance of mortgage loans in the single-family portfolio. Disclosures include all Structured Transactions where loan characteristics data exists. 2 Indicates year of loan origination. 3 Includes Structured Transactions. The total delinquency rate excluding all Structured Transactions was 3.33% at September 30, 2009. 3 |
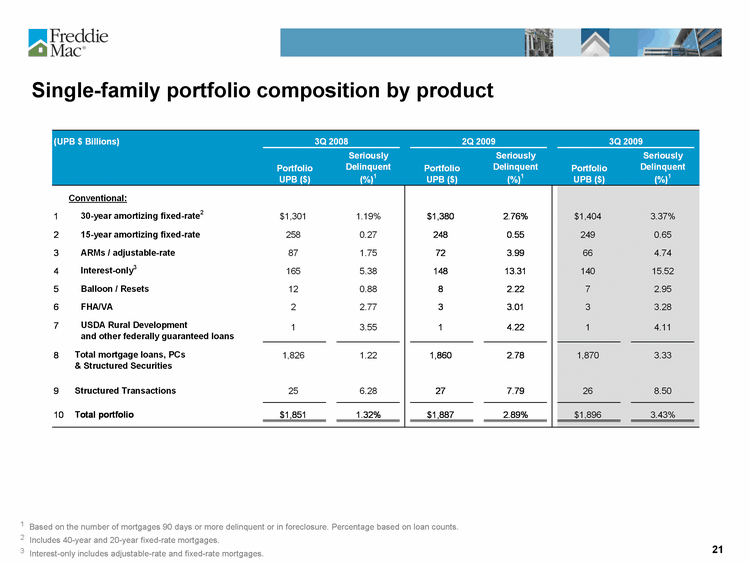
| Single-family portfolio composition by product 1 Based on the number of mortgages 90 days or more delinquent or in foreclosure. Percentage based on loan counts. 2 Includes 40-year and 20-year fixed-rate mortgages. 3 Interest-only includes adjustable-rate and fixed-rate mortgages. |
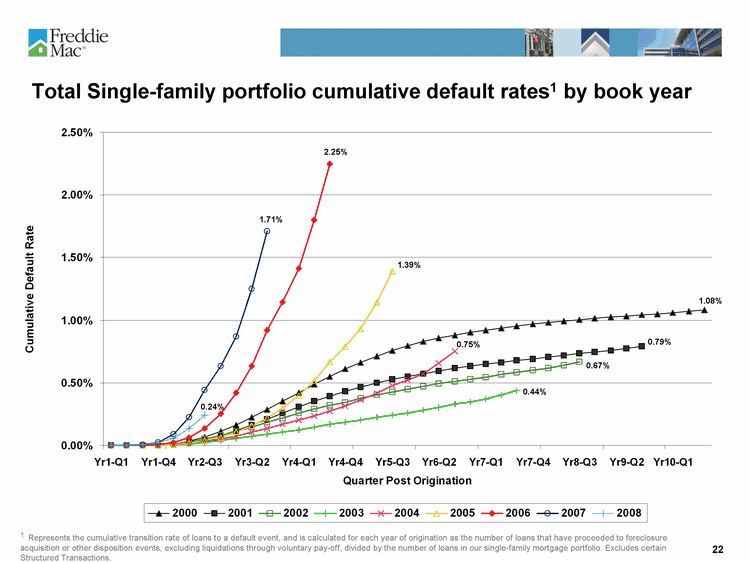
| Total Single-family portfolio cumulative default rates1 by book year 1 Represents the cumulative transition rate of loans to a default event, and is calculated for each year of origination as the number of loans that have proceeded to foreclosure acquisition or other disposition events, excluding liquidations through voluntary pay-off, divided by the number of loans in our single-family mortgage portfolio. Excludes certain Structured Transactions. 0.24% 1.71% 2.25% 1.39% 0.75% 0.44% 0.67% 0.79% 1.08% |

| Safe Harbor Statements Freddie Mac obligations Freddie Mac's securities are obligations of Freddie Mac only. The securities, including any interest or return of discount on the securities, are not guaranteed by and are not debts or obligations of the United States or any federal agency or instrumentality other than Freddie Mac. No offer or solicitation of securities This presentation includes information related to, or referenced in the offering documentation for, certain Freddie Mac securities, including offering circulars and related supplements and agreements. Freddie Mac securities may not be eligible for offer or sale in certain jurisdictions or to certain persons. This information is provided for your general information only, is current only as of its specified date and does not constitute an offer to sell or a solicitation of an offer to buy securities. The information does not constitute a sufficient basis for making a decision with respect to the purchase or sale of any security. All information regarding or relating to Freddie Mac securities is qualified in its entirety by the relevant offering circular and any related supplements. Investors should review the relevant offering circular and any related supplements before making a decision with respect to the purchase or sale of any security. In addition, before purchasing any security, please consult your legal and financial advisors for information about and analysis of the security, its risks and its suitability as an investment in your particular circumstances. Forward-looking statements Freddie Mac's presentations may contain forward-looking statements, which may include statements pertaining to the conservatorship and the company's current expectations and objectives for the MHA program and other efforts to assist the U.S. residential mortgage market, as well as the company's future business plans, liquidity, capital management, economic and market conditions and trends, market share, legislative and regulatory developments, implementation of new accounting standards, credit losses, internal control remediation efforts, and results of operations and financial condition on a GAAP, Segment Earnings and fair value basis. Management's expectations for the company's future necessarily involve a number of assumptions, judgments and estimates, and various factors, including changes in market conditions, liquidity, mortgage-to-debt option-adjusted spread, credit outlook, actions by FHFA, the Federal Reserve, and Treasury, and the impacts of legislation or regulations and new or amended accounting standards, could cause actual results to differ materially from these expectations. These assumptions, judgments, estimates and factors are discussed in the company's Annual Report on Form 10-K for the year ended December 31, 2008, Quarterly Reports on Form 10-Q for the quarters ended March 31, 2009, June 30, 2009 and September 30, 2009 and Current Reports on Form 8-K, which are available on the Investor Relations page of the company's Web site at www.FreddieMac.com/investors and the SEC's Web site at www.sec.gov. The company undertakes no obligation to update forward-looking statements it makes to reflect events or circumstances after the date of this press release or to reflect the occurrence of unanticipated events. |
