Attached files
| file | filename |
|---|---|
| 8-K - FORM 8-K - PDC ENERGY, INC. | pdc8k_20091105.htm |
| EX-99.1 - EX-99.1 - PDC ENERGY, INC. | pdcrelease2009_1105.htm |

NASDAQ:PETD
Petroleum
Development Corporation
2009
Third Quarter Teleconference
November 5,
2009
Richard
W. McCullough, Chairman & CEO
Gysle
R. Shellum, Chief Financial Officer
Barton
R. Brookman, SVP Exploration &
Production
Production
See
Slide 2 regarding Forward Looking Statements
2
The
following information contains forward-looking statements within the meaning of
the Private Securities Litigation Reform Act
of 1995. These forward-looking statements are based on Management’s current expectations and beliefs, as well as a number
of assumptions concerning future events.
of 1995. These forward-looking statements are based on Management’s current expectations and beliefs, as well as a number
of assumptions concerning future events.
These
statements are based on certain assumptions and analyses made by Management in
light of its experience and its
perception of historical trends, current conditions and expected future developments as well as other factors it believes are
appropriate in the circumstances. However, whether actual results and developments will conform with Management’s
expectations and predictions is subject to a number of risks and uncertainties, general economic, market or business
conditions; the opportunities (or lack thereof) that may be presented to and pursued by Petroleum Development Corporation;
actions by competitors; changes in laws or regulations; and other factors, many of which are beyond the control of Petroleum
Development Corporation.
You are
cautioned not to put undue reliance on such forward-looking statements because
actual results may vary materially
from those expressed or implied, as more fully discussed in our safe harbor statements found in our SEC filings, including,
without limitation, the discussion under the heading “Risk Factors” in the Company’s 2008 annual report on Form 10-K and in
subsequent Form 10-Qs. All forward-looking statements are based on information available to Management on this date
and Petroleum Development Corporation assumes no obligation to, and expressly disclaims any obligation to, update
or revise any forward looking statements, whether as a result of new information, future events or otherwise.
The SEC
permits oil and gas companies to disclose in their filings with the SEC only
proved reserves, which are reserve
estimates that geological and engineering data demonstrate with reasonable certainty to be recoverable in future years from
known reservoirs under existing economic and operating conditions. The Company uses in this presentation the terms
“probable” and “possible” reserves, which SEC guidelines prohibit in filings of U.S. registrants. Probable reserves are unproved
reserves that are more likely than not to be recoverable. Possible reserves are unproved reserves that are less likely to be
recoverable than probable reserves. Estimates of probable and possible reserves which may potentially be recoverable through
additional drilling or recovery techniques are by nature more uncertain than estimates of proved reserves and accordingly are
subject to substantially greater risk of not actually being realized by the Company. In addition, the Company’s reserves and
production forecasts and expectations for future periods are dependent upon many assumptions, including estimates of
production decline rates from existing wells and the undertaking and outcome of future drilling activity, which may be affected
by significant commodity price declines or drilling cost increases.
This
material also contains certain non-GAAP financial measures as defined under the
Securities and Exchange Commission
rules.
rules.
Disclaimer

See
Slide 2 regarding Forward Looking Statements
3
Rick
McCullough
Chairman & Chief
Executive Officer

See
Slide 2 regarding Forward Looking Statements
4
STRATEGIC
ASSESSMENT:
DEVELOPING STRATEGIES
DEVELOPING STRATEGIES
Scale
and Cost Control
• Control / reduce
CAPEX/OPEX through strategic negotiations
• Gain scale / mediate
cost sensitivity in basins which are highly
sensitive to commodity pricing (particularly Wattenberg)
sensitive to commodity pricing (particularly Wattenberg)
Alternative Capital
Sources
• Pursue joint
ventures in emerging Shale plays
• Position the Company
financially to capitalize on strategic
alternatives which could drive shareholder value creation
alternatives which could drive shareholder value creation
Financial
Focus
• Implement long-term
hedging strategy to mitigate risk and solidify
value preservation
value preservation
Diversify and
Increase Projects
• Continue to
monitor/assess acquisition and divestiture
opportunities, and enhance A&D capabilities
opportunities, and enhance A&D capabilities

See
Slide 2 regarding Forward Looking Statements
2009
Corporate Update
5
• Completed
Appalachian Joint Venture with Lime Rock Partners
• PDC Mountaineer, LLC
is the new JV company
• Mr. Dewey Gerdom
appointed Chief Executive Officer of the JV
• PDC received $45
million as return of capital at closing
• Lime Rock to
contribute total obligation of $113.5 million by early-to-mid 2011
• Equity Offering
Completed in August 2009
• 4.3 million shares
issued, for net proceeds of $48.5 million
• Equity provides
greater financial flexibility to pursue strategic objectives, and
provides a cushion against a downside commodity price scenario
provides a cushion against a downside commodity price scenario
• 83% of offering was
placed with 36 new institutional investors
• Extended Hedged
Position through 2013
• 70% - 80% of PDP
production hedged through 2013
• NYMEX swaps at $6.68
in 2011; swaps and collars in 2012 - 2013 with swaps
at $6.99 in 2012; $7.11 in 2013, and collars $6.00 - $8.50 range
at $6.99 in 2012; $7.11 in 2013, and collars $6.00 - $8.50 range
• Swapped oil at $81 -
$85 in 2010 - 2011, and added collars of $73-$104 range
through 2013
through 2013
See
Slide 2 regarding Forward Looking Statements
PDC
/ Lime Rock Joint Venture Overview
6
|
Summary:
|
PDC and Lime
Rock Partners (LRP) announced the formation of PDC
Mountaineer, LLC, to develop PDC’s Appalachian Marcellus Shale and Shallow Devonian assets |
|
Consideration:
|
PDC Appalachia
assets valued at approximately $158.5 million
|
|
Terms:
|
LRP funded $45
million as return of capital at closing. PDC
has an option to
take a second cash contribution of $11.5 million by year-end 2010 |
|
PDC
LRP
|
Contributes
$158.5 MM, withdraws $45 MM for net equity of $113.5 MM
Contributes
$45 MM, future
capital commitment of $68.5 MM equalizes equity
at $113.5 MM |
|
Operations:
|
Mr. Dewey
Gerdom has been appointed Chief Executive Officer of the JV. PDC
has designated approximately ninety of its employees to directly support the JV, which will be headquartered in Bridgeport, West Virginia |
|
AMI:
|
PDC and LRP to
form a limited Area of Mutual Interest to jointly develop
Marcellus acreage (existing and future) |
|
Governance:
|
JV Board will
have equal representation from PDC and
LRP
|

See
Slide 2 regarding Forward Looking Statements
• Marcellus shale is a
leading shale gas play with strong economics and production
growth profile
growth profile
• Accelerates
development of existing PDC acreage
• Provides capital to
capture new leasehold in Marcellus fairway
• Lime Rock Partners
brings substantial oil and gas expertise and history of successful
energy investments
energy investments
• PDC initial $45
million return of capital provides cash to pay down debt to offset
reduction in borrowing base at PDC
reduction in borrowing base at PDC
• Bank approval with
reduced borrowing base to $305 million without Appalachia assets;
• $45 million
distribution to PDC at closing; no net change in PDC corporate
liquidity
• PDC does not expect
the borrowing base to be adjusted in November redetermination
• PDC Mountaineer, LLC
to operate assets via service agreements with PDC
Joint
Venture Rationale
7

See
Slide 2 regarding Forward Looking Statements
Quarterly
Realized Hedge Price
8

See
Slide 2 regarding Forward Looking Statements
Corporate
Summary
9
• Third quarter 2009
results in-line with previous guidance
– Adjusted Net Loss
about break-even at ($2.8 MM)
– Adjusted Cash Flow
from Operations of $37.3 MM
• Hedging activity
continues to provide cash flow certainty
• PDC Team maintains
focus on operational enhancements and is
prepared to capitalize on market recovery as it unfolds
prepared to capitalize on market recovery as it unfolds
• Another good quarter
of cash flow per share and production
performance
performance
• Liquidity at
approximately $200 million as of October 31, 2009

See
Slide 2 regarding Forward Looking Statements
10
Bart
Brookman
Senior
V.P. Exploration & Production

See
Slide 2 regarding Forward Looking Statements
11
Core
Operating Regions
Q3 2009 Production Summary
Q3 2009 Production Summary
See
Slide 2 regarding Forward Looking Statements
Rocky
Mountains
2008
Production: 1.6
Bcfe
1st Q 2009
Production 0.3
Bcfe
2nd Q 2009
Production 0.4
Bcfe
3rd Q 2009
Production 0.4
Bcfe
Michigan
Basin
2008
Production: 3.9
Bcfe
1st Q 2009
Production 1.0
Bcfe
2nd Q 2009
Production 1.0
Bcfe
3rd Q 2009
Production 1.0
Bcfe
Appalachian
Basin
2008
Production: 33.2
Bcfe
1st Q 2009
Production 9.9
Bcfe
2nd Q 2009
Production 9.8
Bcfe
3rd Q 2009
Production 9.5
Bcfe
Q3
2009 Production
10.9
Bcfe
• 7.5%
increase over 3rd
Quarter 2008
Quarter 2008
• 117
MMcfe average daily
production rate during Q3 2009
production rate during Q3 2009
Note:
Does not include impact of Marcellus Joint Venture.
See
Slide 2 regarding Forward Looking Statements
12
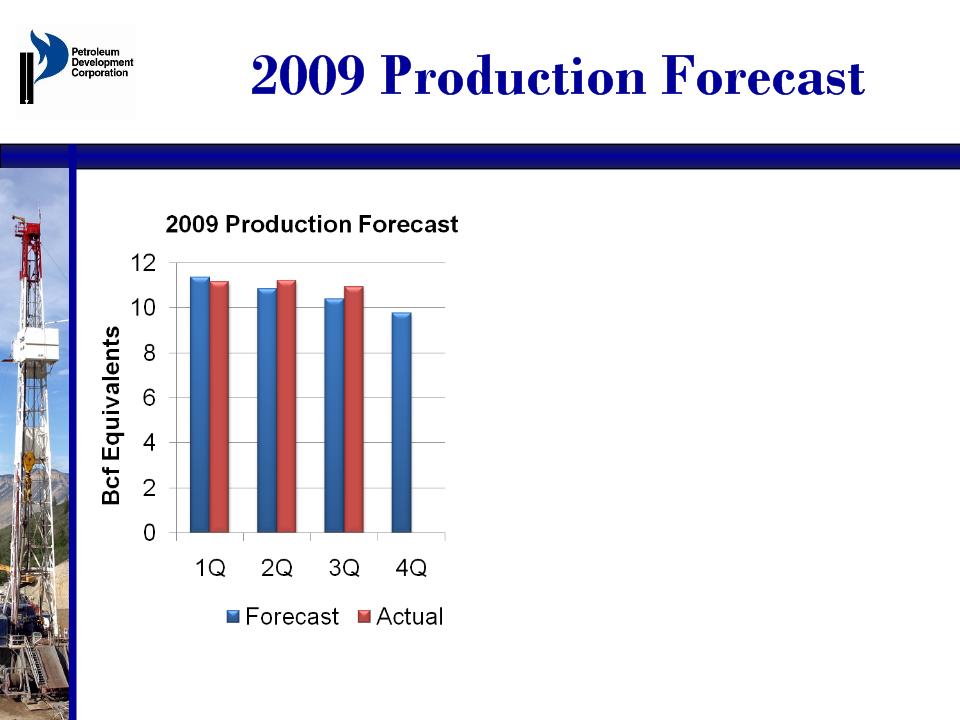
• Estimated 2009
production of
43.1 Bcfe
43.1 Bcfe
• Q4 production
forecast adjusted
for recent Marcellus JV
for recent Marcellus JV
• Actual production
slightly above
forecast
forecast
• Wattenberg
production and
completions continue to exceed
expectations
completions continue to exceed
expectations
• Strong production
optimization
efforts underway
efforts underway
See
Slide 2 regarding Forward Looking Statements
13
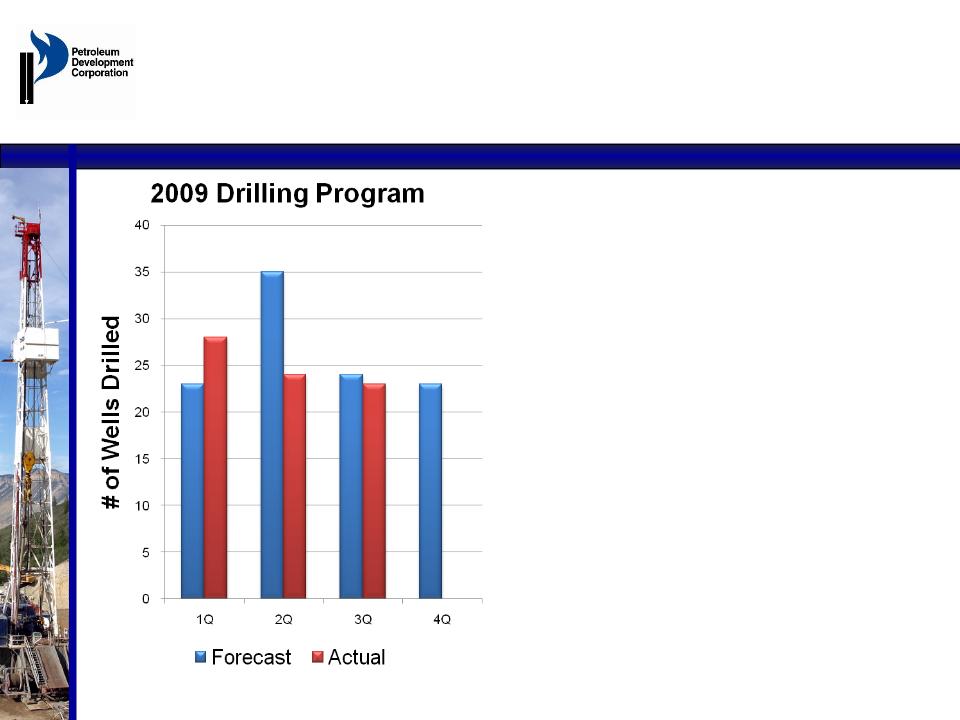
2009
Drilling Activity
• Plan 103 gross wells
in 2009
• 23 gross wells in
Q3
• 83% of 2009 wells
are planned
for the Wattenberg field
for the Wattenberg field
• Seven vertical
Marcellus wells
drilled to date
drilled to date

See
Slide 2 regarding Forward Looking Statements
14
2009
CAPEX
($ in millions)
($ in millions)
|
|
Actual
Nine Months Ended September 30, 2009 |
Estimated
Three Months Ended December
31, 2009
|
Estimated
Total 2009 |
|
Net
Development Capital
|
$66
|
$13
|
$79
|
|
Exploration,
Land, G&G
|
10
|
3
|
13
|
|
Acquisitions
|
6
|
1
|
7
|
|
Miscellaneous
Capital
|
8
|
1
|
9
|
|
Total
Net Capital
|
$90
|
$18
|
$108
|

See
Slide 2 regarding Forward Looking Statements
Lease
Operating Expenses
15
|
Lifting
Cost Improvements
(per Mcfe) |
||||
|
|
Twelve
Months
Ended December 31,
2008
|
Three Months
Ended
September 30, 2009 |
Nine Months
Ended
September 30, 2009 |
Year-to-Date
% Variance 2008 vs. 2009 |
|
Direct Well
Expenses
|
$0.84
|
$0.55
|
$0.55
|
-35%
|
|
Indirect Well
Expenses
|
$0.23
|
$0.24
|
$0.24
|
4%
|
|
Lifting
Cost ($ per Mcfe)
|
$1.07
|
$0.79
|
$0.79
|
-26%
|
|
|
|
|
|
|
|
Production
Taxes
|
$0.48
|
$0.24
|
$0.22
|
-54%
|
|
Well
Operations Segment
|
$0.15
|
$0.17
|
$0.16
|
7%
|
|
Overhead and
Other
Production
Expenses
|
$0.32
|
$0.19
|
$0.21
|
-34%
|
|
Oil
& Gas Production and
Well
Operations Costs
|
$2.02
|
$1.39
|
$1.37
|
-32%
|

See
Slide 2 regarding Forward Looking Statements
Q3
2009 Operating Highlights
• Marcellus
Update
– 55,000 net
acres
– Seven vertical wells
drilled YTD
– Completed ten square
mile 3D seismic shoot in West Virginia
– Engineering near
completion on 1st
horizontal Marcellus well
• Scheduled Q1
2010
– Recent formation of
Marcellus JV
• Operating one
drilling rig in Wattenberg
• Continued focus on
capital and LOE reductions
• Production slightly
above expectations
16

See
Slide 2 regarding Forward Looking Statements
17
Gysle
Shellum
Chief
Financial Officer
See
Slide 2 regarding Forward Looking Statements
18
Q3
2009 Highlights
• Realized hedging
gains from production of $23.2 MM
for Q3 2009
for Q3 2009
• Key financial
metrics (comparison to
Second Quarter 2009):
– Average realized
prices (including realized gains/losses on
derivatives) per Mcfe were $6.02 in Q3 2009, a 3% increase
from $5.87 per Mcfe in Q2 2009
derivatives) per Mcfe were $6.02 in Q3 2009, a 3% increase
from $5.87 per Mcfe in Q2 2009
– Average Lifting
Costs per Mcfe increased 23% to $0.79 in
Q3 2009 from $0.64 in Q2 2009(1), however for nine
months ended 9/30/09 costs have decreased approximately
26%
Q3 2009 from $0.64 in Q2 2009(1), however for nine
months ended 9/30/09 costs have decreased approximately
26%
(1) The Q2 2009 average
lifting cost includes a benefit for the reimbursement of costs incurred in Q1
2009.
(2) See appendix for
reconciliation to GAAP.
See
Slide 2 regarding Forward Looking Statements
19
Summary
Financial Results
($ in millions, except for per share data)
($ in millions, except for per share data)
|
|
Three
Months Ended
September
30,
|
Nine
Months Ended
September
30,
|
||
|
|
2009
|
2008
|
2009
|
2008
|
|
O&G
Revenues
|
$44.0
|
$99.4
|
$125.3
|
$265.6
|
|
O&G
Production & Well Operating Costs
|
$15.2
|
$22.6
|
$45.6
|
$62.1
|
|
O&G
Operating Margins(1)
|
$28.8
|
$76.8
|
$79.7
|
$203.5
|
|
Net Income
(Loss)
|
($24.5)
|
$126.9
|
($63.3)
|
$72.3
|
|
Earnings
(Loss) per Diluted Share
|
($1.44)
|
$8.55
|
($4.07)
|
$4.86
|
|
Adjusted Net
Income (Loss)(2)
|
($2.8)
|
$20.8
|
($2.4)
|
$46.6
|
|
Adjusted Cash
Flow from Operations(2)
|
$37.3
|
$59.1
|
$114.7
|
$158.7
|
|
Adjusted Cash
Flow from Operations (per
share)
(2)
|
$2.20
|
$3.98
|
$7.39
|
$10.68
|
|
DD&A
|
$32.3
|
$28.6
|
$100.5
|
$71.9
|
|
G&A
|
$9.6
|
$8.1
|
$36.5
|
$27.2
|
(1) O&G operating
margins is defined as O&G sales less O&G production and well operations
costs.
(2) See appendix for
reconciliation to GAAP.
See
Slide 2 regarding Forward Looking Statements
Note:
The revolver due in 2012 has a borrowing base size of $305 million.
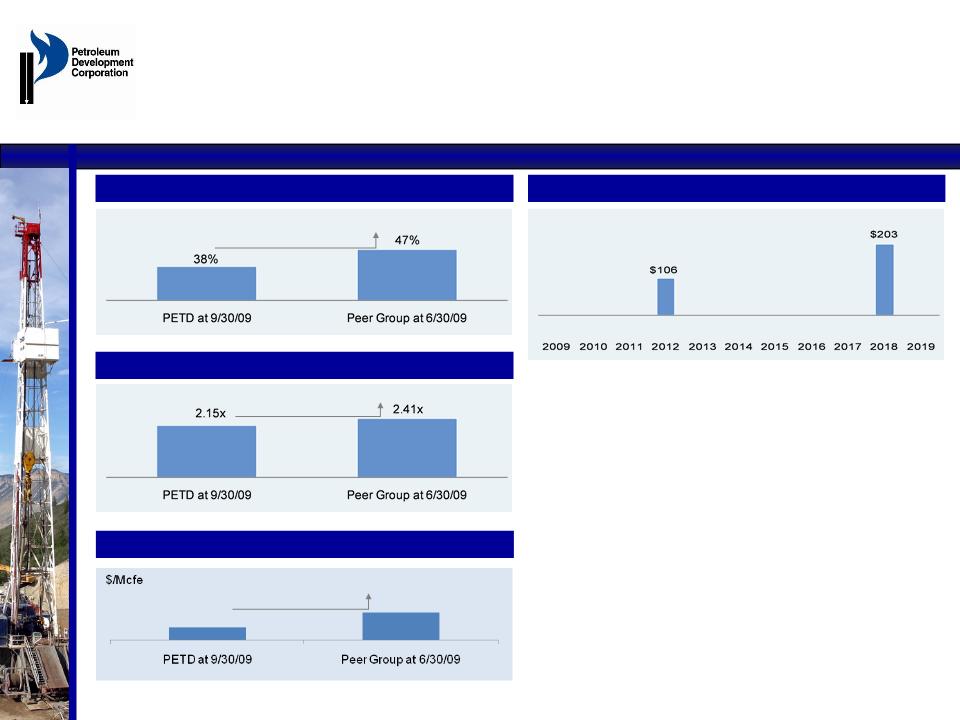
Relative
Balance Sheet Strength (1)
qPDC’s leverage and
coverage measures
compare favorably to its peer group
compare favorably to its peer group
qPDC’s leverage and
coverage measures
compare favorably to “BB” credits.
compare favorably to “BB” credits.
qPDC is a ‘B’ credit
due to its smaller size
and scale
and scale
qMaturity schedule
reflects:
q Mitigation of
liquidity risk
q Diversification of
funding sources
Debt/Book
Capitalization
Debt/Proved
Reserves
Maturity
Profile
Debt/LTM
EBITDA
20
Revolver
Senior
Notes
In
$millions
Source:
EnerCom, June 2009
PDC
Peer Group: BBG, BRY, COG, GDP, KWK, PLLL, PVA, ROSE, WLL
20
$0.41
$0.88
(1)
On 10/29/09 the borrowing base was reduced from $350 MM to $305 MM as a
result of the JV. Debt balance is pro-forma to include $45 MM loan repayment
due to JV distribution.
result of the JV. Debt balance is pro-forma to include $45 MM loan repayment
due to JV distribution.
See
Slide 2 regarding Forward Looking Statements
21
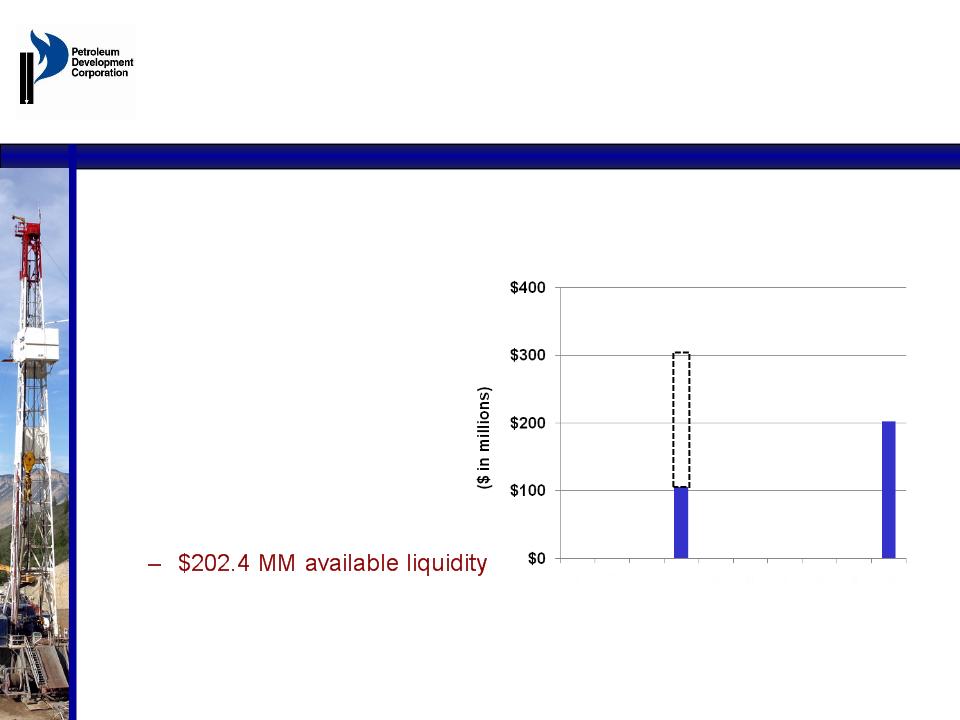
• $305 million
revolver matures
May 22, 2012 (1)
May 22, 2012 (1)
• Maturity schedule
reflects:
– Mitigation of
liquidity risk
– Diversification of
funding
sources
sources
• As of September 30,
2009:
– $151 MM drawn
balance
– $18.7 MM undrawn
LC
– $22.1 MM cash
balance
• November 2009
borrowing
base redetermination
base redetermination
Debt
Maturity Schedule
(as of September 30, 2009)
(as of September 30, 2009)
2009
2010
2011
2012
2013
2014
2015
2016
2017
2018
$106
$203
$305
(1)
On 10/29/09 the borrowing base was reduced from $350 MM to $305 MM as a
result of the JV. Debt balance is pro-forma to include $45 MM loan repayment
due to JV distribution.
result of the JV. Debt balance is pro-forma to include $45 MM loan repayment
due to JV distribution.
See
Slide 2 regarding Forward Looking Statements
22
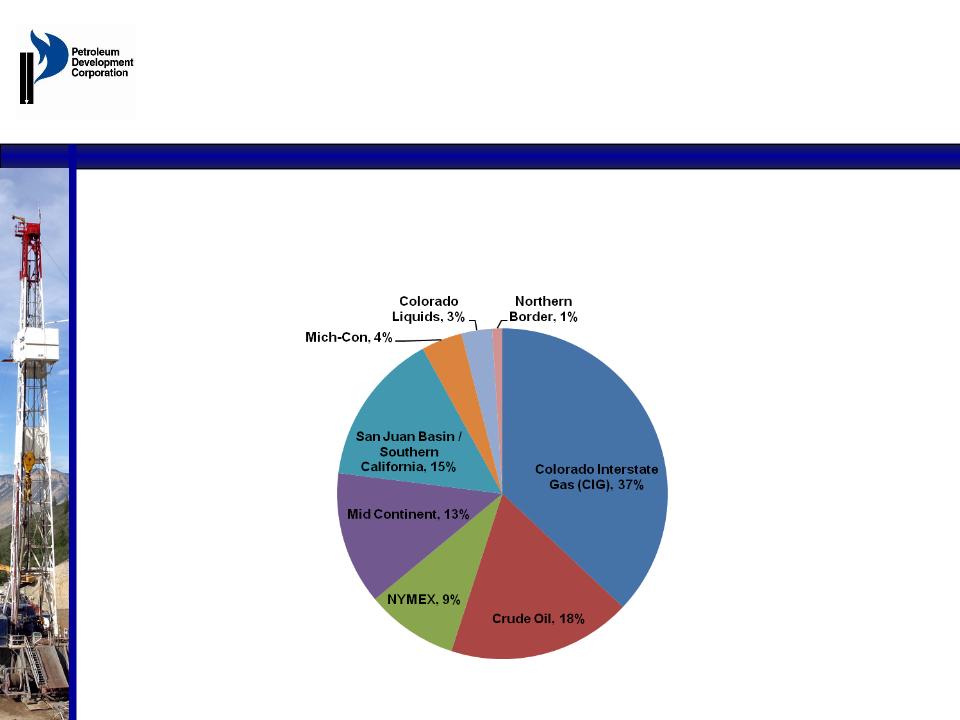
Energy
Market Exposure
See
Slide 2 regarding Forward Looking Statements
Percentage
of Mcfe Sold by Market
(for Three Months Ended September 30, 2009)
(for Three Months Ended September 30, 2009)
See
Slide 2 regarding Forward Looking Statements
Oil
and Gas Hedges
in Place as of October 27, 2009
in Place as of October 27, 2009
2009
2010
2011
Weighted Average
Hedge Price (Mcfe)(1)
With
Floors
$8.95
$7.84
$6.85
With
Ceilings
$10.79
$8.77
$7.74
% of
Forecasted Production(1)
81%
79%
78%
Weighted Avg Forward
Price(2)
$5.53
$6.63
$7.15
Weighted Avg Price
of Forecasted
Production(3)
Production(3)
$8.32
$7.59
$6.91
Weighted Avg Price
of Forecasted
Production
Production
Assuming 15%
increase in Production
$7.95
N/A
N/A
(1) Based
on 9/30/09 PDP
(2) Based
on forward curves as of 9/30/2009
(3) Blended
price for forecasted production at hedged and at forward prices
23

See
Slide 2 regarding Forward Looking Statements
Q1
Q2
Q3
Q4
24
Adjusted
Cash Flow
from Operations
from Operations
• Adjusted cash flow
from operations is defined as cash flow
from operations before working capital changes
from operations before working capital changes
Note:
See appendix for reconciliation to GAAP.
$200.1
Q2
Q3
$37.3
$39.8
2009
Guidance Range:
$131
MM - $145 MM

See
Slide 2 regarding Forward Looking Statements
25
A
P P E N D I X
2009
Financial Results

See
Slide 2 regarding Forward Looking Statements
26
Adjusted
Cash Flow Reconciliation
($ in millions)
($ in millions)
|
|
Three
Months Ended
September 30, |
Nine
Months Ended
September 30, |
||
|
|
2009
|
2008
|
2009
|
2008
|
|
Net Cash
provided by
Operating Activities |
$39.3
|
$36.1
|
$100.0
|
$103.8
|
|
Changes in
Assets & Liabilities
Related to Operations |
(2.0)
|
23.0
|
14.7
|
54.9
|
|
Adjusted Cash
Flow from
Operations |
$37.3
|
$59.1
|
$114.7
|
$158.7
|

See
Slide 2 regarding Forward Looking Statements
27
Adjusted
Net Income Reconciliation
($ in millions)
($ in millions)
|
|
Three
Months Ended
September 30, |
Nine
Months Ended
September
30,
|
||
|
|
2009
|
2008
|
2009
|
2008
|
|
Net income
loss
|
($24.5)
|
$126.9
|
($63.3)
|
$72.3
|
|
Unrealized
derivative loss (1)
|
35.0
|
(171.0)
|
95.7
|
(45.4)
|
|
Tax
effect
|
(13.3)
|
65.1
|
(37.4)
|
15.7
|
|
Other
|
-
|
(0.2)
|
2.6
|
4.0
|
|
Adjusted net
income (loss)
|
($2.8)
|
$20.8
|
($2.4)
|
$46.6
|
(1) Includes natural gas
marketing activities.
NASDAQ:PETD
Petroleum
Development Corporation
2009
Third Quarter Teleconference
November 5,
2009