Attached files
| file | filename |
|---|---|
| 8-K - 8-K - Agiliti Health, Inc. | a09-32723_18k.htm |
Exhibit 99.1
|
|
November 5, 2009 Imperial Capital Global Opportunities Conference |
|
|
2 Safe Harbor Statement under the Private Securities Litigation Reform Act of 1995: Universal Hospital Services, Inc. believes statements in this presentation looking forward in time involve risks and uncertainties based on management’s current views and assumptions. Actual events may differ materially. Please refer to the cautionary statement regarding forward-looking statements and risk factors that appear in the Company’s Annual Report on Form 10-K for the year ended December 31, 2008, and other filings with the SEC, which can be accessed at www.UHS.com under “Financials.” This presentation contains non-GAAP measures as defined by SEC rules. Reconciliations of these measures to the most directly comparable GAAP measures are contained in the appendix. Forward Looking Statements |
|
|
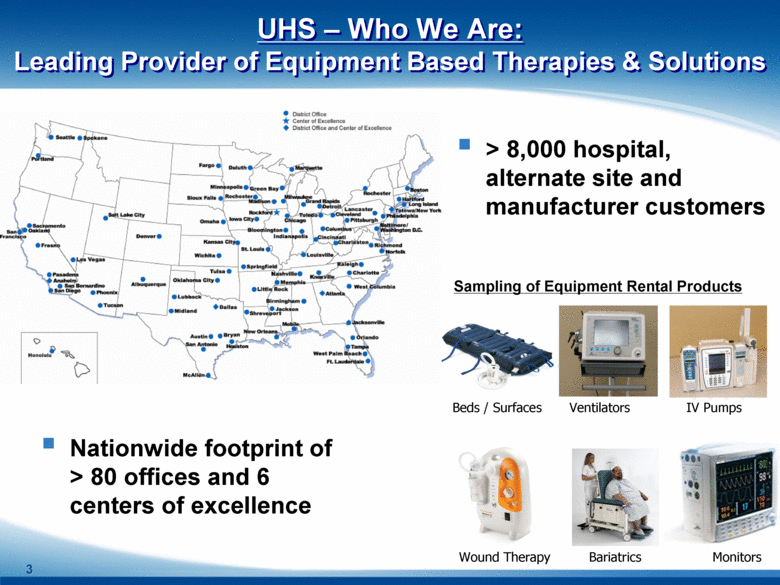
3 Monitors Bariatrics Ventilators IV Pumps Sampling of Equipment Rental Products Beds / Surfaces Wound Therapy > 8,000 hospital, alternate site and manufacturer customers Nationwide footprint of > 80 offices and 6 centers of excellence UHS – Who We Are: Leading Provider of Equipment Based Therapies & Solutions |
|
|
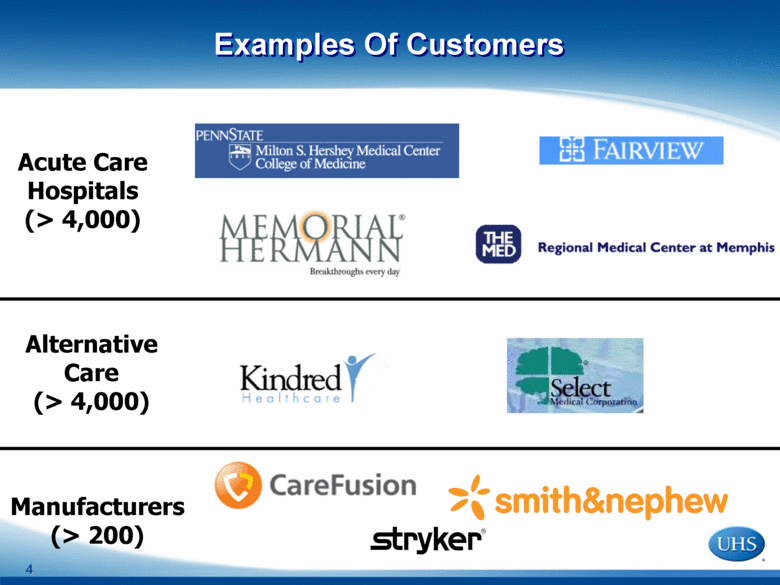
4 Examples Of Customers Acute Care Hospitals (> 4,000) Alternative Care (> 4,000) Manufacturers (> 200) |
|
|
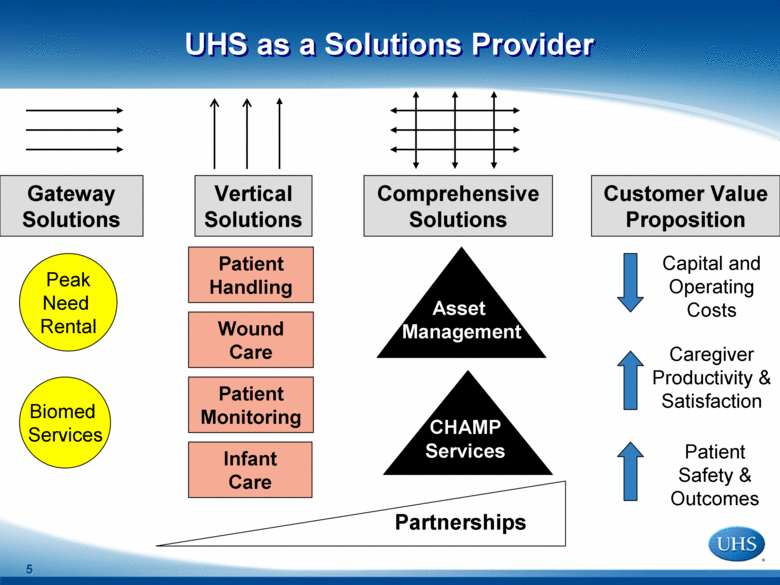
5 UHS as a Solutions Provider Peak Need Rental Biomed Services Gateway Solutions Comprehensive Solutions Vertical Solutions Patient Handling Wound Care Asset Management CHAMP Services Capital and Operating Costs Patient Safety & Outcomes Caregiver Productivity & Satisfaction Customer Value Proposition Partnerships Infant Care Patient Monitoring |
|
|
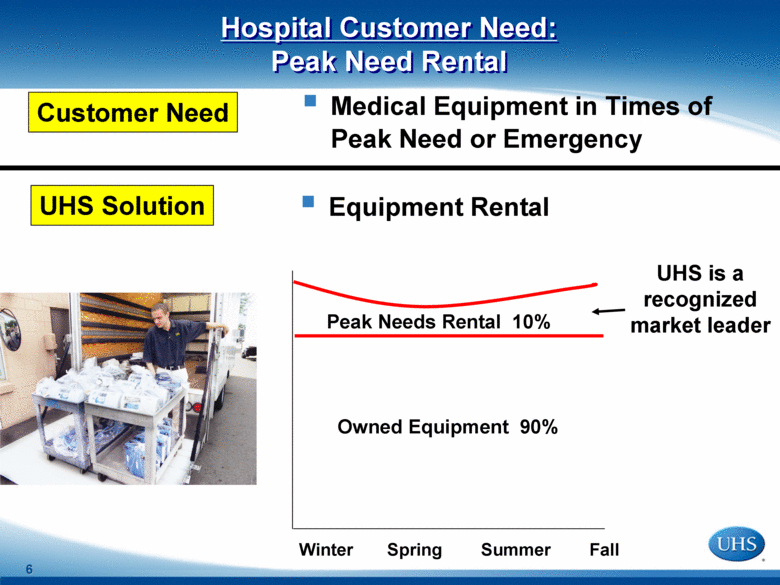
6 Equipment Rental Medical Equipment in Times of Peak Need or Emergency Customer Need UHS Solution Peak Needs Rental 10% Owned Equipment 90% Winter Spring Summer Fall UHS is a recognized market leader Hospital Customer Need: Peak Need Rental |
|
|
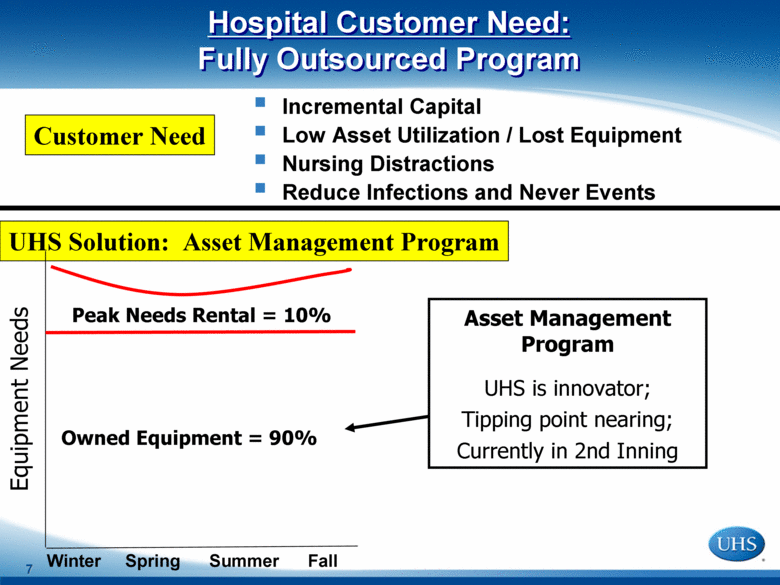
7 Hospital Customer Need: Fully Outsourced Program Incremental Capital Low Asset Utilization / Lost Equipment Nursing Distractions Reduce Infections and Never Events Customer Need UHS Solution: Asset Management Program Peak Needs Rental = 10% Owned Equipment = 90% Equipment Needs Asset Management Program UHS is innovator; Tipping point nearing; Currently in 2nd Inning Winter Spring Summer Fall |
|
|
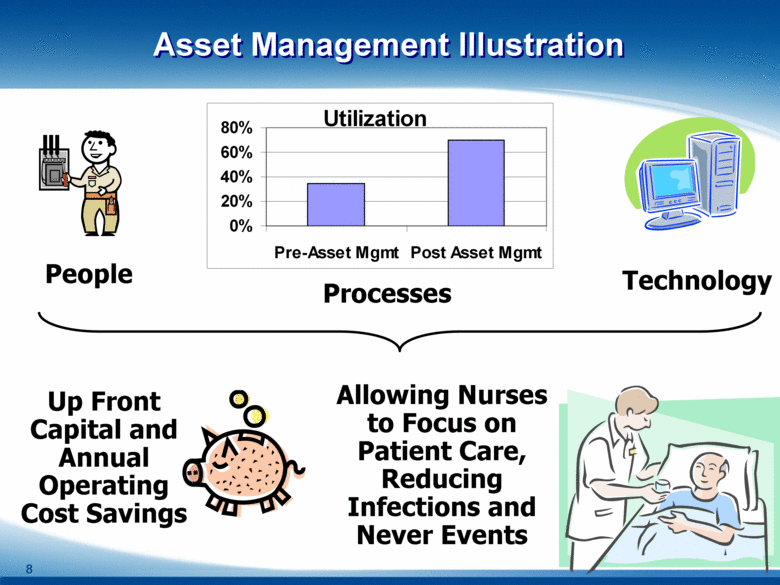
8 People 0% 20% 40% 60% 80% Pre-Asset Mgmt Post Asset Mgmt Utilization Technology Processes Up Front Capital and Annual Operating Cost Savings Allowing Nurses to Focus on Patient Care, Reducing Infections and Never Events Asset Management Illustration |
|
|
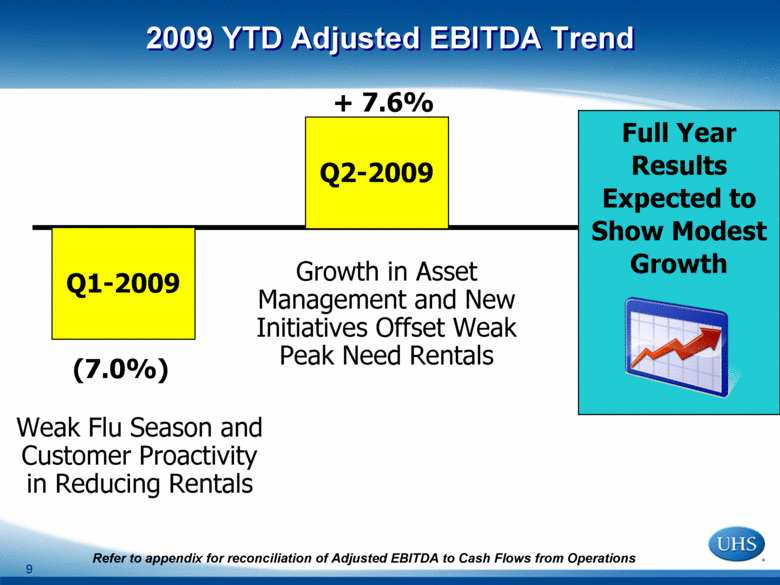
9 Refer to appendix for reconciliation of Adjusted EBITDA to Cash Flows from Operations 2009 YTD Adjusted EBITDA Trend Q1-2009 (7.0%) Q2-2009 Weak Flu Season and Customer Proactivity in Reducing Rentals Growth in Asset Management and New Initiatives Offset Weak Peak Need Rentals + 7.6% Full Year Results Expected to Show Modest Growth |
|
|
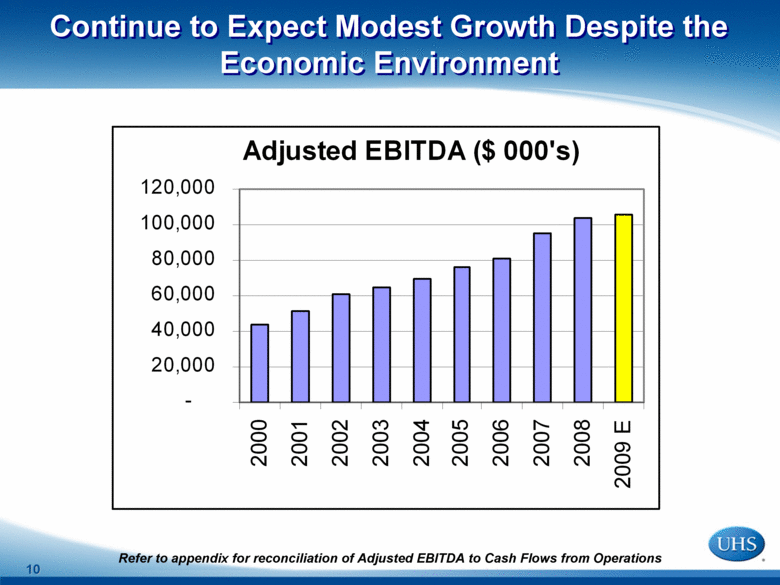
10 Refer to appendix for reconciliation of Adjusted EBITDA to Cash Flows from Operations Adjusted EBITDA ($ 000's) - 20,000 40,000 60,000 80,000 100,000 120,000 2000 2001 2002 2003 2004 2005 2006 2007 2008 2009 E Continue to Expect Modest Growth Despite the Economic Environment |
|
|
11 EBITDA Reconciliation: Q2 2008 & 2009 EBITDA Reconciliation: 1998 – LTM Q2 2009 Appendix |
|
|
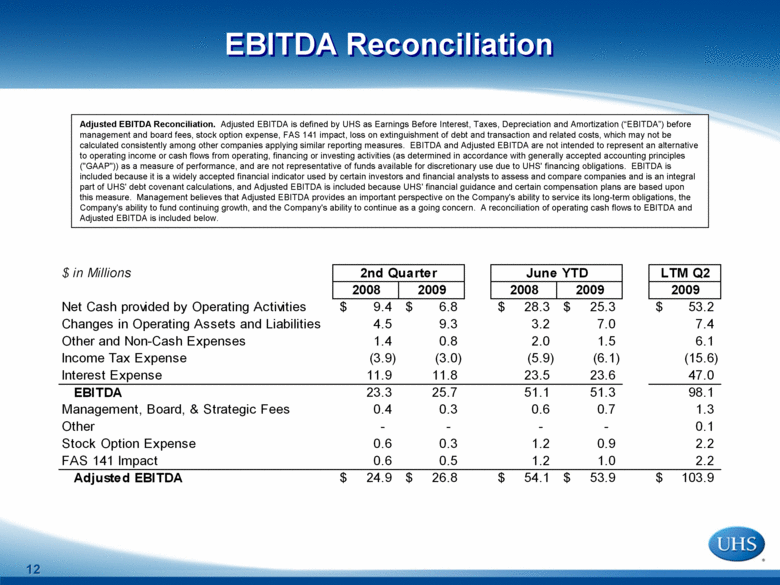
12 Adjusted EBITDA Reconciliation. Adjusted EBITDA is defined by UHS as Earnings Before Interest, Taxes, Depreciation and Amortization (“EBITDA”) before management and board fees, stock option expense, FAS 141 impact, loss on extinguishment of debt and transaction and related costs, which may not be calculated consistently among other companies applying similar reporting measures. EBITDA and Adjusted EBITDA are not intended to represent an alternative to operating income or cash flows from operating, financing or investing activities ( as determined in accordance with generally accepted accounting principles ("GAAP")) as a measure of performance, and are not representative of funds available for discretionary use due to UHS' financing obligations. EBITDA is included because it is a widely accepted financial indicator used by certain investors and financial analysts to assess and compare companies and is an integral part of UHS' debt covenant calculations, and Adjusted EBITDA is included because UHS' financial guidance and certain compensation plans are based upon this measure. Management believes that Adjusted EBITDA provides an important perspective on the Company's ability to service its long-term obligations, the Company's ability to fund continuing growth, and the Company's ability to continue as a going concern. A reconciliation of operating cash flows to EBITDA and Adjusted EBITDA is included below. $ in Millions 2nd Quarter June YTD LTM Q2 2008 2009 2008 2009 2009 Net Cash provided by Operating Activities 9.4 $ 6.8 $ 28.3 $ 25.3 $ 53.2 $ Changes in Operating Assets and Liabilities 4.5 9.3 3.2 7.0 7.4 Other and Non-Cash Expenses 1.4 0.8 2.0 1.5 6.1 Income Tax Expense (3.9) (3.0) (5.9) (6.1) (15.6) Interest Expense 11.9 11.8 23.5 23.6 47.0 EBITDA 23.3 25.7 51.1 51.3 98.1 Management, Board, & Strategic Fees 0.4 0.3 0.6 0.7 1.3 Other - - - - 0.1 Stock Option Expense 0.6 0.3 1.2 0.9 2.2 FAS 141 Impact 0.6 0.5 1.2 1.0 2.2 Adjusted EBITDA 24.9 $ 26.8 $ 54.1 $ 53.9 $ 103.9 $ EBITDA Reconciliation |
|
|
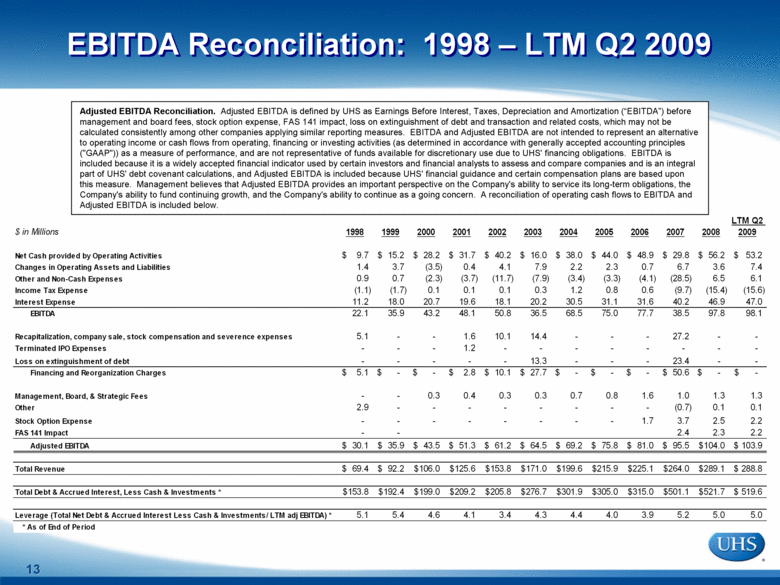
13 Adjusted EBITDA Reconciliation. Adjusted EBITDA is defined by UHS as Earnings Before Interest, Taxes, Depreciation and Amortization (“EBITDA”) before management and board fees, stock option expense, FAS 141 impact, loss on extinguishment of debt and transaction and related costs, which may not be calculated consistently among other companies applying similar reporting measures. EBITDA and Adjusted EBITDA are not intended to represent an alternative to operating income or cash flows from operating, financing or investing activities ( as determined in accordance with generally accepted accounting principles ("GAAP")) as a measure of performance, and are not representative of funds available for discretionary use due to UHS' financing obligations. EBITDA is included because it is a widely accepted financial indicator used by certain investors and financial analysts to assess and compare companies and is an integral part of UHS' debt covenant calculations, and Adjusted EBITDA is included because UHS' financial guidance and certain compensation plans are based upon this measure. Management believes that Adjusted EBITDA provides an important perspective on the Company's ability to service its long-term obligations, the Company's ability to fund continuing growth, and the Company's ability to continue as a going concern. A reconciliation of operating cash flows to EBITDA and Adjusted EBITDA is included below. $ in Millions 1998 1999 2000 2001 2002 2003 2004 2005 2006 2007 2008 LTM Q2 2009 Net Cash provided by Operating Activities 9.7 $ 15.2 $ 28.2 $ 31.7 $ 40.2 $ 16.0 $ 38.0 $ 44.0 $ 48.9 $ 29.8 $ 56.2 $ 53.2 $ Changes in Operating Assets and Liabilities 1.4 3.7 (3.5) 0.4 4.1 7.9 2.2 2.3 0.7 6.7 3.6 7.4 Other and Non-Cash Expenses 0.9 0.7 (2.3) (3.7) (11.7) (7.9) (3.4) (3.3) (4.1) (28.5) 6.5 6.1 Income Tax Expense (1.1) (1.7) 0.1 0.1 0.1 0.3 1.2 0.8 0.6 (9.7) (15.4) (15.6) Interest Expense 11.2 18.0 20.7 19.6 18.1 20.2 30.5 31.1 31.6 40.2 46.9 47.0 EBITDA 22.1 35.9 43.2 48.1 50.8 36.5 68.5 75.0 77.7 38.5 97.8 98.1 Recapitalization, company sale , stock compensation and severence expenses 5.1 - - 1.6 10.1 14.4 - - - 27.2 - - Terminated IPO Expenses - - - 1.2 - - - - - - - - Loss on extinguishment of debt - - - - - 13.3 - - - 23.4 - - Financing and Reorganization Charges 5.1 $ - $ - $ 2.8 $ 10.1 $ 27.7 $ - $ - $ - $ 50.6 $ - $ - $ Management , Board , & Strategic Fees - - 0.3 0.4 0.3 0.3 0.7 0.8 1.6 1.0 1.3 1.3 Other 2.9 - - - - - - - - (0.7) 0.1 0.1 Stock Option Expense - - - - - - - - 1.7 3.7 2.5 2.2 FAS 141 Impact - - 2.4 2.3 2.2 Adjusted EBITDA 30.1 $ 35.9 $ 43.5 $ 51.3 $ 61.2 $ 64.5 $ 69.2 $ 75.8 $ 81.0 $ 95.5 $ 104.0 $ 103.9 $ Total Revenue 69.4 $ 92.2 $ 106.0 $ 125.6 $ 153.8 $ 171.0 $ 199.6 $ 215.9 $ 225.1 $ 264.0 $ 289.1 $ 288.8 $ Total Debt & Accrued Interest, Le ss Cash & Inves tments * 153.8 $ 192.4 $ 199.0 $ 209.2 $ 205.8 $ 276.7 $ 301.9 $ 305.0 $ 315.0 $ 501.1 $ 521.7 $ 519.6 $ Leverage (Total Net Debt & Accrued Inte rest Les s Cash & Inves tments / LTM adj EBITDA) * 5.1 5.4 4.6 4.1 3.4 4.3 4.4 4.0 3.9 5.2 5.0 5.0 * As of End of Period EBITDA Reconciliation: 1998 – LTM Q2 2009 |
|
|
14 Thank you. |

