Attached files
| file | filename |
|---|---|
| 8-K - FORM 8-K - SUNTRUST BANKS INC | d8k.htm |
 SunTrust Banks, Inc. BancAnalysts Association of Boston Conference November 5, 2009 Mark A. Chancy Chief Financial Officer Exhibit 99.1 |
 1 Important Cautionary Statement About Forward-Looking Statements The following should be read in conjunction with the financial statements, notes and other information
contained in the Company’s 2008 Annual Report on Form 10-K, Quarterly Reports on Form 10-Q, and Current Reports on Form 8-K. This presentation includes non-GAAP financial measures to describe SunTrust’s performance.
The reconciliation of those measures to GAAP measures are provided within or in the appendix of this presentation. In this presentation, net interest income and net interest margin are presented on a
fully taxable-equivalent (“FTE”) basis, and ratios are presented on an annualized basis. The FTE basis adjusts for the tax-favored status of income from certain loans and investments. The
Company believes this measure to be the preferred industry measurement of net interest income and provides relevant comparison between taxable and non-taxable amounts. This presentation contains forward-looking statements. Statements regarding (i) future levels of net
interest margin, charge-offs, provision expense, asset quality, non-interest expense and income, (ii) future composition of and pricing within our loan and securities portfolios, and (iii) future performance
of our commercial and commercial real estate portfolios, are forward-looking statements. Also, any statement that does not describe historical or current facts, including statements about beliefs and
expectations, is a forward-looking statement. These statements often include the words “believes,” “expects,” “anticipates,” “estimates,”
“intends,” “plans,” “goal,” “targets,” “initiatives,” “potentially,” “probably,” “projects,” “outlook” or similar expressions or future conditional verbs such
as “may,” “will,” “should,” “would,” and
“could.” Such statements are based upon the current beliefs and expectations of management and on information currently available to management. Our forward looking statements speak as of the date hereof, and we do not assume any obligation to update these
statements or the reasons why actual results could differ from those contained in such statements in light of new information or future events. Forward-looking statements are subject
to significant risks and uncertainties. Investors are cautioned against placing undue reliance on such statements. Actual results may differ materially from those set forth in the forward-looking
statements. Factors that could cause actual results to differ materially from those described in the forward- looking statements can be found at Item 1A of our annual report on Form 10-K filed with the Securities
and Exchange Commission and available at the Securities and Exchange Commission’s internet site (http://www.sec.gov). Those factors include: difficult market conditions have adversely affected our
industry; current levels of market volatility are unprecedented; the soundness of other financial institutions could adversely affect us; there can be no assurance that recently enacted legislation, or any
proposed federal programs, will stabilize the U.S. financial system, and such legislation and programs may adversely affect us; the impact on us of recently enacted legislation, in particular the
Emergency Economic Stabilization Act of 2008 (“EESA”) and its implementing regulations, and actions by the FDIC, cannot be predicted at this time; credit risk; weakness in the economy and in the real
estate market, including specific weakness within our geographic footprint, has adversely affected us and may continue to adversely affect us; weakness in the real estate market, including the
secondary residential mortgage loan markets, has adversely affected us and may continue to adversely affect us; weakness in the real estate market may adversely affect our reinsurance subsidiary; as
a financial services company, adverse changes in general business or economic conditions could
have a material adverse effect on our financial condition and results of operations; changes in market interest rates or capital markets could adversely affect our revenue and expense, the value of assets and obligations, and the availability and cost of capital or liquidity; the fiscal and monetary
policies of the federal government and its agencies could have a material adverse effect on our earnings; we may be required to repurchase mortgage loans or indemnify mortgage loan purchasers as a result
of breaches of representations and warranties, borrower fraud, or certain borrower defaults,
which could harm our liquidity, results of operations, and financial condition; clients could pursue alternatives to bank deposits, causing us to lose a relatively inexpensive source of funding; consumers may decide not to use banks to complete their financial transactions, which could affect net
income; we have businesses other than banking which subject us to a variety of risks; hurricanes and other natural disasters may adversely affect loan portfolios and operations and increase the
cost of doing business; negative public opinion could damage our reputation and adversely impact our business and revenues; we rely on other companies to provide key components of our business
infrastructure; we rely on our systems, employees, and certain counterparties, and certain failures could materially adversely affect our operations; we depend on the accuracy and completeness of
information about clients and counterparties; regulation by federal and state agencies could adversely affect our business, revenue, and profit margins; competition in the financial services industry
is intense and could result in losing business or reducing margins; future legislation could harm our competitive position; maintaining or increasing market share depends on market acceptance and
regulatory approval of new products and services; we may not pay dividends on our common stock;
our ability to receive dividends from our subsidiaries accounts for most of our revenue and could affect our liquidity and ability to pay dividends; significant legal actions could subject us to substantial uninsured liabilities; recently declining values of residential real estate, increases in
unemployment, and the related effects on local economics may increase our credit losses, which would negatively affect our financial results; deteriorating credit quality, particularly in real estate loans,
has adversely impacted us and may continue to adversely impact us; disruptions in our ability to access global capital markets may negatively affect our capital resources and liquidity; any reduction in
our credit rating could increase the cost of our funding from the capital markets; we have in the past and may in the future pursue acquisitions, which could affect costs and from which we may not be able
to realize anticipated benefits; we depend on the expertise of key personnel, if these individuals leave or change their roles without effective replacements, operations may suffer; we may not
be able to hire or retain additional qualified personnel and recruiting and compensation costs may increase as a result of turnover, both of which may increase costs and reduce profitability and may
adversely impact our ability to implement our business strategy; our accounting policies and processes are critical to how we report our financial condition and results of operations, and these
require us to make estimates about matters that are uncertain; changes in our accounting policies or in accounting standards could materially affect how we report our financial results and condition; our
stock price can be volatile; our disclosure controls and procedures may not prevent or detect all errors or acts of fraud; our financial instruments carried at fair value expose us to certain market risks;
our revenues derived from our investment securities may be volatile and subject to a variety of risks; we may enter into transactions with off-balance sheet affiliates or our subsidiaries; and we are
subject to market risk associated with our asset management and commercial paper conduit businesses. |
 2 I. LARGE DIVERSIFIED FRANCHISE II. SOLID CAPITAL STRUCTURE III. RELATIVE CREDIT STRENGTH IV. GROWTH INITIATIVES Table of Contents V. APPENDIX |
 3 • Generating momentum with revenue initiatives • Improving efficiency and productivity • Continuing to optimize balance sheet and business mix Investment Thesis Large Diversified Franchise • Attractive geographic profile in valuable markets • High market share in core markets • One of the nation’s largest banks • Diversified business mix Growth Initiatives Stable Base of Operations Provides Foundation for Future Growth • Diversified loan portfolio • Significant loan loss reserves • Conservative commercial portfolios Solid Capital Structure Relative Credit Strength • Completed capital actions created superior capitalization • Diversified funding with large, stable deposit base |
 4 Best Footprint in Banking Projected Population Growth 4 1. Source: SNL Financial, as of June 30, 2009 based on MSAs 2. At 9/30/09 3. Source: SNL Financial, projected household income change, 2009-2014 4. Source: SNL Financial, five-year population growth, 2009-2014 SunTrust Footprint Attractive Geographic Profile In Higher Growth Markets 1.4% 2.6% 3.7% 4.3% 4.3% 4.6% 5.4% 6.1% 6.5% 7.2% 8.1% PNC KEY FITB COF JPM USB RF BAC BBT WFC STI U.S. Average Growth: 4.6% • Ranked top 3 in 20 of the top 25 SunTrust markets; – Top 25 represents 85% of total MSA deposits – Top 25 average deposit market share is 14% • 1,690 branches serving communities with attractive overall growth prospects • Projected household income growth is above the U.S. average I. LARGE DIVERSIFIED FRANCHISE 2 1 3 |
 5 165 BB&T 9 2,041 JPMorgan Chase 2 1,889 Citigroup 3 1,229 Wells Fargo 4 140 Regions 10 169 Capital One 8 173 SunTrust 7 265 U.S. Bancorp 6 271 PNC Financial 5 $2,251 Bank of America 1 $B Company U.S. Rank 1. Source: SNL Financial, November 2, 2009; excludes custody/processor and
non-traditional banks 2. Source: SNL Financial, September 30,
2009 Deposits Significant Scale Assets Branches 1,358 Fifth Third 9 6,153 Bank of America 2 5,149 JPMorgan Chase 3 2,907 U.S. Bancorp 4 1,052 Citigroup 10 1,690 SunTrust 8 1,861 BB&T 7 1,882 Regions 6 2,675 PNC Financial 5 6,785 Wells Fargo 1 # Company U.S. Rank SunTrust is a Top 10 U.S. Bank 170 U.S. Bancorp 6 95 Regions 10 868 JPMorgan Chase 2 833 Citigroup 3 797 Wells Fargo 4 115 Capital One 9 115 BB&T 8 119 SunTrust 7 184 PNC Financial 5 $975 Bank of America 1 $B Company U.S. Rank I. LARGE DIVERSIFIED FRANCHISE 1 2 2 |
 6 Household Lending Diversified Business Mix Retail & Commercial Corporate and Investment Banking Wealth & Investment Management Scope of Operations Market Focus - National - Full line of investment banking products and services - Middle
Market: $100MM-$750MM - Corporate Banking: >$750MM - Investment banking sales to commercial and W&IM clients - National - Full array of private wealth management and institutional solutions including personal and institutional investment management - AUA = $200B - Individuals and families in need of private wealth management including banking, trust, brokerage and asset management solutions - Organizations in need of institutional administrative and investment solutions - National - Residential mortgages, consumer lending - Ranked #6 in total mortgage origination volume - Mortgage servicing portfolio of $177.6B - Prime-based platform, ~99% of 3Q 2009 originations for sale were agency - 53% of production in 3Q 2009 was retail originated 1. For the six months ending June 30, 2009, Inside Mortgage Finance, 7/31/09
2. As of 9/30/09 3. Full-service branches - SunTrust footprint - 1,690 branches - 2,807 ATMs - Over 800 Relationship Managers - Retail clients in SunTrust footprint - Business clients in SunTrust footprint with revenues <$100MM - Government and not- for-profit enterprises - Commercial and residential developers & investors I. LARGE DIVERSIFIED FRANCHISE 2,3 2 2 2 2 1 |
 7 5.83% 11.02% 8.02% 14.15% $46.03 $28.15 7.34% 12.23% 9.11% 15.31% $36.16 $23.41 7.49% 12.58% 9.31% 15.92% $36.06 $23.35 3Q
2009 2Q 2009 1Q 2009 Capital Ratios Remained Solid Tier 1 Common Ratio Tier 1 Capital Ratio Tier 1 Capital Ratio (Excl TARP) Total Capital Ratio Book Value per
Share Tangible Common Book Value per Share Capital Ratios II. SOLID CAPITAL STRUCTURE 1. TARP preferred included in Tier 1 ratio contributes 3.27% to the 9/30/09 Tier 1 capital ratio, 3.12% at 6/30/09, and 3.00% at 3/31/09 2. Please refer to the appendix to this presentation for a reconcilement to the most
directly comparable GAAP financial measure 1 2 |
 8 Funding Profile $174 Billion $165 Billion September 30, 2009 Core Deposits 69% Other Deposits 3% Short-Term Borrowings 3% Long-Term Borrowings 11% Capital 14% June 30, 2006 Core Deposits 57% Other Deposits 15% Short-Term Borrowings 8% Long-Term Borrowings 10% Capital 10% Large, Stable Deposit Base Primary Source of Liquidity 1. Includes Fed Funds, Repos, and other short-term borrowings Diversified Sources of Funding II. SOLID CAPITAL STRUCTURE 1 1 |
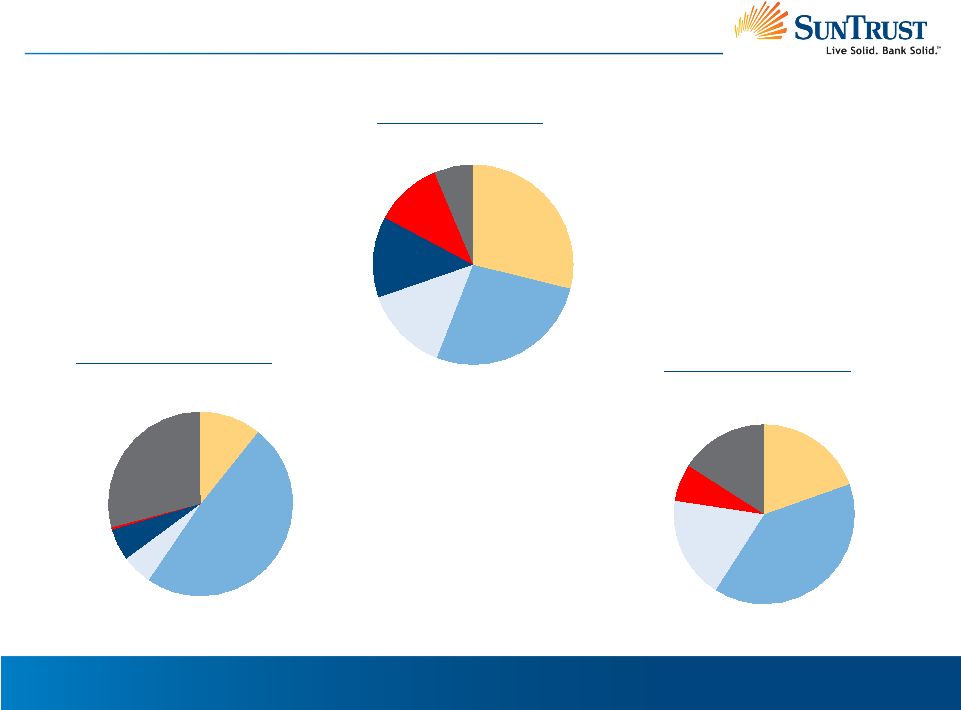 9 Consumer 11% Commercial 29% Residential Mortgages 27% Home Equity Lines 14% Commercial Real Estate 13% Construction 6% Home Equity Lines 18% Consumer 7% Residential Mortgages 39% Commercial 20% Construction 16% Diversified Credit Profile Construction 29% Commercial 11% Consumer 1% Commercial Real Estate 6% Home Equity Lines 5% Residential Mortgages 48% Nonaccrual Loans 9/30/09 3Q 2009 Net Charge-Offs Loan Portfolio 9/30/09 Diversified Credit Profile and Strong Credit Culture 1 1. Consumer includes credit card portfolio of $1.0 billion, with net charge-offs of $23
million III. RELATIVE CREDIT STRENGTH 1 |
 10 3.33% 1.24% 1.72% 1.97% 2.59% 1.81% 1.52% 1.76% 1.54% 1.52% 3Q 2008 4Q 2008 1Q 2009 2Q 2009 3Q 2009 Net Charge-Offs 30-89 Days Past Due III. RELATIVE CREDIT STRENGTH Credit Trends |
 11 Building The Allowance For Loan & Lease Losses III. RELATIVE CREDIT STRENGTH ($ in millions) Reserve Building and Early Stage Delinquency Trends $0 $100 $200 $300 $400 $500 3Q07 4Q07 1Q08 2Q08 3Q08 4Q08 1Q09 2Q09 3Q09 0.70% 0.90% 1.10% 1.30% 1.50% 1.70% 1.90% Net Additions to ALLL 30-89 Day Delinquency |
  12 Allowance to Nonperforming Loan Review ALLL Coverage of NPLs Increases to 109% When Adjusted for NPLs Previously Written Down and
Impaired Loans With Specific Reserve Allocations ALLL / NPL Coverage Ratio 20% 57% 109% 32% Base ALLL/NPL Coverage Res Mtg Previously Written Down Impaired CML Loans With Specific Reserves Adjusted ALLL/NPL Coverage III. RELATIVE CREDIT STRENGTH ($ in millions, period end balances) IMPAIRED COMMERCIAL LOANS WITH SPECIFIC RESERVES 3Q 2009 9/30/09 9/30/09 FAS114 Cumulative Balance Reserve Charge-Offs Implied Severity Corporate and Investment Banking $273 $55 $176 52% Commercial 1,013 202 147 30% Wealth & Investment Management 15 - 2 10% Commercial FAS 114 Portfolio $1,301 $258 $326 36% 1 2 Base ALLL/NPL coverage ratio excludes $108 million in nonaccrual loans held at fair value Adjustments include reducing the denominator of the ratio for the carrying value of residential mortgages
previously written-down and those not requiring a write-down (Appendix slide 26), and a
$277 million reduction in the numerator for reserves attributed to these nonperforming loans for lower collateral values that have occurred since the FFIEC write-down at 180 DPD 1. 2. |
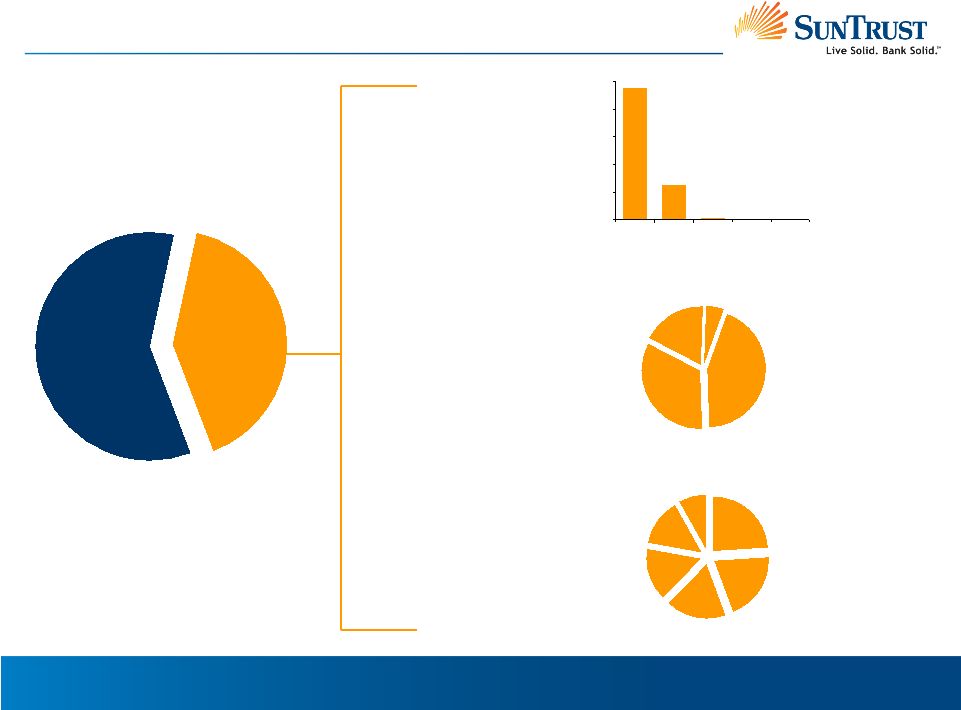
 13 C&I Portfolio 40% 34% 1% 11% 5% 6% 3% Unsecured: 40% Receivables: 34% Assignments of Contracts and Intangibles:11% Deposits, CSV, Securities, Letters of Credit: 5% Equipment (Business/Commercial): 6% Inventory: 3% Residential Property: 1% 38% 34% 28% Mid-Atlantic Group Central Group Florida Group 1. Excludes leasing portfolio 2. Excludes large corporate client portfolio and leasing portfolio
Well Diversified C & I Portfolio 14% 12% 11% 10% 9% 8% 7% 7% 7% 6% 6% 4% Consumer Products & Svcs: 14% Retailing: 12% Gov, Relig. & Non Profit:11% Div. Fin. & Ins: 10% Energy & Utilities: 9% Health Care & Pharma: 8% Div. Com. Svcs: 7% Other: 7% Capital Goods: 7% Real Estate: 6% Media & Telecom: 6% Materials: 4% Client Segment Geography Collateral Type Industry Group 32% 16% 8% 5% 39% Commercial Large Corporate Leasing Wealth Management Small Business III. RELATIVE CREDIT STRENGTH 1 1 2 |
 14 Central Group 33% Mid-Atlantic Group 44% National 5% Florida Group 18% Investor Owned 41% Owner Occupied 59% 41% Investor Owned Portfolio is Well Diversified Commercial Real Estate Portfolio Geography 4,764 1,240 54 18 12 0 1,000 2,000 3,000 4,000 5,000 <$1MM $1MM- 10MM $10MM- 20MM $20MM- 30MM >$30MM # of Loans $1.0 Million Avg Loan Size Granularity Retail 24% Office 20% Multifamily 18% Warehouse/ Industrial 15% Special Purpose Real Estate 15% Hotels/ Motels 8% Property Type III. RELATIVE CREDIT STRENGTH |
 15 Commercial-Related Loan Growth Source: SNL Peer Group: BB&T, Capital One, Comerica, Fifth Third, KeyCorp, M&T, Marshall
& Ilsley, PNC, Regions, US Bancorp, and Wells Fargo III. RELATIVE CREDIT
STRENGTH Late-Cycle Annual Growth in C&I, CRE and Construction Is Well
Below Peer Group SunTrust Peer Group Commercial Real Estate 3.7% 13.1% 1.6% 1.3% 18.6% 3.9% 0.0% 5.0% 10.0% 15.0% 20.0% 2005 2006 2007 Construction and Land Development 11.4% 41.2% 38.1% -0.8% 25.8% 40.8% -10.0% 0.0% 10.0% 20.0% 30.0% 40.0% 50.0% 2005 2006 2007 C&I 9.9% 12.4% 20.8% 3.1% -5.6% 7.2% -10.0% 0.0% 10.0% 20.0% 30.0% 2005 2006 2007 |
 16 Historical Net Charge-Off Ratio Construction and Land Development 0.18% 0.50% 0.00% 0.10% 0.20% 0.30% 0.40% 0.50% 0.60% SunTrust Peer Average Commerical Real Estate 0.06% 0.18% 0.00% 0.05% 0.10% 0.15% 0.20% SunTrust Peer Average III. RELATIVE CREDIT STRENGTH C&I 0.54% 0.77% 0.00% 0.20% 0.40% 0.60% 0.80% SunTrust Peer Average 1. 10-year timeframe: 1999-2008 Source: SNL Peer Group: BB&T, Capital One, Comerica, Fifth Third, KeyCorp, M&T, Marshall
& Ilsley, PNC, Regions, US Bancorp, and Wells Fargo 1 SunTrust’s 10-Year Average Annual
C&I, CRE and Construction NCO % Is Well Below Peer Average |
 17 • Generating momentum with revenue initiatives • Improving efficiency and productivity • Continuing to optimize balance sheet and business mix Investment Thesis Large Diversified Franchise • Attractive geographic profile in valuable markets • High market share in core markets • One of the nation’s largest banks • Diversified business mix Growth Initiatives Stable Base of Operations Provides Foundation for Future Growth • Diversified loan portfolio • Significant loan loss reserves • Conservative commercial portfolios Solid Capital Structure Relative Credit Strength • Completed capital actions created superior capitalization • Diversified funding with large, stable deposit base |
 18 Growth Initiatives Continuing to Optimize Balance Sheet and Business Mix Improving Efficiency and Productivity 1. Includes approximately 1,500 positions transitioned to a third party provider contracted
for certain check and related processing operations 2. Includes additions to the unfunded commitment reserves, operating losses, credit and
collections, other real estate, additions to Mortgage re-insurance reserves and FDIC expense IV. GROWTH INITIATIVES • $10.6 billion, or 67%, reduction in average brokered and foreign deposits versus 3Q 2008 • Increased securities portfolio and opportunistically repositioned MBS position in 3Q 2009 • $6.4 billion, or 46%, reduction in construction loan portfolio from December 2007 to September 2009 • $1.1 billion, or 28%, increase in consumer direct loan portfolio from December 2007 to September 2009 • Delivered over $600 million in run-rate expense savings in 2009, or 11% of 2006 noninterest expense base • Full-time equivalent employees reduced by 5,500, or 16%, versus year end 2006 • Office space reduced by over 20% • Economically sensitive noninterest expenses have increased over $200 million in 3Q 2009 from 3Q 2006; these expenses will decline over time Improving Efficiency and Productivity Generating Momentum with Revenue Initiatives • Mortgage production volume up 43% year-to-date versus last year • Retail checking households up over 4% versus last year driven in part by improved front line execution, innovative new products, and increased consumer awareness • Average consumer and commercial deposits increased $14 billion, or 14%, in 3Q 2009 versus 3Q 2008 • Increasing risk-adjusted loan margin with goal of 15-25 basis point improvement over next two years 1 2 |
 SunTrust Banks, Inc. BancAnalysts Association of Boston Conference November 5, 2009 Mark A. Chancy Chief Financial Officer |
 20 Appendix |
 21 V. APPENDIX ($ in thousands, except per share data) Reconciliation of Non GAAP Measures September 30 June 30 September 30 2009 2009 2008 Total shareholders'
equity $22,908,284 $22,953,158 $18,069,378 Goodwill, net of deferred
taxes (6,204,954) (6,213,243) (7,062,869) Other intangible assets including MSRs, net of deferred taxes (1,559,765) (1,468,209) (1,328,055) MSRs 1,422,716 1,322,322 1,150,013 Tangible
equity 16,566,281 16,594,028 10,828,467 Preferred stock (4,911,416) (4,918,863) (500,000) Tangible common equity $11,654,865 $11,675,165 $10,328,467 Total
assets $172,717,747 $176,734,971 $174,776,760 Goodwill
(6,314,382) (6,314,382) (7,062,869) Other intangible assets including
MSRs (1,604,136) (1,517,483) (1,389,965) MSRs 1,422,716 1,322,322 1,150,013 Tangible
assets $166,221,945 $170,225,428 $167,473,939 Tangible equity to tangible assets 9.96 % 9.75 % 6.47 % Tangible book value per common share $23.35 $23.41 $29.18 Three Months Ended |