Attached files
| file | filename |
|---|---|
| 8-K - PACIFIC GAS & ELECTRIC Co | eeiform8k.htm |

Business
Update
Edison
Electric Institute
Financial Conference
November 2-3, 2009
Hollywood, Florida
Financial Conference
November 2-3, 2009
Hollywood, Florida
PG&E
Corporation
Exhibit
99

2
Cautionary
Language Regarding
Forward Looking Statements
Forward Looking Statements
This
presentation contains forward-looking statements regarding management’s guidance
for PG&E Corporation’s 2009,
2010, and 2011 earnings from operations
per common share, the assumptions on which the guidance is based, and proposed capital expenditures. These statements and assumptions are necessarily
subject to various risks and uncertainties, the realization or resolution of which may be outside management’s control. Actual results may differ
materially. Factors that could cause actual results to differ materially include:
• the
Utility’s ability to manage capital expenditures and its operating and
maintenance expenses within authorized levels;
• the
outcome of pending and future regulatory proceedings and whether the Utility is
able to timely recover its costs through rates;
• the
adequacy and price of electricity and natural gas supplies, and the ability of
the Utility to manage and respond to the volatility of the electricity and
natural gas markets, including
the ability of the Utility and its counterparties to post or return collateral;
the ability of the Utility and its counterparties to post or return collateral;
• explosions,
fires, accidents, mechanical breakdowns, the disruption of information
technology and computer systems, and similar events that may occur while
operating and
maintaining an electric and natural gas system in a large service territory with varying geographic conditions, that can cause unplanned outages, reduce generating output, damage
the Utility’s assets or operations, subject the Utility to third party claims for property damage or personal injury, or result in the imposition of civil, criminal or regulatory fines or
penalties on the Utility;
• the
impact of storms, earthquakes, floods, drought, wildfires, disease and similar
natural disasters, or acts of terrorism, that affect customer demand, or that
damage or disrupt the
facilities, operations, or information technology and computer systems, owned by the Utility, its customers, or third parties on which the Utility relies;
facilities, operations, or information technology and computer systems, owned by the Utility, its customers, or third parties on which the Utility relies;
• the
potential impacts of climate change on the Utility’s electricity and natural gas
businesses;
• changes
in customer demand for electricity and natural gas resulting from unanticipated
population growth or decline, general economic and financial market conditions,
changes in
technology, including the development of alternative energy sources, or other reasons;
technology, including the development of alternative energy sources, or other reasons;
• operating
performance of the Utility’s two nuclear generating units at the Diablo Canyon
Power Plant (“Diablo Canyon”), the availability of nuclear fuel, the occurrence
of unplanned
outages at Diablo Canyon, or the temporary or permanent cessation of operations at Diablo Canyon;
outages at Diablo Canyon, or the temporary or permanent cessation of operations at Diablo Canyon;
• whether
the Utility can maintain the cost savings that it has recognized from operating
efficiencies that it has achieved and identify and successfully implement
additional sustainable
cost-saving measures;
cost-saving measures;
• whether
the Utility incurs substantial expense to improve the safety and reliability of
its electric and natural gas systems;
• whether
the Utility achieves the CPUC’s energy efficiency targets and recognizes any
incentives that the Utility may earn in a timely manner;
• the
impact of changes in federal or state laws, or their interpretation, on energy
policy and the regulation of utilities and their holding companies;
• the
impact of changing wholesale electric or gas market rules, including the impact
of future changes ordered by the Federal Energy Regulatory Commission that will
be incorporated
into the new day-ahead, hour-ahead, and real-time wholesale electricity markets established by the California Independent System Operator to restructure the California wholesale
electricity market;
into the new day-ahead, hour-ahead, and real-time wholesale electricity markets established by the California Independent System Operator to restructure the California wholesale
electricity market;
• how
the CPUC administers the conditions imposed on PG&E Corporation when it
became the Utility’s holding company;
• the
extent to which PG&E Corporation or the Utility incurs costs and liabilities
in connection with litigation that are not recoverable through rates, from
insurance, or from other third
parties;
parties;
• the
ability of PG&E Corporation, the Utility, and counterparties to access
capital markets and other sources of credit in a timely manner on acceptable
terms;
• the
impact of environmental laws and regulations and the costs of compliance and
remediation;
• the
effect of municipalization, direct access, community choice aggregation, or
other forms of bypass;
• the
outcome of federal or state tax audits and the impact of changes in federal or
state tax laws, policies, or regulations; and
• other
factors and risks discussed in PG&E Corporation’s and the Utility’s 2008
Annual Report on Form 10-K and other reports filed with the Securities and
Exchange Commission.

3
2009
Business Priorities
•
Improve reliability
•
Improve safety and human performance
•
Deliver on budget, on plan, and on purpose
•
Drive customer satisfaction
•
Champion effective regulatory and legislative policies

4
PCG
Investment Case
• PCG
is focused on better service to our customers,
which is the foundation of our growth:
which is the foundation of our growth:
•
Substantial Cap Ex Program
•
Manageable financing requirements
•
Decoupled revenues
•
Pass-through of procurement costs
•
11.45% weighted ROE on 52% equity
•
Low carbon footprint
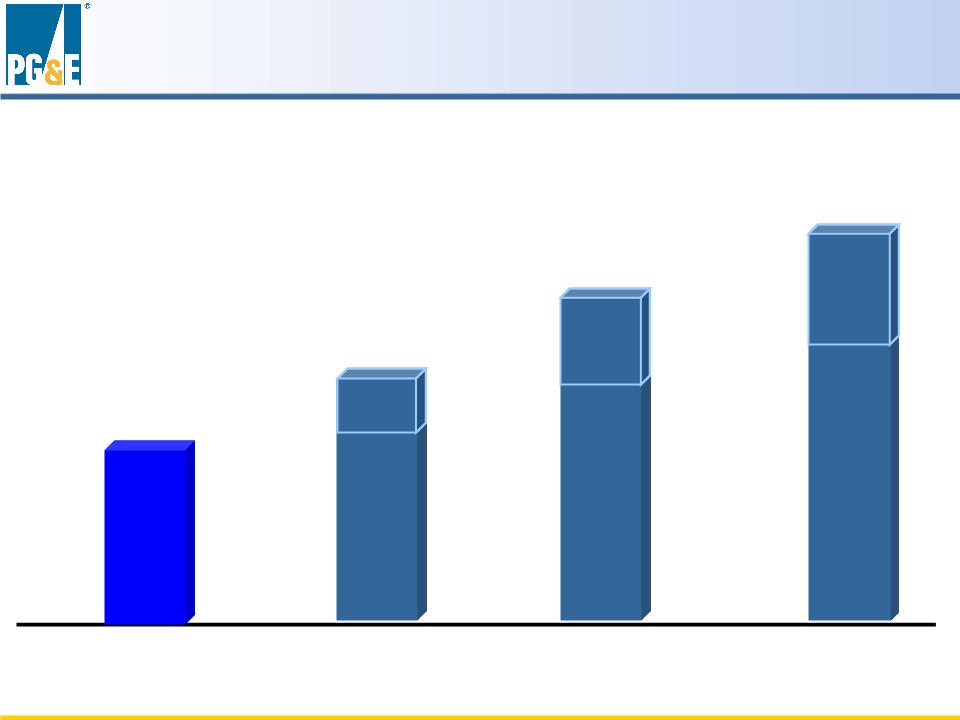
2009
$3.25
$3.25
$3.15
$3.15
5
2011
EPS
Guidance
$3.85
$3.85
2008
Actual
Actual
$2.95
$2.95
$3.65
$3.65
Low
Low
High
High
Low
Low
High
High
2010
$3.50
$3.50
$3.35
$3.35
Earnings
per Share from Operations
Earnings
per Share from Operations
* Reg G
reconciliation to GAAP for 2008 EPS from Operations, and 2009-2011 EPS Guidance
is contained in the Appendix
and at www.pge-corp.com under the “Investors” page
High
High
Low
Low

6
Financial
Assumptions 2009-2011
GUIDANCE
REFLECTS:
• Capital
expenditures consistent with low and high case ranges
• CPUC
authorized ROE of at least 11.35% and Utility earns at least
12% on FERC projected rate base
12% on FERC projected rate base
• Ratemaking
capital structure maintained at 52% equity
• CEE
incentives, operational changes and efficiencies and tax cash
flow consistent with low and high case earnings ranges
flow consistent with low and high case earnings ranges
• Resolution
of FERC generator claims in 2009-2011 results in
financing needs
financing needs

7
Cost
of Capital
• Affirmative
decision to extend cost of capital mechanism
• Maintains
52% equity capital structure through 2012
• Maintains
11.35% ROE and adjustment mechanism
through 2012
through 2012
• No
ROE adjustment in 2010

8
GRC
Overview
• Continued
investments in safe and reliable service
• Contribute
to economy of our local communities
• Work
toward a greener, smarter energy future
2009
2009
2010
2010
2011
2011
2011
General Rate Case
July:
Filed Notice of Intent
Filed Notice of Intent
Summer
2010:
Hearings
Hearings
January
2011:
Rates go into effect
Rates go into effect
December:
File Application
File Application

Key
Regulatory Proceedings
9
Q1
2010
A.
09-02-019
Solar
PV Application
Q1
2010
A.
08-05-023
Cornerstone
Improvement Program
Q4
2009
Filing
/ Decision Date
R.
09-01-019
Energy
Efficiency 2006-2008 Cycle
Docket
#
Case
Q2
2010
A.
09-04-001
Request
for New Generation Offers
Q3
2010
ER09-1521-000
Transmission Owner
Rate Case 12
Filing
in December 2009; expected
decision Q4 2010
decision Q4 2010
2011
General Rate Case
Filing
in Q3 2009; expected decision
Q4 2010
Q4 2010
A.09-09-013
Gas
Transmission & Storage Rate Case 2011
Q4
2009
R.
08-12-009
SmartGrid Order
Instituting Rulemaking (OIR)

10
Energy
Efficiency Incentive Revenues
• Received
35% of 2006-2007 incentive award in 2008
• Expecting
CPUC decision on proposed 2006-2008 interim
incentive award by December 2009
incentive award by December 2009
• Expecting
CPUC decision to resolve held back incentive
amounts by December 2010
amounts by December 2010
2006
- 2008 Cycle
2006
- 2008 Cycle
2009
and beyond
2009
and beyond
• Development
of new incentive mechanism is underway
• Objective
is to adopt a mechanism that is much easier to
understand and assess
understand and assess
• New
mechanism should result in more predictable,
annual earnings
annual earnings

11
PG&E
Ownership of Renewables
Proposed
Solar PV Program
•
Up to 250 MW of Utility-owned PV generation
•
Up to 250 MW of standard-offer PV PPAs
Next Steps
• 2MW
pilot program underway
• Operational
target date end of 2009
• Next
25 MW planned for 2010

12
New
Conventional Generation Offers
•
800-1,200 MW of new resources to be on-line by 2015
•
All contracts filed with CPUC, waiting for approval
• Mariposa - 184
MW
• Marsh Landing - 719
MW
• Midway Sunset - 129
MW
• Contra Costa
Generating Station - 586 MW
(Purchase and Sale Agreement)
(Purchase and Sale Agreement)
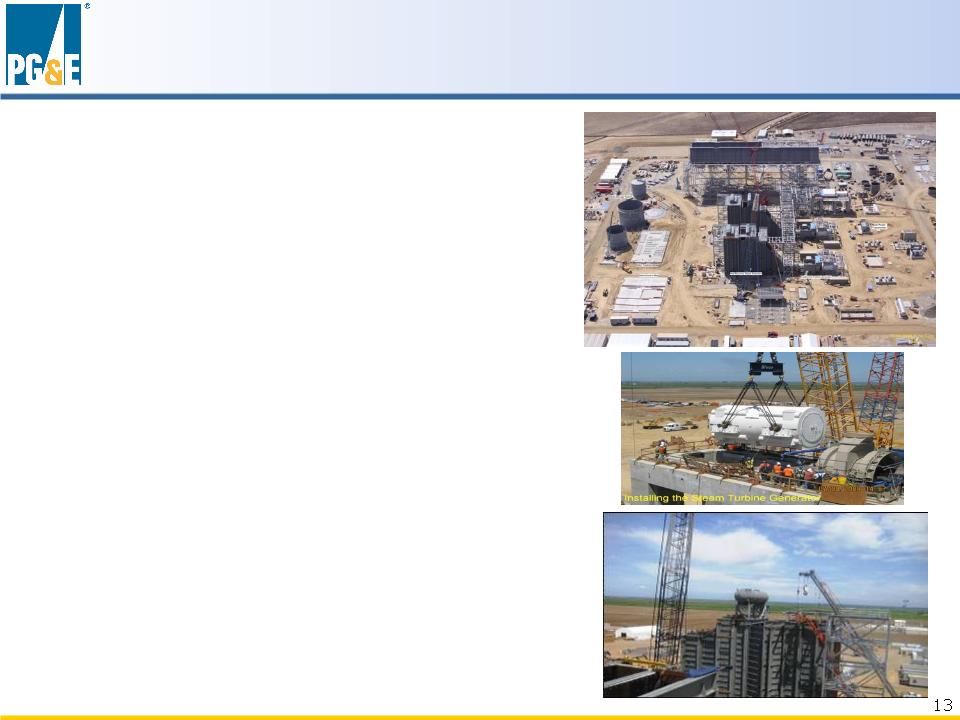
• 659
MW generating capacity
• Capital
investment of $673 MM
• Approximately
70% complete
• 425
workers on site
• All
generating equipment on
foundations
foundations
• Online
in 2010
Colusa
Generating Station Update

14
Humboldt
Bay Generating Station
• 163
MW generating capacity
• Capital
investment of $239 MM
• Approximately
60% complete
• 130
workers on site
• Online
in 2010

SmartMeter
Program Update
• Largest
deployment of Advanced Metering
Infrastructure (AMI) nationwide
Infrastructure (AMI) nationwide
• Capital
investment of $1.8 B
• Installations
complete in 2012
• Enables
time-of-use pricing
• Enhanced
capabilities over time
• Installed
about 3.8MM SmartMeters to date
15

Appendix

Electric
And Gas Distribution
(1) Authorized revenues
= operating costs + (rate of return ´ rate
base)
Rate
base = net plant ± adjustments to approximate invested capital
|
Business
Scope
|
|
• Retail
electricity and natural gas distribution service (construction,
operations and maintenance) • Customer
services (call centers, meter reading, billing)
• 5.1 million
electric and 4.3 million gas customer accounts
|
|
Primary
Assets
|
|
• $11.9 billion
of rate base (2008 wtd. avg.)
|
|
Regulation
|
|
• California
state regulation (CPUC)
• Cost of
service ratemaking (1)
|
17

Midway
Los
Banos
Moss
Landing
Diablo
Canyon
Gates
Dixon
Malin
Round
Mt
Vaca
Electric
Transmission
|
Business
Scope
|
|
• Wholesale
electric transmission services (construction, maintenance)
• Operation by
CA Independent System Operator
|
|
Primary
Assets
|
|
• $2.8 billion
of rate base (2008 wtd. avg.)
|
|
Regulation
|
|
• Federal
regulation (FERC)
• Cost of
service ratemaking
• Revenues vary
with system load
|
18

Natural
Gas Transmission
|
Business
Scope
|
|
• Natural gas
transportation, storage, parking and lending
services • Customers:
PG&E natural gas distribution and electric
generation businesses, industrial customers, California electric generators |
|
Primary
Assets
|
|
• $1.5 billion
of rate base (2008 wtd. avg.)
|
|
Regulation
|
|
• California
state regulation (CPUC)
• Incentive
ratemaking framework (“Gas Accord”)
• Revenues vary
with throughput
|
19
Electric
Procurement & Owned Generation
|
Business
Scope
|
|
• Electricity
and ancillary services from owned and controlled
resources • Energy
procurement program
|
|
Primary
Assets
|
|
• $2.0 billion
of rate base (2008 wtd. avg.)
• Diablo Canyon
Nuclear Power Plant (2,240 MW)
• Gateway
Generating Station (530 MW)
• Largest
privately owned hydro system (3,896 MW)
• Funded nuclear
plant decommissioning trusts of $1.8 billion
|
|
Regulation
|
|
• Cost of
service ratemaking for utility-owned generation
• Pass through
of power procurement costs
|
20

Helms
Pumped Storage
Diablo
Canyon Power Plant
Conventional
Hydroelectric
facilities
facilities
PG&E
Generation in California
Gateway
21

Agricultural
Electric
Customers
(88,127
GWh delivered)
Gas
Customers
(833
Bcf delivered)
Industrial
68%
68%
Commercial
8%
8%
Residential
24%
24%
Industrial
18%
18%
Commercial
39%
39%
Residential
36%
36%
Agricultural
& Other
& Other
7%
2008
Customer Profiles (% by Sales)
22

|
Owned
Generation
|
Type
|
|
|
Diablo
Canyon
|
Nuclear
|
2,240
|
|
Hydroelectric
Facilities
|
Hydro
|
3,896
|
|
Humboldt
|
Fossil
|
135
|
|
Total
|
|
6,271
|
2008
Resource Mix
* Approximately
12% of total retail sales are supplied by eligible renewable resources coming
from utility-owned, QF, Irrigation Districts, and
other sources.
other sources.
23
30%
18%
15%
35%
2%

2008
EPS - Reg G Reconciliation
*
Earnings per share from operations is a non-GAAP measure. This
non-GAAP measure is used because it allows
investors to compare the core underlying financial performance from one period to another, exclusive of items that do not
reflect the normal course of operations.
investors to compare the core underlying financial performance from one period to another, exclusive of items that do not
reflect the normal course of operations.
**
Items impacting comparability reconcile earnings from operations with
consolidated Income Available for Common
Shareholders as reported in accordance with GAAP. For the three and twelve months ended December 31, 2008, PG&E
Corporation recognized $257 million of net income resulting from a settlement of tax audits for tax years 2001 through
2004. Of this amount, $154 million was related to PG&E Corporation’s former subsidiary, National Energy & Gas
Transmission, Inc., and was recorded as income from discontinued operations
|
EPS on an
Earnings from Operations Basis*
|
$2.95
|
|
Items
Impacting Comparability**
|
0.68
|
|
EPS on a GAAP
Basis
|
$3.63
|
2008
24
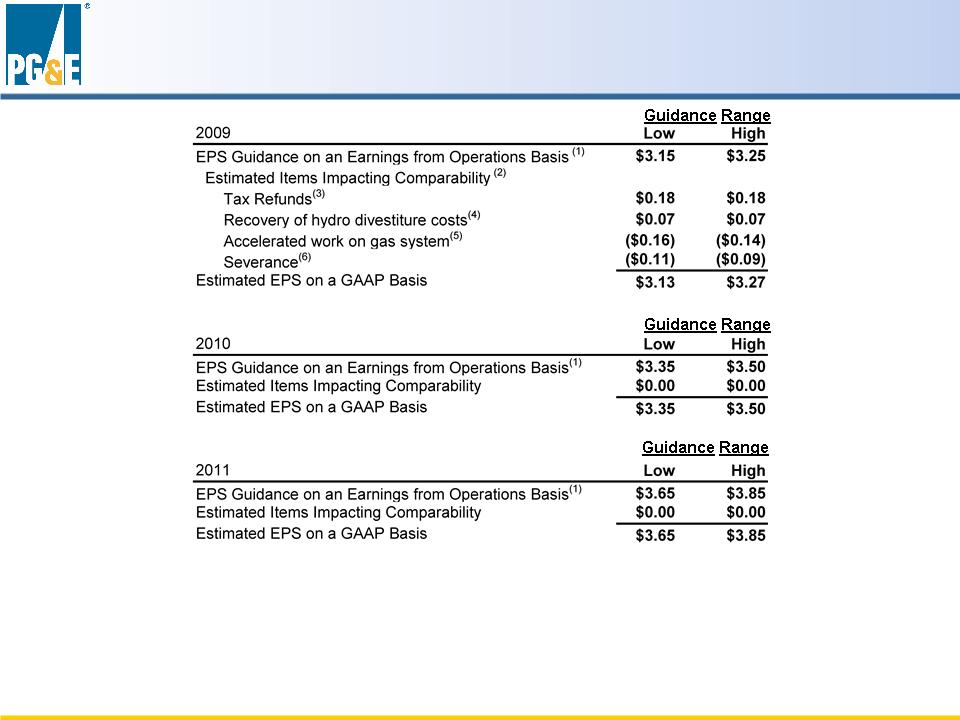
EPS
Guidance - Reg G Reconciliation
|
(1) Earnings per
share from operations is a non-GAAP measure. This
non-GAAP measure is used because it allows investors to compare the core
underlying
financial performance from one period to another, exclusive of items that do not reflect the normal course of operations. (2) Items impacting
comparability reconcile earnings from operations with Consolidated Income
Available for Common Shareholders in Accordance with GAAP.
(3) In June 2009,
the Joint Committee of Taxation approved deferred gain treatment for power
plant sales in 1998 and 1999. This amount recognizes the
interest
and state tax benefit related to the tax refund (4) On April 16,
2009, the CPUC authorized recovery of costs previously incurred in
connection with the Utility’s hydroelectric generation
facilities.
(5) Costs to
perform accelerated system-wide gas integrity surveys and associated
remedial work.
(6) Severance costs
related to the reduction of approximately 2% of the Utility’s
workforce.
|
Reg
G reconciliation also provided on the PG&E Corporation website:
www.pge-corp.com under the “Investors” page
25