Attached files
| file | filename |
|---|---|
| S-1/A - AMENDMENT NO 1 - BANK OF FLORIDA CORP | ds1a.htm |
| EX-5.1 - OPINION - BANK OF FLORIDA CORP | dex51.htm |
| EX-23.2 - CONSENT OF HACKER JOHNSON & SMITH PA - BANK OF FLORIDA CORP | dex232.htm |
Exhibit 99.1

Stress Testing the Balance Sheet of Bank of Florida Corporation
September 9, 2009
Confidential
© 2009 Promontory Financial Group, LLC. All rights reserved.
Confidential
Stress Testing Bank of Florida’s Balance Sheet
Disclaimer
This report is provided for informational purposes solely for the benefit of Bank of Florida Corporation, and not for the benefit of any other party. Promontory has no responsibility to any other party with respect to the report, whether or not the report might be considered material to such party in connection with its evaluation of any issues or investment. Promontory’s work on this report is limited in nature and may not comprehend any or all matters that might be pertinent or necessary to the other party’s evaluation of any issue or investment.
Executive Summary
Bank of Florida Corporation engaged Promontory Financial Group (Promontory) to stress test the balance sheet of the company. This report documents the approach used to conduct the stress test and the results. The approach was based on the federal regulators’ Supervisory Capital Assessment Program (SCAP), modified in an attempt to reflect the risk inherent in Bank of Florida’s portfolio and the markets in which it operates, based on the information available. As applied to Bank of Florida’s portfolio, the stress test would indicate that credit losses over the next two years could total $131MM. Under the capital ratio targets applied to the banks that were part of the SCAP program, those losses would indicate a need for an additional $27MM in common equity and $52.8MM in capital that qualifies as tier 1 regulatory capital.
The result from the stress test is not a prediction of what is most likely to happen to Bank of Florida’s portfolio. Instead, it is an estimate of losses that the company might incur if the current economic environment continues to worsen to circumstances like those seen during the Great Depression of the 1930s. Any stress testing approach is limited by our inability to know how bad the economy will actually become.
The SCAP stress testing approach is very simple. It was designed to be applied at a very high level of aggregations of the institution (sometimes referred to as a “top-down” approach). In addition it was designed to be done relatively quickly in a way that would produce results that were easily understandable and comparable across institutions. A simple, top-down, stress testing approach is
1 | P a g e
Confidential
inherently limited in its inability to know with precision how the Bank of Florida portfolio would be impacted by stress circumstances. In addition, we cannot know what management actions Bank of Florida might take over the period covered by the stress test that might impact its performance. Despite those limitations, this transparent approach features the advantage that it is has been subjected to widespread scrutiny. It was developed by the federal bank regulators and applied to the largest 19 banks in the US.
This stress test of the Bank of Florida portfolio was conducted over an unusually short time frame for this type of analysis, August 31, 2009 through September 3, 2009. The analysis used a combination of information from public filings, unaudited data provided by bank management and representations by bank management. The data on loan balances, reserves, earnings, charge offs, and capital used as the basis for the stress test was from the regulatory call report as of June 30, 2009.
Stress Testing
Stress testing is a commonly used term describing a general process for predicting outcomes under extreme and rare conditions. Since stress testing is designed to evaluate the impact of rare events, it is difficult to build empirically based and statistically derived models to predict those outcomes, and the accuracy of such predictions is very hard to assess. Thus stress testing is inherently an exercise in informed expert judgment and should not be mistaken for either a forecast of the most likely outcome, or an accurate forecast of a rare event. A useful stress test is the best possible prediction of the impact of a rare event, providing useful information, but still leaving unavoidable imprecision in the prediction.
In banking stress testing is an important means for a bank to determine the impact on the portfolio of extremely detrimental economic circumstances. The purpose of stress testing is to inform ongoing plans and strategies to increase or decrease the risk, size, or concentration of a portfolio.
Several methods of stress testing are used in the industry, some employing statistical modeling of historical loss rates experienced by a bank, some employing statistical modeling of the relationship between economic variables and bank losses, and some employing statistical modeling of a bank’s internal assessment or risk (“ratings migration”). The recently conducted SCAP employed a benchmarking approach in which charge-off rates chosen by appealing to a combination of external – or benchmark – data sources were applied to the reported credit exposures of the 19 largest commercial banks.
The advantage of the benchmarking approach to stress testing is that it can be done relatively quickly and that it produces results that are relatively easy to explain to external stakeholders. Benchmarking can be done more quickly than the other types of stress testing because it does not rely on time-consuming statistical modeling of the relationships between economic or loan factors and bank loss experience. In many cases, benchmarking is the only practical approach to stress testing because banks do not possess data in an electronic format that permits statistical modeling.
2 | P a g e
Confidential
The disadvantage of a benchmarking approach to stress testing is that it abstracts from details that may be important for an individual bank. The application of benchmark loss rates is based on the assumption that loss rates determined from other sources are applicable to the institution in question. Benchmark loss rates are applied to balance sheet exposure aggregates. Even if the aggregation of exposures by loan type is well supported, differences between individual exposures may be important in determining the degree of loss they might experience.
A benchmark-type stress test can use loss rates suggested in academic studies or other available industry studies to infer the amount of stress to apply to the bank’s portfolio. As an example the SCAP program started with ranges of loss rates for multiple loan types that were determined by the federal regulators to be reasonable based on their experts’ review of the scholarly literature, their experts’ analysis of the data gathered through regulatory reporting, and their combined domain expertise. The results of the SCAP exercise provide further sources of benchmarking data. Published reports include loss rates for multiple types of assets that were determined by the federal regulators to be acceptable representations of the loss rates expected under the range of adverse economic conditions expected over the next several years. Because of the amount of effort and review that went into development of the SCAP and its transparency, this is the method that we applied to the Bank of Florida portfolio.
The SCAP was designed to be a forward-looking exercise that would help federal bank regulators determine actions that would ensure the stability of the banking systems and the economy. They estimated the resources—earnings, capital and reserves—that would be needed by systemically important institutions to absorb losses under two macroeconomic scenarios that were of great concern to regulators. At the time the program was implemented in early 2009, there was considerable uncertainty about the economic outlook for the global economy. There was a high degree of consensus among macroeconomists that the economy had already entered a recession, but concern that the recession could be much worse than anything experienced in more than a half century.
The SCAP tested the balance sheets of the nation’s largest banks to determine if they had enough capital to ride out a prolonged two-year economic downturn whose loss rates would be worse than what was experienced during the Great Depression. The program was applied to 19 banks, all with assets over $100 billion. Treasury and the federal bank regulators selected the 19 banks because of concern that their failure could further damage the economy, which had already been threatened by the contraction in credit availability associated with the extraordinary contraction in liquidity that commenced in late summer 2008.
The SCAP Stress Testing Approach
The SCAP involved the prediction of losses that would be expected to occur under selected economic scenarios, as well as the firm’s capacity to absorb those losses through earnings, existing reserves and existing capital, or to identify the additional capital needed to do so. The SCAP analysis was applied to a two-year period, 2009 and 2010. At the end of the period, banks are expected to have been able to absorb the losses incurred during the recessions, be adequately reserved against losses going forward from that point, and remain well capitalized in the eyes of their regulators.
3 | P a g e
Confidential
The SCAP Stress Losses
The core of the SCAP stress testing approach is the application of loss rates to loan balances aggregated by common loan types. The SCAP process started with examiners providing banks a range of loss rates by loan type. Table 1 presents the initial stress ranges provided to banks. At the time the SCAP was commenced, the consensus economic outlook was for a mild recession, with some probability of a more severe recession. Thus, the SCAP requirements presented to the banks that were part of the program featured two ranges of loss rates: “baseline” and “more adverse.” The regulators also provided descriptions of those two scenarios in terms of values for macro-economic variables (unemployment rate, GDP growth, and house price appreciation rates) and instructed the banks to determine their own loss rates that would correspond to the two scenarios.
4 | P a g e
Confidential
Table 1: Indicative Loss Rates Provided to BHCs for
SCAP (cumulative two year, in percent)
| Baseline | More Adverse | |||
| First Lien Mortgages |
5 – 6 | 7 – 8.5 | ||
| Prime |
1.5 – 2.5 | 3 – 4 | ||
| Alt-A |
7.5 – 9.5 | 9.5 – 13 | ||
| Subprime |
15 – 20 | 21 – 28 | ||
| Second/Junior Lien Mortgages |
9 – 12 | 12 – 16 | ||
| Closed end Junior Liens |
18 – 20 | 22 – 25 | ||
| HELOCs |
6 – 8 | 8 – 11 | ||
| C&I Loans |
3 – 4 | 5 – 8 | ||
| CRE |
5 – 7.5 | 9 – 12 | ||
| Construction |
8 – 12 | 15 – 18 | ||
| Multifamily |
3.5 – 6.5 | 10 – 11 | ||
| Nonfarm, Non-residential |
4 – 5 | 7 – 9 | ||
| Credit Cards |
12 – 17 | 18 – 20 | ||
| Other Consumer |
4 – 6 | 8 – 12 | ||
| Other Loans |
2 – 4 | 4 – 10 |
Source: The Supervisory Capital Assessment Program: Overview of Results Federal Reserve Board May 2009
5 | P a g e
Confidential
Table 2. SCAP Results by Bank
Table 3: Supervisory Capital Assessment Program
Estimates for 19 Participating Bank Holding
Companies Billions of Dollars
| AmEx | BofA | BB&T | BNYM | CapOne | Citi | FifthThird | GMAC | Goldman | JPMC | |||||||||||||||||||||
| Tier 1 Capital |
10.1 | 173.2 | 13.4 | 15.4 | 16.8 | 118.8 | 11.9 | 17.4 | 55.9 | 136.2 | ||||||||||||||||||||
| Tier 1 Common Capital |
10.1 | 74.5 | 7.8 | 11.0 | 12.0 | 22.9 | 4.9 | 11.1 | 34.4 | 87.0 | ||||||||||||||||||||
| Risk-Weighted Assets |
104.4 | 1,633.8 | 109.8 | 115.8 | 131.8 | 996.2 | 112.6 | 172.7 | 444.8 | 1,337.5 | ||||||||||||||||||||
| Estimated for 2009 and 2010 for the More Adverse Scenario |
||||||||||||||||||||||||||||||
| Total Loss estimates (Before purchase accounting adjustments) |
11.2 | 136.6 | 8.7 | 5.4 | 13.4 | 104.7 | 9.1 | 9.2 | 17.8 | 97.4 | ||||||||||||||||||||
| First Lien Mortgages |
-na- | 22.1 | 1.1 | 0.2 | 1.8 | 15.3 | 1.1 | 2.0 | -na- | 18.8 | ||||||||||||||||||||
| Second/Junior Lien Mortgages |
-na- | 21.4 | 0.7 | -na- | 0.7 | 12.2 | 1.1 | 1.1 | -na- | 20.1 | ||||||||||||||||||||
| Commercial & Industrial Loans |
-na- | 15.7 | 0.7 | 0.4 | 1.5 | 8.9 | 2.8 | 1.0 | 0. 0 | 10.3 | ||||||||||||||||||||
| Commercial Real Estate Loans |
-na- | 9.4 | 4.5 | 0.2 | 1.1 | 2.7 | 2.9 | 0.6 | -na- | 3.7 | ||||||||||||||||||||
| Credit Card Loans |
8.5 | 19.1 | 0.2 | -na- | 3.6 | 19.9 | 0.4 | -na- | -na- | 21.2 | ||||||||||||||||||||
| Securities (AFS and HTM) |
-na- | 8.5 | 0.2 | 4.2 | 0.4 | 2.9 | 0.0 | 0.5 | 0.1 | 1.2 | ||||||||||||||||||||
| Trading & Counterparty |
-na- | 24.1 | -na- | -na- | -na- | 22.4 | -na- | -na- | 17.4 | 16.7 | ||||||||||||||||||||
| Other (1) |
2.7 | 16.4 | 1.3 | 0.4 | 4.3 | 20.4 | 0. | 9 | 4.0 | 0.3 | 5.3 | |||||||||||||||||||
| Total Loss Rate on Loans (2) |
14.3 | % | 10.0 | % | 8.6 | % | 2.6 | % | 11.7 | % | 10.9 | % | 10.5 | % | 6.6 | % | 0.9 | % | 10.0 | % | ||||||||||
| First Lien Mortgages |
-na- | 6.8 | % | 4.5 | % | 5.0 | % | 10.7 | % | 8.0 | % | 10.3 | % | 10.2 | % | -na- | 10.2 | % | ||||||||||||
| Second/Junior Lien Mortgages |
-na- | 13.5 | % | 8.8 | % | -na- | 19.9 | % | 19.5 | % | 8.7 | % | 21.2 | % | -na- | 13.9 | % | |||||||||||||
| Commercial & Industrial Loans |
-na- | 7.0 | % | 4.5 | % | 5.0 | % | 9.7 | % | 5.8 | % | 11.0 | % | 2.7 | % | 1.2 | % | 6.8 | % | |||||||||||
| Commercial Real Estate Loans |
-na- | 9.1 | % | 12.6 | % | 9.9 | % | 6.0 | % | 7.4 | % | 13.9 | % | 33.3 | % | -na- | 5.5 | % | ||||||||||||
| Credit Card Loans |
20.2 | % | 23.5 | % | 18.2 | % | -na- | 18.2 | % | 23.0 | % | 22.3 | % | -na- | -na- | 22.4 | % | |||||||||||||
| Memo: Purchase Accounting Adjustments |
0.0 | 13.3 | 0.0 | 0.0 | 1.5 | 0.0 | 0.0 | 0.0 | 0.0 | 19.9 | ||||||||||||||||||||
| Resources Other Than Capital to Absorb Losses in the More Adverse Scenario (3) |
11.9 | 74.5 | 5.5 | 6.7 | 9.0 | 49.0 | 5.5 | -0.5 | 18.5 | 72.4 | ||||||||||||||||||||
| SCAP Buffer Added for More Adverse Scenario |
||||||||||||||||||||||||||||||
| (SCAP Buffer is defined as additional Tier 1 Common/contingent Common) |
||||||||||||||||||||||||||||||
| Indicated SCAP buffer as of December 31, 2008 |
0.0 | 46.5 | 0.0 | 0.0 | 0.0 | 92.6 | 2.6 | 6.7 | 0.0 | 0.0 | ||||||||||||||||||||
| Less: Capital Actions and Effects of Q1 2009 |
0.2 | 12.7 | 0.1 | -0.2 | -0.3 | 87.1 | 1.5 | -4.8 | 7.0 | 2.5 | ||||||||||||||||||||
| SCAP Buffer (8) (9) (10) |
0.0 | 33.9 | 0.0 | 0.0 | 0.0 | 5.5 | 1.1 | 11.5 | 0.0 | 0.0 | ||||||||||||||||||||
| KeyCorp | MetLife | Morgan Stanley |
PNC | Regions | State St | SunTrust | USB | Wells | Total | |||||||||||||||||||||
| Tier 1 Capital |
11.6 | 30.1 | 47.2 | 24.1 | 12.1 | 14.1 | 17.6 | 24.4 | 86.4 | 836.7 | ||||||||||||||||||||
| Tier 1 Common Capital |
6.0 | 27.8 | 17.8 | 11.7 | 7.6 | 10.8 | 9.4 | 11.8 | 33.9 | 412.5 | ||||||||||||||||||||
| Risk-Weighted Assets |
106.7 | 326.4 | 310.6 | 250.9 | 116.3 | 69.6 | 162.0 | 230.6 | 1,082.3 | 7,814.8 | ||||||||||||||||||||
| Estimated for 2009 and 2010 for the More Adverse Scenario |
||||||||||||||||||||||||||||||
| Total Loss estimates (Before purchase accounting adjustments) |
6.7 | 9.6 | 19.7 | 18.8 | 9.2 | 8.2 | 11.8 | 15.7 | 86.1 | 599.2 | ||||||||||||||||||||
| First Lien Mortgages |
0.1 | 0.0 | -na- | 2.4 | 1.0 | -na- | 2.2 | 1.8 | 32.4 | 102.3 | ||||||||||||||||||||
| Second/Junior Lien Mortgages |
0.6 | 0.0 | -na- | 4.6 | 1.1 | -na- | 3.1 | 1.7 | 14.7 | 83.2 | ||||||||||||||||||||
| Commercial & Industrial Loans |
1.7 | 0.0 | 0.1 | 3.2 | 1.2 | 0.0 | 1.5 | 2.3 | 9.0 | 60.1 | ||||||||||||||||||||
| Commercial Real Estate Loans |
2.3 | 0.8 | 0.6 | 4.5 | 4.9 | 0.3 | 2.8 | 3.2 | 8.4 | 53.0 | ||||||||||||||||||||
| Credit Card Loans |
0.0 | -na- | -na- | 0.4 | -na- | -na- | 0.1 | 2.8 | 6.1 | 82.4 | ||||||||||||||||||||
| Securities (AFS and HTM) |
0.1 | 8.3 | -na- | 1.3 | 0.2 | 1.8 | 0.0 | 1.3 | 4.2 | 35.2 | ||||||||||||||||||||
| Trading & Counterparty |
-na- | -na- | 18.7 | -na- | -na- | -na- | -na- | -na- | -na- | 99.3 | ||||||||||||||||||||
| Other (1) |
1.8 | 0.5 | 0.2 | 2.3 | 0.8 | 6.0 | 2.1 | 2.8 | 11.3 | 83.7 | ||||||||||||||||||||
| Total Loss Rate on Loans (2) |
8.5 | % | 2.1 | % | 0.4 | % | 9.0 | % | 9.1 | % | 4.4 | % | 8.3 | % | 7.8 | % | 8.8 | % | 9.1 | % | ||||||||||
| First Lien Mortgages |
3.4 | % | 5.0 | % | -na- | 8.1 | % | 4.1 | % | -na- | 8.2 | % | 5.7 | % | 11.9 | % | 8.8 | % | ||||||||||||
| Second/Junior Lien Mortgages |
6.3 | % | 14.1 | % | -na- | 12.7 | % | 11.9 | % | -na- | 13.7 | % | 8.8 | % | 13.2 | % | 13.8 | % | ||||||||||||
| Commercial & Industrial Loans |
7.9 | % | 0.0 | % | 2.4 | % | 6.0 | % | 7.0 | % | 22.8 | % | 5.2 | % | 5.4 | % | 4.8 | % | 6.1 | % | ||||||||||
| Commercial Real Estate Loans |
12.5 | % | 2.1 | % | 45.2 | % | 11.2 | % | 13.7 | % | 35.5 | % | 10.6 | % | 10.2 | % | 5.9 | % | 8.5 | % | ||||||||||
| Credit Card Loans |
37.9 | % | -na- | -na- | 22.3 | % | -na- | -na- | 17.4 | % | 20.3 | % | 26.0 | % | 22.5 | % | ||||||||||||||
| Memo: Purchase Accounting Adjustments |
0.0 | 0.0 | 0.0 | 5.9 | 0.0 | 0.0 | 0.0 | 0.0 | 23.7 | 64.3 | ||||||||||||||||||||
| Resources Other Than Capital to Absorb Losses in the More Adverse Scenario (3) |
2.1 | 5.6 | 7.1 | 9.6 | 3.3 | 4.3 | 4.7 | 13.7 | 60.0 | 362.9 | ||||||||||||||||||||
| SCAP Buffer Added for More Adverse Scenario |
||||||||||||||||||||||||||||||
| (SCAP Buffer is defined as additional Tier 1 Common/contingent Common) |
||||||||||||||||||||||||||||||
| Indicated SCAP buffer as of December 31, 2008 |
2.5 | 0.0 | 8.3 | 2.3 | 2.9 | 0.0 | 3.4 | 0.0 | 17.3 | 185.0 | ||||||||||||||||||||
| Less: Capital Actions and Effects of Q1 2009 |
0.6 | 0.6 | 6.5 | 1.7 | 0.4 | 0.2 | 1.3 | 0.3 | 3.6 | 110.4 | ||||||||||||||||||||
| SCAP Buffer (8) (9) (10) |
1.8 | 0.0 | 1.8 | 0.6 | 2.5 | 0.0 | 2.2 | 0.0 | 13.7 | 74.6 | ||||||||||||||||||||
| (1) | Includes other consumer and non-consumer loans and miscellaneous commitments and obligations |
| (2) | Includes losses on other consumer and non-consumer loans |
| (3) | Resources to absorb losses include pre-provision net revenue less the change in the allowance for loan and lease losses |
| (4) | Capital actions include completed or contracted transactions since Q4 2008 |
| (5) | For BofA, includes capital benefit from risk-weighted asset impact of eligible asset guarantee |
| (6) | For Citi, includes impact of preferred exchange offers announced on February 27, 2009 |
| (7) | Total includes only capital actions and effects of Q1 2009 results for firms that need to establish a SCAP buffer |
| (8) | There may be a need to establish an additional Tier 1 capital buffer, but this would be satisfied by the additional Tier 1 Common capital buffer unless otherwise specified for a particular BHC |
| (9) | GMAC needs to augment the capital buffer with $11.5 billion of Tier 1 Common/contingent Common of which $9.1 billion must be new Tier 1 capital |
| (10) | Regions needs to augment the capital buffer with $2.5 billion of Tier 1 Common/contingent Common of which $400 million must be new Tier 1 capital |
Note: Numbers may not sum due to rounding
Source: The Supervisory Capital Assessment Program: Overview of Results Federal Reserve Board, May 2009
6 | P a g e
Confidential
The published SCAP ranges and bank-specific SCAP results provide other banks with information from which to start a benchmarking-type stress test. The SCAP loss rates accepted by the examiners for individual banks can be helpful in identifying loss rates that are more appropriate for an individual institution if there is some basis for establishing which institutions on the list are comparables. And those loss rates can be further adjusted through expert judgment if there is a sound basis for making such adjustments.
Note the SCAP does not call for stress testing the bank’s investment portfolio if it is comprised of Treasuries, Agencies, and high grade municipal securities. The SCAP results contained loss rates for available for sale securities, but not further detail.
The SCAP Treatment of Resources to Absorb Losses
Under SCAP, the covered institutions were required to provide projections of the resources that would be available to absorb losses, including pre-provision net revenue (PPNR) and the allowance for loan and lease losses.
PPNR is defined as net interest income plus non-interest income minus non-interest expense, or the income after non-credit related expenses that would be available for provisions for loan losses. Under SCAP, the banks were instructed to project the components of PPNR and told that, for the adverse scenario, projections materially exceeding 2008 values would be seriously challenged.
Institutions were also instructed to determine the ALLL that would be required to absorb loan losses starting at the end of the scenario period. The determination of the adequacy of the ALLL at the end of the two-year period would require assumptions about the size, composition and risk of the portfolio at that time.
The SCAP Determination of Capital Needs
The purpose of the SCAP as applied to the largest 19 banks was to determine capital needs in the case an adverse economic scenario. The regulators projected pro forma capital at the end of 2010 for each institution using the estimated credit losses and PPNR. This technique effectively treats the provisions and losses as an instantaneous event that is offset by revenues over the two-year period.
To determine the amount of capital needed under SCAP, the regulators looked at two indicators of capital adequacy—the ratio of regulatory tier 1 capital to risk weighted assets (“tier 1 RBC ratio”) and a newly defined ratio of the common equity component of regulatory tier 1 capital to risk weighted assets (“tier 1 common ratio”). Banks were expected to have at least a tier 1 RBC ratio of 6% and a tier 1 common ratio of 4% after incurring losses associated with an adverse economic scenario.
The 6% tier 1 ratio is the “well capitalized” guideline for banks. It is worth noting that the regulators expect banks to meet the well capitalized guideline, which is greater than the minimum capital requirement of 4% for tier 1 capital. One of the novel features of the SCAP program is that is conveyed the clear expectation that the banks subject to that program meet the well capitalized guideline after incurring stress losses.
7 | P a g e
Confidential
A second novel feature of the SCAP program is that the subject banks are expected to hold capital that is more heavily comprised of common equity. The 4% tier 1 common ratio reflects a new emphasis by regulators of the existing expectation that tier 1 regulatory capital be made up predominantly of common equity, which is viewed by the regulators as offering more protection to senior parts of the capital structure and, therefore, lowering the risk of insolvency.
Using a SCAP-Approach to Stress Test Bank of Florida
Portfolio Overview
Bank of Florida Corporation, on a consolidated basis as of June 30, 2009 had total assets of $1.53B, total risk-weighted assets of $1.28 B, tier 1 capital of $104.9MM and total regulatory capital of $136.9MM (data based on holding company reports to the Federal Reserve, and pulled from SNL Securities). The variety of capital ratios by which the company might be evaluated are presented in table 3 below, as of June 30, 2009:
Table 3
| Regulatory Capital Ratios |
Current | ||
| Leverage Ratio |
7.23 | % | |
| Tier 1 Risk-Based Ratio |
8.18 | % | |
| Tier 1 Common Risk-Based Ratio |
8.18 | % | |
| Total Risk-Based Ratio |
10.68 | % | |
| Tangible Equity / Tangible Assets (GAAP Ratio) |
7.93 | % |
The bank had $1.3B in loans and leases of which $112.8MM was commercial loans and $930.9 MM were commercial real estate loans. Table 4 presents the loan balances and loan portfolio shares of the Bank of Florida Corporation consolidated balance sheet as of June 30, 2009.
8 | P a g e
Confidential
Table 4
| Loan Portfolio |
$ | % | ||||
| First Lien Mortgages |
$ | 159,400 | 12.56 | % | ||
| Closed-End Junior Lien Mortgages |
$ | 7,289 | 0.57 | % | ||
| Home Equity Lines of Credit (“HELOCs”) |
$ | 45,231 | 3.56 | % | ||
| Commercial & Industrial Loans |
$ | 112,804 | 8.89 | % | ||
| Construction & Land Development Loans |
$ | 280,231 | 22.09 | % | ||
| Multifamily Loans |
$ | 29,391 | 2.32 | % | ||
| Commercial Real Estate Loans (Nonfarm, Nonresidential) |
$ | 621,272 | 48.97 | % | ||
| Credit Card (Consumer) |
$ | 0 | 0.00 | % | ||
| Other Consumer Loans (Revolving & Nonrevolving) |
$ | 13,161 | 1.04 | % | ||
| Other Loans |
$ | 7 | 0.00 | % | ||
| Total Loans (Calculated) |
$ | 1,268,786 | 100.00 | % | ||
Stress Loss Rates Customized for the Bank of Florida Portfolio
Compared to the timing of the commencement of the SCAP, we now know that we are in a recession, so our starting point for this stress test is the range of loss rates corresponding to the more adverse range. Given the severity of the recession, we chose to start the analysis with the upper bound of the range of more adverse case loss rates. From that starting point, we made expert adjustments to those rates in an attempt to reflect the risk inherent in the Bank of Florida portfolio. After reviewing Bank of Florida’s historical loss experience, recent loss experience, the characteristics of the portfolio, the geographic distribution of the loans, the credit underwriting policies, and after interviewing senior bank executives, we concluded on a set of “customized loss rates.” The customized loss rates are intended to be two-year loss rates appropriate for the Bank of Florida portfolio under a very severe recession.
Due to the composition of the Bank of Florida portfolio, and given the short time frame for this analysis, not all of the loss rates warranted the same amount of scrutiny in making adjustments. Three types of lending constitute the bulk of the exposure and warrant the most scrutiny. Exposure to commercial real estate is the largest component of the portfolio, so the loss rates on the CRE components received the most scrutiny. First lien residential mortgages are the second largest exposure, followed closely by commercial and industrial lending. Exposure to other types of lending is modest and has little impact on the estimated aggregate loss, so the high-end loss rate from the suggested SCAP adverse-case ranges was adopted. The specific adjustments to the loss rates for the major categories of lending were as follows:
| • | Commercial real estate. Commercial real estate exposures in the SCAP analysis were grouped into three categories: Construction and land development loans, multi-family |
9 | P a g e
Confidential
| loans, and nonfarm, nonresidential commercial real estate loans (Permanent CRE), each with a distinct loss rate. The last of those three categories includes loans secured by offices, both owner occupied and investor owned, and loans secured by retail and hotel properties. Under SCAP, construction and land development loans were assigned the highest loss rates, with the adverse range topping out at 18%. Multifamily loans were assigned the second highest loss rate, with the top of the range being 11%. And Permanent CRE was assigned the lowest initial loss rate range, with a maximum of 9%. For the stress test of the Bank of Florida balance sheet, we customized the loss rates as follows: |
| • | Construction and land development: Recall the purpose of the stress test was to simulate a two-year loss that would be greater than the losses experienced during the depression of the 1930s. The bank has been operating in a stressed environment and has already taken impairment charges against the construction loans totaling $19MM in the past several quarters. In addition, the bank has aggressively reduced the size of the portfolio over the past several years and will not be originating any new construction loans in the near future. The bank loss rate on construction loans for year to date in 2009 is 6.75%. Assuming the worst case rate of 18% and subtracting off the already written down 6.75% yields a stress of 11.25%. |
| • | Multifamily: The multifamily portfolio is relatively small and the loss percent has been negligible 0.03%. Therefore to apply the appropriate stress we used the Basel II Advanced formula to calculate the unexpected loss potential. That calculation yielded an unexpected one-year loss of 2.56% and hence a two-year loss of 5.12% |
| • | Permanent CRE: The Permanent CRE portfolio is one of the largest portfolios and one of the most challenging for which to calibrate an appropriate loss rate. The adverse scenario SCAP range was 7 to 9%. The current loss rate on the portfolio is 0.22%. To arrive at the appropriate range we analyzed commercial real estate forecasts for vacancies and rental rates for a multitude of CRE uses. In addition, we performed the same Basel II analysis to determine the potential for unexpected loss. The Basel II analysis yielded a one year stressed loss of 6% which would be 12% over the two-year period. We chose to use 12% on the basis of that analysis, despite the fact that it was beyond the top of the SCAP adverse scenario range. The market condition forecasts for office, retail, and hotel tend to show vacancies ramping up and rental rates being depressed for at least two more years. This suggests that CRE losses will ramp up over the next two years as the economy worsens and businesses’ cash flow cushion is exhausted to support debt service. Further, review of the individual SCAP results for banks with Florida exposure indicate higher stress than what was originally outlined by the regulators. For instance BB&T and Regions have CRE stress results that are almost 14%. We will cover this more in the next section. |
10 | P a g e
Confidential
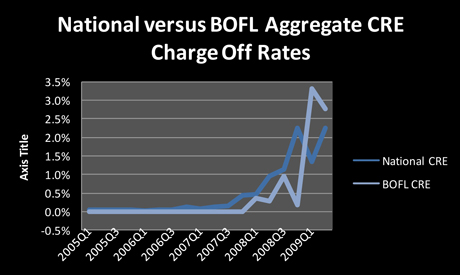
| • | Overall Commercial Real Estate Exposure: To validate our customized loss rate for Permanent CRE we appealed to the published SCAP loss rates on CRE as a class. The published SCAP results did not break out loss rated by CRE sub-category. The table below presents the results by institution for banks that have a Florida presence and the weighted average for Bank of Florida. Using the above assigned stresses the overall weighted average for CRE for Bank of Florida is 12.2%. Using Fifth Third, BB&T, Regions, and SunTrust as peers with exposure to Florida real estate, the peer average SCAP CRE loss rate was 12.5%, which is slightly higher than the weighted average rate we chose for Bank of Florida. We are comfortable with this lower customized CRE loss rate because: a) approximately $20 MM in charge offs of construction loans have already been taken at Bank of Florida; and b) Bank of Florida does not have exposure to some of the loans types in regions most discussed (e.g., premium office space in Miami). The Bank of Florida portfolio appears to be a well balanced CRE portfolio that does not appear to have a high degree of concentration in any one risk type or area. |
| • | Residential mortgages—The bank has already written off $3.5MM in residential mortgages over the past four quarters. Again we used a combination of a metrics and inputs to inform our analysis. |
| • | First Lien Mortgages—The SCAP provided stress loss rates ranges for Prime, Alt-A, and Subprime. Discussions with the bank and review of its credit policy indicated the majority of residential mortgage loans were conforming loans to existing bank clients and, given the location of the bank, many were to wealthy clients. We reviewed the top 20 loans, which were characterized by high FICO scores, low LTVs and no delinquencies. Further, we reviewed the asset quality of loans pledged to FHLB and found 80% of the portfolio to be of FICO 660 and above and 20% of the portfolio to be 660 and below. Finally, the Florida economy |
11 | P a g e
Confidential
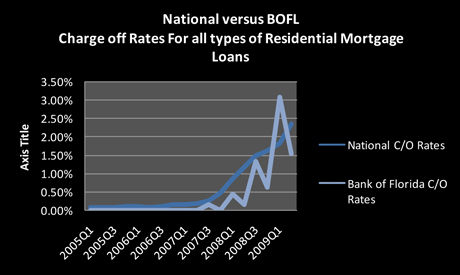
has been in recession already for several quarters. During the last four quarters the bank has written off $2.5MM in loans. The chart below indicates that the national average charge off rates in residential real estate started to ramp in late 2007. Bank of Florida saw charge offs starting to rise at that time as well. The average losses for the National and Bank of Florida residential loans have been 0.61% and 0 .41% respectfully. The Basel II formula indicates a through the cycle loss (0.41%) yields unexpected losses of 2.96% and a two-year loss rate of 6%. Because of the quality and characteristics of the portfolio we applied the low end of the SCAP range to the Prime accounts (3%) and the low range of the Subprime accounts (21%). Based upon the Prime Subprime mix this yielded a first lien stress of 6.6%.
| • | Closed End Jr. Lien Mortgages: Because the bank has not had any defaults on Closed End Jr. Lean Mortgages in the past four quarters, the rates were set at the low end of 20%. |
| • | HELOCs were set at 7.2% again based upon a continuation of the current loss rates. These rates are in line with the SCAP and are corroborated by the Basel II Advanced calculations using through the cycle loss rates. The mid point of all banks in the SCAP was 8.5% for mortgages. |
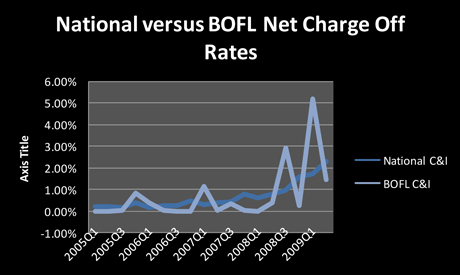
| • | Commercial and industrial loans—C&I loans comprise less than 10% of the portfolio. The loss rates historically observed have been stressed and we assume that those rates continue for the next two years. However, the bank has already impaired or written off almost $3MM. The National and Bank of Florida average loss rates over the past five years are 0.68% and 0.72% respectively. Considering these factors led us to take the worst case C&I stress of 8% and subtract out the charge offs that have already occurred (2.6%) to yield a future stress of 5.3%. |
12 | P a g e
Confidential
The two-year loss rates used in the stress test are contained in the following table:
| Range Customized | |||||
| First Lien Mortgages |
7-8.5 | 6.55 | % | ||
| Closed-End Junior Lien Mortgages |
22-25 | 20.00 | % | ||
| Home Equity Lines of Credit (“HELOCs”) |
8-11 | 7.20 | % | ||
| Commercial & Industrial Loans |
5-8 | 5.30 | % | ||
| Construction & Land Development Loans |
15-18 | 11.25 | % | ||
| Multifamily Loans |
10-11 | 5.12 | % | ||
| Commercial Real Estate Loans (Nonfarm, Nonresidential) |
7-9 | 12.00 | % | ||
| Credit Card Loans (Consumer) |
18-20 | 20.00 | % | ||
| Other Consumer Loans (Revolving & Nonrevolving) |
8-12 | 8.00 | % | ||
| Other Loans |
4-10 | 4.00 | % | ||
The above two-year loss rates would be associated with a two year cumulative “stress loss” of $130MM. Appendix I contains copies of the tables from the spreadsheet model used to produce the stress loss calculations, as well as illustrative calculations of the capital needed to cover stress losses and meat capital guidelines at the end of the stress period. The SCAP process also required banks to imposed loss rates on HFI and AFS securities portfolios. For the peer banks that we identified for the purposed of calibrating the CRE loss rates (described above) we calculated a charge of rate of .86%, which we applied to the Bank of Florida portfolio. This raised the total stress loss to $131MM.
13 | P a g e
Confidential
Capital Needs
While the SCAP stress test produces an estimate of loss that is, in itself, useful, the purpose of SCAP was to evaluate capital adequacy. An assessment of capital adequacy can only be done in the context of target capital ratios. For the purposes of this stress test, we used the target ratios imposed on the SCAP banks and calculated the amount of capital needed to meet those targets. On that basis, with total stress losses of $131 MM, we calculate that Bank of Florida would need $27.4 MM in common equity to meet the “tier 1 common” SCAP test. Similarly, Bank of Florida would need $53.7MM to meet the SCAP “tier 1 RBC” SCAP test. (Note however, that since tier 1 regulatory capital is comprised of elements other than common equity, not all of that capital need would be in the form of common equity.) In addition, while the SCAP program did not focus attention on the Total risk based capital requirement, it is important to note that the 10% well-capitalized target for that ratio would suggest a need for an additional $72MM in capital.
Finally, it is important to note that the regulators might require the bank to meet a regulatory capital requirement in excess of the well capitalized ratios. At a number of community banks with concentrations in CRE, the regulators have imposed total risk based capital ratios of 12% and sometimes 13%. If Bank of Florida were to face a total risk based capital ratio of 13%, its pro forma total regulatory capital need would be $110MM.
14 | P a g e
Confidential
Bibliography
Board of Governors of the Federal Reserve System, “The Supervisory Capital Assessment,” Program: Design and Implementation,” April 24, 2009.
Board of Governors of the Federal Reserve System, “The Supervisory Capital Assessment Program: Overview of Results”, May 2009.
Federal Deposit Insurance Corporation, 12 CFR Part 325, “Risk Based Capital Standards. Advanced Capital Adequacy Framework—Basel II.”
15 | P a g e
Confidential
Appendix I
Bank of Florida Corporation
Stress Test Model
($000s, Current Period is 2009Q2)
| Model Inputs
|
|||||||||
| General Inputs |
|||||||||
| Institution SNL Code |
4047172 | ||||||||
| Consolidated Bank Holding Company or Commercial Bank? |
BHC | ||||||||
| Current Quarter (SNL format) |
2009Q2 | ||||||||
| Current LTM Period (SNL format) |
2009L2 | ||||||||
| One-Year Prior LTM Period (SNL format) |
2008L2 | ||||||||
| Pro Forma Common Equity Capital Raise |
$0 | ||||||||
| Asset Quality Inputs |
|||||||||
| ALLL Forecast (%) |
2.00% | ||||||||
| Standardized or Customized? |
Customized | ||||||||
| Standardized Indicative Loss Rates Settings |
Adverse High | ||||||||
| Standardized | Customized | ||||||||
| Gross Charge-Offs: |
|||||||||
| First Lien Mortgages |
8.74 | % | 8.50 | % | 8.74 | % | |||
| Closed-End Junior Lien Mortgages |
20.75 | % | 25.00 | % | 20.75 | % | |||
| Home Equity Lines of Credit (“HELOCs”) |
7.20 | % | 11.00 | % | 7.20 | % | |||
| Commercial & Industrial Loans |
5.21 | % | 8.00 | % | 5.21 | % | |||
| Construction & Land Development Loans |
13.50 | % | 18.00 | % | 13.50 | % | |||
| Multifamily Loans |
5.12 | % | 11.00 | % | 5.12 | % | |||
| Commercial Real Estate Loans (Nonfarm, Nonresidential) |
12.00 | % | 9.00 | % | 12.00 | % | |||
| Credit Card Loans (Consumer) |
20.00 | % | 20.00 | % | 20.00 | % | |||
| Other Consumer Loans (Revolving & Nonrevolving) |
8.00 | % | 12.00 | % | 8.00 | % | |||
| Other Loans |
4.00 | % | 10.00 | % | 4.00 | % | |||
16 | P a g e
Confidential
| Income Statement |
Current | |||
| Current LTM Period |
||||
| Net Interest Income |
$ | 39,739 | ||
| Noninterest Income (Excludes Realized Gains / Losses on Securities) |
$ | 4,807 | ||
| Noninterest Expense |
$ | 46,002 | ||
| ADD BACK: Goodwill Impairment |
NA | |||
| ADD BACK: Intangibles Amortization |
$ | 459 | ||
| Pre-Provision Net Revenue (“PPNR”) |
$ | (997 | ) | |
| ROAA |
-0.07 | % | ||
| Provision for Loan Losses |
$ | 38,743 | ||
| One-Year Prior LTM Period |
||||
| Net Interest Income |
$ | 45,042 | ||
| Noninterest Income (Excludes Realized Gains / Losses on Securities) |
$ | 5,372 | ||
| Noninterest Expense |
$ | 43,789 | ||
| ADD BACK: Goodwill Impairment |
NA | |||
| ADD BACK: Intangibles Amortization |
$ | 554 | ||
| Pre-Provision Net Revenue (“PPNR”) |
$ | 7,179 | ||
| ROAA |
0.53 | % | ||
| Forward 24-Month Forecast |
||||
| ROAA (Historic Two Year Average) |
0.47 | % | ||
| Implied Forward 24-Month PPNR |
$ | 7,159 | ||
17 | P a g e
Confidential
| Asset Quality |
LTM ($) | LTM (%) | 2yr PF (%) | 2yr PF ($) | ||||||||
| Gross Charge-Offs Securities |
0.86 | % | $ | 891.14 | ||||||||
| First Lien Mortgages |
$ | 2,542 | 1.59 | % | 6.55 | % | $ | 10,441 | ||||
| Closed-End Junior Lien Mortgages |
$ | 0 | 0.00 | % | 20.00 | % | $ | 1,458 | ||||
| Home Equity Lines of Credit (“HELOCs”) |
$ | 986 | 2.18 | % | 7.20 | % | $ | 3,257 | ||||
| Commercial & Industrial Loans |
$ | 2,941 | 2.61 | % | 5.30 | % | $ | 5,979 | ||||
| Construction & Land Development Loans |
$ | 18,913 | 6.75 | % | 11.25 | % | $ | 31,526 | ||||
| Multifamily Loans |
$ | 10 | 0.03 | % | 5.12 | % | $ | 1,505 | ||||
| Commercial Real Estate Loans (Nonfarm, Nonresidential) |
$ | 1,376 | 0.22 | % | 12.00 | % | $ | 74,553 | ||||
| Credit Card Loans (Consumer) |
$ | 0 | NA | 20.00 | % | $ | 0 | |||||
| Other Consumer Loans (Revolving & Nonrevolving) |
$ | 494 | 3.75 | % | 8.00 | % | $ | 1,053 | ||||
| Other Loans |
NA | NA | 4.00 | % | $ | 0 | ||||||
| Total Losses ($) / Weighted Average (%) |
$ | 27,262 | 2.15 | % | 10.23 | % | $ | 130,661 | ||||
18 | P a g e
Confidential
| Impact of Credit Losses on Capital |
% | $ | |||||||||||||
| ALLL Beginning Balance |
1.95 | % | $ | 24,779 | |||||||||||
| LESS: Stress Losses |
10.30 | % | $ | 130,661 | 10.30 | % | stress loss rate | ||||||||
| ADD: Provision for Loan Losses |
10.35 | % | $ | 131,258 | |||||||||||
| ALLL Ending Balance |
2.00 | % | $ | 25,376 | |||||||||||
| Regulatory Capital Calculation |
Current | Pro Forma |
|||||||||||||
| GAAP Capital |
$ | 180,803 | $ | 180,803 | |||||||||||
| Impact of Common Equity Raise |
$ | 0 | |||||||||||||
| Impact of PPNR on Capital after tax |
$ | 4,653 | tax rate | 0.35 | |||||||||||
| Impact of losses on Capital after tax |
$ | 85,318 | |||||||||||||
| Adjusted GAAP Capital |
$ | 180,803 | $ | 100,138 | |||||||||||
| Tier 1 Capital Adjustments |
$ | (75,877 | ) | $ | (75,877 | ) | |||||||||
| Tier 1 Capital |
$ | 104,926 | $ | 24,261 | |||||||||||
| Tier 1 Common Capital Adjustments |
$ | 0 | $ | 0 | |||||||||||
| Tier 1 Common Capital |
$ | 104,926 | $ | 24,261 | Subdebt | |
ALLL Limit 1.25% of RWA | ||||||||
| Tier 2 Capital |
$ | 32,062 | $ | 32,062 | 16,000 | $ | 16,038.95 | ||||||||
| Tier 1 Capital Adjustments |
$ | 0 | $ | 0 | |||||||||||
| Total Capital |
$ | 136,988 | $ | 56,323 | $ | 80,012 | |||||||||
| Regulatory Capital Ratios |
Current | Pro Forma |
Capital Need | ||||||||||||
| Leverage Ratio |
7.23 | % | 1.67 | % | $ | 48,289 | |||||||||
| Tier 1 Risk-Based Ratio |
8.18 | % | 1.89 | % | $ | 52,726 | |||||||||
| Tier 1 Common Risk-Based Ratio |
8.18 | % | 1.89 | % | $ | 27,063 | |||||||||
| Total Risk-Based Ratio |
10.68 | % | 4.39 | % | $ | 71,988 | |||||||||
| Tangible Equity / Tangible Assets (GAAP Ratio) |
7.93 | % | 2.42 | % | NA | ||||||||||
19 | P a g e