Attached files
Table of Contents
As filed with the Securities and Exchange Commission on October 30, 2009
Registration No. 333-160152
UNITED STATES
SECURITIES AND EXCHANGE COMMISSION
Washington, D.C. 20549
AMENDMENT NO. 3
TO
FORM S-1
REGISTRATION STATEMENT
UNDER
THE SECURITIES ACT OF 1933
WESTWOOD ONE, INC.
(Exact name of registrant as specified in its charter)
| Delaware | 7900 | 95-3980449 | ||
| (State or Other Jurisdiction of Incorporation or Organization) |
(Primary Standard Industrial Classification Code Number) |
(I.R.S. Employer Identification Number) |
40 West 57th Street, 5th Floor
New York, New York 10019
(212) 641-2000
(Address, including zip code, and telephone number, including area code, of registrant’s principal executive offices)
David Hillman, Esq.
Chief Administrative Officer; EVP, Business Affairs;
General Counsel and Secretary
Westwood One, Inc.
40 West 57th Street, 5th Floor
New York, New York 10019
(212) 641-2000
(Name, address, including zip code, and telephone number, including area code, of agent for service)
Copies to:
| Monica J. Shilling Michael A. Woronoff Proskauer Rose LLP 2049 Century Park East, Suite 3200 Los Angeles, California 90067 (310) 557-2900 |
Ann Lawrence Robert A. Claassen Paul, Hastings, Janofsky & Walker LLP 515 South Flower Street, 25th Floor Los Angeles, California 90071 (213) 683-6000 |
Approximate date of commencement of proposed sale to the public: As soon as practicable after the effective date of this Registration Statement.
If any of the securities being registered on this Form are to be offered on a delayed or continuous basis pursuant to Rule 415 under the Securities Act of 1933, check the following box. ¨
If this Form is filed to register additional securities for an offering pursuant to Rule 462(b) under the Securities Act, please check the following box and list the Securities Act registration statement number of the earlier effective registration statement for the same offering. ¨
If this Form is a post-effective amendment filed pursuant to Rule 462(c) under the Securities Act, check the following box and list the Securities Act registration statement number of the earlier effective registration statement for the same offering. ¨
If this Form is a post-effective amendment filed pursuant to Rule 462(d) under the Securities Act, check the following box and list the Securities Act registration statement number of the earlier effective registration statement for the same offering. ¨
Indicate by check mark whether the registrant is a large accelerated filer, an accelerated filer, a non-accelerated filer, or a smaller reporting company. See the definitions of “large accelerated filer,” “accelerated filer” and “smaller reporting company” in Rule 12b-2 of the Exchange Act.
| Large accelerated filer ¨ |
Accelerated filer x | |
| Non-accelerated filer ¨ (Do not check if a smaller reporting company) |
Smaller reporting company ¨ |
CALCULATION OF REGISTRATION FEE
| Title of Each Class of Securities to be Registered |
Proposed (1)(2) |
Amount of Registration Fee | ||
| Common Stock, par value $0.01 per share |
$50,000,000 | $2,790(3) | ||
| (1) | Estimated solely for the purpose of computing the amount of the registration fee pursuant to Rule 457(o) under the Securities Act. |
| (2) | Includes offering price for the shares that the underwriters have the option to purchase to cover over-allotments, if any. |
| (3) | Previously paid. |
The registrant hereby amends this registration statement on such date or dates as may be necessary to delay its effective date until the registrant shall file a further amendment which specifically states that this registration statement shall thereafter become effective in accordance with section 8(a) of the Securities Act of 1933 or until the registration statement shall become effective on such date as the Commission acting pursuant to said section 8(a), may determine.
Table of Contents
The information in this preliminary prospectus is not complete and may be changed. We may not sell these securities until the registration statement filed with the Securities and Exchange Commission is effective. This preliminary prospectus is not an offer to sell these securities and it is not soliciting an offer to buy these securities in any jurisdiction where the offer or sale is not permitted.
SUBJECT TO COMPLETION, DATED OCTOBER 30, 2009
PRELIMINARY PROSPECTUS
Shares

Common Stock
$ per share
Westwood One, Inc. is selling shares of our common stock and the selling stockholders named in this prospectus are selling shares of our common stock. We and the selling stockholders named in this prospectus have granted the underwriters a 30-day option to purchase up to an additional shares of our common stock to cover over-allotments, if any. We will not receive any of the proceeds from the sale of shares by the selling stockholders.
Our common stock is currently traded on the OTC Bulletin Board under the symbol “WWOZ.OB.” The last reported sale price on , 2009 was $ per share. We have applied to list our common stock on the NASDAQ Global Market under the symbol “WWON.”
INVESTING IN OUR COMMON STOCK INVOLVES RISKS. SEE “RISK FACTORS” BEGINNING ON PAGE 16.
| Per Share | Total | |||
| Public offering price | $ | $ | ||
| Underwriting discounts | $ | $ | ||
| Proceeds, before expenses, to us | $ | $ | ||
| Proceeds, before expenses, to selling stockholders | $ | $ |
Delivery of the shares of common stock will be made on or about , 2009.
Neither the Securities and Exchange Commission nor any state securities commission has approved or disapproved of these securities or passed upon the adequacy or accuracy of this prospectus. Any representation to the contrary is a criminal offense.
| UBS Investment Bank | Thomas Weisel Partners LLC | |
| Roth Capital Partners | Moelis & Company | |
The date of this prospectus is , 2009.
Table of Contents

Table of Contents
This prospectus is part of a registration statement on Form S-1 that we filed with the Securities and Exchange Commission (“SEC”). You should rely only on the information contained in this prospectus. We have not, and the underwriters have not, authorized anyone to provide you with information different from that contained in this prospectus. We are offering to sell shares of common stock and seeking offers to buy shares of common stock only in jurisdictions where offers and sales are permitted. The information contained in this prospectus is accurate only as of the date of this prospectus, regardless of the time of delivery of this prospectus or of any sale of the common stock.
| Page | ||
| 1 | ||
| 16 | ||
| 27 | ||
| 28 | ||
| 29 | ||
| 30 | ||
| 32 | ||
| 36 | ||
| Management’s Discussion and Analysis of Financial Condition and Results of Operations |
46 | |
| 73 | ||
| 89 |
| Page | ||
| 95 | ||
| 100 | ||
| 101 | ||
| 103 | ||
| 108 | ||
| 110 | ||
| 112 | ||
| 117 | ||
| 117 | ||
| Where You Can Find More Information and Incorporation by Reference |
118 | |
| Index To Consolidated Financial Statements and Financial Statement Schedule |
F-1 |
Unless otherwise stated in this prospectus, references to “the Company,” “we,” “our,” “ours,” “registrant” and “us” refer to Westwood One, Inc. and its consolidated subsidiaries, except where it is clear that such terms mean only Westwood One, Inc.
i
Table of Contents
This summary highlights information contained elsewhere in this prospectus and does not contain all of the information you should consider before buying shares of our common stock. Before deciding to invest in shares of our common stock, you should read the entire prospectus carefully, including our consolidated financial statements and the related notes and the information set forth under the headings “Risk Factors” and “Management’s Discussion and Analysis of Financial Condition and Results of Operations,” in each case included elsewhere in this prospectus.
OUR COMPANY
We produce and provide traffic, news, weather, sports, talk, music, special events and other programming. Our content is distributed to radio and television stations and digital platforms and reaches over 190 million people. We are one of the largest domestic outsourced providers of traffic reporting services and one of the nation’s largest radio networks, delivering content to approximately 5,000 radio and 170 television stations in the US. We exchange our content with radio and television stations for commercial airtime, which we then sell to local, regional and national advertisers. By aggregating and packaging commercial airtime across radio and television stations nationwide, we are able to offer our advertising customers a cost-effective way to reach a broad audience and target their audience on a demographic and geographic basis as demonstrated by the chart comparing CPMs among different media types that appears in the section entitled “Business—Industry Overview.”
We are organized into two business segments: Metro and Network.
Our Metro business produces and distributes traffic and other local information reports (such as news, sports and weather) to approximately 2,200 radio and television stations, which include stations in over 80 of the top 100 Metro Service Area (“MSA”) markets in the US. Our Metro business generates revenue from the sale of commercial advertising inventory to advertisers (typically 10 and 15 second spots in radio embedded within our information reports and 30 second spots in television). We provide broadcasters a cost-effective alternative to gathering and delivering their own traffic and local information reports and offer advertisers a more efficient, broad reaching alternative to purchasing advertising directly from individual radio and television stations.
Our Network business nationally syndicates proprietary and licensed content to radio stations, enabling them to meet their programming needs on a cost-effective basis. The programming includes national news and sports content, such as CBS Radio News, CNN Radio News and NBC Radio News and major sporting events, including the National Football League (including the Super Bowl), NCAA football and basketball games (including the Men’s Basketball Tournament, ie, “March Madness”) and the 2010 Winter Olympic Games. Our Network business features popular shows that we produce with personalities including Dennis Miller, Charles Osgood, Fred Thompson and Billy Bush. We also feature special events such as live concert broadcasts, countdown shows (including MTV and Country Music Television branded programs), music and interview programs. Our Network business generates revenue from the sale of 30 and 60 second commercial airtime, often embedded in our programming, that we bundle and sell to national advertisers who want to reach a large audience across numerous radio stations.
We believe that our market position in both the Metro and Network businesses and our recent turnaround strategies and revenue enhancement initiatives afford us with a number of revenue growth opportunities. We are developing additional potential revenue streams by leveraging our existing resources and accessing new distribution channels for our extensive content. In addition, we believe there
1
Table of Contents
is an opportunity to pursue acquisitions, partnerships and joint ventures to consolidate our existing business with competitors and expand into new markets. We routinely evaluate and analyze such opportunities, but we have no current binding plans or arrangements with respect to any such opportunities. We have an option, exercisable through December 1, 2009, to acquire TrafficLand, a provider of traffic video collected from local and state Departments of Transportation. Entering into any transactions with respect to such opportunities would be subject to completion of due diligence, finalization of key business and financial terms (including price) and negotiation of final definitive documentation as well as a number of other factors and conditions including, without limitation, the approval of our board of directors and any required third party consents (including any required lenders’ consent). We cannot predict how quickly the terms of any such transaction could be finalized, if at all. Accordingly, there can be no assurance that definitive documentation for any such transaction would be executed or even if executed, that any such transaction will be consummated. In connection with evaluating potential strategic acquisition and investment transactions, we have, and may in the future, incur significant expenses for the evaluation and due diligence investigation of these potential transactions.
OUR STRENGTHS
We believe our strengths include:
| Ø | Large Independent Provider of Content. We are one of the largest domestic outsourced providers of traffic reporting services and one of the nation’s largest radio networks, producing and distributing traffic, news, weather, sports, talk, music, special events and other programming. As an independent provider of content, without any stations under our ownership, we are able to transact with all station groups. We deliver content to approximately 5,000 radio and 170 television stations in the US. |
| Ø | Developer of Original Content. We create and develop content for radio and television stations. The programming includes several nationally known personalities including Dennis Miller, Charles Osgood, Fred Thompson and Billy Bush. We also provide stations with targeted programming, including national news, major sporting events and local news and traffic programming that they can generally not afford to develop on their own. |
| Ø | Multichannel Distributor of Content. As a producer of original content, we have the ability to utilize multiple media channels by leveraging our existing production capabilities and vast library of content to generate additional revenue without incurring significant costs. For example, much of the same content we distribute to our radio station customers is available to consumers online via podcasting or live streaming, which enables us to generate additional revenue from the sale of advertising embedded in such streams or podcasts. |
| Ø | Significant Operating Leverage. Our business model has a relatively fixed cost base leading to significant operating leverage. We have made progress and are working to further reduce our fixed costs which we believe will enhance our profitability if revenue increases in the future due to an economic recovery or organic growth factors. |
| Ø | Experienced Management Team. We have brought together a new, experienced management team with extensive strategic, operating and financial expertise. Our management team has an average of 16 years of industry experience. Our relationship with The Gores Group provides us with additional operational, financial and strategic support. We believe this management team has the ability to respond to economic and industry trends and cycles while maximizing revenue growth from the sale of commercial airtime. |
2
Table of Contents
OUR STRATEGY
Our goal is to grow the revenue and profitability of our business. Key elements of our strategy to achieve this goal include:
| Ø | Complete operational turnaround. We have recently begun and believe we will continue to increase our operational efficiency with the assistance of The Gores Group. We announced on March 16, 2009, certain re-engineering and cost-cutting initiatives, as described below in “Turnaround Strategies and Revenue Enhancement Initiatives”, that are collectively anticipated to result in total annual savings of approximately $55 to $63 million. In the third quarter of 2008, we announced a plan to restructure the traffic operations of the Metro Traffic business (commonly referred to by us as the Metro re-engineering) and to implement other cost reductions. The reengineering entailed reducing the number of our Metro Traffic operational hubs from 60 to 13 regional centers and produced meaningful reductions in labor expense, aviation expense, station compensation, program commissions and rent. We have also implemented additional cost reduction initiatives in the first half of 2009, including reductions in Network programming costs, labor expense, station compensation and other operating costs, to help improve our operating and financial performance and help establish a foundation for potential long-term growth. We have recognized $25.0 million of savings from both the Metro re-engineering and additional cost reduction initiatives undertaken by us through the end of the second fiscal quarter of 2009. We anticipate that the total annual savings in 2009 (from the start of the Metro re-engineering and other cost reductions in the third quarter of 2008) will be in the $53.0 million to $61.0 million range and additional savings in 2010 will be approximately $2.0 million, as additional phases of the Metro re-engineering and cost-reduction programs are implemented. These anticipated savings are comprised of labor savings, lower programming costs and reductions in aviation expense, station compensation and savings from consolidation of office leases. Many of the initiatives were instituted as of June 30, 2009. Not included in the foregoing are amounts related to the compensation reduction and furlough actions (aggregating 10 days of pay per each participating full-time employee) that we announced on September 29, 2009, which actions shall result in additional cost savings in 2009. |
These savings will be offset to a limited degree by investments in our sales force, technology and digital capabilities and certain strategic partnerships such as TrafficLand, a provider of traffic video collected from local and state Departments of Transportation.
| Ø | Expand our Sales Force. We have recently begun and plan to continue to build-out and leverage our extensive local and national sales force to generate increased revenue from the sale of commercial airtime. In our Network business, we are adding category management specialists in high-potential segments of the advertising market. In our Metro business, we have added new sales people at various locations across the country to deepen our local market coverage. We are also adding select sales people in our Metro business to expand the distribution of our local content. Additionally, in our Network business we recently began to offer copy-splitting advertising services which enable our advertising clients to reach more than one desired geographic area at the same time. |
| Ø | Pursue strategic opportunities. We evaluate acquisitions, partnerships and joint ventures on an ongoing basis and intend to pursue acquisitions of and partnerships or joint ventures with businesses in our industry and related industries that can assist us in achieving our growth strategy. We focus on opportunities with content and services businesses serving the radio, television and digital markets. We approach strategic opportunities in a disciplined manner and, with the assistance of The Gores Group, intend to focus on opportunities that strengthen our competitive position. |
| Ø | Produce cost-effective, original programming. We will continue to leverage our national scale to provide radio and television stations with programming and services that they may not be able to cost-effectively produce on their own, most notably on the Network side, where rights fees for sporting |
3
Table of Contents
| events and fees for prominent talent personalities are significant and have generally continued to increase over time (except in certain cases in 2009 where we have been able to negotiate lower fees, in part because of a weaker economy). As a syndicator of programming to approximately 5,000 radio stations and 170 television stations nationwide, we are able to pay such programming costs for a broad array of content, while one station, in most cases, could not. We distribute our programming on a barter basis in exchange for commercial airtime in lieu of cash, which allows stations to preserve capital. |
| Ø | Expand our distribution channels. We plan to continue expanding our product offerings across radio, television, online and other platforms through initiatives such as on-camera graphics and mobile video. Our Metro business is also expanding into the digital and wireless categories as a provider of traffic information on mobile and personal navigation devices. As part of this strategy, our Metro business recently entered into a License and Services Agreement with TrafficLand. The agreement provides our Metro business with the exclusive right to enter into affiliation agreements with third party broadcasters wanting access to TrafficLand’s live video traffic feeds, which (i) provides us with simultaneous access to 4,700 traffic cameras and (ii) enables us to enhance our product offerings to stations that carry our programming and data feeds. We have an option, exercisable through December 1, 2009, to acquire TrafficLand. We have also partnered with AirSage, a provider of digital traffic data, to enhance our real-time road condition and data reports and with TrafficCast, a traffic science company, to collaborate on licensing of integrated data for others. We believe these initiatives will allow us to significantly expand our digital content offerings. |
OUR INDUSTRY
Radio broadcasting and advertising
According to the Federal Communications Commission (“FCC”), there were 11,213 commercial radio stations serving listeners in the United States as of December 31, 2008. The Radio Advertising Bureau (“RAB”) reported on its website, based on information provided by Miller, Kaplan, Arase & Co., that the market for US radio advertising in 2008 was $19.5 billion. We compete in the local ($13.6 billion), national ($2.9 billion) and network ($1.2 billion) radio advertising segments which comprise the majority of the total industry.
AM/FM radio is one of the most popular forms of media in terms of audience consumption. According to Arbitron’s Spring 2007 study, the average time spent listening to the radio by persons 12 years and older (“12+”) in the US is 19 hours per week. Similarly, network radio listenership remains strong among key demographics. According to Arbitron’s 2008 “Network Radio Today” report, network radio reaches nearly 75% of the 12+ US population each week and performs well within the key 18-24, 18-49 and 25-54 year old demographics, reaching 73%, 74% and 74%, respectively. Furthermore, the report also shows that more than 60% of adult consumers over the age of 18 listen to network radio out of the home, or approximately 143 million adults each week.
Radio offers a cost efficient way of reaching diverse audience groups in large numbers. Radio advertising can be purchased by advertisers on a local, regional or national basis. Local and regional purchases allow an advertiser to choose a geographic market for the broadcast of commercial messages. Advertising purchased from a national radio network allows an advertiser to target its commercial messages to a specific demographic within a large national audience. Radio advertising has historically been cyclical as spending on advertising can grow or decline depending on the state of the economy.
Television broadcasting and advertising
According to the Television Bureau of Advertising’s April 2009 report, total broadcast television advertising revenue in 2008 was $46.4 billion. Network television is the largest segment within broadcast
4
Table of Contents
television representing revenue of $25.4 billion in 2008. We compete in the local ($16.5 billion) and syndication ($4.4 billion) television advertising segments.
During the 2008-09 broadcast season, television was viewed in 114.5 million, or 98.9%, of all US households according to The Nielsen Company’s August 2008 report. Television remains the most popular form of media in terms of audience consumption with the average household (ie, all persons living in the house collectively) watching 8 hours and 18 minutes of television each day during the 2007-08 television season according to The Nielsen Company’s November 2008 report.
Television’s broad reach and visual impact makes it a powerful and attractive medium for advertisers. Television spots are generally 30 to 60 seconds in length and are purchased by advertisers on a local, regional or national basis. Similar to the radio broadcasting industry, local and regional purchases allow an advertiser to choose a geographic market for the broadcast of commercial messages. Advertising purchased from a national television network allows an advertiser to target its commercial messages to a specific demographic within a large national audience.
TURNAROUND STRATEGIES AND REVENUE ENHANCEMENT INITIATIVES
Since September 2008, we have implemented a significant number of key turnaround strategies and revenue enhancement initiatives, including:
| Ø | Re-Engineering of Traffic Operations |
| - | Regionalize 60 operating centers to 13 hubs |
| - | Reduce reliance on aircraft and implement new video and speed and flow technology |
| Ø | Cost Reduction Programs |
| - | Reduce salary/headcount |
| - | Reduce programming costs and eliminate unprofitable programming |
| - | Negotiate reductions in compensation paid to radio stations that provide us with commercial airtime to more effectively match compensation to revenue and profitability |
| Ø | Revenue Initiatives |
| - | Increase our sales force to expand our market presence across regions and products |
| - | Grow revenue and profitability from advertising through optimization of sales mix, inventory utilization and pricing |
| - | Deliver expanded product offerings such as copy-splitting, 15 second spots and pre-recorded advertisements |
| - | Add new programming such as The Fred Thompson Show and programming pursuant to recent deals with The Weather Channel and Sports USA |
| Ø | Management Reorganization |
| - | Engage new, experienced management team to provide greater leadership |
| - | Reorganize corporate structure to increase accountability |
RESTRUCTURING
At December 31, 2008, our principal sources of liquidity were our cash and cash equivalents of $6.4 million and borrowings under our Credit Agreement dated as of March 3, 2004 (the “Old Credit
5
Table of Contents
Agreement”). As previously disclosed in our Annual Report on Form 10-K for the year ended December 31, 2008 (the “2008 10-K”) and as discussed elsewhere in this prospectus, on February 27, 2009, our outstanding indebtedness under our Old Credit Agreement, which totaled approximately $41.0 million, matured and became due and payable in its entirety. Additionally, we had not made our most recent interest payment due to holders of our then outstanding senior notes (the “Old Notes”) on November 30, 2008. The non-payment of such amounts constituted an event of default under the Old Credit Agreement and the Old Notes, respectively. Based upon facts and circumstances that existed as of December 31, 2008, we previously disclosed in our 2008 10-K that there was a substantial doubt about our ability to continue as a going concern. We previously disclosed that, as of March 30, 2009, we were unable to meet our outstanding debt obligations, which raised substantial doubt about our ability to continue as a going concern and our sources of liquidity were anticipated to be inadequate to fund immediate and ongoing operating requirements.
In order to address these concerns, on April 23, 2009, we completed a refinancing of substantially all of our outstanding long-term indebtedness (approximately $241.0 million in principal amount) and a recapitalization of our equity (the “Restructuring”). As part of the Restructuring, our then existing debtholders released all of their existing obligations in exchange for (1) $117.5 million of 15% Senior Notes maturing July 15, 2012 (the “Senior Notes”), (2) 34,962 shares of Series B Preferred Stock (as defined below), and (3) a one-time cash payment of $25.0 million. We also entered into a new senior credit facility (the “Senior Credit Facility”) pursuant to which we have a $15.0 million revolving line of credit and a $20.0 million unsecured non-amortizing term loan which currently bear interest at 7.0% per annum based on the currently applicable LIBOR rate plus a 4.5% margin. As of the date of this prospectus, we have borrowed the entire amount under the term loan and we have borrowed $5.0 million under the revolving line of credit. The Senior Notes bear interest at 15.0% per annum, payable 10.0% in cash and 5.0% pay-in-kind (PIK interest). The PIK interest will be added to principal quarterly, but will not be payable until the Senior Notes become due. As a result of the Restructuring, the annual interest payments on our debt increased from approximately $12.0 million to $19.0 million (which amount includes interest payable on the $20.0 million term loan entered into on April 23, 2009), $6.0 million of which will be PIK interest and not payable in cash until the Senior Notes become due. To date, we have also made one deferral of $4.0 million in payments due to CBS Radio under the CBS Master Agreement (see “Business—CBS”).
In addition, Gores Radio Holdings, LLC (1) agreed to purchase, at a discount, approximately $22.6 million principal amount of our then existing debt held by debt holders who did not wish to participate in the Senior Notes, (2) agreed to guarantee the Senior Credit Facility and payments due to the NFL in an amount of up to $10.0 million for the license and broadcast rights to certain NFL games and NFL-related programming and (3) invested $25.0 million in the Company for 25,000 shares of 8.0% Series B Convertible Preferred Stock (the “Series B Preferred Stock”). In connection with Gores providing the guarantees and purchasing the debt from non-participating holders, the 75,000 shares of 7.5% Series A Convertible Preferred Stock (the “Series A Preferred Stock” and collectively with the Series B Preferred Stock, the “Preferred Stock”) held by Gores immediately prior to the Restructuring, which then had a liquidation preference of approximately $79.0 million, were exchanged for 75,000 shares of 7.5% Series A-1 Convertible Preferred Stock (the “Series A-1 Preferred Stock”) with a per share conversion price which provided Gores with an approximately 54.6% interest in the Company after the Restructuring.
Taking into account Gores’ Series B Preferred Stock, Series A-1 Preferred Stock and common stock, upon the consummation of the Restructuring, Gores’ ownership in the Company increased from approximately 36.8% to 75.1%. Accordingly, the Restructuring, when considering the ownership held by Gores as well as the ownership held by our then existing debt holders, constituted a change of control transaction that requires the Company to follow the purchase method of accounting, as described by
6
Table of Contents
Statement of Financial Accounting Standards (SFAS) 141R, “Business Combinations” (“SFAS 141R”). We have considered the ownership held by Gores and our then existing debt holders as a collaborative group in accordance with Emerging Issues Task Force D-97, “Push Down Accounting”. As a result, we will follow the acquisition method of accounting, as described by Statement of Financial Accounting Standards (SFAS) 141R, “Business Combinations” and will apply the SEC rules and guidance regarding “push down” accounting treatment effective April 23, 2009.
RECENT EVENTS
On October 14, 2009, we entered into separate agreements with the holders of our Senior Notes and Wells Fargo Foothill to amend the terms of our Securities Purchase Agreement (governing the Senior Notes) and Senior Credit Facility, respectively, to waive compliance with our debt leverage covenants which were to be measured on December 31, 2009 on a trailing four-quarter basis. As part of the Securities Purchase Agreement amendment, we have agreed to pay down our Senior Notes by using the gross proceeds of the offering and additional cash on hand, if necessary by: (i) $15.0 million if the gross proceeds of the offering are less than $40.0 million and (ii) $20.0 million (or more at our sole discretion) if the gross proceeds of the offering are equal to or greater than $40.0 million. If neither an offering of capital stock nor the proposed sale-leaseback of our Culver City properties occurs on or prior to March 31, 2010, we have agreed to pay down $3.5 million of our Senior Notes. Any such prepayments would be deemed optional prepayments under the Securities Purchase Agreement and made within 5 business days of the date the offering is consummated (in the case of clauses (i) or (ii) above) or April 7, 2010 in the event no offering or sale-leaseback was consummated.
The amendments also included consents by holders of the Senior Notes and Wells Fargo Foothill regarding the Culver City sale-leaseback described in the section entitled “Business—Properties” below and in the case of the amendment to the Senior Credit Facility, an increase in the letters of credit sub-limit from $1.5 to 2.0 million.
On August 3, 2009, we held a special meeting of our stockholders to consider and vote upon, among other proposals, amending our Restated Certificate of Incorporation to increase the number of authorized shares of our common stock from 300 million to 5 billion and to amend the Certificate of Incorporation to effect a 200 for 1 reverse stock split of our outstanding common stock (the “Charter Amendments”). On August 3, 2009, the stockholders approved the Charter Amendments, which resulted in the automatic conversion of all shares of preferred stock into common stock and the cancellation of warrants to purchase 10 million shares of common stock issued to Gores as part of their investment in our Series A Preferred Stock. There are no longer any issued and outstanding warrants to purchase our common stock or any shares of our capital stock that have any preference over the common stock with respect to voting, liquidation, dividends or otherwise. Under the Charter Amendments, each of the newly authorized shares of common stock has the same rights and privileges as previously authorized common stock. Adoption of the Charter Amendments did not affect the rights of the holders of our currently outstanding common stock nor did it change the par value of the common stock.
On July 9, 2009, Gores converted 3,500 shares of Series A-1 Convertible Preferred Stock into 103,512,913 shares of common stock (without taking into account the reverse stock split). Pursuant to the terms of our Certificate of Incorporation, the 291,722 outstanding shares of our Class B common stock were automatically converted into 291,722 shares of common stock (without taking into account the reverse stock split) because as a result of such conversion by Gores the voting power of the Class B common stock, as a group, fell below ten percent (10%) of the aggregate voting power of issued and outstanding shares of common stock and Class B common stock.
7
Table of Contents
In connection with the Restructuring and the issuance of the Preferred Stock, we determined that the Preferred Stock contained a beneficial conversion feature (“BCF”) of approximately $76.9 million that was partially contingent as described below. BCFs are generally recognized by allocating to shareholders’ equity that portion of the net proceeds from the sale of a convertible security equal to the intrinsic value of the BCF. Intrinsic value is calculated as the spread, as of the date we agreed to issue our Preferred Stock (the “commitment date”), between the conversion price of our Preferred Stock and the fair value of our common stock multiplied by the number of shares of common stock into which the Preferred Stock is convertible. In our case, because only a portion of the shares into which the Preferred Stock was convertible were authorized on the commitment date, a portion of the BCF was not immediately recognized because it was contingent on our stockholders approving an increase in the authorized shares. The portion of the BCF attributable to already authorized shares (approximately $10.9 million) was recognized at issuance on April 23, 2009 (issuance BCF) while the majority of the BCF (approximately $66 million) was contingent (contingent BCF) upon the authorization of 3,769,344,490 additional common shares. Because such shares were authorized on August 3, 2009, the contingent BCF was recognized on such date in the third quarter and, due to the immediate conversion of the Preferred Stock into common stock on such date, resulted in a deemed dividend of $65.9 million that will be included in our third quarter 2009 earnings per share.
ESTIMATED THIRD QUARTER PERFORMANCE
We estimate that for the third quarter ended September 30, 2009, our revenue will be approximately $78 million, our operating loss will be approximately $63 million, our depreciation and amortization will be approximately $8 million, our stock-based compensation expense will be approximately $1.5 million, our goodwill impairment will be approximately $54 million and our restructuring/special charges will be approximately $1.5 million.
The foregoing amounts are estimates that are subject to adjustment in connection with our customary quarterly review processes. The inclusion of these estimates should not be regarded as an indication that we consider these estimates to be a reliable prediction of actual results. We cannot provide any assurance that the assumptions we made in preparing these estimates will prove accurate.
These estimates constitute forward-looking statements that are subject to significant risks and contingencies as described in more detail below in the section below entitled “Cautionary note regarding forward-looking statements” and could cause actual results to differ materially from the estimates expressed above.
The preliminary financial data for the third quarter included above has been prepared by, and is the responsibility of, our management. PricewaterhouseCoopers LLP has not audited, reviewed, compiled or performed any procedures with respect to the accompanying preliminary financial data and, accordingly, PricewaterhouseCoopers LLP does not express an opinion or any other form of assurance with respect thereto.
GOODWILL IMPAIRMENT
As a result of our Restructuring, we recorded new values for certain intangible assets and goodwill as of April 24, 2009, which values were calculated using the income approach and were based on our then most current forecast. The assumptions underlying our forecasted values were derived from the Company’s then best estimates including the industry’s general forecast of the advertising market which assumed an improvement in the economy and in advertising market conditions in the later half of 2009. In 2009, the television upfronts (where advertisers purchase commercial airtime for the upcoming television season several months before the season begins), which in prior years concluded in the second quarter, were extended through August to complete the upfront advertising sales. During this period, advertisers were slow to commit to buying commercial airtime for the third quarter of 2009. We believed that the conclusion of the television upfronts would help bring more clarity to both purchasers and
8
Table of Contents
sellers of advertising; however, once such upfronts concluded in August, it became increasingly evident from our quarterly bookings, backlog and pipeline data that the downturn in the economy was continuing and affecting advertising budgets and orders. The decrease in advertising budgets and orders is evidenced by our revenue decreasing to approximately $78 million in the third quarter of 2009 from $96.3 million in the third quarter of 2008, which represents a decrease of approximately 19%. These conditions, namely the weak third quarter and the likely continuation of the current economic conditions into the fourth quarter and the immediate future, caused us to reduce our forecasted results for the remainder of 2009 and 2010. We believe these new forecasted results constituted a triggering event under FASB ASC 350 and therefore we conducted a goodwill impairment analysis. The new forecast will more likely than not reduce the fair value of one or more of our reporting units below its carrying value. Accordingly, we performed a Step 1 analysis in accordance with FASB ASC 350 by comparing our recalculated fair value based on our new forecast to our current carrying value. Our initial results indicate an impairment in our Metro Traffic segment. We are currently performing a more detailed Step 2 analysis to compare the implied fair value of goodwill for Metro Traffic with the carrying value of its goodwill. We currently estimate the goodwill impairment to be approximately $54 million. No assurance can be provided as to the ultimate charge which will be recorded in the third quarter of 2009.
THE GORES GROUP
The Gores Group owns approximately 75.1% of our common stock. Founded in 1987, Gores is a private equity firm focused on investing in businesses which can benefit from the firm’s operating and turnaround expertise. The firm’s current private equity fund has committed equity capital of $1.3 billion.
RISKS ASSOCIATED WITH OUR BUSINESS
Our business is subject to numerous risks and uncertainties, as more fully described under “Risk Factors” beginning on page 16, which you should carefully consider before deciding whether to invest in our common stock.
CORPORATE INFORMATION
We are a Delaware corporation. Our principal executive office is located at 40 West 57th Street, 5th Floor, New York, NY 10019. Our telephone number is (212) 641-2000 and our website address is www.westwoodone.com. The information contained on, or that can be accessed through, our website is not a part of this prospectus.
9
Table of Contents
The offering
| Common stock offered by Westwood One |
shares |
| Common stock offered by the selling stockholders |
shares |
| Common stock to be outstanding after this offering |
shares, or shares if the underwriters exercise their over-allotment option in full |
| Over-allotment option |
shares |
| Use of proceeds |
Our net proceeds from this offering, after deducting underwriting discounts and estimated offering expenses will be approximately $ , assuming a public offering price of $ per share, which was the last reported sale price of our common stock on , 2009. As described in more detail elsewhere in this prospectus under the heading “Use of Proceeds”, we will use between $15.0 to $20.0 million of the proceeds to repay a portion of our outstanding indebtedness. We anticipate that we will use the remaining net proceeds of this offering for general corporate purposes and working capital, which may include: pursuit of possible acquisitions of complementary businesses or other assets such as TrafficLand (if we choose to exercise our purchase option, as described elsewhere in this prospectus) and funding our growth initiatives. |
We will not receive any proceeds from the sale of shares by the selling stockholders. See “Use of Proceeds.”
| Anticipated NASDAQ Global Market Symbol |
“WWON” |
The number of shares of our common stock to be outstanding upon completion of this offering is based on 20,312,229 shares of our common stock outstanding as of June 30, 2009 (after giving effect to the assumptions on the following page), and excludes:
| Ø | 31,705 shares of common stock issuable upon exercise of options outstanding as of June 30, 2009 at a weighted average exercise price of $7.16 per share,; |
| Ø | 27,709 shares of common stock reserved as of June 30, 2009 for future issuance under our 1999 Stock Incentive Plan, and an additional 12,291 shares of common stock reserved for issuance after June 30, 2009; and |
| Ø | 3,996 shares of common stock reserved as of June 30, 2009 for future issuance under our 2005 Equity Compensation Plan, and an additional 42,004 shares of common stock reserved for issuance after June 30, 2009. |
10
Table of Contents
Unless otherwise indicated, this prospectus (except in the historical consolidated financial statements included elsewhere in this prospectus):
| Ø | reflects and assumes the conversion of all shares of our Series A-1 Preferred Stock (3,500 shares of which were converted on July 9, 2009 and the remainder of which automatically converted on August 3, 2009) and Series B Preferred Stock (which automatically converted on August 3, 2009) into an aggregate of 19,798,483 shares of common stock; |
| Ø | reflects and assumes the automatic conversion of all outstanding shares of Class B stock into an aggregate of 1,459 shares of common stock that occurred on July 9, 2009; |
| Ø | reflects a 200 for 1 reverse stock split of our common stock that occurred on August 3, 2009; and |
| Ø | assumes no exercise by the underwriters of their option to purchase up to an additional shares from us and the selling stockholders to cover over-allotments. |
If the underwriters exercise their over-allotment option in full, shares of our common stock will be outstanding after this offering.
11
Table of Contents
Summary consolidated and other financial data
The following tables summarize our consolidated financial and other data. The consolidated statements of operations data for the fiscal years ended December 31, 2006, 2007 and 2008 and the consolidated balance sheet data as of December 31, 2007 and 2008 have been derived from our audited consolidated financial statements included elsewhere in this prospectus. The consolidated statement of operations data for the fiscal years ended December 31, 2004 and 2005 and the consolidated balance sheet data as of December 31, 2004, 2005 and 2006 have been derived from our audited financial statements not included in this prospectus. The consolidated statement of operations data for the periods comprising the six months ended June 30, 2008 and 2009, and the consolidated balance sheet data as of June 30, 2009, have been derived from our unaudited consolidated financial statements included elsewhere in this prospectus. The unaudited consolidated financial statements have been prepared on a basis consistent with our audited financial statements and include, in the opinion of management, all adjustments that management considers necessary for the fair statement of the financial information set forth in those financial statements. The following financial data should be read in conjunction with, and is qualified by reference to, our consolidated financial statements and related notes and schedule included elsewhere in this prospectus and the information under “Management’s Discussion and Analysis of Financial Condition and Results of Operations.” Our historical results are not necessarily indicative of the results to be expected in any future period.
| Year ended December 31, |
Predecessor Company | Successor Company |
||||||||||||||||||||||||||||||
| For the six months ended June 30, 2008 |
For the period January 1, 2009 to April 23, 2009 |
For the period April 24, 2009 to June 30, 2009(4) |
||||||||||||||||||||||||||||||
| 2004(1) | 2005(1) | 2006 | 2007 | 2008 | ||||||||||||||||||||||||||||
| Consolidated statements of operations data: |
(in thousands, except per share data) | |||||||||||||||||||||||||||||||
| Revenue |
$ | 562,246 | $ | 557,830 | $ | 512,085 | $ | 451,384 | $ | 404,416 | $ | 206,998 | $ | 111,474 | $ | 58,044 | ||||||||||||||||
| Operating Costs |
379,097 | 378,998 | 395,196 | 350,440 | 360,492 | 179,640 | 111,580 | 52,116 | ||||||||||||||||||||||||
| Depreciation and Amortization |
18,429 | 20,826 | 20,756 | 19,840 | 11,052 | 6,397 | 2,585 | 5,845 | ||||||||||||||||||||||||
| Corporate General and Administrative Expenses |
13,596 | 14,028 | 14,618 | 13,171 | 13,442 | 4,665 | 4,248 | 2,407 | ||||||||||||||||||||||||
| Goodwill Impairment |
— | — | 515,916 | — | 430,126 | 206,053 | — | — | ||||||||||||||||||||||||
| Restructuring Charges |
— | — | — | — | 14,100 | — | 3,976 | 1,454 | ||||||||||||||||||||||||
| Special Charges |
— | — | 1,579 | 4,626 | 13,245 | (a) | 8,853 | 12,819 | 368 | |||||||||||||||||||||||
| Operating (Loss) Income |
151,124 | 143,978 | (435,980 | ) | 63,307 | (438,041 | ) | (198,610 | ) | (23,734 | ) | (4,146 | ) | |||||||||||||||||||
| Other Income |
(948 | ) | (1,440 | ) | (926 | ) | (412 | ) | (12,368 | ) |
|
(84 |
) |
|
(359 |
) |
|
(4 |
) | |||||||||||||
| Interest Expense |
11,911 | 18,315 | 25,590 | 23,626 | 16,651 | 9,751 | 3,222 | 4,692 | ||||||||||||||||||||||||
| Income taxes (benefit) |
53,206 | 49,217 | 8,809 | 15,724 | (14,760 | ) | (3,194 | ) | (7,635 | ) | (2,650 | ) | ||||||||||||||||||||
| Net (Loss) Income |
86,955 | 77,886 | (469,453 | ) | 24,368 | (427,563 | ) | $ | (205,082 | ) | $ | (18,961 | ) | $ | (6,184 | ) | ||||||||||||||||
| Net (Loss) Income attributable to Common Stockholders |
86,955 | 77,816 | (469,528 | ) | 24,363 | (430,644 | ) | $ | (205,270 | ) | $ | (22,037 | ) | $ | (9,595 | ) | ||||||||||||||||
| (Loss) Income Per Basic Share(2) |
||||||||||||||||||||||||||||||||
| Common stock |
$ | 179.80 | $ | 171.56 | $ | (1,091.76 | ) | $ | 56.59 | $ | (878.73 | ) | $ | (431.24 | ) | $ | (43.64 | ) | $ | (18.85 | ) | |||||||||||
| Class B stock |
$ | — | $ | 48.00 | $ | 51.20 | $ | 3.20 | $ | — | $ | — | $ | — | $ | — | ||||||||||||||||
| (Loss) Income Per Diluted Share(2) |
||||||||||||||||||||||||||||||||
| Common stock |
$ | 175.65 | $ | 170.05 | $ | (1,091.76 | ) | $ | 56.38 | $ | (878.73 | ) | $ | (431.24 | ) | $ | (43.64 | ) | $ | (18.85 | ) | |||||||||||
| Class B stock |
$ | — | $ | 48.00 | $ | 51.20 | $ | 3.20 | $ | — | $ | — | $ | — | $ | — | ||||||||||||||||
| Dividends Declared(2) |
||||||||||||||||||||||||||||||||
| Common stock |
$ | — | $ | 59.44 | $ | 64.10 | $ | 3.85 | $ | — | $ | — | $ | — | $ | — | ||||||||||||||||
| Class B stock |
$ | — | $ | 48.00 | $ | 51.20 | $ | 3.20 | $ | — | $ | — | $ | — | $ | — | ||||||||||||||||
|
(a) Does not include $3,272 of special charges classified as Operating Costs on the Statement of Operations.
Other Key Financial Metric: |
|
|||||||||||||||||||||||||||||||
| Stock-based compensation |
14,844 | 11,686 | 12,269 | 9,606 | 5,443 | 2,455 | 2,110 | 853 | ||||||||||||||||||||||||
12
Table of Contents
| As of December 31, | As of June 30, | ||||||||||||||||||||||
| 2004(1) | 2005(1) | 2006 | 2007 | 2008 | 2008 | 2009(4) | |||||||||||||||||
| (in thousands) | |||||||||||||||||||||||
| Consolidated Balance Sheet Data(4): |
|||||||||||||||||||||||
| Current Assets |
$ | 174,346 | $ | 172,245 | $ | 149,222 | $ | 138,154 | $ | 119,468 | $ | 109,180 | $ | 107,454 | |||||||||
| Working Capital / (Deficit)(3) |
93,005 | 72,094 | 29,313 | 47,294 | (208,034 | ) | (15,181 | ) | 47,409 | ||||||||||||||
| Total Assets |
1,262,495 | 1,239,646 | 696,701 | 669,757 | 205,088 | 431,134 | 347,056 | ||||||||||||||||
| Long-Term Debt(3) |
359,439 | 427,514 | 366,860 | 345,244 | — | 199,495 | 128,078 | ||||||||||||||||
| Total Shareholders’ Equity (Deficit) |
800,709 | 704,029 | 202,931 | 227,631 | (203,145 | ) | 101,597 | 4,290 | |||||||||||||||
| Year ended December 31, | Predecessor Company | Successor Company | |||||||||||||||||||||||
| 2004(1) | 2005(1) | 2006 | 2007 | 2008 | Six months ended June 30, 2008 |
For the period January 1, 2009 to April 23, 2009 |
For the period April 24, 2009 to June 30, 2009 | ||||||||||||||||||
| (in thousands) | |||||||||||||||||||||||||
| Other Financial Data: |
|||||||||||||||||||||||||
| Adjusted EBITDA(5) |
$ | 184,397 | $ | 176,490 | $ | 114,540 | $ | 97,378 | $ | 39,198 | $ | 25,149 | $ | (2,243 | ) | $ | 4,374 | ||||||||
| (1) | Effective January 1, 2006, we adopted Financial Accounting Standards Board (“FASB”) Statement of Financial Accounting Standards No. 123 (Revised 2004), “Share Based Payment” (“SFAS 123R”) utilizing the modified retrospective transition alternative. Accordingly, results for years prior to 2006 have been restated to reflect stock—based compensation expense in accordance with SFAS 123R. |
| (2) | No cash dividend was paid on our common stock or Class B stock in 2004 or 2008. The payment of dividends is restricted by the terms of our outstanding indebtedness and we do not plan on paying dividends for the foreseeable future. On August 3, 2009, a 200:1 reverse stock split was declared and effective. All per share amounts have been adjusted for this split (see Note 1 to the Annual Consolidated Financial Statements). |
| (3) | On November 30, 2008, we failed to make the interest payment on our previously outstanding senior notes which constituted an event of default under the then existing senior notes. Accordingly, $249,053 of debt previously considered long-term was re-classified as short-term debt, which resulted in a working capital deficit of $208,034 on December 31, 2008. |
| (4) | As a result of the Restructuring, we have followed the acquisition method of accounting, as described by SFAS 141R. Accordingly, we have revalued our assets and liabilities using our best estimate of current fair value. Our consolidated financial statements prior to the closing of the Restructuring reflect the historical accounting basis in our assets and liabilities and are labeled predecessor company, while the periods subsequent to the Restructuring are labeled successor company and reflect the push down basis of accounting for the fair values which were allocated to our segments based on the business Enterprise Value of each. Deferred tax liabilities have been recorded as a part of acquisition accounting to reflect the future taxable income to be recognized relating to the cancellation of indebtedness income as well as the deferred tax liability related to the acquisition accounting. |
| In connection with the Restructuring and the issuance of the Preferred Stock, we have determined that the Preferred Stock contained a beneficial conversion feature (“BCF”) that was partially contingent. BCF is measured as the spread between the effective conversion price and the market price of common stock on the commitment date and then multiplying this spread by the number of conversion shares. We recognized the portion of the BCF that was not related to the contingent shares at issuance (issuance BCF) while the majority of the BCF was contingent (contingent BCF) upon the authorization of additional common shares that occurred on August 3, 2009. Because such shares were authorized on August 3, 2009, the contingent BCF was recognized on such date in the third quarter and, due to the immediate conversion of the Preferred Stock into common stock on such date, resulted in a deemed dividend of $65.9 million that will be included in our third quarter 2009 earnings per share. |
| (5) | Adjusted EBITDA is a non-GAAP financial measure (ie, it is not a measure of financial performance under generally accepted accounting principles) and should not be considered in isolation or as a substitute for consolidated statements of operations and cash flow data prepared in accordance with GAAP. We use Adjusted EBITDA to calculate our compliance with our leverage ratio covenants under our Senior Credit Facility and Senior Notes. We believe the presentation of Adjusted EBITDA is relevant and useful for investors because it allows investors to view performance in the same manner as our lenders (who also own approximately 23.0% of our equity as a result of the Restructuring, excluding Gores). |
(footnotes on following page)
13
Table of Contents
Our maximum senior leverage ratio (also referred to herein as our “debt leverage covenant”), defined as the principal amount of Senior Notes over our Consolidated EBITDA (defined below), is measured on a trailing, four-quarter basis. The covenant is the same under our Securities Purchase Agreement (“SPA”), governing the Senior Notes and our Senior Credit Facility with Wells Fargo Foothill (governing the term loan and revolver) except that they have different maximum levels. We have presented the more restrictive of the two levels below.
| Quarter ending |
Senior leverage ratio covenant |
Principal amount of senior notes (includes PIK)* |
Required adjusted EBITDA* | |||
| 12/31/09 |
6.25 to 1.0** | 106.9 | 17.1 | |||
| 3/31/10 |
6.00 to 1.0 | 108.3 | 18.1 | |||
| 6/30/10 |
5.5 to 1.0 | 109.6 | 19.9 | |||
| 9/30/10 |
5.00 to 1.0 | 111.0 | 22.2 | |||
| 12/31/10 |
4.50 to 1.0 | 112.4 | 25.0 | |||
| 3/31/11 |
4.25 to 1.0 | 113.8 | 26.8 | |||
| 6/30/11 |
4.00 to 1.0 | 115.2 | 28.8 | |||
| 9/30/11 |
3.75 to 1.0 | 116.7 | 31.1 | |||
| 12/31/11 |
3.50 to 1.0 | 118.1 | 33.7 | |||
| 3/31/12 |
3.50 to 1.0 | 119.6 | 34.2 | |||
| 6/30/12 |
3.50 to 1.0 | 121.1 | 34.6 |
| * | Numbers presented in the last two columns are dollars in millions and have been rounded to the nearest tenth. As described elsewhere in this prospectus under the heading “Use of Proceeds” we will use between $15.0 and $20.0 million of the proceeds of the offering to repay outstanding indebtedness. The above chart reflects a repayment of $15.0 million of the $117.5 principal amount of Senior Notes presently outstanding and includes the PIK interest that accrues on a quarterly basis. |
| ** | As described below in more detail, on October 14, 2009, we entered into agreements with the holders of our Senior Notes and Wells Fargo Foothill to waive compliance with our debt leverage covenants under our Senior Notes and Senior Credit Facility, respectively, which levels were scheduled to be measured on December 31, 2009. Accordingly, the first measurement period will occur on March 31, 2010. |
Consolidated EBITDA has the same definition in both agreements and means Consolidated Net Income (as defined in such agreements) for Westwood One and its subsidiaries adjusted for the following:
(a) minus any net gain or plus any loss arising from the sale or other disposition of capital assets;
(b) plus any provision for taxes based on income or profits;
(c) plus consolidated net interest expense;
(d) plus depreciation, amortization and other non-cash losses, charges or expenses (including impairment of intangibles and goodwill);
(e) minus any “extraordinary,” “unusual,” “special” or “non-recurring” earnings or gains or plus any “extraordinary,” “unusual,” “special” or “non-recurring” losses, charges or expenses;
(f) plus restructuring expenses or charges;
(g) plus non-cash compensation recorded from grants of stock appreciation or similar rights, stock options, restricted stock or other rights;
(h) plus any Permitted Glendon/Affiliate Payments (as described below);
(i) plus any Transaction Costs (as described below);
(j) minus any deferred credit (or amortization of a deferred credit) arising from the acquisition of any Person; and
(k) minus any other non-cash items increasing such Consolidated Net Income (including, without limitation, any write-up of assets);
in each case to the extent taken into account in the determination of such Consolidated Net Income, and determined without duplication and on a consolidated basis in accordance with GAAP. “Permitted Glendon/Affiliate Payments” means payments made at our discretion to Gores and its affiliates including Glendon Partners for consulting services provided to Westwood One and “Transaction Costs” refers to the fees, costs and expenses incurred by us in connection with the Restructuring.
Under the amended terms of our indebtedness, our financial covenant will first be measured on March 31, 2010 based on our trailing four-quarter EBITDA. Our Adjusted EBITDA (which is the same as “Consolidated EBITDA” described above) for the
(footnotes on following page)
14
Table of Contents
three-month period ended June 30, 2009 was $9.1 million. In order to satisfy our 6.00 covenant under the terms of our Senior
Notes (which is more restrictive than the 6.90 covenant set forth in our Senior Credit Facility) on March 31, 2010, we would require Adjusted EBITDA (for the three quarters ended March 31, 2010) of $9.0 million or greater. This assumes the amount of Senior Notes outstanding on March 31, 2010 is reduced by $15.0 million from the proceeds of this offering and includes PIK interest accrued through March 31, 2010. This compares with Adjusted EBITDA of $16.2 million on June 30, 2009, on a trailing four-quarter basis, which amount does not include the full benefit of the cost reduction programs undertaken by us and described elsewhere in this prospectus in more detail.
Adjusted EBITDA, as we calculate it, may not be comparable to similarly titled measures employed by other companies. While Adjusted EBITDA does not necessarily represent funds available for discretionary use, and is not necessarily a measure of our ability to fund our cash needs, we use Adjusted EBITDA as a liquidity measure, which is different from our operating cash flow, the most directly comparable financial measure calculated and presented in accordance with GAAP. We have provided below the requisite reconciliation of operating cash flow to Adjusted EBITDA. Adjusted EBITDA, a non-GAAP measure, for the combined six months ended June 30, 2009 was $2.1 million as previously reported in our second quarter earnings press release.
| Predecessor Company | Successor Company |
|||||||||||||||||||||||||||||||||||
| Year ended December 31, | Six months ended June 30, |
For the period January 1, 2009 to April 23, 2009(4) |
For the period April 24, 2009 to June 30, 2009(4) |
|||||||||||||||||||||||||||||||||
| 2004 | 2005 | 2006 | 2007 | 2008 | 2008 | |||||||||||||||||||||||||||||||
| (in thousands) | ||||||||||||||||||||||||||||||||||||
| Net Cash Provided by (Used in) Operating Activities |
$ | 117,456 | $ | 118,290 | $ | 104,251 | $ | 27,901 | $ | 2,038 | $ | (4,842 | ) | $ | (777 | ) | $ | (14,327 | ) | |||||||||||||||||
| Interest expense |
11,911 | 18,315 | 25,590 | 23,626 | 16,651 | 9,751 | 3,222 | 4,692 | ||||||||||||||||||||||||||||
| Income taxes (benefit) |
53,206 | 49,217 | 8,809 | 15,724 | (14,760 | ) | (3,194 | ) | (7,635 | ) | (2,650 | ) | ||||||||||||||||||||||||
| Restructuring |
— | — | — | — | 14,100 | — | 3,976 | 1,454 | ||||||||||||||||||||||||||||
| Special charges |
— | — | 1,579 | 4,626 | 16,517 | 8,853 | 12,819 | 368 | ||||||||||||||||||||||||||||
| Investment income |
(157 | ) | (436 | ) | (394 | ) | — | (207 | ) | (84 | ) | (359 | ) | (4 | ) | |||||||||||||||||||||
| Other non-operating income |
(791 | ) | (42 | ) | (532 | ) | (412 | ) | (998 | ) | — | (188 | ) | (76 | ) | |||||||||||||||||||||
| Deferred taxes |
5,276 | 7,451 | 20,546 | 6,480 | 13,907 | 7,196 | 6,874 | (2,162 | ) | |||||||||||||||||||||||||||
| Amortization of deferred financing costs |
(709 | ) | (333 | ) | (359 | ) | (481 | ) | (1,674 | ) | (792 | ) | (331 | ) | — | |||||||||||||||||||||
| Change in assets and liabilities |
(1,795 | ) | (15,972 | ) | (44,950 | ) | 19,914 | (6,376 | ) | 8,261 | (19,844 | ) | 17,079 | |||||||||||||||||||||||
| Adjusted EBITDA |
$ | 184,397 | $ | 176,490 | $ | 114,540 | $ | 97,378 | $ | 39,198 | $ | 25,149 | $ | (2,243 | ) | $ | 4,374 | |||||||||||||||||||
15
Table of Contents
Investing in our common stock involves a high degree of risk. You should carefully consider the following risk factors, as well as all of the other information contained or incorporated by reference in this prospectus, before deciding to invest in our common stock. The occurrence of any of the following risks could materially and adversely affect our business, financial condition, prospects, results of operations and cash flows. In such case, the trading price of our common stock could decline and you could lose all or part of your investment. Additional risks and uncertainties not currently known to us or that we currently deem to be immaterial may also materially and adversely affect our business, financial condition, prospects, results of operations and cash flows.
RISKS RELATED TO OUR BUSINESS AND INDUSTRY
Deterioration in general economic conditions and constrained consumer spending has caused, and could cause, additional decreases or delays in advertising spending, could harm our ability to generate advertising revenue and negatively affect our results of operations.
We derive the majority of our revenue from the sale of local, regional and national advertising. The current global economic slowdown has resulted in a decline in advertising and marketing services among our customers, resulting in a decline in advertising revenue across our businesses which to date has not abated. Additionally, advertisers, and the agencies that represent them, have put increased pressure on advertising rates, in some cases, requesting broad percentage discounts on ad buys, demanding increased levels of inventory and re-negotiating booked orders. The current state of the economy could also adversely affect our ability to collect accounts receivable from our advertisers, particularly those entities which have filed for bankruptcy. Reductions in advertising expenditures and declines in ad rates have adversely affected our revenue and the continuation of the global economic slowdown would likely continue to adversely impact our revenue, profit margins, cash flow and liquidity in future periods. In addition, once the current economic situation improves, we cannot predict whether or not advertisers’ demands and budgets for advertising will return to previous levels.
Our operating income has declined since 2002 and may continue to decline. We may not be able to reverse this trend or reduce costs sufficiently to offset declines in revenue if such trends continue.
Since 2002, our annual operating income has declined from operating income of approximately $180 million to an operating loss of $438 million, which included goodwill impairment charges of approximately $430 million, for the year ended 2008, with the most significant decline occurring between 2005 and 2008. Between 2002 and 2008, our operating income declined as a result of increased competition in our local and regional markets and an increase in the amount of 10 second inventory being sold by radio stations. The decline (between 2005 and 2008) also was due to reductions in national audience levels (which dropped significantly between 2005 and 2006), lower commercial clearance and audience levels of our affiliated stations and reductions in our local and regional sales force, which began in mid-2006. Recently, our operating income has also been affected by the weakness in the United States economy and advertising market. Given the current economic climate, it is possible our financial position will not improve.
16
Table of Contents
Risk factors
Our present financial condition has caused us to obtain waivers to the agreements governing our indebtedness and to institute certain cost saving measures. If our financial condition does not improve, we may need to take additional actions designed to respond to or improve our financial condition and we cannot assure you that any such actions would be successful in improving our financial position.
As a result of our current financial position we have taken certain actions designed to respond to and improve our current financial position. On October 14, 2009, we entered into separate agreements with the holders of our Senior Notes and Wells Fargo Foothill to amend the terms of our Securities Purchase Agreement (governing the Senior Notes) and Senior Credit Facility, respectively, to waive compliance with our debt leverage covenants which were to be measured on December 31, 2009 on a trailing four-quarter basis. In addition, we have implemented and continue to implement cost saving measures which include compensation reduction and furlough actions (aggregating 10 days of pay per each participating full-time employee) that we announced on September 29, 2009. Furthermore, as described in more detail under the section entitled “Prospectus Summary—Goodwill Impairment,” we currently estimate that we will take a goodwill impairment charge of approximately $54 million in the third quarter of 2009. Certain of the cost saving initiatives were designed to improve our financial condition. If our financial condition does not improve as a result of these and other actions, we may need to take additional actions in the future in an attempt to improve our financial condition. We can make no assurance that the actions we have taken and plan to take in the future will improve our financial position.
CBS Radio provides us with a significant portion of our commercial inventory and audience that we sell to advertisers. A material reduction in the audience delivered by CBS Radio stations or a material loss of commercial inventory from CBS Radio would have an adverse effect on our advertising sales and financial results.
While we provide programming to all major radio station groups, we have affiliation agreements with most of CBS Radio’s owned and operated radio stations which, in the aggregate, provide us with a significant portion of the audience and commercial inventory that we sell to advertisers, much of which is in the more desirable top 10 radio markets. Although the compensation we pay to CBS Radio under our new 2008 arrangement is adjustable for audience levels and commercial clearance (ie, the percentage of commercial inventory broadcast by CBS Radio stations), any significant loss of audience or inventory delivered by CBS Radio stations, including, by way of example only, as a result of a decline in station audience, commercial clearance levels or station sales that resulted in lower audience levels, would have a material adverse impact on our advertising sales and revenue. Since implementing the new arrangement in early 2008 and continuing through the end of 2008, CBS Radio has delivered improved audience levels and broadcast more advertising inventory than it had under our previous arrangement. However, there can be no assurance that CBS Radio will be able to maintain these higher levels in particular, with the introduction of The Portable People Meter™, or PPM™, which to date has reported substantially lower audience ratings for certain of our radio station affiliates, including our CBS Radio station affiliates, in those markets in which PPM™ has been implemented as described below. Additionally, while our arrangement with CBS Radio is scheduled to terminate in 2017, there can be no assurance that such arrangement will not be breached by either party. If our agreement with CBS Radio were terminated as a result of such breach, our results of operations could be materially impacted.
We may not realize expected benefits from our cost cutting initiatives.
In order to improve the efficiency of our operations, we have implemented and continue to implement certain cost cutting initiatives, including headcount and salary reductions and more recently a furlough of participating full-time employees. We cannot assure you that we will realize the full level of expected cost
17
Table of Contents
Risk factors
savings or improve our operating performance as a result of our past, current and future cost cutting activities. We also cannot assure you that our cost cutting activities will not adversely affect our ability to retain key employees, the significant loss of whom could adversely affect our operating results. Further, as a result of our cost cutting activities, we may not have the appropriate level of resources and personnel to appropriately react to significant changes or fluctuations in the market and in the level of demand for our programming and services.
Our ability to grow our Metro business revenue may be adversely affected by the increased proliferation of free of charge traffic content to consumers.
Our Metro business produces and distributes traffic and other local information reports to approximately 2,200 radio and television affiliates and we derive the substantial majority of the revenue attributed to this business from the sale of commercial advertising inventory embedded within these reports. Recently, the US Department of Transportation and other regional and local departments of transportation have significantly increased their direct provision of real-time traffic and traveler information to the public free of charge. The ability to obtain this information free of charge may result in our radio and television affiliates electing not to utilize the traffic and local information reports produced by our Metro business, which in turn could adversely affect our revenue from the sale of advertising inventory embedded in such reports.
If we are unable to achieve our financial forecast, we may require an amendment or additional waiver of our debt leverage covenant, which amendment or waiver, if not obtained, could have a material and adverse effect on our business continuity and financial condition.
Management believes that after giving effect to certain cost containment measures including furloughs and salary reductions for employees, we will generate sufficient Adjusted EBITDA in order to meet our debt leverage covenant over the next twelve months (namely, on March 31, 2010, June 30, 2010 and September 30, 2010 when the covenants are measured on a trailing four-quarter basis). However, as described elsewhere in this prospectus, we are operating in an uncertain economic environment with limited visibility on advertising orders for the duration of 2009 and the beginning of 2010. As described in the section entitled “Use of Proceeds”, we have agreed to pay down our Senior Notes in an amount of either $15.0 or 20.0 million, depending on the amount of gross proceeds of the offering. If we are unable to achieve our forecasted results, or sufficiently mitigate those results with certain cost reduction measures, and cannot obtain a waiver or amendment of our debt covenant requirements at March 31, 2010 or beyond, it could have a material and adverse effect on our business continuity, results of operations, cash flows and financial condition.
We may require additional financing to fund our working capital, debt service, capital expenditures or other capital requirements and the ongoing global credit market disruptions have reduced access to credit and created higher costs of obtaining financing.
Our primary source of liquidity is cash flow from operations, which has been adversely impacted by the decline in our advertising revenue. Based on our current and anticipated levels of operations, we believe that cash flow from operations as well as cash on hand (including amounts drawn or available under our Senior Credit Facility) will enable us to meet our working capital, capital expenditure, debt service and other capital requirements for at least the next 12 months. However, our ability to fund our working capital needs, debt service and other obligations, and to comply with the financial covenants under our financing agreements depends on our future operating performance and cash flow, which are subject to prevailing economic conditions and other factors, many of which are beyond our control. We recently
18
Table of Contents
Risk factors
negotiated agreements with the holders of our Senior Notes and Wells Fargo Foothill to waive compliance with our debt leverage covenants under our Senior Notes and Senior Credit Facility, respectively (which levels were to be measured on December 31, 2009), as a result of lower than anticipated revenue and the uncertain economic and advertising environments. Pursuant to the terms of these agreements, we are required to use a portion of the proceeds of this offering to repay a portion of our outstanding Senior Notes. The portion of the proceeds of this offering that is used to repay our Senior Notes will not be available to us to fund the ongoing operating needs of our business. If our future operating performance does not meet our expectations or our plans materially change in an adverse manner or prove to be materially inaccurate, we may need additional financing. There can be no assurance that such financing, if permitted under the terms of our financing agreements, will be available on terms acceptable to us or at all. Additionally, disruptions in the credit markets make it harder and more expensive to obtain financing. If available financing is limited or we are forced to fund our operations at a higher cost, these conditions may require us to curtail our business activities and increase our cost of financing, both of which could reduce our profitability or increase our losses. The inability to obtain additional financing in such circumstances could have a material adverse effect on our financial condition and on our ability to meet our obligations.
We have a significant amount of indebtedness, which could adversely affect our liquidity and future business operations if our operating income declines more than we currently anticipate.
As of September 30, 2009, we had approximately $120.4 million in aggregate principal amount of Senior Notes outstanding (of which $2.9 million is PIK interest), which bear interest at a rate of 15.0%, and a Senior Credit Facility consisting of: (x) a $20 million term loan and (y) a $15 million revolving line of credit which we intend to borrow against in the future. Loans under our Senior Credit Facility bear interest at LIBOR plus 4.5% (with a LIBOR floor of 2.5%) or a base rate plus 4.5% (with a base rate floor equal to the greater of 3.75% or the one-month LIBOR rate). As described in the section entitled “Prospectus Summary—Recent Events” above, we recently obtained waivers of compliance with our debt leverage covenants for the fourth quarter of 2009 measurement period. Our ability to service our debt in 2010 and beyond will depend on competitive pressures and our financial performance in an uncertain and unpredictable economic environment. Further, our Senior Notes and Senior Credit Facility restrict our ability to incur additional indebtedness. If our operating income declines more than we currently anticipate, resulting in an inability to incur additional indebtedness under the terms of our outstanding indebtedness, and we are unable to obtain a waiver to increase our indebtedness or successfully raise funds through an issuance of equity, we could have insufficient liquidity which would have a material adverse effect on our business, financial condition and results of operations. If we are unable to meet our debt service and repayment obligations under the Senior Notes or the Senior Credit Facility, we would be in default under the terms of the agreements governing our debt, which if uncured, would allow our creditors at that time to declare all outstanding indebtedness to be due and payable and materially impair our financial condition and liquidity.
Our Senior Credit Facility and Senior Notes contain various covenants which, if not complied with, could accelerate repayment under such indebtedness, thereby materially and adversely affecting our financial condition and results of operations.
Our Senior Credit Facility and Senior Notes require us to comply with certain financial and operational covenants. These covenants include, without limitation:
| Ø | a maximum senior leverage ratio (expressed as the principal amount of Senior Notes over our consolidated EBITDA (as defined in our Senior Credit Facility) measured on a trailing, four-quarter |
19
Table of Contents
Risk factors
| basis) which is 6.25 to 1.0 on December 31, 2009 but begins to decline on a quarterly basis thereafter, including to a 4.5 to 1.0 ratio on December 31, 2010 and a 3.5 to 1.0 ratio on December 31, 2011; and |
| Ø | restrictions on our ability to incur debt, incur liens, make investments, make capital expenditures, consummate acquisitions, pay dividends, sell assets and enter into mergers and similar transactions. |
We can not make any assurances that we will remain in compliance with these agreements, particularly if the advertising environment remains weak or our operating income continues to decline. As described in the section entitled “Prospectus Summary—Recent Events” above, we recently obtained waivers of compliance with our debt leverage covenants for the fourth quarter of 2009 measurement period which means our debt leverage covenant will first be measured on March 31, 2010 and thereafter on a quarterly basis on a trailing four-quarter basis. Failure to comply with any of our covenants would result in a default under our Senior Credit Facility and Senior Notes that, if we were unable to obtain a waiver from the lenders or holders thereof, could accelerate repayment under the Senior Credit Facility and Senior Notes and thereby have a material adverse impact on our business.
Our ability to increase our revenue is significantly dependent on advertising rates, which rates could be negatively impacted by the introduction of The Portable People Meter.
Arbitron Inc., the supplier of ratings data for United States radio markets, has developed new electronic audience measurement technology to collect data for its ratings service known as The Portable People MeterTM, or PPMTM. The PPMTM measures the audience of radio stations remotely without requiring listeners to keep a manual diary of the stations they listen to. To date, the PPMTM has been implemented in 22 markets (including nine of the top 10 markets) and, in the two most recent periods measured by RADAR, March 2009 to June 2009, and June 2009 to September 2009, the audience reported for our 14 RADAR networks (which comprise 50% of our inventory) declined by 4% and 0.9%, respectively. Because PPM information is incorporated into Arbitron’s ratings books on an incremental basis over time (ie, over a rolling four-quarter period), we are unable to determine how much of the audience decline is a result of the change to PPM, versus other factors, such as changes in the stations included in the RADAR network, the specific inventory or programs in these networks, or other factors. As the PPMTM is instituted in more markets, it is unclear whether the audience ratings posted by it will continue to be significantly lower and if so, what effect this may have on advertising rates as our advertisers become more knowledgeable about the advantages of the PPMTM. Additionally, as described elsewhere in this prospectus, we have to date experienced a decline in our ad revenue in our Network and Metro businesses; however, we are unable to determine at this time how much of such decline is a result of the general economic environment versus a decline in audience. If the PPMTM continues to report lower audience ratings than the traditional diary methodology and the rates we charge our advertisers are materially impacted by such results, our revenue would be materially and adversely affected.
Our failure to obtain or retain the rights in popular programming could adversely affect our revenue.
Our revenue from our radio programming and television business is dependent on our continued ability to anticipate and adapt to changes in consumer tastes and behavior on a timely basis. We obtain a significant portion of our popular programming from third parties. For example, some of our most widely heard broadcasts, including certain NFL games, are made available based upon programming rights of varying duration that we have negotiated with third parties. Competition for popular programming that is licensed from third parties is intense, and due to increased costs of such programming or potential capital constraints, we may be outbid by our competitors for the rights to
20
Table of Contents
Risk factors
new, popular programming or in connection with the renewal of popular programming currently licensed by us. Our failure to obtain or retain rights to popular content could adversely affect our revenue.
Our business is subject to increased competition resulting from new entrants into our business, consolidated companies and new technology/platforms, each of which has the potential to adversely affect our business.
Our business segments operate in a highly competitive environment. Our radio and television programming competes for audiences and advertising revenue directly with radio and television stations and other syndicated programming, as well as with other media such as satellite radio, newspapers, magazines, cable television, outdoor advertising, direct mail and, more increasingly, digital media. We may experience increased audience fragmentation caused by the proliferation of new media platforms, including the Internet and video-on-demand and the deployment of portable digital devices and new technologies which allow consumers to time shift programming, make and store digital copies and skip or fast-forward through advertisements. New or existing competitors may have resources significantly greater than our own and, in particular, the consolidation of the radio industry has created opportunities for large radio groups, such as Clear Channel Communications, CBS Radio and Citadel Broadcasting Corporation to gather information and produce radio and television programming on their own. Increased competition, in part, has resulted in reduced market share, and could result in lower audience levels, advertising revenue and cash flow. There can be no assurance that we will be able to compete effectively, be successful in our efforts to regain market share and increase or maintain our current audience ratings and advertising revenue. To the extent we experience a further decline in audience for our programs or the cost of programming continues to increase, we may be unable to retain the rights to popular programs and advertisers’ willingness to purchase our advertising could be further reduced. Additionally, audience ratings and performance-based revenue arrangements are subject to change based on the competitive environment and any adverse change in a particular geographic area could have a material and adverse effect on our ability to attract not only advertisers in that region, but national advertisers as well.
In recent years, digital media platforms and the offerings thereon have increased significantly and consumers are playing an increasingly large role in dictating the content received through such mediums. We face increasing pressure to adapt our existing programming as well as to expand the programming and services we offer to address these new and evolving digital distribution channels. Advertising buyers have the option to filter their messages through various digital platforms and as a result, many are adjusting their advertising budgets downward with respect to traditional advertising mediums such as radio and television or utilizing providers who offer “one-stop shopping” access to both traditional and alternative distribution channels. If we are unable to offer our broadcasters and advertisers an attractive full suite of traditional and new media platforms and address the industry shift to new digital mediums, our operating results may be negatively impacted.
The cost of our indebtedness has increased substantially, which, when combined with our recent declining revenue, further affects our liquidity and could limit our ability to implement our business plan and respond competitively.
As a result of our recently completed recapitalization transactions, the annual interest payments on our debt increased from approximately $12 million to $19 million, $6 million of which will be paid in kind. If the economy continues in recession and advertisers continue to maintain reduced budgets which do not recover in 2009 or early 2010, we may be required to delay the implementation or reduce the scope of
21
Table of Contents
Risk factors
our business plan and our ability to develop or enhance our services or programs could be curtailed. Without additional revenue and capital, we may be unable to take advantage of business opportunities, such as acquisition opportunities or securing rights to name-brand or popular programming, or respond to competitive pressures. If any of the foregoing should occur, this could have a material and adverse effect on our business.
If we are not able to integrate future acquisitions successfully, our operating results could be harmed.
We evaluate acquisitions on an ongoing basis and intend to pursue acquisitions of businesses in our industry and related industries that can assist us in achieving our growth strategy. The success of our future acquisition strategy will depend on our ability to identify, negotiate, complete and integrate acquisitions and, if necessary, to obtain satisfactory debt or equity financing to fund those acquisitions. Mergers and acquisitions are inherently risky, and any mergers and acquisitions we do complete may not be successful. Any mergers and acquisitions we do may involve certain risks, including, but not limited to, the following:
| Ø | difficulties in integrating and managing the operations, technologies and products of the companies we acquire; |
| Ø | diversion of our management’s attention from normal daily operations of our business; |
| Ø | our inability to maintain the key business relationships and reputations of the businesses we acquire; |
| Ø | uncertainty of entry into markets in which we have limited or no prior experience or in which competitors have stronger market positions; |
| Ø | our dependence on unfamiliar affiliates and partners of the companies we acquire; |
| Ø | insufficient revenue to offset our increased expenses associated with the acquisitions; |
| Ø | our responsibility for the liabilities of the businesses we acquire; and |
| Ø | potential loss of key employees of the companies we acquire. |
Our success is dependent upon audience acceptance of our content, particularly our radio programs, which is difficult to predict.
Revenue derived from the production and distribution of radio programs depend primarily upon their acceptance by the public, which is difficult to predict. The commercial success of a radio program also depends upon the quality and acceptance of other competing programs released into the marketplace at or near the same time, the availability of alternative forms of entertainment activities, general economic conditions and other tangible and intangible factors, all of which are difficult to predict. Rating points are also factors that are weighed when determining the advertising rates that we receive. Poor ratings can lead to a reduction in pricing and advertising revenue. Consequently, low public acceptance of our content, particularly our radio programs, could have an adverse effect on our results of operations.
Continued consolidation in the radio broadcast industry could adversely affect our operating results.
The radio broadcasting industry has continued to experience significant change, including a significant amount of consolidation in recent years and increased business transactions by key players in the radio industry (eg, Clear Channel, Citadel and CBS Radio). Certain major station groups have: (1) modified
22
Table of Contents
Risk factors
overall amounts of commercial inventory broadcast on their radio stations; (2) experienced significant declines in audience; and (3) increased their supply of shorter duration advertisements, in particular the amount of 10 second inventory, which is directly competitive to us. To the extent similar initiatives are adopted by other major station groups, this could adversely impact the amount of commercial inventory made available to us or increase the cost of such commercial inventory at the time of renewal of existing affiliate agreements. Additionally, if the size and financial resources of certain station groups continue to increase, the station groups may be able to develop their own programming as a substitute to that offered by us or, alternatively, they could seek to obtain programming from our competitors. Any such occurrences, or merely the threat of such occurrences, could adversely affect our ability to negotiate favorable terms with our station affiliates, attract audiences and attract advertisers. If we do not succeed in these efforts, our operating results could be adversely affected.
We may be required to recognize further impairment charges.
On an annual basis and upon the occurrence of certain events, we are required to perform impairment tests on our identified intangible assets with indefinite lives, including goodwill, which testing could impact the value of our business. At December 31, 2008, we determined that our goodwill was impaired and recorded an impairment charge of approximately $224.1 million, which is in addition to the impairment charge of approximately $206.1 million taken on June 30, 2008. In connection with our Restructuring and our requisite adoption of the acquisition method of accounting, we recorded new values of certain assets such that as of April 24, 2009 our revalued goodwill was $86.4 million (an increase of $52.4 million) and intangible assets were $116.9 million (an increase of $109.3 million). In September 2009, we believe a triggering event occurred and therefore we conducted a goodwill impairment analysis as a result of new forecasted results for 2009 and 2010. As described in the section above entitled “Prospectus Summary—Recent Events” in more detail, we prepared the new forecasts when after the conclusion of the television upfronts in August, we observed from our quarterly bookings, backlog and pipeline data that the softness of the economy was continuing and affecting advertising budgets and orders and accordingly reduced our forecasted results for 2009 and 2010. We have since performed a Step 1 analysis according to FASB ASC 350 by comparing our recalculated fair value based on our new forecast to our current carrying value and our initial results indicate an impairment in our Metro Traffic segment. We are currently performing a more detailed Step 2 analysis to compare the implied fair value of goodwill for Metro Traffic with the carrying value of its goodwill. At present, we estimate the goodwill impairment to be approximately $54 million. No assurance can be provided as to the ultimate change which will be recorded in the third quarter of 2009. Future unanticipated differences to our forecasted operational results and cash flows could require additional provisions for further impairment that could significantly affect our reported earnings in a period of such change.
RISKS RELATING TO THIS OFFERING AND OWNERSHIP OF OUR COMMON STOCK
The market price of our common stock may fluctuate significantly.
The price of the common stock that will prevail in the market after this offering may be higher or lower than the price you pay. The market price and liquidity of the market for shares of our common stock may be significantly affected by numerous factors, including some which are beyond our control and may not be directly related to our operating performance. These factors include those described above under “Risks Related to Our Business and Industry” and the following:
| Ø | termination or expiration of one or more of our key contracts; |
| Ø | announcements by us or our competitors of significant contracts, productions, projects, acquisitions, strategic investments or capital commitments; |
23
Table of Contents
Risk factors
| Ø | changes in earnings estimates or recommendations by analysts who cover our common stock; |
| Ø | variations in our quarterly operating results or the quarterly financial results of companies perceived to be competitors or similar to us; |
| Ø | changes in our capital structure, such as future issuances of securities, sales of large blocks of common stock by our stockholders or the incurrence of additional debt; and |
| Ø | changes in general economic and market conditions. |
Our common stock may not maintain an active trading market or list on a nationally recognized exchange which could affect the liquidity and market price of your common stock.
As a result of the decline in our stock price, our common stock was delisted from the New York Stock Exchange as of November 24, 2008 and since that date has traded over-the-counter on the OTC Bulletin Board which has, among other things, constrained the liquidity of our common stock. As part of this offering, we have applied to list our common stock on the NASDAQ Global Market. However, there can be no assurance that following this offering an active trading market on the NASDAQ Global Market will be maintained, that our common stock price will increase or that our common stock will continue to trade on the exchange for any specific period of time.
Sales of additional shares of common stock by Gores or our other lenders could adversely affect the stock price.
Gores Radio Holdings, LLC (“Gores”) beneficially owns, in the aggregate, 15,257,507 shares of our common stock (or approximately 75.1% of our outstanding common stock prior to this offering). There can be no assurance that at some future time Gores, or our other lenders, will not, subject to the applicable volume, manner of sale, holding period and limitations of Rule 144 under the Securities Act, sell additional shares of our common stock, which could adversely affect our share price. The perception that these sales might occur could also cause the market price of our common stock to decline. Such sales could also make it more difficult for us to sell equity or equity-related securities in the future at a time and price that we deem appropriate.
We have broad discretion in the use of a portion of the net proceeds from this offering, and we may not use these proceeds effectively.
We anticipate that we will use $15.0 million or $20.0 million of the net proceeds of this offering to repay a portion of our outstanding Senior Notes. Our management will have broad discretion in the application of the remaining net proceeds from this offering and could spend the proceeds in ways that do not necessarily improve our results of operations or enhance the value of our common stock. Other than using the remaining net proceeds for general corporate purposes and working capital, we cannot specify with certainty the uses to which we will apply these net proceeds. The failure by our management to apply these funds effectively could result in financial losses that could have a material adverse effect on our business or financial condition and could cause the price of our common stock to decline.
Gores will be able to exert significant influence over us and our significant corporate decisions and may act in a manner that advances its best interest and not necessarily those of other stockholders.
As a result of its beneficial ownership of 15,257,507 shares of our common stock, or approximately 75.1% of our voting power, Gores has voting control over our corporate actions. For so long as Gores continues to beneficially own shares of common stock (including preferred stock on an as-converted
24
Table of Contents
Risk factors
basis) representing more than 50% of the voting power of our common stock, it will be able to elect all of the members of our board of directors and determine the outcome of all matters submitted to a vote of our stockholders, including matters involving mergers or other business combinations, the acquisition or disposition of assets, the incurrence of indebtedness, the issuance of any additional shares of common stock or other equity securities and the payment of dividends on common stock. Gores may act in a manner that advances its best interests and not necessarily those of other stockholders by, among other things:
| Ø | delaying, deferring or preventing a change in control; |
| Ø | impeding a merger, consolidation, takeover or other business combination; |
| Ø | discouraging a potential acquirer from making a tender offer or otherwise attempting obtain control; or |
| Ø | causing us to enter into transactions or agreements that are not in the best interests of all stockholders. |
Provisions in our restated certificate of incorporation and by-laws and Delaware law may discourage, delay or prevent a change of control of our company or changes in our management and, therefore, depress the trading price of our common stock.
Provisions of our restated certificate of incorporation and by-laws and Delaware law may discourage, delay or prevent a merger, acquisition or other change in control that stockholders may consider favorable, including transactions in which you might otherwise receive a premium for your shares of our common stock. These provisions may also prevent or frustrate attempts by our stockholders to replace or remove our management. The existence of the foregoing provisions and anti-takeover measures could limit the price that investors might be willing to pay in the future for shares of our common stock. They could also deter potential acquirers of our company, thereby reducing the likelihood that you could receive a premium for your common stock in an acquisition.
In addition, we are subject to the provisions of Section 203 of the Delaware General Corporation Law, which may prohibit certain business combinations with stockholders owning 15% or more of our outstanding voting stock. This provision of the Delaware General Corporation Law could delay or prevent a change of control of our company, which could adversely affect the price of our common stock.
We do not anticipate paying dividends on our common stock.
We do not anticipate paying any cash dividends on our common stock in the foreseeable future. We currently anticipate that we will retain all of our available cash, if any, for use as working capital and for other general corporate purposes. Any payment of future cash dividends will be at the discretion of our board of directors and will depend upon, among other things, our earnings, financial condition, capital requirements, level of indebtedness, statutory and contractual restrictions applying to the payment of dividends and other considerations that our board of directors deems relevant. Investors must rely on sales of their common stock after price appreciation, which may never occur, as the only way to realize a return on their investment. Investors seeking cash dividends should not purchase shares of our common stock. In addition, our Senior Credit Facility and the Senior Notes restrict the payment of dividends.
25
Table of Contents
Risk factors
Any issuance of shares of preferred stock by us could delay or prevent a change of control of our company, dilute the voting power of the common stockholders and adversely affect the value of our common stock.
Our board of directors has the authority to cause us to issue, without any further vote or action by the stockholders, up to 10,000,000 shares of preferred stock, in one or more series, to designate the number of shares constituting any series, and to fix the rights, preferences, privileges and restrictions thereof, including dividend rights, voting rights, rights and terms of redemption, redemption price or prices and liquidation preferences of such series. To the extent we choose to issue preferred stock, any such issuance may have the effect of delaying, deferring or preventing a change in control of our company without further action by the stockholders, even where stockholders are offered a premium for their shares.
The issuance of shares of preferred stock with voting rights may adversely affect the voting power of the holders of our other classes of voting stock either by diluting the voting power of our other classes of voting stock if they vote together as a single class, or by giving the holders of any such preferred stock the right to block an action on which they have a separate class vote even if the action were approved by the holders of our other classes of voting stock.
The issuance of shares of preferred stock with dividend or conversion rights, liquidation preferences or other economic terms favorable to the holders of preferred stock could adversely affect the market price for our common stock by making an investment in the common stock less attractive. For example, investors in the common stock may not wish to purchase common stock at a price above the conversion price of a series of convertible preferred stock because the holders of the preferred stock would effectively be entitled to purchase common stock at the lower conversion price causing economic dilution to the holders of common stock.
26
Table of Contents
Cautionary note regarding forward-looking statements
This prospectus and the documents incorporated by reference contain forward-looking statements that involve risks and uncertainties, which are based on beliefs, expectations, estimates, projections, forecasts, plans, anticipations, targets, outlooks, initiatives, visions, objectives, strategies, opportunities, drivers and intents of our management. Such statements are made in reliance upon the safe harbor provisions of the Private Securities Litigation Reform Act of 1995. Such statements include, without limitation, our expectations and estimates (whether qualitative or quantitative) as to our intention and ability, including as a result of market conditions or restrictions under our credit agreements, other contractual arrangements or applicable law, to issue securities pursuant to this prospectus. In addition to factors that may be described in this prospectus and the documents incorporated by reference, our determination not to, or difficulties, delays or unanticipated costs in or our inability to, including as a result of market conditions or restrictions under our indentures, credit agreements, other contractual arrangement or applicable law, issue securities pursuant to this prospectus, among others factors, could cause our actual results to differ materially from those expressed in any forward-looking statements made by us. While we believe that our estimates and assumptions are reasonable, we caution that it is very difficult to predict the impact of known factors, and, of course, impossible for us to anticipate all factors that could affect our actual results. We discuss certain of these risks in greater detail in the “Risk Factors” section of this prospectus. Our actual results may differ materially from those discussed in such forward-looking statements.
Statements that are not historical facts, including statements about our beliefs and expectations, are forward-looking statements. Forward-looking statements can be identified by, among other things, the use of forward-looking language, such as “believes,” “expects,” “estimates,” “projects,” “forecasts,” “plans,” “anticipates,” “targets,” “outlooks,” “initiatives,” “visions,” “objectives,” “strategies,” “opportunities,” “drivers,” “intends,” “scheduled to,” “seeks,” “may,” “will,” or “should” or the negative of those terms, or other variations of those terms or comparable language, or by discussions of strategy, plans, targets, models or intentions. Forward-looking statements speak only as of the date they are made, and except for our ongoing obligations under the US federal securities laws, we undertake no obligation to publicly update any forward-looking statements, whether as a result of new information, future events or otherwise or to update the reasons actual results could differ materially from those anticipated in these forward-looking statements.
27
Table of Contents
We estimate that the net proceeds from the sale of shares by us in the offering, after deducting estimated underwriting discounts and commissions and estimated offering expenses payable by us, will be $ million, assuming a public offering price of $ per share, which was the last reported sale price of our common stock on , 2009. We will not receive any proceeds from the sale of common stock by the selling stockholders.
We anticipate that we will use the net proceeds of this offering to repay $15.0 million or $20.0 million of our outstanding Senior Notes pursuant to our agreement with the holders of our Senior Notes. Our Senior Notes bear interest at 15.0% per annum, payable 10.0% in cash and 5.0% in-kind, and mature on July 15, 2012. The proceeds from the issuance of our Senior Notes were used in part to induce our lenders to release their claims under our Old Notes and our Old Credit Agreement. We anticipate that we will use the remainder of the net proceeds of this offering for general corporate purposes and working capital, which may include:
| Ø | pursuit of possible acquisitions of complementary businesses or other assets; |
| Ø | funding our growth initiatives; and |
| Ø | repayment of additional indebtedness. |
Other than the agreements with the holders of our Senior Notes and Wells Fargo Foothill to pay down the Senior Notes in an amount of either $15.0 or 20.0 million, depending on the amount of gross proceeds of the offering, we have no definitive agreements or commitments with respect to any of the above activities. However, as discussed elsewhere in this prospectus, we have an option to purchase TrafficLand, a provider of traffic video collected from local and state Departments of Transportation, which is exercisable by us on or prior to December 1, 2009. While no definitive decision has been made regarding whether to exercise this option, to the extent we were to acquire TrafficLand, $11 million of the $26 million purchase price would be due at closing (which must occur on or prior to December 31, 2009) and would be funded from the net proceeds of this offering. Our management may decide to change the use of the net proceeds from this offering if opportunities or needs arise. Such opportunities and needs could include payment of certain contractual obligations, the need to make increased capital or operating expenditures if we change our business plan, or payment of an unexpected liability. Additionally, as described in more detail in the section entitled “Management’s Discussion and Analysis of Financial Condition and Results of Operations—Liquidity” of this prospectus, subject to certain limited exceptions, our lenders must consent to any merger, acquisition of the stock or assets of another business, or investment (including TrafficLand to the extent we exercise the option), which consent they may or may not provide in connection with any acquisition/investment opportunity we identify. Pending the foregoing uses, we intend to invest the net proceeds in high quality, investment grade US government-backed obligations. The actual use of the proceeds may vary significantly and will depend on a number of factors, including our future revenue and cash generated by operations and the other factors described in the section entitled “Risk Factors” appearing elsewhere in this prospectus. Accordingly, our management will have broad discretion in applying the net proceeds of this offering.
28
Table of Contents
We last declared a dividend on our common stock on March 6, 2007, when our Board of Directors declared a cash dividend of $3.85 per share for every issued and outstanding share of common stock and $3.20 per share for every issued and outstanding share of Class B stock.
We do not anticipate paying any cash dividends in the foreseeable future. Instead, we anticipate that all of our earnings, if any, in the foreseeable future will be used to repay debt, for working capital, to support our operations and to finance the growth and development of our business. Any future determination relating to dividend policy will be made at the discretion of our board of directors and will depend on a number of factors, including restrictions in our debt instruments, our future earnings, capital requirements, financial condition, future prospects and other factors that the board of directors may deem relevant. The terms of our Senior Credit Facility and Senior Notes also restrict our ability to pay dividends or make distributions.
On August 3, 2009, a 200:1 reverse stock split was declared and effective. All per share amounts have been adjusted for this split (see Note 1 to the Annual Consolidated Financial Statements).
29
Table of Contents
The following table sets forth our capitalization as of June 30, 2009:
| Ø | on an actual basis; |
| Ø | on a pro forma basis giving effect to: (i) the conversion of all shares of our Series A-1 Preferred Stock (3,500 shares of which were converted on July 9, 2009 and the remainder of which automatically converted on August 3, 2009) and Series B Preferred Stock (which automatically converted on August 3, 2009) into an aggregate of 19,280,918 shares of common stock; (ii) the automatic conversion of all outstanding shares of Class B stock into an aggregate of 1,459 shares of shares of common stock which occurred on July 9, 2009; and (iii) a 200 for 1 reverse stock split of our common stock which occurred on August 3, 2009; and |
| Ø | on a pro forma as adjusted basis to reflect the sale of the shares of our common stock offered by us and the selling stockholders at an assumed public offering price of $ per share, which was the last reported sale price of our common stock on , 2009. |
The table below is depicted on a pro forma basis to reflect a beneficial conversion feature contained in the Preferred Stock and accretion of the Preferred stock to redemption value as described elsewhere in this prospectus in more detail.
You should read this table together with “Management’s Discussion and Analysis of Financial Condition and Results of Operations,” “Description of Capital Stock” and our consolidated financial statements and the related notes, each included elsewhere in this prospectus.
| As of June 30, 2009 | |||||||||||
| Actual | Pro forma | Pro forma as adjusted | |||||||||
| (in thousands, except per share data) | |||||||||||
| Cash and cash equivalents |
$ | 7,980 | $ | 7,980 | $ | ||||||
| Long-term debt |
128,078 | 128,078 | $ | ||||||||
| Deferred tax liability |
63,845 | 63,845 | |||||||||
| Due to Gores |
10,891 | 10,891 | |||||||||
| Other liabilities |
10,551 | 10,551 | |||||||||
| TOTAL LIABILITIES |
213,365 | 213,365 | |||||||||
| Commitments and Contingencies |
|||||||||||
| Redeemable Preferred Stock: $.01 par value, authorized: 75 shares; issued and outstanding: 75 shares of 7.5% Series A-1 Preferred Stock; liquidation preference $1,065 per share, plus accumulated dividends, actual; -0- shares issued and outstanding, pro forma and pro forma as adjusted |
38,880 | — | |||||||||
| Redeemable Preferred Stock: $.01 par value, authorized: 60 shares; issued and outstanding: 60 shares of 8.0% Series B Convertible Preferred Stock; liquidation preference $1,000 per share, plus accumulated dividends, actual; -0- shares issued and outstanding, pro forma and pro forma as adjusted |
30,476 | — | |||||||||
| TOTAL REDEEMABLE PREFERRED STOCK |
69,356 | ||||||||||
| SHAREHOLDERS’ EQUITY |
|||||||||||
| Common stock, $.01 par value: 300,000 shares authorized and 510 outstanding, actual; 5,000,000 shares authorized and 20,312 outstanding, pro forma; 5,000,000 shares authorized and outstanding, pro forma as adjusted |
5 | 203 | |||||||||
| Class B stock, $.01 par value: 3,000 shares authorized and 292 outstanding, actual; 3000 shares authorized and -0- shares outstanding, pro forma and pro forma as adjusted |
3 | — | |||||||||
| Additional paid-in capital |
10,561 | 79,722 | |||||||||
| Net unrealized gain |
(95 | ) | (95 | ) | |||||||
| Accumulated deficit |
(6,184 | ) | (6,184 | ) | |||||||
| TOTAL SHAREHOLDERS’ EQUITY |
4,290 | 73,646 | |||||||||
| TOTAL LIABILITIES, REDEEMABLE PREFERRED STOCK AND SHAREHOLDERS’ EQUITY |
$ | 287,011 | $ | 287,011 | |||||||
| Total capitalization |
$ | 287,011 | $ | 287,011 | $ | ||||||
(footnotes on following page)
30
Table of Contents
Capitalization
| * | In connection with the Restructuring, we issued $117.5 million of Senior Notes. Additionally, we borrowed the entire amount of the $20.0 million term loan available to us under our Senior Credit Facility on April 23, 2009. The term loan was drawn on subsequent to the completion of the Restructuring. |
This table assumes no exercise by the underwriters of their option to purchase up to an additional shares from us and the selling stockholders to cover over-allotments.
The information in the table above also excludes:
| Ø | 31,705 shares of common stock issuable upon exercise of options outstanding as of June 30, 2009 at a weighted average exercise price of $7.16 per share; |
| Ø | 27,709 shares of common stock reserved as of June 30, 2009 for future issuance under our 1999 Stock Incentive Plan, and an additional 12,291 shares of common stock reserved for issuance after June 30, 2009; and |
| Ø | 3,996 shares of common stock reserved as of June 30, 2009 for future issuance under our 2005 Equity Compensation Plan, and an additional 42,004 shares of common stock reserved for issuance after June 30, 2009. |
31
Table of Contents
Selected consolidated and other financial data
The following tables summarize our consolidated financial and other data. The consolidated statements of operations data for the fiscal years ended December 31, 2006, 2007 and 2008 and the consolidated balance sheet data as of December 31, 2007 and 2008 have been derived from our audited consolidated financial statements included elsewhere in this prospectus. The consolidated statement of operations data for the fiscal years ended December 31, 2004 and 2005 and the consolidated balance sheet data as of December 31, 2004, 2005 and 2006 have been derived from our audited financial statements not included in this prospectus. The consolidated statement of operations data for the periods comprising the six months ended June 30, 2008 and 2009, and the consolidated balance sheet data as of June 30, 2009, have been derived from our unaudited consolidated financial statements included elsewhere in this prospectus. The unaudited consolidated financial statements have been prepared on a basis consistent with our audited financial statements and include, in the opinion of management, all adjustments that management considers necessary for the fair statement of the financial information set forth in those financial statements. The following financial data should be read in conjunction with, and is qualified by reference to, our consolidated financial statements and related notes and schedule included elsewhere in this prospectus and the information under “Management’s Discussion and Analysis of Financial Condition and Results of Operations.” Our historical results are not necessarily indicative of the results to be expected in any future period.
| Year ended December 31, | Predecessor Company | Successor Company |
|||||||||||||||||||||||||||
| For the six 2008 |
For the period |
For the period |
|||||||||||||||||||||||||||
| 2004(1) | 2005(1) | 2006 | 2007 | 2008 | |||||||||||||||||||||||||
| (in thousands, except per share data) | |||||||||||||||||||||||||||||
| Consolidated Statements of Operations Data: |
|||||||||||||||||||||||||||||
| Revenue |
$ | 562,246 | $ | 557,830 | $ | 512,085 | $ | 451,384 | $ | 404,416 | $ | 206,998 | $ | 111,474 | $ | 58,044 | |||||||||||||
| Operating Costs |
379,097 | 378,998 | 395,196 | 350,440 | 360,492 | 179,640 | 111,580 | 52,116 | |||||||||||||||||||||
| Depreciation and Amortization |
18,429 | 20,826 | 20,756 | 19,840 | 11,052 | 6,397 | 2,585 | 5,845 | |||||||||||||||||||||
| Corporate General and Administrative Expenses |
13,596 | 14,028 | 14,618 | 13,171 | 13,442 | 4,665 | 4,248 | 2,407 | |||||||||||||||||||||
| Goodwill Impairment |
— | — | 515,916 | — | 430,126 | 206,053 | — | — | |||||||||||||||||||||
| Restructuring Charges |
— | — | — | — | 14,100 | — | 3,976 | 1,454 | |||||||||||||||||||||
| Special Charges |
— | — | 1,579 | 4,626 | 13,245 | (a) | 8,853 | 12,819 | 368 | ||||||||||||||||||||
| Operating (Loss) Income |
151,124 | 143,978 | (435,980 | ) | 63,307 | (438,041 | ) |
|
(198,610) |
|
|
(23,734) |
|
|
(4,146) |
| |||||||||||||
| Net (Loss) Income |
86,955 | 77,886 | (469,453 | ) | 24,368 | (427,563 | ) | $ | (205,082 | ) | $ | (18,961 | ) | $ | (6,184 | ) | |||||||||||||
| NET (LOSS) INCOME attributable to Common Stockholders |
86,955 | 77,816 | (469,528 | ) | 24,363 | (430,644 | ) | $ | (205,270 | ) | $ | (22,037 | ) | $ | (9,595 | ) | |||||||||||||
| (Loss) Income Per Basic Share(2) |
|||||||||||||||||||||||||||||
| Common stock |
$ | 179.80 | $ | 171.56 | $ | (1,091.76 | ) | $ | 56.59 | $ | (878.73 | ) | $ | (431.24 | ) | $ | (43.64 | ) | $ | (18.85 | ) | ||||||||
| Class B stock |
$ | — | $ | 48.00 | $ | 51.20 | $ | 3.20 | $ | — | $ | — | $ | — | $ | — | |||||||||||||
| (Loss) Income Per Diluted Share(2) |
|||||||||||||||||||||||||||||
| Common stock |
$ | 175.65 | $ | 170.05 | $ | (1,091.76 | ) | $ | 56.38 | $ | (878.73 | ) | $ | (431.24 | ) | $ | (43.64 | ) | $ | (18.85 | ) | ||||||||
| Class B stock |
$ | — | $ | 48.00 | $ | 51.20 | $ | 3.20 | $ | — | $ | — | $ | — | $ | — | |||||||||||||
| Dividends Declared(2) |
|||||||||||||||||||||||||||||
| Common stock |
$ | — | $ | 59.44 | $ | 64.10 | $ | 3.85 | $ | — | $ | — | $ | — | $ | — | |||||||||||||
| Class B stock |
$ | — | $ | 48.00 | $ | 51.20 | $ | 3.20 | $ | — | $ | — | $ | — | $ | — | |||||||||||||
|
(a) Does not include $3,272 of special charges classified as Operating Costs on the Statement of Operations.
Other Key Financial Metric: |
|
||||||||||||||||||||||||||||
| Stock-based compensation |
14,844 | 11,686 | 12,269 | 9,606 | 5,443 | 2,455 | 2,110 | 853 | |||||||||||||||||||||
32
Table of Contents
Selected consolidated and other financial data
| As of December 31, | As of June 30, | ||||||||||||||||||||||
| 2004(1) | 2005(1) | 2006 | 2007 | 2008 | 2008 | 2009(4) | |||||||||||||||||
| (in thousands) | |||||||||||||||||||||||
| Consolidated Balance Sheet Data(4): |
|||||||||||||||||||||||
| Current Assets |
$ | 174,346 | $ | 172,245 | $ | 149,222 | $ | 138,154 | $ | 119,468 | $ | 109,180 | $ | 107,454 | |||||||||
| Working Capital / (Deficit)(3) |
93,005 | 72,094 | 29,313 | 47,294 | (208,034 | ) | (15,181 | ) | 47,409 | ||||||||||||||
| Total Assets |
1,262,495 | 1,239,646 | 696,701 | 669,757 | 205,088 | 431,134 | 347,056 | ||||||||||||||||
| Long-Term Debt(3) |
359,439 | 427,514 | 366,860 | 345,244 | — | 199,495 | 128,078 | ||||||||||||||||
| Total Shareholders’ Equity (Deficit) |
800,709 | 704,029 | 202,931 | 227,631 | (203,145 | ) | 101,597 | 4,290 | |||||||||||||||
| Year ended December 31, | Predecessor Company | Successor Company | |||||||||||||||||||||||||||
| 2004(1) | 2005(1) | 2006 | 2007 | 2008 | Six |
For the |
For the | ||||||||||||||||||||||
| (in thousands) | |||||||||||||||||||||||||||||
| Other Financial Data: |
|||||||||||||||||||||||||||||
| Adjusted EBITDA(5) |
$ | 184,397 | $ | 176,490 | $ | 114,540 | $ | 97,378 | $ | 39,198 | $ | 25,149 | $ | (2,243 | ) | $ | 4,374 | ||||||||||||
| (1) | Effective January 1, 2006, we adopted Financial Accounting Standards Board (“FASB”) Statement of Financial Accounting Standards No. 123 (Revised 2004), “Share Based Payment” (“SFAS 123R”) utilizing the modified retrospective transition alternative. Accordingly, results for years prior to 2006 have been restated to reflect stock—based compensation expense in accordance with SFAS 123R. |
| (2) | No cash dividend was paid on our common stock or Class B stock in 2004 or 2008. The payment of dividends is restricted by the terms of our outstanding indebtedness and we do not plan on paying dividends for the foreseeable future. On August 3, 2009, a 200:1 reverse stock split was declared and effective. All per share amounts have been adjusted for this split (see Note 1 to the Annual Consolidated Financial Statements). |
| (3) | On November 30, 2008, we failed to make the interest payment on our previously outstanding senior notes which constituted an event of default under the then existing senior notes. Accordingly, $249,053 of debt previously considered long-term was re-classified as short-term debt, which resulted in a working capital deficit of $208,034 on December 31, 2008. |
| (4) | As a result of the Restructuring, we have followed the acquisition method of accounting, as described by SFAS 141R. Accordingly, we have revalued our assets and liabilities using our best estimate of current fair value. Our consolidated financial statements prior to the closing of the Restructuring reflect the historical accounting basis in our assets and liabilities and are labeled predecessor company, while the periods subsequent to the Restructuring are labeled successor company and reflect the push down basis of accounting for the fair values which were allocated to our segments based on the business Enterprise Value of each. Deferred tax liabilities have been recorded as a part of acquisition accounting to reflect the future taxable income to be recognized relating to the cancellation of indebtedness income as well as the deferred tax liability related to the acquisition accounting. |
| In connection with the Restructuring and the issuance of the Preferred Stock, we have determined that the Preferred Stock contained BCF that was partially contingent. BCF is measured as the spread between the effective conversion price and the market price of common stock on the commitment date and then multiplying this spread by the number of conversion shares. We recognized the portion of the BCF that was not related to the contingent shares at issuance (issuance BCF) while the majority of the BCF was contingent (contingent BCF) upon the authorization of additional common shares that occurred on August 3, 2009. Because such shares were authorized on August 3, 2009, the contingent BCF was recognized on such date in the third quarter and, due to the immediate conversion of the Preferred Stock into common stock on such date, resulted in a deemed dividend of $65.9 million that will be included in our third quarter 2009 earnings per share. |
| (5) | Adjusted EBITDA is a non-GAAP financial measure (ie., it is not a measure of financial performance under generally accepted accounting principles) and should not be considered in isolation or as a substitute for consolidated statements of operations and cash flow data prepared in accordance with GAAP. We use Adjusted EBITDA to calculate our compliance with our leverage ratio covenants under our Senior Credit Facility and Senior Notes. We believe the presentation of Adjusted EBITDA is relevant and useful for investors because it allows investors to view performance in the same manner as our lenders (who also own approximately 23.0% of our equity as a result of the Restructuring, excluding Gores). |
(footnotes on following page)
33
Table of Contents
Selected consolidated and other financial data
| Our maximum senior leverage ratio (also referred to herein as our “debt leverage covenant”), defined as the principal amount of Senior Notes over our Consolidated EBITDA (defined below), is measured on a trailing, four-quarter basis. The covenant is the same under our Securities Purchase Agreement (“SPA”), governing the Senior Notes and our Senior Credit Facility with Wells Fargo Foothill (governing the term loan and revolver) except that they have different maximum levels. We have presented the more restrictive of the two levels below. |
| Quarter ending |
Senior leverage ratio covenant |
Principal amount of senior notes (includes PIK)* |
Required adjusted EBITDA* | |||
| 12/31/09 | 6.25 to 1.0 | 106.9 | 17.1 | |||
| 3/31/10 | 6.00 to 1.0 | 108.3 | 18.1 | |||
| 6/30/10 | 5.5 to 1.0 | 109.6 | 19.9 | |||
| 9/30/10 | 5.00 to 1.0 | 111.0 | 22.2 | |||
| 12/31/10 | 4.50 to 1.0 | 112.4 | 25.0 | |||
| 3/31/11 | 4.25 to 1.0 | 113.8 | 26.8 | |||
| 6/30/11 | 4.00 to 1.0 | 115.2 | 28.8 | |||
| 9/30/11 | 3.75 to 1.0 | 116.7 | 31.1 | |||
| 12/31/11 | 3.50 to 1.0 | 118.1 | 33.7 | |||
| 3/31/12 | 3.50 to 1.0 | 119.6 | 34.2 | |||
| 6/30/12 | 3.50 to 1.0 | 121.1 | 34.6 |
| * | Numbers presented in the last two columns are dollars in millions and have been rounded to the nearest tenth. As described elsewhere in this prospectus under the heading “Use of Proceeds” we will use between $15.0 and $20.0 million of the proceeds of the offering to repay outstanding indebtedness. The above chart reflects a repayment of $15.0 million of the $117.5 principal amount of Senior Notes presently outstanding and includes the PIK interest that accrues on a quarterly basis. |
| As described below in more detail, on October 14, 2009, we entered into agreements with the holders of our Senior Notes and Wells Fargo Foothill to waive compliance with our debt leverage covenants under our Senior Notes and Senior Credit Facility, respectively, which levels were scheduled to be measured on December 31, 2009. Accordingly, the first measurement period will occur on March 31, 2010. |
| Consolidated EBITDA has the same definition in both agreements and means Consolidated Net Income (as defined in such agreements) for Westwood One and its subsidiaries adjusted for the following: |
(a) minus any net gain or plus any loss arising from the sale or other disposition of capital assets;
(b) plus any provision for taxes based on income or profits;
(c) plus consolidated net interest expense;
(d) plus depreciation, amortization and other non-cash losses, charges or expenses (including impairment of intangibles and goodwill);
(e) minus any “extraordinary,” “unusual,” “special” or “non-recurring” earnings or gains or plus any “extraordinary,” “unusual,” “special” or “non-recurring” losses, charges or expenses;
(f) plus restructuring expenses or charges;
(g) plus non-cash compensation recorded from grants of stock appreciation or similar rights, stock options, restricted stock or other rights;
(h) plus any Permitted Glendon/Affiliate Payments (as described below);
(i) plus any Transaction Costs (as described below);
(j) minus any deferred credit (or amortization of a deferred credit) arising from the acquisition of any Person; and
(k) minus any other non-cash items increasing such Consolidated Net Income (including, without limitation, any write-up of assets);
| in each case to the extent taken into account in the determination of such Consolidated Net Income, and determined without duplication and on a consolidated basis in accordance with GAAP. “Permitted Glendon/Affiliate Payments” means payments made at our discretion to Gores and its affiliates including Glendon Partners for consulting services provided to Westwood One and “Transaction Costs” refers to the fees, costs and expenses incurred by us in connection with the Restructuring. |
Under the amended terms of our indebtedness, our financial covenant will first be measured on March 31, 2010 based on our trailing four-quarter EBITDA. Our Adjusted EBITDA (which is the same as “Consolidated EBITDA” described above) for the three-month period ended June 30, 2009 was $9.1 million. In order to satisfy our 6.00 covenant under the terms of our Senior
(footnotes on following page)
34
Table of Contents
Selected consolidated and other financial data
Notes (which is more restrictive than the 6.90 covenant set forth in our Senior Credit Facility) on March 31, 2010, we would require Adjusted EBITDA (for the three quarters ended March 31, 2010) of $9.0 million or greater. This assumes the amount of Senior Notes outstanding on March 31, 2010 is reduced by $15.0 million from the proceeds of this offering and includes PIK interest accrued through March 31, 2010. This compares with Adjusted EBITDA of $16.2 million on June 30, 2009, on a trailing four-quarter basis, which amount does not include the full benefit of the cost reduction programs undertaken by us and described elsewhere in this prospectus in more detail.
Adjusted EBITDA, as we calculate it, may not be comparable to similarly titled measures employed by other companies. While Adjusted EBITDA does not necessarily represent funds available for discretionary use, and is not necessarily a measure of our ability to fund our cash needs, we use Adjusted EBITDA as a liquidity measure, which is different from our operating cash flow, the most directly comparable financial measure calculated and presented in accordance with GAAP. We have provided below the requisite reconciliation of operating cash flow to Adjusted EBITDA. Adjusted EBITDA, a non-GAAP measure, for the combined six months ended June 30, 2009 was $2.1 million as previously reported in our second quarter earnings press release.
| Predecessor Company | Successor Company |
|||||||||||||||||||||||||||||||||||
| Year ended December 31, | Six months ended June 30, |
For the period January 1, 2009 to April 23, 2009(4) |
For the period April 24, 2009 to June 30, 2009(4) |
|||||||||||||||||||||||||||||||||
| 2004 | 2005 | 2006 | 2007 | 2008 | 2008 | |||||||||||||||||||||||||||||||
| (in thousands) | ||||||||||||||||||||||||||||||||||||
| Net Cash Provided by (Used in) Operating Activities |
$ | 117,456 | $ | 118,290 | $ | 104,251 | $ | 27,901 | $ | 2,038 | $ | (4,842 | ) | $ | (777 | ) | $ | (14,327 | ) | |||||||||||||||||
| Interest expense |
11,911 | 18,315 | 25,590 | 23,626 | 16,651 | 9,751 | 3,222 | 4,692 | ||||||||||||||||||||||||||||
| Income taxes (benefit) |
53,206 | 49,217 | 8,809 | 15,724 | (14,760 | ) | (3,194 | ) | (7,635 | ) | (2,650 | ) | ||||||||||||||||||||||||
| Restructuring |
— | — | — | — | 14,100 | — | 3,976 | 1,454 | ||||||||||||||||||||||||||||
| Special charges |
— | — | 1,579 | 4,626 | 16,517 | 8,853 | 12,819 | 368 | ||||||||||||||||||||||||||||
| Investment income |
(157 | ) | (436 | ) | (394 | ) | — | (207 | ) | (84 | ) | (359 | ) | (4 | ) | |||||||||||||||||||||
| Other non-operating income |
(791 | ) | (42 | ) | (532 | ) | (412 | ) | (998 | ) | — | (188 | ) | (76 | ) | |||||||||||||||||||||
| Deferred taxes |
5,276 | 7,451 | 20,546 | 6,480 | 13,907 | 7,196 | 6,874 | (2,162 | ) | |||||||||||||||||||||||||||
| Amortization of deferred financing costs |
(709 | ) | (333 | ) | (359 | ) | (481 | ) | (1,674 | ) | (792 | ) | (331 | ) | — | |||||||||||||||||||||
| Change in assets and liabilities |
(1,795 | ) | (15,972 | ) | (44,950 | ) | 19,914 | (6,376 | ) | 8,261 | (19,844 | ) | 17,079 | |||||||||||||||||||||||
| Adjusted EBITDA |
$ | 184,397 | $ | 176,490 | $ | 114,540 | $ | 97,378 | $ | 39,198 | $ | 25,149 | $ | (2,243 | ) | $ | 4,374 | |||||||||||||||||||
35
Table of Contents
Unaudited pro forma financial information
For purposes of this prospectus we have prepared the following pro forma financial statements which reflect information currently available to management and assumptions management believes to be reasonable.
The following unaudited pro forma financial information is derived from our unaudited historical financial statements as of and for the six months ended June 30, 2009 and from the audited historical financial statements for the twelve months ended December 31, 2008 and reflect the Restructuring, the resultant acquisition accounting and the conversion of the Class B stock (which occurred on July 9, 2009), the Series A-1 Preferred Stock (3,500 shares of which were converted on July 9, 2009 and the remainder of which were automatically converted on August 3, 2009) and the Series B Preferred Stock (which automatically converted on August 3, 2009) to common stock and the effects of the 200:1 reverse stock split which occurred on August 3, 2009, (reflected in historical financial statements) as if each had been consummated as described below. We prepared the unaudited pro forma financial information using the acquisition method of accounting, which is based on SFAS 141R. SFAS 141R uses the fair value concepts defined in SFAS No. 157, “Fair Value Measurements” (“FAS 157”). The pro forma adjustments and related assumptions are described in the accompanying notes presented on the following pages. The pro forma adjustments are based upon best available information and certain assumptions that our management believes are reasonable. The unaudited pro forma balance sheet as of June 30, 2009 has been prepared as if conversion of preferred stock into common stock had occurred on that date. The unaudited historical balance sheet as of June 30, 2009 already reflects the Restructuring and resultant acquisition accounting. The unaudited pro forma statements of operations for the year ended December 31, 2008 and the six months ended June 30, 2009 give effect to these events as if each had occurred on January 1, 2008.
As part of the Restructuring, our then existing debtholders released all of their existing obligations in exchange for (1) $117.5 million of Senior Notes, (2) 34,962 shares of Series B Preferred Stock, and (3) a one-time cash payment of $25.0 million. We also entered into the Senior Credit Facility pursuant to which we have a $15.0 million revolving line of credit and a $20.0 million unsecured non-amortizing term loan. As of May 31, 2009, we had borrowed the entire amount under the term loan and we had not made any borrowings under the revolving line of credit.
In addition, Gores (1) agreed to purchase, at a discount, approximately $22.6 million principal amount of our then existing debt held by debt holders who did not wish to participate in the new notes, (2) agreed to guarantee the Senior Credit Facility and a $10.0 million contractual commitment by one of our wholly owned subsidiaries and (3) invested $25.0 million in the Company for 25,000 shares of Series B Preferred Stock. In connection with Gores providing the guarantees and purchasing the debt from non-participating holders, the 75,000 shares of Series A Preferred Stock held by Gores immediately prior to the refinancing, which then had a liquidation preference of approximately $79.0 million, were exchanged for 75,000 shares of Series A-1 Preferred Stock with a per share conversion price which provided Gores with an approximately 54.6% interest in the Company after the refinancing. Taking into account Gores’ Series B Preferred Stock, Series A-1 Preferred Stock and common stock, upon the consummation of the Restructuring, Gores’ ownership in the Company increased from approximately 36% to 75.1%. Accordingly, the Restructuring, when considering the ownership held by Gores as well as the ownership held by our then existing debt holders, constituted a change of control transaction that requires us to follow the purchase method of accounting, as described by Statement of Financial Accounting Standards (SFAS) 141R, “Business Combinations” (“SFAS 141R”).
36
Table of Contents
Unaudited pro forma financial information
We have considered the ownership held by Gores and our then existing debt holders as a collaborative group in accordance with Emerging Issues Task Force D-97, “Push Down Accounting”. As a result, we have followed the acquisition method of accounting, as described by SFAS 141R, and applied the SEC rules and guidance regarding “push down” accounting treatment. Accordingly, our consolidated financial statements and transactional records prior to the closing of the Restructuring reflect the historical accounting basis in our assets and liabilities and are labeled predecessor company, while such records subsequent to the Restructuring are labeled successor company and reflect the push down basis of accounting for the new fair values in our financial statements. This is presented in our consolidated financial statement by a vertical black line division that appears between the columns entitled predecessor company and successor company on the statements and relevant notes. The black line in our historical financial statements signifies that the amounts shown for the periods prior to and subsequent to the Restructuring are not comparable.
The pro forma adjustments are preliminary and have been made solely for purposes of developing the pro forma financial information for illustrative purposes necessary to comply with the requirements of the SEC. The actual results reported in periods following the transactions may differ significantly from those reflected in these pro forma financial statements for a number of reasons, including but not limited to, differences between the assumptions used to prepare these pro forma financial statements and actual amounts. In addition, no adjustments have been made for non-recurring items related to the transactions. As a result, the pro forma information does not purport to be indicative of what the financial condition or results of operations would have been had the transactions been completed on the applicable dates of this pro forma financial information. The pro forma financial statements are based upon historical financial statements and do not purport to project the future financial condition and results of operations after giving effect to the transactions.
The pro forma adjustments described below have been developed based on assumptions and adjustments, including assumptions relating to the purchase price and the allocation thereof to the assets acquired and liabilities assumed based on preliminary estimates of fair value. The final purchase price allocation could differ from that reflected in the pro forma financial statements.
The following unaudited pro forma financial information should be read in conjunction with, and is qualified by reference to, our consolidated financial statements as of December 31, 2008 and for each of the years in the three-year period ended December 31, 2008, including the accompanying notes thereto, which are included in this prospectus and our unaudited consolidated financial statements as of June 30, 2009 and for each of the six-month periods ended June 30, 2009 and 2008, including the accompanying notes thereto, which are included in this prospectus, and the information under “Management’s Discussion and Analysis of Financial Condition and Results of Operations.”
37
Table of Contents
Unaudited pro forma balance sheet
June 30, 2009
(in thousands, except share and per share amounts)
| Pro forma adjustments | ||||||||||||
| Historical | Conversion related |
Pro forma | ||||||||||
| Assets |
||||||||||||
| Current Assets: |
||||||||||||
| Cash and cash equivalents |
$ | 7,980 | $ | 7,980 | ||||||||
| Accounts receivable |
82,448 | 82,448 | ||||||||||
| Prepaid and other assets |
17,026 | 17,026 | ||||||||||
| Total Current Assets |
107,454 | — | 107,454 | |||||||||
| Property and equipment |
36,357 | 36,357 | ||||||||||
| Goodwill |
86,414 | 86,414 | ||||||||||
| Intangible assets |
112,032 | 112,032 | ||||||||||
| Deferred tax asset |
2,385 | 2,385 | ||||||||||
| Other assets |
2,414 | 2,414 | ||||||||||
| Total Assets |
$ | 347,056 | $ | — | $ | 347,056 | ||||||
| Liabilities, Redeemable Preferred Stock And Shareholders’ Equity (Deficit) |
||||||||||||
| Current Liabilities: |
||||||||||||
| Accounts payable |
$ | 17,588 | $ | 17,588 | ||||||||
| Amounts payable to related parties |
20,128 | 20,128 | ||||||||||
| Deferred revenue |
2,681 | 2,681 | ||||||||||
| Accrued expenses and other liabilities |
19,648 | 19,648 | ||||||||||
| Current maturity of long-term debt |
— | — | ||||||||||
| Total Current Liabilities |
60,045 | — | 60,045 | |||||||||
| Long-term debt |
128,078 | 128,078 | ||||||||||
| Deferred tax liability |
63,845 | 63,845 | ||||||||||
| Due to Gores |
10,891 | 10,891 | ||||||||||
| Other liabilities |
10,551 | 10,551 | ||||||||||
| Total Liabilities |
273,410 | — | 273,410 | |||||||||
| Commitments and Contingencies |
||||||||||||
| Series A-1 Redeemable Preferred Stock |
38,880 | |||||||||||
| BCF Contingency |
(36,941 | )(B) | — | |||||||||
| Effect of conversion on BCF |
42,828 | (B) | ||||||||||
| Conversion to Common Stock |
(44,767 | )(B) | ||||||||||
| Series B Redeemable Preferred Stock |
30,476 | |||||||||||
| BCF Contingency |
(29,005 | )(B) | — | |||||||||
| Effect of conversion on BCF |
33,627 | (B) | ||||||||||
| Conversion to Common Stock |
(35,098 | )(B) | ||||||||||
| Total Redeemable Preferred Stock |
69,356 | (69,356 | ) | — | ||||||||
| Shareholders’ Equity (Deficit) |
||||||||||||
| Common stock |
5 | 198 | (B) | 203 | ||||||||
| Class B stock |
3 | (3 | )(B) | — | ||||||||
| Additional paid-in capital |
10,561 | 69,161 | (B) | 79,722 | ||||||||
| Net unrealized gain |
(95 | ) | (95 | ) | ||||||||
| Accumulated deficit |
(6,184 | ) | (6,184 | ) | ||||||||
| Total Shareholders’ Equity (Deficit) |
4,290 | 69,356 | 73,646 | |||||||||
| Total Liabilities, Redeemable Preferred Stock and Shareholders’ Equity (Deficit) |
$ | 347,056 | $ | — | $ | 347,056 | ||||||
See accompanying notes to the unaudited pro forma financial information
38
Table of Contents
Unaudited pro forma statement of operations
for the six months ended June 30, 2009
(in thousands, except share and per share amounts)
| Pro forma adjustments |
||||||||||||||||
| Historical | Acquisition related |
Conversion related |
Pro forma |
|||||||||||||
| Net Revenue |
$ | 169,518 | $ | 169,518 | ||||||||||||
| Operating Costs |
163,696 | 163,696 | ||||||||||||||
| Depreciation and Amortization |
8,430 | 121 | (A)(C) | 8,551 | ||||||||||||
| Corporate General and Administrative Expenses |
6,655 | 6,655 | ||||||||||||||
| Restructuring Charges |
5,430 | 5,430 | ||||||||||||||
| Special Charges |
13,187 | 13,187 | ||||||||||||||
| 197,398 | 121 | — | 197,519 | |||||||||||||
| Operating (Loss) |
(27,880 | ) | (121 | ) | — | (28,001 | ) | |||||||||
| Interest Expense |
7,914 | 919 | (D) | 8,833 | ||||||||||||
| Other Income |
(363 | ) | (363 | ) | ||||||||||||
| (Loss) Before Income Tax |
(35,431 | ) | (1,040 | ) | — | (36,471 | ) | |||||||||
| Income Tax (Benefit) Expense |
(10,286 | ) | (302 | )(F) | (10,588 | ) | ||||||||||
| Net (Loss) |
$ | (25,145 | ) | $ | (738 | ) | $ | — | $ | (25,883 | ) | |||||
| Net (Loss) Income Attributable to Common Shareholders |
$ | (31,632 | ) | $ | (738 | ) | $ | 6,487 | (G) | $ | (25,883 | ) | ||||
| (Loss) Per Share |
||||||||||||||||
| Common Stock |
||||||||||||||||
| Basic |
$ | (62.49 | ) | $ | 61.18 | $ | (1.27 | ) | ||||||||
| Diluted |
$ | (62.49 | ) | $ | 61.18 | $ | (1.27 | ) | ||||||||
| Class B Stock |
||||||||||||||||
| Basic |
$ | — | $ | — | ||||||||||||
| Diluted |
$ | — | $ | — | ||||||||||||
| Weighted Average Shares Outstanding: |
||||||||||||||||
| Common Stock |
||||||||||||||||
| Basic |
506 | 19,800 | (G) | 20,306 | ||||||||||||
| Diluted |
506 | 19,800 | (G) | 20,306 | ||||||||||||
| Class B Stock* |
||||||||||||||||
| Basic |
292 | (292 | )(G) | — | ||||||||||||
| Diluted |
292 | (292 | )(G) | — | ||||||||||||
| * | Reverse stock split not reflected in historical total. Class B stock was converted into common stock prior to effectiveness of reverse stock split. |
See accompanying notes to the unaudited pro forma financial information
39
Table of Contents
Unaudited pro forma statement of operations
For the twelve months ended December 31, 2008
(in thousands, except share and per share amounts)
| Pro forma adjustments | ||||||||||||||||
| Historical | Acquisition related |
Conversion related |
Pro forma | |||||||||||||
| Net Revenue |
$ | 404,416 | $ | 404,416 | ||||||||||||
| Operating Costs (includes related party expenses of $73,049) |
360,492 | 360,492 | ||||||||||||||
| Depreciation and Amortization (includes related party warrant amortization of $1,618) |
11,052 | 17,399 | (A)(C) | 28,451 | ||||||||||||
| Corporate General and Administrative Expenses (includes related party expenses of $610) |
13,442 | 13,442 | ||||||||||||||
| Goodwill Impairment |
430,126 | 430,126 | ||||||||||||||
| Restructuring Charges |
14,100 | |
14,100 |
| ||||||||||||
| Special Charges (includes related party expenses of $5,000) |
13,245 | |
13,245 |
| ||||||||||||
| 842,457 | 17,399 | — | 859,856 | |||||||||||||
| Operating (Loss) |
(438,041 | ) | (17,399 | ) | — | (455,440 | ) | |||||||||
| Interest Expense |
16,651 | 1,717 | (D) | 18,368 | ||||||||||||
| Other Income |
(12,369 | ) | — | (12,369 | ) | |||||||||||
| (Loss) Before Income Tax |
(442,323 | ) | (19,116 | ) | — | (461,439 | ) | |||||||||
| Income Tax (Benefit) Expense |
(14,760 | ) | (5,706 | )(F) | (20,466 | ) | ||||||||||
| Net (Loss) |
$ | (427,563 | ) | $ | (13,410 | ) | $ | — | $ | (440,973 | ) | |||||
| Net (Loss) Income Attributable to Common Shareholders |
$ | (430,644 | ) | $ | (13,410 | ) | $ | 3,081 | (G) | $ | (440,973 | ) | ||||
| (Loss) Per Share |
||||||||||||||||
| Common Stock |
||||||||||||||||
| Basic |
$ | (878.73 | ) | $ | 857.00 | $ | (21.73 | ) | ||||||||
| Diluted |
$ | (878.73 | ) | $ | 857.00 | $ | (21.73 | ) | ||||||||
| Class B Stock |
||||||||||||||||
| Basic |
$ | — | $ | — | ||||||||||||
| Diluted |
$ | — | $ | — | ||||||||||||
| Weighted Average Shares Outstanding: |
||||||||||||||||
| Common Stock |
||||||||||||||||
| Basic |
490 | 19,800 | (G) | 20,290 | ||||||||||||
| Diluted |
490 | 19,800 | (G) | 20,290 | ||||||||||||
| Class B Stock |
||||||||||||||||
| Basic |
1 | (1 | )(G) | — | ||||||||||||
| Diluted |
1 | (1 | )(G) | — | ||||||||||||
See accompanying notes to the unaudited pro forma financial information
40
Table of Contents
Notes to unaudited pro forma financial statements
(in thousands, except per share amounts)
NOTE 1. BASIS OF PRESENTATION
The unaudited pro forma financial statements were prepared using the acquisition method of accounting under existing US GAAP standards and are based on our historical consolidated financial statements for the twelve months ended December 31, 2008 and as of and for the six months ended June 30, 2009.
The unaudited pro forma balance sheet as of June 30, 2009 has been prepared as if conversion of preferred stock into common stock had occurred on that date. The unaudited historical balance sheet as of June 30, 2009 already reflects the Restructuring and resultant acquisition accounting. The unaudited pro forma statements of operations for the year ended December 31, 2008 and the six months ended June 30, 2009 give effect to these events as if each had occurred on January 1, 2008.
The unaudited pro forma financial information was prepared using the acquisition method of accounting, which is based on FAS 141R. which uses the fair value concepts defined in FAS 157. We have adopted both FAS 141R and FAS 157 as required.
FAS 141R requires, among other things, that most assets acquired and liabilities assumed be recognized at their fair values as of the acquisition date. In addition, FAS 141R establishes that the consideration transferred be measured at the closing date of the acquisition at the then-current market price. The transaction fees for the acquisition will be expensed as incurred under FAS 141R.
FAS 157 defines the term “fair value” and sets forth the valuation requirements for any asset or liability measured at fair value, expands related disclosure requirements and specifies a hierarchy of valuation techniques based on the nature of inputs used to develop the fair value measures. Fair value is defined in FAS 157 as “the price that would be received to sell an asset or paid to transfer a liability in an orderly transaction between market participants at the measurement date.” This is an exit price concept for the valuation of the asset or liability. In addition, market participants are assumed to be buyers and sellers in the principal market for the asset or liability. Fair value measurements for an asset assume the highest and best use by these market participants. Many of these fair value measurements can be highly subjective and it is also possible that other professionals, applying reasonable judgment to the same facts and circumstances, could develop and support a range of alternative estimated amounts.
The pro forma adjustments described below have been developed based on assumptions and adjustments, including assumptions relating to the purchase price and the allocation thereof to the assets acquired and liabilities assumed based on preliminary estimates of fair value. The final purchase price allocation may differ from that reflected in the pro forma financial statements.
The unaudited pro forma financial statements are provided for illustrative purposes only and do not purport to represent what our actual consolidated results of operations or consolidated financial position would have been had the acquisition occurred on the dates assumed, nor are they necessarily indicative of our future consolidated results of operations or financial position.
NOTE 2. UNAUDITED PRO FORMA ADJUSTMENTS—BALANCE SHEET
The Unaudited Pro Forma Balance Sheet as of June 30, 2009 reflects the conversion of all of the Class B stock (which occurred on July 9, 2009), the Series A-1 Preferred Stock (3,500 shares of which were converted on July 9, 2009 and the remainder of which automatically converted on August 3, 2009) and the Series B Preferred Stock to common stock which occurred on August 3, 2009 as if it had occurred on June 30, 2009.
41
Table of Contents
Notes to unaudited pro forma financial statements
(in thousands, except per share amounts)
(A) Acquisition Accounting
As a result of our Restructuring that closed in the second quarter, Gores acquired approximately 75.1% of our equity and our then existing lenders acquired approximately 23.0% of our equity. We have considered the ownership held by Gores and our existing debt holders as a collaborative group in accordance with EITF D-97, “Push Down Accounting”. As a result, we have followed the acquisition method of accounting, as described by SFAS 141R, and have applied the SEC rules and guidance regarding “push down” accounting treatment. Accordingly, our historical consolidated financial statements and transactional records prior to the closing of the Restructuring reflect the historical accounting basis in our assets and liabilities and are labeled predecessor company, while such records subsequent to the Restructuring are labeled successor company and reflect the push down basis of accounting for the new fair values in our financial statements. Additionally, our historical financial statements include revalued assets and liabilities, which were revalued using our best estimate of current fair value as required by the Restructuring.
Based on the complex structure of the Restructuring described above, a valuation was performed to determine the acquisition price using the Income Approach employing a Discounted Cash Flow (DCF) methodology. The DCF method explicitly recognizes that the value of a business enterprise is equal to the present value of the cash flows that are expected to be available for distribution to the equity and/or debt holders of a company. In the valuation of a business enterprise, indications of value are developed by discounting future net cash flows available for distribution to their present worth at a rate that reflects both the current return requirements of the market and the risk inherent in the specific investment.
We used a multi-year DCF model to derive a Total Invested Capital (TIC) value which was adjusted for cash, non-operating assets and any negative net working capital to calculate a Business Enterprise Value (BEV) which was then used to value our equity. In connection with the Income Approach portion of this exercise, we made the following assumptions: (a) the discount rate was based on an average of a range of scenarios with rates between 15% and 16%; (b) management’s estimates of future performance of our operations and; (c) a terminal growth rate of 2%. The discount rate and market growth rate reflect the risks associated with the general economic pressure impacting both the economy in general and more specifically and substantially the advertising industry. All costs and professional fees incurred as part of the Restructuring totaling approximately $15,777 have been expensed as special charges in periods ended April 23, 2009 and prior (the predecessor company).
The allocation of Business Enterprise Value is as follows:
| Purchase price | |||
| Current Assets |
$ | 104,641 | |
| Goodwill |
86,414 | ||
| Intangibles |
116,910 | ||
| Property, Plant and Equipment, Net |
36,270 | ||
| Other assets |
21,913 | ||
| Current Liabilities |
81,160 | ||
| Deferred Income Taxes |
77,879 | ||
| Due to Gores |
10,797 | ||
| Other Liabilities |
10,458 | ||
| Long-term debt |
106,703 | ||
| Total Estimated Purchase Price |
$ | 79,151 | |
42
Table of Contents
Notes to unaudited pro forma financial statements
(in thousands, except per share amounts)
We expect to finalize the valuation and complete the allocation of the Business Enterprise Value as soon as practicable but no later than one year from the acquisition date.
In accordance with FAS 141R which is applicable to the Restructuring and the change of control, we have revalued our Goodwill and Intangibles using our best estimate of current fair value. The value assigned to goodwill and indefinite lived intangible assets is not amortized to expense and the majority is not expected to be tax deductible Our client contracts are typically exclusive agreements with our partners and/or talent to provide programming and content over a specified period of time. The values assigned to definite lived assets are amortized over their estimated useful life.
Similarly, in accordance with FAS 141R which is applicable to the Restructuring and the change of control, we have identified leases and client contracts which we valued below market. Accordingly, a liability of $3,460 has been recorded to reflect the estimated fair value of the leases and client contracts and such amount is being taken to income over the remaining life of the contract.
| Intangibles |
For the twelve months ended December 31, 2008 | |||||||||||||
| Estimated life |
Opening balance | Amortization | Ending balance |
|||||||||||
| Trademarks |
Indefinite | $ | 20,900 | $ | — | $ | 20,900 | |||||||
| Affiliate Relationships |
10 years | 72,100 | 7,210 | 64,890 | ||||||||||
| Internally Developed Software |
5 years | 5,600 | 1,120 | 4,480 | ||||||||||
| Client Contracts |
5 years | 8,930 | 1,984 | 6,946 | ||||||||||
| Leases |
7 years | 980 | 140 | 840 | ||||||||||
| Insertion Orders |
9 months | 8,400 | 8,400 | — | ||||||||||
| Subtotal—Assets |
116,910 | 18,854 | 98,056 | |||||||||||
| Client Contracts |
1.5 years | (1,410 | ) | (940 | ) | (470 | ) | |||||||
| Leases |
7 years | (2,050 | ) | (293 | ) | (1,757 | ) | |||||||
| Subtotal—Liabilities |
(3,460 | ) | (1,233 | ) | (2,227 | ) | ||||||||
| Net Total |
17,621 | |||||||||||||
| Amortization Expense |
752 | |||||||||||||
| Adjustment to amortization expense (see (c) for depreciation expense adjustment) |
$ | 16,869 | ||||||||||||
| For the six months ended June 30, 2009 | ||||||||||||||
| Trademarks |
Indefinite | $ | 20,900 | $ | — | $ | 20,900 | |||||||
| Affiliate Relationships |
10 years | 64,890 | 3,605 | 61,285 | ||||||||||
| Internally Developed Software |
5 years | 4,480 | 560 | 3,920 | ||||||||||
| Client Contracts |
5 years | 6,946 | 992 | 5,954 | ||||||||||
| Leases |
7 years | 840 | 70 | 770 | ||||||||||
| Insertion Orders |
9 months | — | — | — | ||||||||||
| Subtotal—Assets |
98,056 | 5,227 | 92,829 | |||||||||||
| Client Contracts |
1.5 years | (470 | ) | (470 | ) | — | ||||||||
| Leases |
7 years | (1,757 | ) | (146 | ) | (1,611 | ) | |||||||
| Subtotal—Liabilities |
(2,227 | ) | (616 | ) | (1,611 | ) | ||||||||
| Net Total |
4,611 | |||||||||||||
| Amortization Expense |
4,755 | |||||||||||||
| Adjustment to amortization expense (see (c) for depreciation expense adjustment) |
$ | (144 | ) | |||||||||||
43
Table of Contents
Notes to unaudited pro forma financial statements
(in thousands, except per share amounts)
| Deferred tax liability | June 30, 2009 | |||||||||
| Intangibles added to assets |
$ | 114,480 | ||||||||
| Intangibles added to liabilities |
(3,460 | ) | ||||||||
| Net Total |
111,020 | |||||||||
| Effective Tax Rate |
38.25 | % | ||||||||
| Deferred Tax Liability for Intangibles |
42,465 | |||||||||
| Deferred Tax Liability for Cancellation of Debt for Tax Purposes |
35,967 | |||||||||
| Deferred Tax Liability—Other |
546 | |||||||||
| Deferred Tax Liability |
$ | 78,978 | ||||||||
B) The column labeled “Pro forma Adjustments—Conversion Related” represents the effects of the conversion of Class B stock, Series A-1 Preferred Stock and Series B Preferred Stock into common shares that occurred on August 3, 2009 (and the 3,500 shares of Series A-1 Preferred Stock that converted on July 9, 2009). The Series A-1 Preferred Stock was converted on August 3, 2009 into the number of shares of common stock obtained by multiplying the number of shares of Series A-1 Preferred Stock to be converted by the liquidation preference and dividing such amount by the conversion price. The Series B Preferred Stock was converted on August 3, 2009 into the number of shares of common stock obtained by multiplying the number of shares of Series B Preferred Stock to be converted by the liquidation preference and dividing such amount by the conversion price.
In connection with the Restructuring and the issuance of the Preferred Stock, we determined that the Preferred Stock contained a BCF that was partially contingent as described below. BCFs are recognized by allocating to shareholders’ equity that portion of the net proceeds from the sale of a convertible security equal to the intrinsic value of the BCF. Intrinsic value is calculated as the spread, as of the date we agreed to issue our Preferred Stock (the “commitment date”), between the conversion price of our Preferred Stock and the fair value of our common stock multiplied by the number of shares of common stock into which the Preferred Stock is convertible. In our case, because only a portion of the common shares into which the Preferred Stock was convertible were authorized on the commitment date, a portion of the BCF was not immediately recognized because it was contingent on our stockholders approving an increase in the authorized shares.
The total BCF, which is limited to the carrying value of the Preferred Stock, is approximately $76.9 million, of which $10.9 million relates to the issuance BCF, and will be amortized using the effective yield method over the period until redemption. The contingent BCF, which amounts to $66.0 million (and was limited to the carrying amount of the Preferred Stock), will be recognized when the contingency is resolved in the third quarter (August 3, 2009) which due to the immediate conversion, will result in, among other effects, a deemed dividend of $65.9 million that will be included in our third quarter 2009 earnings per share calculation (see Note G).
C) Depreciation expense reflects an increase of $530 for the twelve months ended December 31, 2008 and an increase of $265 for the six months ended June 30, 2009. (See adjustment (A) for amortization adjustment of definite lived intangibles).
NOTE 3. UNAUDITED PRO FORM ADJUSTMENTS—STATEMENT OF OPERATIONS
The Unaudited Pro Forma Statements of Operations for the year ended December 31, 2008 and for the six months ended June 30, 2009 reflects the Restructuring, the resultant acquisition accounting, the conversion of the Class B stock, the Series A-1 Preferred Stock and the Series B Preferred Stock into
44
Table of Contents
Notes to unaudited pro forma financial statements
(in thousands, except per share amounts)
common stock and the effects of the 200:1 reverse stock split and gives effect to these events as if each had occurred on January 1, 2008:
D) The Senior Notes bear interest at 15% per annum, payable 10% in cash and 5% in-kind (PIK interest). Interest expense was adjusted to reflect the new debt of $117,500 and new interest rate of 15% on such indebtedness. The PIK interest is added to the principal quarterly but will not be payable until maturity. The debt has been recorded for the pro forma financial statements at face value, which is our best estimate of fair value.
| Interest expense | For the twelve December 31, 2008 |
For the six months ended June 30, 2009 |
|||
| Interest expense on new debt |
17,958 | 9,319 | |||
| Interest expense on indebtedness prior to refinancing |
16,241 | 8,400 | * | ||
| Incremental Interest Expense Adjustment |
1,717 | 919 | |||
| * | Includes $4,603 of interest on new debt from April 2009 to June 30, 2009. |
E) Amortization of the new intangibles for Affiliate Relationships, Client Contracts and Insertion Orders was reflected (see adjustment (A) above).
F) Taxes were calculated on the new pro forma (loss) amount using the effective rate for each applicable period.
| Tax | December 31, 2008 | June 30, 2009 | ||||||
| PreTax (Loss) |
$ | (442,323 | ) | $ | (35,431 | ) | ||
| Tax Benefit (Expense) |
14,760 | 10,286 | ||||||
| Effective Rate |
3.3 | % | 29.0 | % | ||||
| Non-deductible Portion of Goodwill Write-off |
31.8 | % | 0.0 | % | ||||
| Normalized Effective Tax Rate |
35.1 | % | 29.0 | % | ||||
| ProForma PreTax (Loss) |
(461,439 | ) | (36,471 | ) | ||||
| Adjustment for Goodwill Impairment |
403,194 | — | ||||||
| — | — | |||||||
| Adjusted ProForma Pretax (Loss) |
(58,245 | ) | (36,471 | ) | ||||
| Pro Forma Tax Benefit (Expense) |
$ | 20,466 | $ | 10,588 | ||||
G) Earnings per share amounts give effect to the 200:1 reverse stock split. While a contingent beneficial conversion feature was recorded in the pro forma balance sheet, it has been excluded from the pro forma statement of operations since such adjustment is non-recurring and directly related to the Restructuring (See Note B). Additionally, we have excluded all preferred stock accretion from our earnings per share amounts.
| Common stock share calculation after conversion | Number of shares | |
| Common Stock |
102,457 | |
| Class B Stock |
292 | |
| Series A-1 Convertible Preferred Stock |
2,218,134 | |
| Series B Convertible Preferred Stock |
1,741,563 | |
| Total Common Stock before Reverse Stock Split |
4,062,446 | |
| Reverse Stock Split ratio |
200 | |
| Common Shares Issued and Outstanding |
20,312 | |
45
Table of Contents
Management’s discussion and analysis of financial condition and results of operations
You should read the following discussion and analysis of our results of operations, financial condition and liquidity in conjunction with our consolidated financial statements and the related notes thereto. This discussion contains forward-looking statements. Please see “Risk Factors” and “Cautionary Note Regarding Forward-Looking Statements and Industry Data” for a discussion of the uncertainties, risks and assumptions associated with these statements.
EXECUTIVE OVERVIEW
We produce and provide traffic, news, weather, sports, talk, music, special events and other programming. Our content is distributed to radio and television stations and digital platforms and reaches over 190 million people. We are one of the largest domestic outsourced providers of traffic reporting services and one of the nation’s largest radio networks, delivering content to approximately 5,000 radio and 170 television stations in the US. We exchange our content with radio and television stations for commercial airtime, which we then sell to local, regional and national advertisers. By aggregating and packaging commercial airtime across radio and television stations nationwide, we are able to offer our advertising customers a cost-effective way to reach a broad audience and target their audience on a demographic and geographic basis.
We are organized into two business segments: Metro and Network.
Our Metro business produces and distributes traffic and other local information reports (such as news, sports and weather) to approximately 2,200 radio and television stations, which include stations in over 80 of the top 100 Metro Service Area (“MSA”) markets in the US. Our Metro business generates revenue from the sale of commercial advertising inventory to advertisers (typically 10 and 15 second spots in radio and 30 second spots in television embedded within our information reports). We provide broadcasters a cost-effective alternative to gathering and delivering their own traffic and local information reports and offer advertisers a more efficient, broad reaching alternative to purchasing advertising directly from individual radio and television stations.
Our Network business syndicates proprietary and licensed content to radio stations, enabling them to meet their programming needs on a cost-effective basis. The programming includes national news and sports content, such as CBS Radio News, CNN Radio News and NBC Radio News and major sporting events, including the National Football League (including the Super Bowl), NCAA football and basketball games (including the Men’s Basketball Tournament, ie, “March Madness”) and the 2010 Winter Olympic Games. Our Network business features popular shows that we produce with personalities including Dennis Miller, Charles Osgood, Fred Thompson and Billy Bush. We also feature special events such as live concert broadcasts, countdown shows (including MTV and Country Music Television branded programs), music and interview programs. Our Network business generates revenue from the sale of 30 and 60 second commercial airtime, often embedded in our programming, that we bundle and sell to national advertisers who want to reach a large audience across numerous radio stations.
We develop programming and exploit our commercial airtime by concurrently taking into consideration the demands of our advertisers on both a market specific and national basis, the inputs of the owners and management of our radio station affiliates, and the inputs of our programming partners and talent. Our continued success and prospects for growth are dependent upon our ability to manage these factors in a
46
Table of Contents
Management’s discussion and analysis of financial condition and results of operations
cost effective manner and to adapt our information and entertainment programming to different distribution platforms. Historically, our results have been impacted by overall economic conditions, trends in demand for radio and television-related advertising, competition, and risks inherent in our customer base, including customer attrition and our ability to generate new business opportunities to offset any attrition.
There are a variety of factors that influence our revenue on a periodic basis, including, but not limited to: (i) economic conditions and the relative strength or weakness in the United States economy; (ii) advertiser spending patterns and the timing of the broadcasting of our programming, principally the seasonal nature of sports programming; (iii) advertiser demand on a local/regional or national basis for radio and television- related advertising products; (iv) increases or decreases in our portfolio of program offerings and related audiences, including changes in the demographic composition of our audience base; (v) increases or decreases in the size of our advertiser sales force; and (vi) competitive and alternative programs and advertising mediums, including, but not limited to, local print, magazines, cable and the Internet.
Our commercial airtime is perishable, and accordingly, our revenue is significantly impacted by the commercial airtime available at the time we enter into an arrangement with an advertiser. Our ability to specifically isolate the relative historical aggregate impact of price and volume is not practical as commercial airtime is sold and managed on an order-by-order basis. We closely monitor advertiser commitments for the current calendar year, with particular emphasis placed on the annual upfront process and a prospective three-month period. We take the following factors, among others, into account when pricing commercial airtime: (i) the dollar value, length and breadth of the order; (ii) the desired reach and audience demographic; (iii) the quantity of commercial airtime available for the desired demographic requested by the advertiser for sale at the time their order is negotiated; and (iv) the proximity of the date of the order placement to the desired broadcast date of the commercial airtime.
Our national revenue has been trending downward for the last several years due principally to reductions in national audience levels and lower clearance (as defined below) and audience levels of our affiliated stations. Our local/regional revenue has been trending downward due principally to increased competition, reductions in our local/regional sales force and an increase in the amount of 10 second inventory being sold by radio stations. Recently, our operating performance has also been affected by the weakness in the United States economy and advertiser demand for radio and television-related advertising products.
The principal components of our operating expenses are programming, production and distribution costs (including affiliate compensation and broadcast rights fees), selling expenses including commissions, promotional expenses and bad debt expenses, depreciation and amortization, and corporate general and administrative expenses. Corporate general and administrative expenses are primarily comprised of costs associated with our previous Management Agreement with CBS Radio (which terminated on March 3, 2008), corporate accounting, legal and administrative personnel costs, and other administrative expenses, including those associated with corporate governance matters. Special charges include one-time expenses associated with the re-negotiation of the CBS agreements, the 2009 and 2008 Gores investment, Restructuring costs and re-engineering expenses.
We consider our operating cost structure to be largely fixed in nature, and as a result, we generally require several months lead time to make significant modifications to our cost structure to react to what we view are more than temporary increases or decreases in advertiser demand. This becomes important in predicting our performance in periods when advertiser revenue is increasing or decreasing. In periods where advertiser revenue is increasing, the fixed nature of a substantial portion of our costs means that
47
Table of Contents
Management’s discussion and analysis of financial condition and results of operations
operating income will grow faster than the related growth in revenue. Conversely, in a period of declining revenue, operating income will decrease by a greater percentage than the decline in revenue because of the lead time needed to reduce our operating cost structure. If we perceive a decline in revenue to be temporary, we may choose not to reduce our fixed costs, or may even increase our fixed costs, so as to not limit our future growth potential when the advertising marketplace rebounds. We carefully consider matters such as credit and commercial inventory risks, among other factors, in assessing arrangements with our programming and distribution partners. In those circumstances where we function as the principal in the transaction, the revenue and associated operating costs are presented on a gross basis in the Consolidated Statement of Operations. In those circumstances where we function as an agent or sales representative, our effective commission is presented within revenue with no corresponding operating expenses. Although no individual relationship apart from CBS is significant, the relative mix of such arrangements is significant when evaluating operating margin and/or increases and decreases in operating expenses.
We engaged consultants primarily to assist us in determining the most cost effective manner to gather and disseminate traffic information. As a result, we announced a Metro business re-engineering initiative that was implemented in the last half of 2008. The modifications to the Metro business are part of a series of re-engineering initiatives implemented by us to improve our operating and financial performance in the near-term, while setting the foundation for profitable long-term growth. These changes are expected to result in a reduction of staff levels and the consolidation of operations centers into 13 regional hubs.
On March 3, 2008, we closed on the new Master Agreement with CBS Radio (the “CBS Master Agreement”), which documents a long-term agreement through March 31, 2017. As part of the new arrangement, CBS agreed to broadcast certain of our commercial inventory for our Network and Metro businesses through March 31, 2017 in exchange for certain programming and/or cash compensation. Under the new arrangement, CBS Radio agreed to assign to us all of its right, title and interest in the warrants to purchase common stock outstanding under prior agreements. These warrants were cancelled and retired on March 3, 2008.
The new arrangement with CBS Radio is particularly important to us, as in recent years, the radio broadcasting industry has experienced a significant amount of consolidation. As a result, certain major radio station groups, including Clear Channel Communications and CBS Radio, have emerged as powerful forces in the industry. While we provide programming to all major radio station groups, our extended affiliation agreements with most of CBS Radio’s owned and operated radio stations provide us with a significant portion of the audience that we sell to advertisers.
Prior to the new CBS arrangement which closed on March 3, 2008, many of our affiliation agreements with CBS Radio did not tie station compensation to audience levels or clearance levels. This contributed to a significant decline in our national audience delivery to advertisers when CBS Radio stations delivered lower audience levels and broadcast fewer commercials than in earlier years. Our new arrangement with CBS limits the impact of these circumstances in most instances by adjusting affiliate compensation for changes in audience levels. In addition, the arrangement provides CBS Radio with financial incentives to broadcast substantially all our commercial inventory (referred to as “clearance”) in accordance with the terms of the contracts and significant penalties for not complying with the contractual terms of our arrangement. We believe that CBS Radio has taken and will continue to take the necessary steps to stabilize and increase the audience reached by its stations. It should be noted however, that as CBS takes steps to increase its compliance with our affiliation agreements, our operating costs will increase before we will be able to increase advertising prices for the larger audience we will deliver, which was and may continue to be a contributing factor to the decline in our operating income.
48
Table of Contents
Management’s discussion and analysis of financial condition and results of operations
For management purposes we continue to measure our performance against comparable prior periods. For purposes of presenting a comparison of our 2009 results to prior periods, we have presented our 2009 results as the mathematical addition of the Predecessor Company and Successor Company periods. We believe that this presentation provides the most meaningful information about our results of operations. This approach is not consistent with GAAP, may yield results that are not strictly comparable on a period-to-period basis, and may not reflect the actual results we would have achieved.
As a result of the Restructuring, we followed the acquisition method of accounting, as described by SFAS 141R, and applied the SEC rules and guidance regarding “push down” accounting treatment. Accordingly, our consolidated financial statements and transactional records prior to the closing of the Restructuring reflect the historical accounting basis in our assets and liabilities and are labeled predecessor company, while such records subsequent to the Restructuring are labeled successor company and reflect the push down basis of accounting for the new fair values in our financial statements. This is presented in our consolidated financial statements by a vertical black line division which appears between the columns entitled predecessor company and successor company on the statements and relevant notes. The black line signifies that the amounts shown for the periods prior to and subsequent to the Restructuring are not comparable. For management purposes we continue to measure our performance against comparable prior periods. For purposes of presenting a comparison of our 2009 results to prior periods, we have presented our 2009 results as the mathematical addition of the Predecessor Company and Successor Company periods. We believe that this presentation provides the most meaningful information about our results of operations. This approach is not consistent with GAAP, may yield results that are not strictly comparable on a period-to-period basis, and may not reflect the actual results we would have achieved. Below is a reconciliation of our financial statements to this non-GAAP measure. The Preferred Stock non-cash adjustments relate to the accounting for a beneficial conversion feature contained in the Preferred Stock and accretion of the Preferred stock to redemption value as described elsewhere in this prospectus in more detail.
| Successor Company | Predecessor Company | Combined total | ||||||||||
| For the period April 24, 2009 to |
For the period April 1, 2009 to |
For the three June 30, 2009 |
||||||||||
| NET REVENUE |
$ | 58,044 | $ | 25,607 | $ | 83,651 | ||||||
| Operating Costs |
52,116 | 20,187 | 72,303 | |||||||||
| Depreciation and Amortization |
5,845 | 521 | 6,366 | |||||||||
| Corporate General and Administrative Expenses |
2,407 | 1,482 | 3,889 | |||||||||
| Restructuring Charges |
1,454 | 536 | 1,990 | |||||||||
| Special Charges |
368 | 7,010 | 7,378 | |||||||||
| 62,190 | 29,736 | 91,926 | ||||||||||
| OPERATING (LOSS) |
(4,146 | ) | (4,129 | ) | (8,275 | ) | ||||||
| Interest Expense (Income) |
4,692 | (41 | ) | 4,651 | ||||||||
| Other Income |
(4 | ) | (59 | ) | (63 | ) | ||||||
| (LOSS) BEFORE INCOME TAX |
(8,834 | ) | (4,029 | ) | (12,863 | ) | ||||||
| INCOME TAX (BENEFIT) |
(2,650 | ) | (254 | ) | (2,904 | ) | ||||||
| NET (LOSS) |
$ | (6,184 | ) | $ | (3,775 | ) | $ | (9,959 | ) | |||
49
Table of Contents
Management’s discussion and analysis of financial condition and results of operations
| Successor Company | Predecessor Company | Combined total | ||||||||||
| For the period April 24, 2009 to |
For the period January 1, 2009 to |
For the six June 30, 2009 |
||||||||||
| NET REVENUE |
$ | 58,044 | $ | 111,474 | $ | 169,518 | ||||||
| Operating Costs |
52,116 | 111,580 | 163,696 | |||||||||
| Depreciation and Amortization |
5,845 | 2,585 | 8,430 | |||||||||
| Corporate General and Administrative Expenses |
2,407 | 4,248 | 6,655 | |||||||||
| Restructuring Charges |
1,454 | 3,976 | 5,430 | |||||||||
| Special Charges |
368 | 12,819 | 13,187 | |||||||||
| 62,190 | 135,208 | 197,398 | ||||||||||
| OPERATING (LOSS) |
(4,146 | ) | (23,734 | ) | (27,880 | ) | ||||||
| Interest Expense (Income) |
4,692 | 3,222 | 7,914 | |||||||||
| Other Income |
(4 | ) | (359 | ) | (363 | ) | ||||||
| (LOSS) BEFORE INCOME TAX |
(8,834 | ) | (26,596 | ) | (35,430 | ) | ||||||
| INCOME TAX (BENEFIT) |
(2,650 | ) | (7,635 | ) | (10,285 | ) | ||||||
| NET (LOSS) |
$ | (6,184 | ) | $ | (18,961 | ) | $ | (25,145 | ) | |||
RESULTS OF OPERATIONS AND FINANCIAL CONDITION
Six months ended June 30, 2009 compared with six months ended June 30, 2008
We established a new organizational structure in 2008 pursuant to which we manage and report our business in two segments: Network and Metro. Our Network business produces and distributes regularly scheduled and special syndicated programs, including exclusive live concerts, music and interview shows, national music countdowns, lifestyle short features, news broadcasts, talk programs, sporting events and sports features. Our Metro business provides traffic reports and local news, weather and sports information programming to radio and television affiliates and their websites. We evaluate segment performance based on segment revenue and segment operating (loss)/income. Administrative functions such as finance, human resources and information systems are centralized. However, where applicable, portions of the administrative function costs are allocated between the operating segments. The operating segments do not share programming or report distribution and operating costs are captured discretely within each segment. Our accounts receivable and property, plant and equipment are captured and reported discretely within each operating segment.
Combined three months ended June 30, 2009 compared with three months ended June 30, 2008
Revenue
Revenue presented by operating segment is as follows:
| Three months ended | ||||||||||||
| June 30, 2009 | June 30, 2008 | |||||||||||
| $ | % of total | $ | % of total | |||||||||
| (in millions) | ||||||||||||
| Metro |
43.5 | 52 | % | 53.2 | 53 | % | ||||||
| Network |
40.2 | 48 | % | 47.2 | 47 | % | ||||||
| Total(1) |
$ | 83.7 | 100 | % | $ | 100.4 | 100 | % | ||||
50
Table of Contents
Management’s discussion and analysis of financial condition and results of operations
For the three months ended June 30, 2009, revenue decreased $16.7 million or 16.7%, to $83.7 million compared with $100.4 million for the three months ended June 30, 2008. The overall decline in revenue is principally attributable to the ongoing economic downturn and, in particular, the general decline in advertising spending, which started to contract in the second half of 2008 and has continued in 2009.
Metro Traffic revenue for the three months ended June 30, 2009 decreased $9.7 million or 18.2% to $43.5 million from $53.2 million for the same period in 2008. The decrease in Metro Traffic revenue was principally related to a weak local advertising marketplace spanning various sectors and categories including automotive, retail and telecommunications, which placed an overall downward pressure on advertising sales and rates.
For the three months ended June 30, 2009, Network revenue was $40.2 million compared to $47.2 million for the comparable period in 2008, a decrease of 14.9% or $7.0 million. The decline is primarily the result of the general decline in advertising spending which affected our Network revenue from news and talk programs and sports events, our cancellation of certain programs, and lower revenues from our RADAR network inventory.
Operating costs
Operating costs for the three months ended June 30, 2009 and 2008 were as follows:
| Three months ended | ||||||||||||
| June 30, 2009 | June 30, 2008 | |||||||||||
| $ | % of total | $ | % of total | |||||||||
| (in millions) | ||||||||||||
| Payroll and payroll related |
20.4 | 28 | % | 25.5 | 30 | % | ||||||
| Programming and production |
14.4 | 20 | % | 18.5 | 22 | % | ||||||
| Program and operating |
6.7 | 9 | % | 4.1 | 5 | % | ||||||
| Station compensation |
18.3 | 25 | % | 20.8 | 24 | % | ||||||
| Other operating expenses |
12.5 | 18 | % | 16.5 | 19 | % | ||||||
| $ | 72.3 | 100 | % | $ | 85.4 | 100 | % | |||||
Operating costs decreased $13.1 million, or 15.3%, to $72.3 million in the second quarter of 2009 from $85.4 million in the second quarter of 2008. The decrease reflects the benefit of the Metro re-engineering and cost reduction programs which began in the last half of 2008 and continued through the second quarter of 2009. Payroll and payroll related costs declined $5.1 million or 20.0% as a result of the salary and headcount reductions, partially offset by an increase in commission rates implemented to incentivize sales growth. Programming and production costs decreased by $4.1 million from $18.5 million to $14.4 million due to lower talent fees and reduced revenue sharing expense as a result of our lower revenue. Program and operating costs increased to $6.7 million from $4.1 million reflecting increased purchases of inventory and expenses related to our License Agreement with TrafficLand. Station Compensation expense decreased by $2.4 million primarily due to the renegotiation and cancellation of certain affiliate arrangements. Other operating expenses declined from $16.5 million to $12.5 million, again reflecting the benefit of the Metro re-engineering program, primarily related to facilities, aviation, telephony and other costs.
51
Table of Contents
Management’s discussion and analysis of financial condition and results of operations
Depreciation and amortization
Depreciation and amortization increased $4.0 million to $6.4 million in the second quarter of 2009 from $2.4 million in the second quarter of 2008. The increase is primarily attributable to the increase in amortization for the fair value of intangibles recorded as a result of the application of acquisition accounting and by increased depreciation and amortization for additional investments in systems and infrastructure, partially offset by decreased depreciation for leasehold improvements from the closure and consolidation of facilities in connection with our Metro re-engineering that began in the last half of 2008.
Corporate general and administrative expenses
Corporate, general and administrative expenses increased by $2.7 million to $3.9 million for the three months ended June 30, 2009 as compared to $1.2 million for the same period in 2008. The increase is principally due to increased accounting fees associated with the additional reporting required by acquisition accounting, which increased by $1.0 million, and the increased stock compensation expense of $1.5 million which reflects a credit taken in 2008 for the reversal of compensation cost associated with the cancellation of unvested options. Corporate, general and administrative expenses are expected to return to more normal levels once the accounting work in support of the acquisition accounting and a potential stock offering are completed.
Goodwill impairment
During the second quarter of 2009, there were no indications of impairment of our goodwill. During the comparable quarter of 2008, we incurred a goodwill impairment charge of $206.1 million as a result of a continued decline in our operating performance and stock price in that period.
Restructuring charges
During the three months ended June 30, 2009, we recorded a $2.0 million restructuring charge in connection with the re-engineering of our Metro Traffic operations that commenced in the last half of 2008 and has continued into 2009, and the new cost reduction initiatives undertaken in the first half of 2009. Facilities shutdown expense of $1.6 million was the major component of the restructuring charge, which also included amounts for severance and contract cancellations.
Special charges
We incurred non-recurring expenses aggregating $7.4 million and $0.9 million in the second quarter of 2009 and 2008, respectively. Special charges in the second quarter of 2009 include transaction fees and expenses related to negotiation of the definitive documentation for the Restructuring, including the fees of various legal and financial advisors to the constituents involved in the Restructuring (eg Westwood One, Gores, Glendon Partners, the banks, noteholders and the lenders of the new Senior Credit Facility) and other professional fees. Special charges in the second quarter of 2008 consisted primarily of costs related to the negotiation and closing of documentation related to the issuance of Series A Preferred Stock to Gores in 2008.
Operating (loss)
The operating (loss) for the three months ended June 30, 2009 decreased to $(8.3) million from $(195.6) million for the same period in 2008. The decreased loss is due to the absence of a goodwill impairment of
$206.1 million recorded in the second quarter of 2008. Exclusive of the impairment charge, net income
52
Table of Contents
Management’s discussion and analysis of financial condition and results of operations
for the second quarter of 2008 would have been $10.4 million. The decline in operating income between the second quarter of 2008, absent the goodwill impairment charge, and the operating (loss) for the second quarter of 2009 is primarily attributable to the decline in our revenue, which was impacted by the current overall economic downturn and related weakness in the advertising market. The decline in revenue was partially offset by the realignment of our cost base, net of restructuring charges, as part of our Metro Traffic re-engineering and other cost reduction initiatives.
Interest expense
Interest expense increased $0.3 million, or 6.8%, to $4.7 million in the second quarter of 2009 from $4.4 million in the second quarter of 2008. The increase reflects the higher interest rate on the debt from our Restructuring, which was incurred for most of the second quarter of 2009, offset by the reduction in the debt level.
Provision for income taxes
Income tax benefit in the second quarter of 2009 was $3.0 million compared with a tax benefit of $0.2 million in the second quarter of 2008. Our effective tax rate for the quarter ended June 30, 2009 was approximately 22.5% as compared to the 38.5% (excluding the impact of our goodwill impairment) for the same period in 2008, due to the non-deductibility of certain costs incurred related to our Restructuring.
Net (loss)
Net (loss) for the second quarter of 2009 increased to $(10.0) million from net income of $6.3 million, absent the goodwill impairment charge of $206.0 million, in the second quarter of 2008. Net (loss) per share for basic and diluted shares was $(29.48) in the second quarter of 2009, compared with net (loss) per share, including the goodwill impairment charge, for basic and diluted of $(396.69) in the second quarter of 2008.
Combined six months ended June 30, 2009 compared with six months ended June 30, 2008
Revenue
Revenue presented by operating segment is as follows:
| Six months ended | ||||||||||||
| June 30, 2009 | June 30, 2008 | |||||||||||
| $ | % of total | $ | % of total | |||||||||
| (In millions) | ||||||||||||
| Metro |
$ | 78.2 | 46 | % | $ | 100.6 | 49 | % | ||||
| Network |
$ | 91.3 | 54 | % | $ | 106.4 | 51 | % | ||||
| Total |
$ | 169.5 | 100 | % | $ | 207.0 | 100 | % | ||||
For the six months ended June 30, 2009, revenue decreased $37.5 million or 18.1%, to $169.5 million compared with $207.0 million for the six months ended June 30, 2008. The overall decline in revenue is principally attributable to the ongoing economic downturn and, in particular, the general decline in advertising spending, which started to contract in the second half of 2008 and has continued in 2009.
53
Table of Contents
Management’s discussion and analysis of financial condition and results of operations
Metro Traffic revenue for the six months ended June 30, 2009 decreased $22.4 million or 22.3% to $78.2 million from $100.6 million for the same period in 2008. The decrease in Metro Traffic revenue was principally related to a weak local advertising marketplace spanning various sectors and categories including automotive, retail and telecommunications, which placed an overall downward pressure on advertising sales and rates.
For the six months ended June 30, 2009, Network revenue was $91.3 million compared to $106.4 million for the comparable period in 2008, a decrease of 14.1% or $15.1 million. The decline is primarily the result of the general decline in advertising spending which affected our Network revenue from news and talk programs and sports events, the cancellation of certain programs and lower revenues from our RADAR network inventory.
Operating costs
Operating costs for the six months ended June 30, 2009 and 2008 were as follows:
| Six months ended | ||||||||||||
| June 30, 2009 | June 30, 2008 | |||||||||||
| $ | % of total | $ | % of total | |||||||||
| (in millions) | ||||||||||||
| Payroll and payroll related |
$ | 42.5 | 26 | % | $ | 51.7 | 29 | % | ||||
| Programming and production |
$ | 43.2 | 26 | % | $ | 47.2 | 26 | % | ||||
| Program and operating |
$ | 11.3 | 7 | % | $ | 8.3 | 5 | % | ||||
| Station compensation |
$ | 38.1 | 23 | % | $ | 39.9 | 22 | % | ||||
| Other operating expenses |
$ | 28.6 | 18 | % | $ | 32.5 | 18 | % | ||||
| $ | 163.7 | 100 | % | $ | 179.6 | 100 | % | |||||
Operating costs decreased $15.9 million, or 8.9%, to $163.7 million for the six months ended June 30, 2009 from $179.6 million for the six month ended June 30, 2008. The decrease generally reflects the benefit of the re-engineering and cost reduction programs which began in the last half of 2008. Payroll and payroll related costs declined $9.2 million, or 17.9%, as a result of the reduction in salaries and headcount, partially offset by an increase in commission rates implemented to incentivize sales growth. Programming and production costs decreased by $4.0 million to $43.2 million from $47.2 million for the six months ended June 30, 2009 due to lower talent fees and reduced revenue sharing expense as a result of our lower revenue. Program and operating costs increased to $11.3 million from $8.3 million, reflecting increased purchases of inventory and expenses related to our License Agreement with TrafficLand. Station compensation expense decreased to $38.1 million from $39.9 million, reflecting the renegotiation and cancellation of certain affiliate arrangements. Other operating expenses declined by $3.9 million, or 12.1%, again reflecting the benefit of the Metro Traffic re-engineering program primarily related to facilities, aviation, telephony and other costs.
Depreciation and amortization
Depreciation and amortization increased $2.0 million, or 31.8%, to $8.4 million for the six months ended June 30, 2009 from $6.4 million for the six months ended June 30, 2008. The increase is primarily attributable to the increase in amortization for the fair value of intangibles recorded as a result of the application of acquisition accounting and by increased depreciation and amortization for additional investments in systems and infrastructure. This was partially offset by a decrease in warrant amortization expense as a result of the cancellation on March 3, 2008 of all outstanding warrants previously granted to CBS Radio and decreased depreciation for leasehold improvements from the closure and consolidation of facilities.
54
Table of Contents
Management’s discussion and analysis of financial condition and results of operations
Corporate general and administrative expenses
Corporate, general and administrative expenses increased $2.0 million to $6.7 million for the six months ended June 30, 2009 as compared to $4.7 million for the same period in 2008. The increase is principally due to increased accounting fees associated with the additional reporting required by acquisition accounting, which increased by $1.0 million, and the increased stock compensation expense of $1.0 million, which reflects a credit taken in 2008 for the reversal of compensation cost associated with the cancellation of unvested options. Corporate, general and administrative expenses are expected to return to more normal levels once the accounting work in support of the acquisition accounting and a potential stock offering are completed.
Goodwill impairment
There were no impairment charges recorded for the six months ended June 30, 2009. During the first six months of 2008, we incurred a goodwill impairment charge of $206.0 million as a result of a continued decline in our operating performance and stock price in that period.
Restructuring charges
During the six months ended June 30, 2009, we recorded $5.4 million of restructuring charges in connection with the re-engineering of our Metro Traffic operations that commenced in the last half of 2008 and has continued into 2009, and the new cost reduction initiatives undertaken in the first half of 2009. The major components of these charges included severance of $2.0 million and facilities closure expense of $3.4 million.
Special charges
We incurred non-recurring expenses aggregating $13.2 million and $8.9 million for the six months ended June 30, 2009 and 2008, respectively. Special charges in the six months ended June 30, 2009 related to the Restructuring include transaction fees and expenses related to the negotiation of the definitive documentation for the Restructuring and includes third party financial advisor fees of $5.1 million, Glendon Partners advisory fees of $1.1 million, legal fees (for counsel representing the various constituencies involved in the Restructuring) of $4.5 million, bank costs (including their advisers’ fees) of $1.0 million, insurance costs of $0.8 million and corporate governance and other costs of $0.7 million. Special charges in the six months ended June 30, 2008 consisted of $5.0 million of contract termination costs, $3.2 million of associated legal and professional fees incurred in connection with the new CBS arrangement and a $0.7 million charge for a one-time study completed by a third party consultant related to the formulation of our Metro re-engineering initiative. We do not anticipate further charges related to our Metro re-engineering initiative with the exception of certain charges related to reductions in aviation expense and lease expense that cannot be taken until such time as the regional offices (which have been closed as part of the Metro re-engineering initiative) have been completely vacated.
Operating (loss)
The operating (loss) for the six months ended June 30, 2009 decreased to $(27.9) million from $(198.6) million for the same period in 2008. The decreased loss is due to the absence of a goodwill impairment of $206.0 million recorded in the second quarter of 2008. Excluding the impairment charge, net income for the six months ended June 30, 2008 would have been $7.4 million. The decline in operating income between the six months ended June 30, 2008, absent the goodwill impairment charge, and the operating (loss) for the comparable period of 2009 is primarily related to a weak local advertising marketplace spanning various sectors and categories including automotive, retail and telecommunications, which placed an overall downward pressure on advertising sales and rates. The
55
Table of Contents
Management’s discussion and analysis of financial condition and results of operations
decline in revenue was partially offset by the realignment of our cost base, net of restructuring charges, as part of our Metro re-engineering and other reduction initiatives.
Interest expense
Interest expense decreased $1.9 million, or 18.8%, to $7.9 million for the six months ended June 30, 2009 from $9.8 million in the comparable period in 2008. The decrease reflects the reduced debt level from our Restructuring partially offset by the higher interest rates associated with that debt. The decrease also reflects a one-time reversal of interest expense from the settlement of an amount owed to a former employee of $0.8 million.
Provision for income taxes
Income tax benefit in the first half of 2009 was $10.3 million compared with a tax benefit of $3.2 million in the first half of 2008. Our effective tax rate for the first half of 2009 was approximately 28.8% as compared to the 38.5% (excluding the impact of goodwill impairment) for the same period in 2008.
Net (loss) income
Net (loss) in the first half of 2009 increased to $(25.1) million from net income of $1.0 million, absent the goodwill impairment charge of $206.0 million, in the first half 2008. Net (loss) per share for basic and diluted shares was $(62.45) in the first half of 2009, compared with net (loss) per share, including the impairment charge, for basic and diluted of $(431.24), in the first half of 2008.
Comparison of the three years ended December 31, 2006, 2007 and 2008
Revenue
Revenue presented by operating segment is as follows for the years ending December 31:
| 2006 | 2007 | 2008 | ||||||||||||||||
| $ | % of total | $ | % of total | $ | % of total | |||||||||||||
| ($ amounts in millions) | ||||||||||||||||||
| Metro |
$ | 265.8 | 52 | % | $ | 232.4 | 51 | % | $ | 194.9 | 48 | % | ||||||
| Network |
246.3 | 48 | % | 218.9 | 49 | % | 209.5 | 52 | % | |||||||||
| Total(1) |
$ | 512.1 | 100 | % | $ | 451.4 | 100 | % | $ | 404.4 | 100 | % | ||||||
| (1) | We currently aggregate revenue data based on the operating segment. A number of advertisers purchase both local/regional and national commercial airtime in both segments. Our objective is to optimize total revenue from those advertisers. |
Revenue for the year ended December 31, 2008 (“2008”) decreased $47.0 million, or 10.4%, to $404.4 million from $451.4 million for the year ended December 31, 2007 (“2007”). Revenue in 2007 decreased $60.7 million, or 11.9%, to $451.4 million from $512.1 million for the year ended December 31, 2006 (“2006”). The decrease in 2008 was principally attributable to the current economic downturn. Revenue in 2008 and 2007 was also affected by increased competition, lower audience levels and a reduction in our sales force.
Metro business revenue in 2008 decreased $37.5 million, or 16.2%, to $194.9 million from $232.4 million in 2007. Metro business revenue in 2007 decreased $33.3 million, or 12.5%, to $232.4 million from $265.8 million in 2006. The decrease in 2008 was primarily due to the current economic downturn, a weak local advertising marketplace primarily in the automotive, financial services and retail categories, increased competition and a continued reduction in 10 second inventory units available to
56
Table of Contents
Management’s discussion and analysis of financial condition and results of operations
sell. The decrease in 2007 was principally attributable to a 15% reduction in our sales force from 2006, a reduction in 10 second inventory units to sell as a result of the closure of several second-tier traffic markets in mid to late 2006, cancellation of several representation and affiliation agreements (representing an approximately 18% decrease in inventory units from June 30, 2006 to December 31, 2007) and increased 10 second inventory being sold by radio stations. The reduced demand was experienced in most markets and advertiser categories.
Network business revenue in 2008 decreased $9.4 million, or 4.3%, to $209.5 million from $218.9 million in 2007. Network business revenue in 2007 decreased $27.4 million, or 11.1%, to $218.9 million from $246.3 million in 2006. The decrease in 2008 was primarily the result of the general decline in advertising spending, which started to contract mid-year and which accelerated during the fourth quarter of 2008. Our performance was also impacted by lower revenue from our RADAR inventory and lower barter revenue. The decrease in 2007 was principally attributable to an approximate 23% reduction in our quarterly gross impressions from RADAR rated network inventory (news programming inventory) which resulted from our affiliates experiencing audience declines, lower clearance levels by certain CBS Radio stations and planned reductions in affiliate compensation, the cancellation of certain programs (approximately $5.5 million) and the non-recurrence of revenue attributable to the 2006 Winter Olympic games (approximately $5.7 million), partially offset by revenue generated from new program launches (approximately $6.0 million). Excluding the effect of the non-recurrence of revenue attributable to the 2006 Winter Olympics, national revenue would have declined approximately 8.9%.
Operating costs
Operating costs for 2006, 2007 and 2008 were as follows:
| 2006 | 2007 | 2008 | ||||||||||||||||
| $ | % of total | $ | % of total | $ | % of total | |||||||||||||
| ($ amounts in millions) | ||||||||||||||||||
| Programming, production and distribution expenses |
$ | 301.6 | 76 | % | $ | 274.6 | 78 | % | $ | 293.8 | 81 | % | ||||||
| Selling expenses |
46.8 | 12 | % | 34.2 | 10 | % | 34.3 | 10 | % | |||||||||
| Stock-based compensation |
6.3 | 2 | % | 5.4 | 2 | % | 5.4 | 2 | % | |||||||||
| Other operating expenses |
40.4 | 10 | % | 36.2 | 10 | % | 27.0 | 7 | % | |||||||||
| $ | 395.1 | 100 | % | $ | 350.4 | 100 | % | $ | 360.5 | 100 | % | |||||||
Operating costs for 2008 increased $10.1 million, or 2.9%, to $360.5 million from $350.4 million in 2007 due to increased station compensation and salary costs, which were partially offset by the elimination of management fees as a result of the new CBS arrangement. Operating costs in 2007 decreased $44.8 million, or 11.3%, to $350.4 million from $395.2 million in 2006.
Programming, production and distribution expenses for 2008 increased $19.2 million, or 7.0%, to $293.8 million from $274.6 million in 2007. The increase was due to an increase in station compensation costs primarily related to the CBS arrangement. Programming, production and distribution expenses in 2007 decreased $27.0 million, or 8.9%, to $274.6 million from $301.6 million in 2006. The decrease in 2007 was principally attributable to the cancellation of certain programming contracts (approximately $15.0 million), the non-recurrence of costs associated with the 2006 Winter Olympics and lower payroll and rent costs associated with closing certain traffic information operation centers (approximately $9.0 million).
57
Table of Contents
Management’s discussion and analysis of financial condition and results of operations
Selling expenses in 2008 remained relatively flat at $34.3 million as compared to $34.2 million in 2007. Selling expenses in 2007 decreased $12.6 million, or 26.9%, to $34.2 million from $46.8 million in 2006. The 2007 decrease was principally attributable to a reduction in sales staff and commissions of $7.8 million and a decrease in bad debt expense of approximately $2.2 million.
Other operating expenses in 2008 declined by $9.2 million, or 25.5%, to $27.0 million from $36.2 million in 2007, the majority of which is the elimination of the CBS management fee. The decrease in other operating expenses also reflects the Metro business re-engineering program and other cost reductions, which led to declines in Metro business-related personnel, facilities and aviation costs. Other operating expenses in 2007 decreased $4.2 million, or 10.6%, to $36.2 million from $40.4 million in 2006. The 2007 decrease was principally attributable to reduction in personnel costs.
Depreciation and amortization
Depreciation and amortization in 2008 decreased $8.7 million, or 44.3%, to $11.1 million from $19.8 million in 2007 primarily as a result of the cancellation of the CBS warrants. Depreciation and amortization in 2007 decreased $1.0 million, or 4.4%, to $19.8 million from $20.8 million in 2006. The 2007 decrease is principally attributable to certain assets becoming fully depreciated.
Corporate general and administrative expenses
Corporate general and administrative expenses in 2008 increased slightly to $13.4 million from $13.2 million in 2007. The increase reflects an increase in salary and wages and stock-based compensation offset by a reduction in legal fees and the CBS management fee. Corporate general and administrative expenses in 2007 decreased $1.4 million, or 9.9%, to $13.2 million from $14.6 million in 2006. The 2007 decrease was principally attributable to reduced stock-based compensation and lower corporate governance costs, partially offset by increased personnel costs.
Goodwill impairment
On an annual basis and upon the occurrence of certain interim triggering events, we are required to perform impairment tests on our identified intangible assets with indefinite lives, including goodwill, which testing could impact the value of our business.
Prior to 2008, we operated as a single reportable operating segment: the sale of commercial airtime. As part of our re-engineering initiative, in the fourth quarter of 2008, we installed separate management for the Network and Metro businesses providing discrete financial information and management oversight. In accordance with Statement of Financial Accounting Standards 142, “Goodwill and Other Intangible Assets” (“FAS 142”), we have determined that each division is an operating segment. A reporting unit is the operating segment or a business which is one level below the operating segment. Our reporting units are consistent with our operating segments and impairment has been tested at this level.
We employ a third party firm specializing in valuation services to assist us in determining the fair value of the reporting units and goodwill. In connection with the 2008 testing, we have determined that using a discounted cash flow model was the best calculation of our fair value. In prior periods, the fair value was calculated on a consistently applied weighted average basis using a discounted cash flow model and the quoted market price of our common stock.
In 2008, we determined that our goodwill was impaired and recorded impairment charges totaling $430.1 million ($206.1 million in the second quarter and $224.1 million in the fourth quarter). The remaining value of our goodwill is $34.0 million based upon management’s best estimates including a
58
Table of Contents
Management’s discussion and analysis of financial condition and results of operations
valuation study that was prepared by a third party firm specializing in valuation services and using management’s operational forecasts. The goodwill impairment, the majority of which was not deductible for income tax purposes, was primarily due to our declining operating performance and the reduced valuation multiples in the radio industry.
In connection with our annual goodwill impairment testing for 2007, we determined our goodwill was not impaired at December 31, 2007. The conclusion that our fair value was greater than our carrying value at December 31, 2007 was based upon management’s best estimates including a valuation study that was prepared using our operational forecasts by a third party firm specializing in valuation services.
In connection with our annual goodwill impairment testing for 2006, based on a similar approach as applied in 2007, we determined our goodwill was impaired and recorded a non-cash charge of $515.9 million. The goodwill impairment, the majority of which was not deductible for income tax purposes, was primarily due to our declining operating performance and the reduced valuation multiples in the radio industry.
If actual results differ from our operational forecasts, or if the discount rate used in our calculation increases, future impairment charges may be recorded.
Restructuring charges
In connection with the re-engineering of our traffic operations and other cost reductions implemented to a significant degree in the last half of 2008, we recorded $14.1 million in restructuring charges for the twelve months ended December 31, 2008. Cost reduction initiatives included the consolidation of leased offices, staff reductions and the elimination of underperforming programming. We anticipate further charges of approximately $9.7 million as additional phases of the original traffic re-engineering and other programs are implemented and finalized in the second quarter of 2009. The total restructuring charges for the traffic re-engineering and other cost savings programs are projected to be approximately $23.8 million. In addition, we have introduced and will complete new cost reduction programs in 2009. As these programs are implemented, we anticipate that we will incur new incremental costs for severance of approximately $6.0 million and contract terminations of $3.1 million. In total, we estimate we will record aggregate restructuring charges of approximately $32.9 million, consisting of: (1) $15.5 million of severance, relocation and other employee related costs; (2) $7.4 million of facility consolidation and related costs; and (3) $10.0 million of contract termination costs.
Special charges
We incurred non-recurring expenses aggregating $13.2 million, $4.6 million and $1.6 million in 2008, 2007 and 2006, respectively. Special charges for 2008 were primarily related to a $5.0 million payment to CBS Radio as a result of the new arrangement with CBS Radio, legal and advisor costs associated with the new arrangement, consulting costs attributable to our Metro business re-engineering initiative, re-financing transaction costs and costs related to the issuance of Series A Preferred Stock to Gores. The 2007 and 2006 charges relate to the negotiation of a new long-term arrangement with CBS Radio and for severance obligations related to executive officer changes.
Operating loss
We incurred an operating loss of $438.0 million in 2008. Absent the goodwill impairment charge of $430.1 million, operating income in 2008 decreased $71.2 million to an operating loss of $7.9 million from an operating income of $63.3 million in 2007. The decline in 2008 reflects a $47.0 million decrease
59
Table of Contents
Management’s discussion and analysis of financial condition and results of operations
in revenue and an increase in costs due to restructuring charges for the facilities vacated in connection with the Metro business re-engineering initiative, accrued severance payments, increased personnel costs and costs associated with the new CBS agreement. Operating income in 2007 increased $499.3 million to $63.3 million from an operating loss of $436.0 million in 2006. Excluding the 2006 impairment charge, operating income in 2007 decreased $16.6 million, or 20.8%, to $63.3 million from $79.9 million in 2006. The 2007 decrease was attributable to lower revenue, partially offset by a reduction in operating costs.
Interest expense
Interest expense in 2008 decreased $6.9 million, or 29.5%, to $16.7 million from $23.6 million in 2007 reflecting the decrease in the amount of outstanding debt. Interest expense in 2007 decreased $2.0 million, or 7.7%, to $23.6 million from $25.6 million in 2006. The 2007 decrease was principally attributable to lower average borrowings under our then outstanding credit facility, partially offset by an increase in interest rates, higher amortization of deferred debt costs as a result of amending the then outstanding credit facility in 2006, and a payment to terminate one of our fixed to floating interest rate swap agreements on our aggregate principal amount of then outstanding $150.0 million notes.
Our weighted average interest rate was 6.5%, 6.3% and 5.9% in 2008, 2007 and 2006, respectively.
In January and February 2008, we amended our then outstanding credit facility to increase our leverage ratio and eliminate a provision that deemed the termination of the CBS Radio management agreement an event of default. As a result, our interest rate under the amended agreement for the that facility was increased to LIBOR + 175 basis points from LIBOR + 125 basis points.
Other income
Other income was $12.4 million, $0.4 million and $0.9 million in 2008, 2007 and 2006, respectively. Other income in 2008 was principally due to a gain of $12.4 million on the sale of securities in the third quarter and in 2007, was principally attributable to interest earned on our invested cash balances. In 2006, in addition to interest income, we received $0.5 million in connection with a recapitalization transaction of POP Radio, LP (“POP Radio”), a company in which we have an investment.
Provision for income taxes
Income tax expense in 2008 decreased $30.5 million to a benefit of $14.8 million from an expense of $15.7 million in 2007 as a result of a portion of the goodwill impairment charge recorded during the year being tax deductible. Income tax expense in 2007 increased $6.9 million, or 78.5%, to $15.7 million from $8.8 million in 2006. In 2008, our effective income tax rate was 3.3%. The effective 2008 income tax rate was impacted by the 2008 goodwill impairment charge being substantially non-deductible for tax purposes. The 2007 effective income tax rate benefited from a change in New York State tax law on our deferred tax balance (approximately $0.1 million). The 2006 income tax provision was impacted by the 2006 goodwill impairment and related deferred tax attributes.
Net income (loss)
Net income in 2008 decreased $452.0 million to a loss of $(427.6) million, or $(878.73) per basic and diluted common share, from net income of $24.4 million, or $56.59 per basic and $56.38 per diluted common share and $3.20 per basic and diluted Class B share in 2007. This compares with a net loss of $(469.5) million, or $(1,091.76) per basic and diluted common share and $51.20 per basic and diluted Class B share in 2006. Net income in 2008 and 2006 was impacted by goodwill impairment charges of $430.1 million and $515.9 million, respectively.
60
Table of Contents
Management’s discussion and analysis of financial condition and results of operations
Weighted-average shares
Weighted-average shares outstanding used to compute basic earnings per share were 490,077, 430,563 and 430,066 shares in 2008, 2007 and 2006, respectively. Weighted-average shares outstanding used to compute diluted earnings per share were 490,077, 432,127 and 430,066 shares in 2008, 2007, and 2006, respectively. Basic and diluted weighted-average common shares outstanding are equivalent, as common stock equivalents from stock options, unvested restricted stock and warrants would be anti-dilutive.
LIQUIDITY AND CAPITAL RESOURCES
We continually project anticipated cash requirements, which may include potential acquisitions, capital expenditures, principal and interest payments on our outstanding indebtedness, share repurchases, dividends and working capital requirements. To date, funding requirements have been financed through cash flows from operations, the issuance of equity and the issuance of long-term debt.
At December 31, 2008, our principal sources of liquidity were our cash and cash equivalents of $6.4 million and borrowings under our Old Credit Agreement (as defined below). As previously disclosed and as discussed elsewhere in this prospectus, on February 27, 2009, our outstanding indebtedness under our Old Credit Agreement, which totaled approximately $41.0 million, matured and became due and payable in its entirety. Additionally, we had not made our most recent interest payment due to holders of the Old Notes (as defined below) on November 30, 2008. The non-payment of such amounts constituted an event of default under the Old Credit Agreement and the Old Notes, respectively. Based upon facts and circumstances that existed as of December 31, 2008, we previously disclosed that there was a substantial doubt about our ability to continue as a going concern. We previously disclosed that as of March 30, 2009, we were unable to meet our outstanding debt obligations, which raised substantial doubt about our ability to continue as a going concern. Absent negotiating and executing definitive documentation with various lenders and Gores, obtaining approximately $47.0 million in additional capital to satisfy our outstanding debt payments and obtaining a waiver of our 4.0 to 1 debt leverage covenant (which we anticipated violating upon delivery of our audited financial statements), our sources of liquidity were anticipated to be inadequate to fund immediate and ongoing operating requirements in the next twelve months.
On April 23, 2009, we completed the Restructuring (see Note 20 to our financial statements – Subsequent Events). As part of the Restructuring, we entered into a Securities Purchase Agreement (“Securities Purchase Agreement”) with: (1) holders of our outstanding Old Notes both of which were issued under the Note Purchase Agreement, dated as of December 3, 2002 and (2) lenders under the Credit Agreement, dated as of March 3, 2004 (the “Old Credit Agreement”).
Pursuant to the Securities Purchase Agreement, in consideration for releasing all of their respective claims under the Old Notes and the Old Credit Agreement, the debt holders collectively received: (1) $117.5 million of Senior Notes; (2) 34,962 shares of Series B Preferred Stock; and (3) a one-time cash payment of $25.0 million. Gores purchased at a discount approximately $22.6 million principal amount of our then existing debt held by debt holders who did not wish to participate in the Senior Notes as set forth in the Securities Purchase Agreement.
In connection with the Restructuring, we also entered into a Credit Agreement (the “Senior Credit Facility”) with Wells Fargo Foothill, LLC, as the arranger, administrative agent and initial lender, pursuant to which we obtained a $15.0 million revolving line of credit (which includes a $1.5 million letter of credit sub-facility) on a senior unsecured basis and a $20.0 million unsecured non-amortizing
61
Table of Contents
Management’s discussion and analysis of financial condition and results of operations
term loan, the obligations in respect of which are subordinated to obligations in respect of the Senior Notes. As of the date of this prospectus we have borrowed the entire amount of the term loan and have not made any borrowings under the revolving line of credit. Loans under the Senior Credit Facility will mature on July 15, 2012 and proceeds of the term loan will be used to, among other things, consummate the transactions contemplated by the Restructuring, and pay fees and expenses in connection therewith. Proceeds of the revolving loans are expected to be used for working capital and general corporate purposes.
In addition, as part of the Restructuring, Gores (1) agreed to purchase, at a discount, approximately $22.6 million principal amount of our then existing debt held by debt holders who did not wish to participate in the Senior Notes, (2) agreed to guarantee the Senior Credit Facility and a $10.0 million contractual commitment by one of our wholly owned subsidiaries and (3) invested $25.0 million in the Company for 25,000 shares of Series B Preferred Stock. In connection with Gores providing the guarantees and purchasing the debt from non-participating holders, the 75,000 shares of Series A Preferred Stock held by Gores immediately prior to the Restructuring, which then had a liquidation preference of approximately $79.0 million, were exchanged for 75,000 shares of Series A-1 Preferred Stock.
As described in the section entitled “Prospectus Summary—Recent Events” above, we recently obtained waivers of compliance with our debt leverage covenants for the fourth quarter of 2009 measurement period which means our debt leverage covenant will first be measured on March 31, 2010 and thereafter on a quarterly basis on a trailing four-quarter basis.
Management believes that after giving effect to cost containment measures including furloughs and salary reductions for employees, we will generate sufficient Adjusted EBITDA in order to meet our debt leverage covenant over the next twelve months (namely, on March 31, 2010, June 30, 2010 and September 30, 2010 when the covenants are measured on a trailing four-quarter basis). However, as described elsewhere in this prospectus, we are operating in an uncertain economic environment with limited visibility on advertising orders for the duration of 2009 and the beginning of 2010. As described in the section entitled “Use of Proceeds”, we have agreed to pay down our Senior Notes in an amount of either $15.0 or 20.0 million, depending on the amount of gross proceeds of the offering. If we are unable to achieve our forecasted results, or sufficiently mitigate those results with certain cost reduction measures, and cannot obtain a waiver or amendment of our debt covenant requirements at March 31, 2010 or beyond, it could have a material and adverse effect on our business continuity, results of operations, cash flows and financial condition.
Management has reviewed the impact of the Restructuring, including projected covenant compliance under the new debt (as amended to date), the results of our restructuring plan and our current forecasted results and has concluded that the conditions that gave rise to substantial doubt about our ability to continue as a going concern have been removed. We believe that our sources of liquidity are adequate to fund ongoing operating requirements for the next twelve months.
Existing indebtedness
As of the date of this prospectus, we have: $120.4 million of Senior Notes; a $20.0 million unsecured, non-amortizing term loan and a $15.0 million revolving line of credit (which includes a $1.5 million letter of credit sub-facility) on a senior unsecured basis. The term loan and revolver mature on July 15, 2012 and are guaranteed by our domestic subsidiaries (the “Guarantors”) and Gores. We borrowed the entire amount of the term loan on April 23, 2009 and as of the date of this prospectus have borrowed
62
Table of Contents
Management’s discussion and analysis of financial condition and results of operations
$5.0 million under the revolving line of credit. The Senior Notes bear interest at 15.0% per annum, payable 10% in cash and 5% in-kind (PIK interest). The PIK interest is added to principal quarterly, but will not be payable until maturity. The Senior Notes may be prepaid at any time, in whole or in part, without premium or penalty. Payment of the Senior Notes is mandatory upon, among other things, certain asset sales and the occurrence of a “change of control” (as such term is defined in the Senior Notes). The Senior Notes are guaranteed by the Guarantors and are secured by a first priority lien on substantially all of our assets. Loans under the Senior Credit Facility bear interest at our option at either LIBOR plus 4.5% per annum (with a LIBOR floor of 2.5%) or a base rate plus 4.5% per annum (with a base rate floor of the greater of 3.75% and the one-month LIBOR rate).
Both the Senior Notes and the Senior Credit Facility contain restrictive covenants that, among other things, limit our ability to incur debt, incur liens, make investments, make capital expenditures, consummate acquisitions, pay dividends, sell assets and enter into mergers and similar transactions beyond specified baskets and identified carve-outs. Additionally, we may not exceed the maximum senior leverage ratio (the principal amount outstanding under the Senior Notes over our consolidated EBITDA). The Senior Notes contain customary representations and warranties and affirmative covenants. The Senior Credit Facility contains substantially identical restrictive covenants (including a maximum senior leverage ratio calculated in a manner consistent with the Senior Notes), affirmative covenants and representations and warranties as those found in the Senior Notes, subject, in the case of certain covenants, to a cushion on baskets and covenant levels from those contained in the Senior Notes.
Of particular note, and as described in more detail in our Securities Purchase Agreement and Credit Agreement with Wells Fargo Foothill, any merger, acquisition of the stock or assets of another business, or investment requires the consent of our lenders under the aforementioned agreements, which consent may or may not be provided in connection with any acquisition/investment opportunity. Under these agreements, an “investment” includes, among other things: (1) the purchase or other acquisition of the equity interests of another person/entity, (2) loans or capital contributions to another person/entity and (3) the purchase of assets of another person/entity that constitutes a business unit or all or a substantial part of the business. In the cases of clause (3), these agreements do allow us to make an investment of up to $5 million without lender consent, provided, that such amount, when aggregated with our capital expenditures in such calendar year, does not exceed $15 million.
As part of the Restructuring, Gores (1) agreed to purchase, at a discount, approximately $22.6 million principal amount of our then existing debt held by debt holders who did not wish to participate in the Senior Notes, (2) agreed to guarantee the Senior Credit Facility and a $10.0 million contractual commitment by one of our wholly owned subsidiaries and (3) invested $25.0 million in the Company for 25,000 shares of Series B Preferred Stock. In connection with Gores providing the guarantees and purchasing the debt from non-participating holders, the 75,000 shares of Series A Preferred Stock held by Gores immediately prior to the Restructuring, which then had a liquidation preference of approximately $79.0 million, were exchanged for 75,000 shares of Series A-1 Preferred Stock.
Indebtedness prior to April 23, 2009
Prior to April 23, 2009, our debt consisted of an unsecured, five-year $120.0 million term loan and a five-year $75.0 million revolving credit facility. Interest on the facility was variable and payable at a maximum of the prime rate plus an applicable margin of up to 0.75% or LIBOR plus an applicable margin of up to 1.75%, at our option. The facility contained covenants relating to dividends, liens, indebtedness, capital expenditures and restricted payments, as defined, interest coverage and leverage ratios. As a result of an amendment to our facility in the first quarter of 2008, we provided security to
63
Table of Contents
Management’s discussion and analysis of financial condition and results of operations
our lenders (including holders of our Old Notes (defined below)) on substantially all of our assets and amended our allowable total debt covenant to 4.0 times Annualized Consolidated Operating Cash Flow through the remaining term of the facility.
Prior to April 23, 2009, we also had $200.0 million in Senior Notes (the “Old Notes”) which we issued on December 3, 2002, and consisted of: 5.26% Senior Notes due November 30, 2012 (in an aggregate principal amount of $150.0 million) and 4.64% Senior Notes due November 30, 2009 (in an aggregate principal amount of $50.0 million). Interest on the Old Notes was payable semi-annually in May and November. The Old Notes contained covenants relating to leverage and interest coverage ratios that were identical to those contained in our facility.
At March 31, 2009, we had approximately $9.0 million outstanding under our revolving credit facility and actual debt outstanding under the term loan was $32.0 million. At March 31, 2009, our principal sources of liquidity were cash and cash equivalents of $7.2 million.
On each of March 3, 2008 and March 24, 2008, we sold 7,142,857 shares (14,285,714 shares in the aggregate) of common stock to Gores for an aggregate purchase price of $25.1 million. On June 19, 2008, we sold 75,000 shares of our Series A Convertible Preferred Stock with warrants to purchase (1) up to 3,330,000 shares of our Common Stock at a strike price of $5.00 per share, (2) up to 3,330,000 shares of our Common Stock at a strike price of $6.00 per share, and (3) up to 3,340,000 shares of our Common Stock at a strike price of $7.00 per share, for an aggregate purchase price of $75.0 million to Gores. All of such Series A Convertible Preferred Stock was exchanged into Series A-1 Preferred Stock on April 23, 2009. 3,500 shares of Series A-1 Preferred Stock were converted into common stock on July 9, 2009 and the remaining shares were converted into shares of common stock on August 3, 2009. The warrants were cancelled on August 3, 2009.
Current position
Net cash used by operating activities was $15.1 million for the period ended June 30, 2009 and $4.8 million for the six months ended June 30, 2008, an increase of $10.3 million in net cash used by operating activities. The increase principally reflects the increased net loss, before impairment charges, partially offset by lower capital expenditures.
Our business does not usually require significant cash outlays for capital expenditures. Capital expenditures in the first half of 2009 decreased $3.2 million to $2.9 million from $6.1 million in the first half of 2008. The decrease in the first half of 2009 is principally attributable to the timing of our expenditures planned for the year. We anticipate an increase in capital expenditures for the remainder of 2009 as we invest in systems and infrastructure.
In May 2007, our board of directors elected to discontinue the payment of a dividend on our common stock and does not plan to declare dividends on our common stock for the foreseeable future. The payment of dividends on our common stock is also prohibited by the terms of our Senior Notes.
While we are authorized to repurchase up to $290.5 million of our common stock as of December 31, 2008, we do not plan on repurchasing any additional shares for the foreseeable future. Such repurchases are also prohibited by the terms of our Senior Notes and new Senior Credit Facility.
64
Table of Contents
Management’s discussion and analysis of financial condition and results of operations
INVESTMENTS
TrafficLand
On December 22, 2008, our wholly owned subsidiary Metro Networks Communications, Inc. (Metro) and TrafficLand entered into a License and Services Agreement, which provides us with a three-year license to market and distribute TrafficLand services and products. Concurrent with the execution of the License Agreement, we, TLAC, Inc. (our wholly owned subsidiary formed for such purpose) and TrafficLand entered into an option agreement granting us the right to acquire 100% of the stock of TrafficLand pursuant to the terms of a Merger Agreement, which the parties have negotiated and placed in escrow. As a result of payments previously made under the License Agreement, we have the right to cause the Merger Agreement to be released from escrow at any time on or prior to December 1, 2009. Upon consummation of the closing of the merger, the License Agreement would terminate. Costs of $0.8 million associated with this transaction have been expensed as of December 31, 2008.
GTN
On March 29, 2006, our cost method investment in The Australia Traffic Network Pty Limited was converted into 1,540,195 shares of common stock of Global Traffic Network, Inc. (“GTN”) in connection with the initial public offering of GTN on that date. The investment in GTN was sold during the quarter ended September 30, 2008 and we received proceeds of approximately $12.7 million and realized a gain of $12.4 million. Such gain is included as a component of Other Income in the Consolidated Statement of Operations for the year ended December 31, 2008.
POP Radio
On October 28, 2005, we became a limited partner of POP Radio pursuant to the terms of a subscription agreement dated as of the same date. As part of the transaction, effective January 1, 2006, we became the exclusive sales representative of the majority of advertising on the POP Radio network for five years, until December 31, 2010, unless earlier terminated by the express terms of the sales representative agreement. We hold a 20% limited partnership interest in POP Radio. No additional capital contributions are required by any of the limited partners. This investment is being accounted for under the equity method. The initial investment balance was minimal, and our equity in earnings of POP Radio through December 31, 2008 was minimal.
On September 29, 2006, we, along with the other limited partners of POP Radio, elected to participate in a recapitalization transaction negotiated by POP Radio with Alta Communications, Inc. (“Alta”), in return for which we received $0.5 million on November 13, 2006 which was recorded within Other Income in the Consolidated Statement of Operations for the year ended December 31, 2006. Pursuant to the terms of the transaction, if and when Alta elects to exercise warrants it received in connection with the transaction, our limited partnership interest in POP Radio will decrease from 20% to 6%.
65
Table of Contents
Management’s discussion and analysis of financial condition and results of operations
CONTRACTUAL OBLIGATIONS AND COMMITMENTS
The following table lists our future contractual obligations and commitments as of December 31, 2008:
| Payments due by period | |||||||||||||||
| Total | <1 year | 1 – 3 years | 3 – 5 years | >5 years | |||||||||||
| (in millions) | |||||||||||||||
| Contractual Obligations(1) |
|||||||||||||||
| Debt(2) |
$ | 260.0 | $ | 260.0 | $ | — | $ | — | $ | — | |||||
| Capital Lease Obligations |
2.5 | 1.0 | 1.6 | — | — | ||||||||||
| Operating Leases(3) |
50.9 | 9.0 | 11.8 | 11.0 | 19.0 | ||||||||||
| Other Long-term Obligations(4)(5) |
669.6 | 108.4 | 176.6 | 148.0 | 236.5 | ||||||||||
| Total Contractual Obligations |
$ | 983.0 | $ | 378.4 | $ | 190.0 | $ | 159.0 | $ | 255.5 | |||||
| (1) | The above table excludes our Fin 48 reserves as the future cash flows are uncertain as of December 31, 2008. |
| (2) | Includes the estimated net interest payments on fixed and variable rate debt. Estimated interest payments on floating rate instruments are computed using our interest rate as of December 31, 2008, and borrowings outstanding are assumed to remain at current levels. |
| (3) | We have long-term non-cancelable operating lease commitments for office space and equipment and capital leases for satellite transponders. |
| (4) | Included in Other Long-term Obligations are various contractual agreements to pay for talent, broadcast rights, research and various related party arrangements, including $575.9 million of payments due under the new CBS Master Agreement and the previous Management Agreement. As discussed in more detail below, on October 2, 2007, we entered into a new Master Agreement with CBS Radio, Inc. which closed on March 3, 2008. As a result of the new arrangement with CBS Radio, total contractual obligations included in the above table are $575.9 million ($63.8 million within 1 year; $133.8 million 1-3 years; $141.7 million 3-5 years; and, $236.5 million beyond 5 years). |
This supplemental information relates solely to the debt as of June 30, 2009.
| Payments due by period | |||||||||||||||
| Total | <1 year | 1 – 3 years | 3 – 5 years | >5 years | |||||||||||
| (in millions) | |||||||||||||||
| Debt |
$ | 128.1 | $ | — | $ | 128.1 | $ | — | $ | — | |||||
| Due To Gores |
10.9 | — | 10.9 | — | — | ||||||||||
| Total Debt |
139.0 | — | 139.0 | — | — | ||||||||||
| (5) | As described elsewhere in this prospectus, as a result of the Restructuring that closed on April 23, 2009, our indebtedness was reduced to a total of $139.0 million, which is comprised of $119.0 million of Senior Notes (including $1.5 million in PIK interest accrued on June 30, 2009) and a $20.0 million unsecured non-amortizing term loan. Additionally, we have a $15.0 million revolving line of credit (which includes a $1.5 million letter of credit sub-facility) on a senior unsecured basis. As of the date of this prospectus, we have drawn down $5.0 million of our $15.0 million revolving line of credit. |
66
Table of Contents
Management’s discussion and analysis of financial condition and results of operations
RELATED PARTIES
Periods prior to closing of master agreement with CBS Radio which occurred on March 3, 2008
CBS Radio holds approximately 80,000 shares of our common stock and prior to March 3, 2008, provided ongoing management services to us under the terms of the Management Agreement. In return for receiving services under the Management Agreement, we paid CBS Radio an annual base fee and provided CBS Radio the opportunity to earn an incentive bonus if we exceeded pre-determined targeted cash flows. For the years ended December 31, 2008, 2007 and 2006, we paid CBS Radio a base fee of $0.6 million, $3.4 million, and $3.3 million, respectively. However, no incentive bonus was paid to CBS Radio in such years as targeted cash flow levels were not achieved during such periods. On March 3, 2008, the Management Agreement terminated.
Prior to March 3, 2008, we and CBS Radio were also parties to a Representation Agreement to operate what was referred to as the CBS Radio Network. In addition to the Management Agreement and Representation Agreement described above, we also were party to other transactions with CBS Radio and its affiliates, including Viacom, in the normal course of business, including affiliation agreements with many of CBS Radio’s radio stations and agreements with CBS Radio and its affiliates for programming rights. Prior to its termination, the Management Agreement provided that all transactions between us and CBS Radio or its affiliates, other than the Management Agreement and Representation Agreement, which agreements were ratified by our stockholders, had to be on a basis at least as favorable to us as if the transaction were entered into with an independent third party. In addition, subject to specified exceptions, the Management Agreement required that all agreements between us, on the one hand, and CBS Radio or any of its affiliates, on the other hand, were to be approved by the independent members of our Board of Directors.
During 2008, we incurred aggregate expenses of approximately $73.0 million for the Representation Agreement, affiliation agreements and the purchase of programming rights from CBS Radio and its affiliates (such amounts were $66.6 million in 2007 and $75.5 million in 2006). The description and amounts regarding related party transactions set forth in this prospectus, and the consolidated financial statements and related notes, also reflect transactions between us and Viacom. Viacom is an affiliate of CBS Radio, as National Amusements, Inc. beneficially owns a majority of the voting powers of all classes of common stock of each of CBS Corporation and Viacom. As a result of this change in ownership and the fact that CBS Radio ceased to manage us in March 2008, we no longer consider CBS Radio to be a related party effective as of August 3, 2009.
In addition to the base fee and incentive compensation described above, we granted to CBS Radio seven fully vested and non-forfeitable warrants to purchase an aggregate of 4,500,000 shares of our common stock (comprised of two warrants to purchase 1,000,000 shares of common stock per warrant and five warrants to purchase 500,000 shares of common stock per warrant). On March 3, 2008, all warrants issued to CBS Radio were cancelled in accordance with the terms of the CBS Master Agreement.
Overview of relationship with CBS
As described elsewhere in this prospectus, on March 3, 2008, we and CBS Radio closed the arrangement described in the CBS Master Agreement, dated as of October 2, 2007, by and between us and CBS Radio. On such date, the CBS Master Agreement terminated and our Representation Agreement with CBS Radio was replaced by an Amended and Restated News Programming Agreement, an Amended and Restated License Agreement and an Amended and Restated Technical Services Agreement. At the closing, we and CBS Radio entered into various agreements in substantially the form set forth as exhibits to the
67
Table of Contents
Management’s discussion and analysis of financial condition and results of operations
CBS Master Agreement, including the following: (1) Amended and Restated News Programming Agreement; (2) Amended and Restated Trademark License Agreement; (3) Amended and Restated Technical Services Agreement; (4) Mutual General Release and Covenant Not to Sue; (5) Amended and Restated Registration Rights Agreement; (6) Lease for 524 W. 57th Street; (7) Lease for 2020 M Street; (8) Sublease for 2000 M Street; (9) Westwood One Affiliation Agreements for certain CBS Radio owned and operated stations (“CBS Stations”); and (10) Metro Networks Affiliation Agreements for CBS Stations (documents 9 and 10, the “Station Agreements” and documents 1-10 collectively, the “New Transaction Documents”). These agreements were discussed in a Current Report on Form 8-K filed with the SEC on October 4, 2007 and included as part of a definitive proxy statement filed with the SEC on December 21, 2007. The closing under the CBS Master Agreement was described in a Current Report on Form 8-K filed with the SEC on March 6, 2008 and the New Transaction Documents were included as exhibits to such filing. A brief description of certain provisions of the New Transaction Documents was included in our Annual Report on Form 10-K for the year ended December 31, 2007, however, such descriptions are qualified entirely by reference to the documents named above.
CRITICAL ACCOUNTING POLICIES AND ESTIMATES
Our financial statements are prepared in accordance with accounting principles that are generally accepted in the United States. The preparation of these financial statements requires us to make estimates and assumptions that affect the reported amounts of assets, liabilities, revenue and expenses as well as the disclosure of contingent assets and liabilities. We continually evaluate our estimates and judgments including those related to allowances for doubtful accounts, useful lives of property, plant and equipment and intangible assets, and other contingencies. We base our estimates and judgments on historical experience and other factors that are believed to be reasonable under the circumstances. Actual results may differ from these estimates under different assumptions or conditions. We believe that of our significant accounting policies, the following may involve a higher degree of judgment or complexity.
Revenue recognition
Revenue is recognized when earned, which occurs at the time commercial advertisements are broadcast. Payments received in advance are deferred until earned and such amounts are included as a component of Deferred Revenue in the accompanying balance sheet.
We consider matters such as credit and inventory risks, among others, in assessing arrangements with our programming and distribution partners. In those circumstances where we function as the principal in the transaction, the revenue and associated operating costs are presented on a gross basis in the consolidated statement of operations. In those circumstances where we function as an agent or sales representative, our effective commission is presented within Revenue with no corresponding operating expenses.
Barter transactions represent the exchange of commercial announcements for programming rights, merchandise or services. These transactions are recorded at the fair market value of the commercial announcements relinquished, or the fair value of the merchandise and services received. A wide range of factors could materially affect the fair market value of commercial airtime sold in future periods (See the section entitled “Cautionary Note Regarding Forward-Looking Statements and Industry Data” in the “Risk Factors” section of this prospectus), which would require us to increase or decrease the amount of assets and liabilities and related revenue and expenses recorded from prospective barter transactions. Revenue is recognized on barter transactions when the advertisements are broadcast. Expenses are recorded when the merchandise or service is utilized.
68
Table of Contents
Management’s discussion and analysis of financial condition and results of operations
Program rights
Program rights are stated at the lower of cost, less accumulated amortization, or net realizable value. Program rights and the related liabilities are recorded when the license period begins and the program is available for use, and are charged to expense when the event is broadcast.
Valuation of goodwill and intangible assets
Goodwill represents the excess of cost over fair value of net assets of businesses acquired. In accordance with Statement of Financial Accounting Standards No. 142 (“SFAS 142”) “Goodwill and Other Intangible Assets”, the value assigned to goodwill and indefinite lived intangible assets is not amortized to expense, but rather the estimated fair value of the reporting unit is compared to its carrying amount on at least an annual basis to determine if there is a potential impairment. If the fair value of the reporting unit is less than its carrying value, an impairment loss is recorded to the extent that the implied fair value of the reporting unit goodwill and intangible assets is less than their carrying value.
Prior to 2008, we operated as a single reportable operating segment: the sale of commercial time. As part of our re-engineering initiative commenced in the fourth quarter of 2008, we installed separate management for the Network and Metro businesses providing discrete financial information and management oversight. Accordingly, we have determined that each division is an operating segment. A reporting unit is the operating segment or a business which is one level below the operating segment. Our reporting units are consistent with our operating segments and impairment has been tested at this level.
In order to estimate the fair values of assets and liabilities a company may use various methods including discounted cash flows, excess earnings, profit split and income methods. Utilization of any of these methods requires that a company make important assumptions and judgments about future operating results, cash flows, discount rates, and the probability of various scenarios, as well as the proportional contribution of various assets to results and other judgmental allocations. In 2008, we determined that using a discounted cash flow model was the best evaluation of the fair value of our two reporting units. In prior periods, we evaluated the fair value of our reporting unit based on a weighted average of a combination of a discounted cash flow approach and the quoted market price of our stock.
On an annual basis and upon the occurrence of certain interim triggering events, we are required to perform impairment tests on our identified intangible assets with indefinite lives, including goodwill, which testing could impact the value of our business. In 2008, we determined that our goodwill was impaired and recorded impairment charges totaling $430.2 million ($206.1 million in the second quarter and $224.1 million in the fourth quarter). In connection with our Restructuring and our requisite adoption of the acquisition method of accounting, we recorded new values of certain assets such that as of April 24, 2009 our revalued goodwill was $86.4 million (an increase of $52.4 million) and intangible assets were $116.9 million (an increase of $109.3 million), all of which will be tested annually for impairment or upon a triggering event in the future. As of June 30, 2009, goodwill is $86.4 million, intangible assets (net of amortization) are $112.0 million and the value of our fixed assets is $36.4 million, all of which will be tested for impairment in the future.
Intangible assets subject to amortization primarily consist of affiliation agreements that were acquired in prior years. Such affiliate contacts, when aggregated, create a nationwide audience that is sold to national advertisers. The intangible asset values assigned to the affiliate agreements for each acquisition were determined based upon the expected discounted aggregate cash flows to be derived over the life of the affiliate relationship. The method of amortizing the intangible asset values reflects, based upon our historical experience, an accelerated rate of attrition in the affiliate base over the expected life of the
69
Table of Contents
Management’s discussion and analysis of financial condition and results of operations
affiliate relationships. Accordingly, we amortize the value assigned to affiliate agreements on an accelerated basis (period ranging from four to 20 years with a weighted-average amortization period of approximately eight years) consistent with the pattern of cash flows which are expected to be derived. We review the recoverability of our finite-lived intangible assets whenever events or circumstances indicate that the carrying amount of an asset may not be recoverable. Recoverability is assessed by comparison to associated undiscounted cash flows. No impairment of intangible assets has been identified in any period presented.
Allowance for doubtful accounts
We maintain an allowance for doubtful accounts for estimated losses that may result from the inability of our customers to make required payments. We base our allowance on the likelihood of recoverability of accounts receivable by aging category, based on past experience and taking into account current collection trends that are expected to continue. If economic or specific industry trends worsen beyond our estimates, it would be necessary to increase our allowance for doubtful accounts. Alternatively, if trends improve beyond our estimates, we would be required to decrease our allowance for doubtful accounts. Our estimates are reviewed periodically, and adjustments are reflected through bad debt expense in the period they become known. Changes in our bad debt experience can materially affect our results of operations. Our allowance for bad debts requires us to consider anticipated collection trends and requires a high degree of judgment. In addition, as fully described herein, our results in any reporting period could be impacted by relatively few but significant bad debts.
Estimated useful lives of property, plant and equipment
We estimate the useful lives of property, plant and equipment in order to determine the amount of depreciation expense to be recorded during any reporting period. The useful lives, which are disclosed in Note 1—“Summary of Significant Accounting Policies” of the consolidated financial statements, are estimated at the time the asset is acquired and are based on historical experience with similar assets as well as taking into account anticipated technological or other changes. If technological changes were to occur more rapidly than anticipated or in a different form than anticipated, the useful lives assigned to these assets may need to be shortened, resulting in the recognition of increased depreciation and amortization expense in future periods. Alternately, these types of technological changes could result in the recognition of an impairment charge to reflect the write-down in value of the asset.
RECENT ACCOUNTING PRONOUNCEMENTS
In June 2009, the FASB issued SFAS No. 168, “The FASB Accounting Standards Codification™ and the Hierarchy of Generally Accepted Accounting Principles—a replacement of FASB Statement No. 162” (SFAS 168). SFAS 168 replaces SFAS No. 162, “The Hierarchy of Generally Accepted Accounting Principles” and establishes the “FASB Accounting Standard Codification™” (Codification) as the source of authoritative accounting principles recognized by the FASB to be applied by nongovernmental entities in the preparation of financial statements in conformity with generally accepted accounting principles in the United States. All guidance contained in the Codification carries an equal level of authority. On the effective date of SFAS 168, the Codification will supersede all then-existing non-SEC accounting and reporting standards. All other nongrandfathered non-SEC accounting literature not included in the Codification will become nonauthoritative. SFAS 168 is effective for financial statements issued for interim and annual periods ending after September 15, 2009. We have evaluated this new statement, and have determined that it will not have a significant impact on the determination or reporting of our financial results.
70
Table of Contents
Management’s discussion and analysis of financial condition and results of operations
In May 2009, the FASB issued SFAS No. 165, “Subsequent Events” (“SFAS 165”), which establishes general standards of accounting for and disclosure of events that occur after the balance sheet date but before financial statements are issued or are available to be issued. In particular, SFAS 165 sets forth: (1) the period after the balance sheet date during which management of a reporting entity should evaluate events or transactions that may occur for potential recognition or disclosure in the financial statements, (2) the circumstances under which an entity should recognize events or transactions occurring after the balance sheet date in its financial statements, and (3) the disclosures that an entity should make about events or transactions that occurred after the balance sheet date. In accordance with SFAS 165, an entity should apply the requirements to interim and annual financial periods ending after June 15, 2009. The implementation of this standard, effective for our interim financial statements ending June 30, 2009, did not have a material impact on our consolidated financial position and results of operations. For the interim financial period ended June 30, 2009, subsequent events were evaluated through August 10, 2009, the date the financial statements were issued.
In April 2009, the FASB issued FSP FAS 107-1 and APB 28-1, “Interim Disclosures about Fair Value of Financial Instruments” (“FSP FAS 107-1 and APB 28-1”). This FSP amends FASB Statement No. 107, Disclosures about Fair Value of Financial Instruments, to require disclosures about fair value of financial instruments for interim reporting periods of publicly traded companies as well as in annual financial statements. This FSP also amends APB Opinion No. 28, Interim Financial Reporting, to require those disclosures in summarized financial information at interim reporting periods. This FSP is effective for interim reporting periods ending after June 15, 2009, with early adoption permitted for periods ending after March 15, 2009. We have adopted the disclosure requirements of FSP FAS 107-1 and APB 28-1 effective with our second quarter ended June 30, 2009. The adoption of FSP FAS 107-1 and APB 28-1 did not have an impact on the determination or reporting of our financial results.
In March 2009, the Financial Accounting Standards Board (“FASB”) issued FSP FAS 141(R)-1, Accounting for Assets Acquired and Liabilities Assumed in a Business Combination (“FSP FAS 141(R)-1”), which amends the guidance in SFAS 141R, for the initial recognition and measurement, subsequent measurement, and disclosures of assets and liabilities arising from contingencies in a business combination. In addition, FSP FAS 141(R)-1 amends the existing guidance related to accounting for pre-existing contingent consideration assumed as part of the business combination. FSP FAS 141(R)-1 is effective for the Company January 1, 2009.
In December 2007, the FASB issued SFAS No. 141 (revised 2007), “Business Combinations” (“SFAS 141R”). SFAS 141R establishes principles and requirements for how an acquirer recognizes and measures in our financial statements the identifiable assets acquired, the liabilities assumed, any noncontrolling interest in the acquiree and the goodwill acquired. SFAS 141R also establishes disclosure requirements to enable the evaluation of the nature and financial effects of the business combination. SFAS 141R is effective as of the beginning of an entity’s fiscal year that begins after December 15, 2008. The adoption of SFAS 141R and FSP FAS 141(R)-1 impacted the accounting for our Restructuring.
In November 2008, the EITF issued Issue No. 08-6, Equity Method Investment Accounting Considerations (“EITF 08-6”), which is effective for the Company January 1, 2009. EITF 08-6 addresses the impact that SFAS 141R and SFAS 160 might have on the accounting for equity method investments, including how the initial carrying value of an equity method investment should be determined, how an impairment assessment of an underlying indefinite-lived intangible asset of an equity method investment should be performed and how to account for a change in an investment from the equity method to the cost method. The adoption of this guidance does not have a significant impact on our Consolidated Financial Statements.
71
Table of Contents
Management’s discussion and analysis of financial condition and results of operations
In March 2008, the FASB issued SFAS 161, “Disclosures About Derivative Instruments and Hedging Activities – an amendment of FASB Statement No. 133” (“SFAS 161”). SFAS 161 expands quarterly disclosure requirements in SFAS No. 133 about an entity’s derivative instruments and hedging activities. SFAS No. 161 is effective for fiscal years beginning after November 15, 2008. The relevant disclosures have been included in our Consolidated Financial Statements.
In December 2007, the FASB issued SFAS 160, “Non-controlling Interests in Consolidated Financial Statements” (“SFAS 160”). SFAS 160 establishes requirements for ownership interests in subsidiaries held by parties other than the parent (sometimes called “minority interests”) to be clearly identified, presented, and disclosed in the consolidated statement of financial position within equity, but separate from the parent’s equity. All changes in the parent’s ownership interests are required to be accounted for consistently as equity transactions and any non-controlling equity investments in unconsolidated subsidiaries must be measured initially at fair value. SFAS 160 is effective, on a prospective basis, for fiscal years beginning after December 15, 2008. However, presentation and disclosure requirements must be retrospectively applied to our Consolidated Financial Statements.
QUALITATIVE AND QUANTITATIVE DISCLOSURES ABOUT MARKET RISK
In the normal course of business, we employ established policies and procedures to manage our exposure to changes in interest rates using financial instruments. Previously we used derivative financial instruments (fixed-to-floating interest rate swap agreements) for the purpose of hedging specific exposures and normally hold all derivatives for purposes other than trading. All derivative financial instruments previously held reduced the risk of the underlying hedged item and were designated at inception as hedges with respect to the underlying hedged item. Hedges of fair value exposure were entered into in order to hedge the fair value of a recognized asset, liability or a firm commitment.
Prior to terminating our interest rate swaps in November 2007 and December 2008, we had entered into a seven-year interest rate swap agreement covering $25.0 million notional value of our outstanding borrowing to effectively float the majority of the interest rate at three-month LIBOR plus 74 basis points, and two ten-year interest rate swap agreements covering $75.0 million notional value of our outstanding borrowing to effectively float the majority of the interest rate at three-month LIBOR plus 80 basis points. In total, the swaps initially covered $100.0 million, which represented 50% of the notional amount of Old Notes. These swap transactions allowed us to benefit from short-term declines in interest rates while having the long-term stability on the other 50% of the Old Notes of fairly low fixed rates. The instruments met all of the criteria of a fair-value hedge and were classified in the same category as the item hedged in the accompanying balance sheet. We had the appropriate documentation, including the risk management objective and strategy for undertaking the hedge, identification of the hedged instrument, the hedge item, the nature of the risk being hedged, and how the hedging instrument’s effectiveness offsets the exposure to changes in the hedged item’s fair value.
Our receivables do not represent a significant concentration of credit risk due to the wide variety of customers and markets in which we operate.
72
Table of Contents
OUR COMPANY
We produce and provide traffic, news, weather, sports, talk, music, special events and other programming. Our content is distributed to radio and television stations and digital platforms and reaches over 190 million people. We are one of the largest domestic outsourced providers of traffic reporting services and one of the nation’s largest radio networks, delivering content to approximately 5,000 radio and 170 television stations in the US. We exchange our content with radio and television stations for commercial airtime, which we then sell to local, regional and national advertisers. By aggregating and packaging commercial airtime across radio and television stations nationwide, we are able to offer our advertising customers a cost-effective way to reach a broad audience and target their audience on a demographic and geographic basis.
We are organized into two business segments: Metro and Network.
Our Metro business produces and distributes traffic and other local information reports (such as news, sports and weather) to approximately 2,200 radio and television stations, which include stations in over 80 of the top 100 Metro Service Area (“MSA”) markets in the US. Our Metro business generates revenue from the sale of commercial advertising inventory to advertisers (typically 10 and 15 second spots in radio embedded within our information reports and 30 second spots in television). We provide broadcasters a cost-effective alternative to gathering and delivering their own traffic and local information reports and offer advertisers a more efficient, broad reaching alternative to purchasing advertising directly from individual radio and television stations.
Our Network business nationally syndicates proprietary and licensed content to radio stations, enabling them to meet their programming needs on a cost-effective basis. The programming includes national news and sports content, such as CBS Radio News, CNN Radio News and NBC Radio News and major sporting events, including the National Football League (including the Super Bowl), NCAA football and basketball games (including the Men’s Basketball Tournament, ie, “March Madness”) and the 2010 Winter Olympic Games. Our Network business features popular shows that we produce with personalities including Dennis Miller, Charles Osgood, Fred Thompson and Billy Bush. We also feature special events such as live concert broadcasts, countdown shows (including MTV and Country Music Television branded programs), music and interview programs. Our Network business generates revenue from the sale of 30 and 60 second commercial airtime, often embedded in our programming, that we bundle and sell to national advertisers who want to reach a large audience across numerous radio stations.
We believe that our market position in both the Metro and Network businesses and our recent turnaround strategies and revenue enhancement initiatives afford us with a number of revenue growth opportunities. We are developing additional potential revenue streams by leveraging our existing resources (eg, content, personnel and personalities) and accessing new distribution channels for our extensive content.
Examples of such include:
| Ø | Streaming. We currently stream only certain select programs on the Internet (Dennis Miller, Fred Thompson, Loveline), and are presently focused on generating additional revenue in the Network business by distributing to affiliates more of our content for streaming on a subscription-based model. In the Metro business, our WebNews and RealTraffic products are each carried by over 250 affiliates and we continue to believe this is a growth area as we expand our affiliate base and add and improve |
73
Table of Contents
Business
| visual features of WebNews and RealTraffic. Additionally, for the first time, in 2009 our radio broadcasts of NFL football games will be streamed on a subscription-based service accessible at www.nfl.com. We also anticipate entering into an agreement that will enable us to insert web advertising in our Internet programming (as opposed to inserting the same advertising that appears in our terrestrial radio broadcasts), which will provide an additional revenue stream beyond our traditional radio commercial inventory. |
| Ø | Personality Sponsorships. Our Network programming consists of a broad array of well-known personalities, including Charles Osgood, Fred Thompson, Dennis Miller, Billy Bush, Cody Alan and Randy Jackson. Additional revenue may be attainable if we are able to monetize our personalities by providing advertisers with unique opportunities to partner with them. We are currently in discussions with a third party to assist us in this endeavor, which could include sponsored contests, e-newsletters and endorsements in the digital space. |
| Ø | Alternate Distribution Channels. In connection with our partnership with TrafficLand, we are planning to launch a mobile application of traffic content that will include more robust visual features for users in a few key markets. Whether this develops into significant revenue will depend on user acceptance of the product (if positive, we would anticipate expanding into an additional 15 markets in 2010) and our ability to successfully introduce advertisements into the mobile environment. Additionally, we are currently focused on driving additional revenue by providing XML data feeds of our traffic content to third party content providers for use in their digital applications as well as newspaper websites, to mobile companies (aggregators of content that can be disseminated to mobile devices) and to television websites. XML feeds, which are less expensive for our customers, have a higher profit margin for us because we own the feeds and do not require third-party assistance to distribute the feeds. |
In addition, we believe there is an opportunity to pursue acquisitions, partnerships and joint ventures to consolidate our existing business with competitors and expand into new markets. We routinely evaluate and analyze such opportunities, but we have no current binding plans or arrangements with respect to any such opportunities. We have an option, exercisable through December 1, 2009, to acquire TrafficLand, a provider of traffic video collected from local and state Departments of Transportation. Entering into any transactions with respect to such opportunities would be subject to completion of due diligence, finalization of key business and financial terms (including price) and negotiation of final definitive documentation as well as a number of other factors and conditions including, without limitation, the approval of our board of directors and any required third party consents (including any required lenders’ consent). We cannot predict how quickly the terms of any such transaction could be finalized, if at all. Accordingly, there can be no assurance that definitive documentation for any such transaction would be executed or even if executed, that any such transaction will be consummated. In connection with evaluating potential strategic acquisition and investment transactions, we have, and may in the future, incur significant expenses for the evaluation and due diligence investigation of these potential transactions.
OUR STRENGTHS
We believe our strengths include:
| Ø | Large Independent Provider of Content. We are one of the largest domestic outsourced providers of traffic reporting services and one of the nation’s largest radio networks, producing and distributing traffic, news, weather, sports, talk, music, special events and other programming. As an independent provider of content, without any stations under our ownership, we are able to transact with all station groups. We deliver content to approximately 5,000 radio and 170 television stations in the US. |
74
Table of Contents
Business
| Ø | Developer of Original Content. We create and develop content for radio and television stations. The programming includes several nationally known personalities including Dennis Miller, Charles Osgood, Fred Thompson and Billy Bush. We also provide stations with targeted programming, including national news, major sporting events and local news and traffic programming that they can generally not afford to develop on their own. |
| Ø | Multichannel Distributor of Content. As a producer of original content, we have the ability to utilize multiple media channels by leveraging our existing production capabilities and vast library of content to generate additional revenue without incurring significant costs. For example, much of the same content we distribute to our radio station customers is available to consumers online via podcasting or live streaming, which enables us to generate additional revenue from the sale of advertising embedded in such streams or podcasts. |
| Ø | Significant Operating Leverage. Our business model has a relatively fixed cost base leading to significant operating leverage. We have made progress and are working to further reduce our fixed costs which we believe will enhance our profitability if revenue increases in the future due to an economic recovery or organic growth factors. |
| Ø | Experienced Management Team. We have brought together a new, experienced management team with extensive strategic, operating and financial expertise. Our management team has an average of 16 years of industry experience. Our relationship with The Gores Group provides us with additional operational, financial and strategic support. We believe this management team has the ability to respond to economic and industry trends and cycles while maximizing revenue growth from the sale of commercial airtime. |
OUR STRATEGY
Our goal is to grow the revenue and profitability of our business. Key elements of our strategy to achieve this goal include:
| Ø | Complete operational turnaround. We have recently begun and believe we will continue to increase our operational efficiency with the assistance of The Gores Group. We announced on March 16, 2009, certain re-engineering and cost-cutting initiatives, as described below in “Turnaround Strategies and Revenue Enhancement Initiatives”, that are collectively anticipated to result in total annual savings of approximately $55 to $63 million. In the third quarter of 2008, we announced a plan to restructure the traffic operations of the Metro Traffic business (commonly referred to by us as the Metro re-engineering) and to implement other cost reductions. The reengineering entailed reducing the number of our Metro Traffic operational hubs from 60 to 13 regional centers and produced meaningful reductions in labor expense, aviation expense, station compensation, program commissions and rent. We have also implemented additional cost reduction initiatives in the first half of 2009, including reductions in Network programming costs, labor expense, station compensation and other operating costs, to help improve our operating and financial performance and help establish a foundation for potential long-term growth. We have recognized $25.0 million of savings from both the Metro re-engineering and additional cost reduction initiatives undertaken by us through the end of the second fiscal quarter of 2009. We anticipate that the total annual savings in 2009 (from the start of the Metro re-engineering and other cost reductions in the third quarter of 2008) will be in the $53.0 million to $61.0 million range and additional savings in 2010 will be approximately $2.0 million, as additional phases of the Metro re-engineering and cost-reduction programs are implemented. These anticipated savings are comprised of labor savings, lower programming costs and reductions in aviation expense, station compensation and savings from consolidation of office leases. Many of the initiatives were instituted as of June 30, 2009. Not included in the foregoing are amounts related to the compensation reduction and furlough actions (aggregating 10 days of pay per each participating full-time employee) |
75
Table of Contents
Business
| that we announced on September 29, 2009, which actions shall result in additional cost savings in 2009. These savings will be offset to a limited degree by investments in our sales force, technology and digital capabilities and certain strategic partnerships such as TrafficLand, a provider of traffic video collected from local and state Departments of Transportation. |
| Ø | Expand our Sales Force. We have recently begun and plan to continue to build-out and leverage our extensive local and national sales force to generate increased revenue from the sale of commercial airtime. In our Network business, we are adding category management specialists in high-potential segments of the advertising market. In our Metro business, we have added new sales people at various locations across the country to deepen our local market coverage. We are also adding select sales people in our Metro business to expand the distribution of our local content. Additionally, in our Network business we recently began to offer copy-splitting advertising services which enable our advertising clients to reach more than one desired geographic area at the same time. |
| Ø | Pursue strategic opportunities. We evaluate acquisitions, partnerships and joint ventures on an ongoing basis and intend to pursue acquisitions of and partnerships or joint ventures with businesses in our industry and related industries that can assist us in achieving our growth strategy. We focus on opportunities with content and services businesses serving the radio, television and digital markets. We approach strategic opportunities in a disciplined manner and, with the assistance of The Gores Group, intend to focus on opportunities that strengthen our competitive position. |
| Ø | Produce cost-effective, original programming. We will continue to leverage our national scale to provide radio and television stations with programming and services that they may not be able to cost-effectively produce on their own, most notably on the Network side, where rights fees for sporting events and fees for prominent talent personalities are significant and have generally continued to increase over time (except in certain cases in 2009 where we have been able to negotiate lower fees, in part because of a weaker economy). As a syndicator of programming to approximately 5,000 radio stations and 170 television stations nationwide, we are able to pay such programming costs for a broad array of content, while one station, in most cases, could not. We distribute our programming on a barter basis in exchange for commercial airtime in lieu of cash, which allows stations to preserve capital. |
| Ø | Expand our distribution channels. We plan to continue expanding our product offerings across radio, television, online and other platforms through initiatives such as on-camera graphics and mobile video. Our Metro business is also expanding into the digital and wireless categories as a provider of traffic information on mobile and personal navigation devices. As part of this strategy, our Metro business recently entered into a License and Services Agreement with TrafficLand. The agreement provides our Metro business with the exclusive right to enter into affiliation agreements with third party broadcasters wanting access to TrafficLand’s live video traffic feeds, which (i) provides us with simultaneous access to 4,700 traffic cameras and (ii) enables us to enhance our product offerings to stations that carry our programming and data feeds. We have an option, exercisable through December 1, 2009, to acquire TrafficLand. We have also partnered with AirSage, a provider of digital traffic data, to enhance our real-time road condition and data reports and with TrafficCast, a traffic science company, to collaborate on licensing of integrated data for others. We believe these initiatives will allow us to significantly expand our digital content offerings. |
INDUSTRY OVERVIEW
Radio broadcasting & advertising
According to the FCC, there were 11,213 commercial radio stations serving listeners in the United States as of December 31, 2008. The RAB reported on its website, based on information provided by Miller, Kaplan, Arase & Co., that the market for US radio advertising in 2008 was $19.5 billion, down 8.6%
76
Table of Contents
Business
from $21.3 billion in 2007. The Radio Advertising Bureau (“RAB”) attributes the decline to the current macro-economic environment and its impact on overall spending. We compete in the local ($13.6 billion), national ($2.9 billion) and network ($1.2 billion) radio advertising segments which comprise the majority of the total industry.
AM/FM radio is one of the most popular forms of media in terms of audience consumption. According to Arbitron’s Spring 2007 study, the average time spent listening to the radio by persons 12+ in the US is 19 hours per week. In April 2009, Arbitron reported that 92% of the 12+ demographic uses AM/FM radio each week.
Network radio listenership remains strong among key demographics. According to Arbitron’s 2008 “Network Radio Today” report, network radio reaches nearly 75% of the 12+ US population each week and performs well within the key 18-24, 18-49 and 25-54 year old demographics, reaching 73%, 74% and 74%, respectively. Furthermore, the report also shows reports that more than 60% of adult consumers over the age of 18 listen to network radio out-of-the-home or approximately 143 million adults each week.
Weekly reach percentage by age
Persons 12+
Mon-Sun, 12M-12M
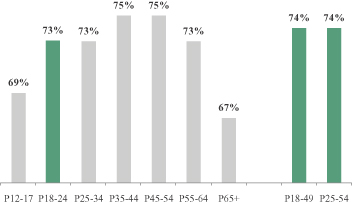
Source: Arbitron’s “Network Radio Today” report, 2008.
To compete for a local audience a radio station selects a style of programming (“format”) that appeals to a target listening group or demographic. There are many formats a station may select, including news, talk, sports and various types of music and entertainment programming. Radio stations generally develop their own programming often with local talent or acquire programming from national sources such as radio networks and syndicators.
In addition to traditional “terrestrial” radio stations, new technologies and services have entered the marketplace. Recently the radio industry has begun to deploy HD Digital RadioTM technology to deliver digital channels which make more efficient use of spectrum than analog channels and thus enable a radio station to offer multiple digital radio channels and additional services. Internet-based radio services, including our own podcast services, represent an emerging business opportunity. Sirius XM Radio Inc. is a satellite-based broadcaster with programming similar to terrestrial radio.
77
Table of Contents
Business
Radio offers a cost efficient way of reaching diverse audience groups in large numbers. Radio advertising can be purchased by advertisers on a local, regional or national basis. Local and regional purchases allow an advertiser to choose a geographic market for the broadcast of commercial messages. Advertising purchased from a national radio network allows an advertiser to target its commercial messages to a specific demographic within a large national audience. In addition, an advertiser can choose to emphasize its message in a certain market or markets by supplementing a national purchase with local and/or regional purchases.
CPM (1) comparison
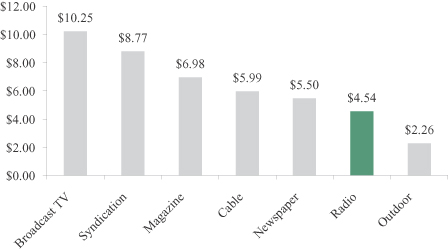
Source: Media Dynamics; Intermedia Dimensions, Inc. 2008.
| (1) | CPM = cost per thousand impressions. |
Radio advertising has historically been cyclical, but with meaningful growth occurring following a recessionary period as depicted below.
Nominal GDP growth vs. Radio advertising sales growth
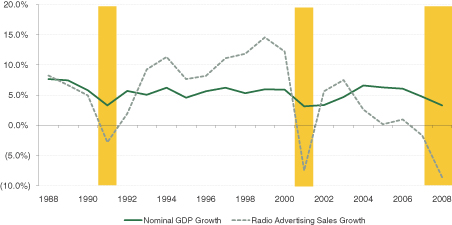
78
Table of Contents
Business
Source: RAB, Miller, Kaplan, Arase & Co., LLP and US Bureau of Economic Analysis. Recessionary periods (7/90—3/91, 3/01—11/01 and 12/07—Current) are shaded. A recession is defined as a significant decline in economic activity spread across the economy, lasting more than a few months, normally visible in real GDP, real income, employment, industrial production, and wholesale-retail sales (NBER).
Television broadcasting & advertising
According to the Television Bureau of Advertising’s April 2009 report, total broadcast television advertising revenue in 2008 was $46.4 billion. Network television is the largest segment within broadcast television representing revenue of $25.4 billion in 2008 while local revenue represented $16.5 billion and syndication $4.4 billion.
During the 2008-09 broadcast season, television was viewed in 114.5 million or 98.9% of all US households according to The Nielsen Company’s August 2008 report. Television remains the most popular form of media in terms of audience consumption with the average household (ie, all persons living in the house collectively) watching 8 hours and 18 minutes of television each day during the 2007-08 television season according to The Nielsen Company’s November 2008 report. This represents a 14% increase from 7 hours and 15 minutes average household viewing in 1998. There were 1,378 commercial full power television stations and 2,852 Class A and low power television stations serving viewers in the US as of December 31, 2008 according to the FCC.
Television’s broad reach and visual impact makes it a powerful and attractive medium for advertisers. Television spots are generally 30 to 60 seconds in length and are purchased by advertisers on a local, regional or national basis. Similar to the radio broadcasting industry, local and regional purchases allow an advertiser to choose a geographic market for the broadcast of commercial messages. Advertising purchased from a national television network allows an advertiser to target its commercial messages to a specific demographic within a large national audience.
On June 12, 2009, to the extent they had not already done so, full power broadcast television stations were required by law to terminate their analog broadcast operations and broadcast solely using digital transmissions. Like HD Digital RadioTM, digital television transmission uses spectrum allocations more efficiently providing television broadcasters with opportunities to program an HD channel and one or more standard definition (“SD”) channels compared to one SD analog channel. We believe this could lead to increased demand for content and services, such as traffic and digital networks, to program the additional channels.
OUR BUSINESSES
Metro
The Metro business provides local traffic, news, sports and weather information reports to approximately 2,200 radio and television stations that leverage its extensive information-gathering infrastructure. We believe that our information reports provide station customers with content that appeal to a broad range of demographics. As such, broadcasters across a variety of formats rely on our traffic and news reports, enabling us to serve multiple local stations within a market.
We gather traffic and other data using our information-gathering infrastructure, which includes aircraft (helicopters and airplanes), broadcast-quality remote camera systems positioned at strategically-located fixed positions and on aircraft, mobile units and wireless systems, and by accessing various government-based traffic tracking systems. Through our recent agreement with TrafficLand, we also have real-time
79
Table of Contents
Business
access to DOT traffic video from over 4,700 cameras in approximately 50 markets across the United States. In addition to the cameras we access through TrafficLand, we operate approximately 45 helicopters and fixed-wing aircraft, 9 mobile units, 18 airborne camera systems and 122 fixed-position proprietary cameras. In addition, we have 16 broadcast studios and approximately 880 broadcasters and producers. Our local and national news is usually gathered from third parties. The information is converted into broadcast copy by our staff of local writers and producers and is then read on the air by our and our affiliates’ announcers. Additionally, our news and traffic data is converted to online data so that participating stations can incorporate the reports and videos into their websites.
Our production staff works jointly with stations that carry our programming to ensure that the announcer and style of the information match the format of the station. Due to the customized nature of our information reports and the fact that we do not require network stations to identify us as the supplier of the information reports, each network affiliate may present the information reports we provide as if the network affiliate had generated such information report with its own resources. As a result, our on-air announcers often become integral station personalities, including, in many cases, performing services at our affiliate radio stations.
A typical radio advertisement in our Metro business consists of a 10 or 15 second commercial message read by our on-air announcer and presented as a segment of a regularly scheduled information report. By embedding commercials in our reports we believe audience attentiveness is increased with a lower likelihood of “tune out” or “channel flipping.”
Our Metro business sales force typically sells advertising locally, regionally and nationally in the form of 10 and 15 second spots which historically did not compete directly with longer-form radio station sales of 30 and 60 second spots, although in recent years some radio stations have begun selling short-form commercial units similar to ours.
Additionally, we provide traffic services to 170 television stations throughout the US by offering our station affiliates a combination of: live traffic video feeds from our aircraft; proprietary fixed-position cameras in selected markets; access to DOT cameras through TrafficLand; use of helicopters on an exclusive and non-exclusive basis; reporting personnel on an exclusive and non-exclusive basis and various television graphics programs (developed in-house and through third party licenses). Television affiliates are given a choice of which services they would like and our deals with them vary from affiliate to affiliate. In exchange for the content we provide them, television stations provide us with either television commercial airtime or cash, or a combination of both. The television commercial airtime is combined with commercial airtime that we represent on behalf of others and packaged into national ad units which we sell. We believe that our television product offers advertisers significant benefits because, unlike traditional television networks and stations, we often deliver reach across multiple stations in major markets.
Through our barter activities in the television arena, we have established morning, evening and late evening television advertising networks for our advertising clients’ commercials to air. Because we have affiliated a large number of network television stations in major markets, our morning, evening and later evening advertising networks deliver significant national household ratings in the local news and late night entertainment environment. According to Nielsen Media Research Company (“Nielsen”) data for the 2008 fourth quarter, in early morning news (5-9 am), our Metro advertisements reach approximately 2.8 million households; in evening news (4-7 pm) our Metro advertisements reach approximately 6.0 million households and in late news (10 pm-midnight) our Metro advertisements reach approximately 4.8 million households. These household figures are similar to the number of households reached by early morning news shows, evening news broadcasts and late evening news programming. We package
80
Table of Contents
Business
our television commercial airtime primarily on a national basis. We have created separate sales forces that exclusively focus on selling our television commercial airtime and our digital inventory.
The Metro business compensates certain radio stations in major markets for carrying specific programming, in order to ensure that our news and information has the desired national coverage, or to maintain a minimum commercial inventory level.
Network
Our Network business is a leading provider of news, sports, talk, entertainment programming, and special events, and is among the four largest radio networks in the United States in terms of market share, along with Citadel Media (formerly ABC Radio Networks), Dial Global and Premiere Radio Networks, which is owned by Clear Channel Communications.
We produce or have certain exclusive radio distribution rights on many name-brand news, sports and entertainment programs, including:
| Ø | News—Charles Osgood, CBS Radio News, CNN Radio News, NBC News Radio and Dow Jones radio properties; |
| Ø | Sports—NFL games (including the Super Bowl), NCAA football and basketball games (including March Madness) and the 2010 Winter Olympic Games; |
| Ø | Talk—Dennis Miller and Fred Thompson; |
| Ø | Entertainment—Billy Bush, CMT Live with Cody Alan, MTV Radio Network, BET Radio Network, Rachael Ray, Dr. Phil, David Letterman, Jay Leno and Conan O’Brien; and |
| Ø | Special Events—Grammy Awards, Academy of Country Music (ACM) Awards, MTV Music Awards and live concerts. |
We deliver a wide variety of programs as described above. Of our current programs, we produce 100% of our sports programs; approximately 60% of our talk programs; and approximately 50% of our news, music and entertainment programs. Of the programs identified above, we produce Charles Osgood and NBC News Radio (news), all of the sports and talk programs, the entertainment programs, except MTV Radio Network, Rachael Ray and Dr. Phil, and only the radio remotes and special features we create surrounding the special events identified above (not the actual events). The remaining programs are distributed by us to our radio affiliates. Of the individuals named above, only Charles Osgood, Dennis Miller, Fred Thompson and Billy Bush are engaged by us directly as independent contractors. The remaining individuals are engaged by third parties.
We believe our strong slate of news and sports programs, along with our roster of radio personalities, delivers consistent listenership to stations and creates value for our embedded commercial inventory. In some cases, our Network business compensates certain stations in major markets for carrying specific programming. This is done to ensure that our programming has the desired national coverage, or to maintain a minimum commercial inventory level.
Our production includes the repurposing of programming excerpts provided to us for distribution on the radio as short-form programming, such as David Letterman, Jay Leno and Conan O’Brien whose radio programs are excerpted from their television programs and distributed by us as 60-90 second vignettes, and as long-form programming, such as sporting events and talk shows that generally are non-scripted, as well as hosted radio shows of a minimum of 30 minutes in duration.
81
Table of Contents
Business
As part of our arrangements with the NFL, CBS (for NCAA) and NBC (for the Olympics), we receive broadcasting space and access to engineering transmission lines and at the event itself, press credentials (to provide us with close-up access to sporting events) and certain visual and audio feeds to help us and our talent (eg, sideline reporters, play-by-play commentators) create and develop the sports programming broadcast on the radio by our affiliates. Our personnel set up sound equipment on site, transmit audio voiced by our hosts and talent to our broadcast studios for editing, mixing and sound production and then distribute this programming to our affiliates nationwide. The process is similar for our talent whom we directly employ such as Charles Osgood, Dennis Miller, Fred Thompson and Billy Bush, who either conduct their talk shows from one of our studios or from a remote studio set up by our personnel.
News programming is generally provided to us by our programming partners fully-produced (eg newscasts from CBS, NBC and CNN), which we then immediately distribute to our affiliates for broadcast on the radio. In certain instances, we produce news programming, as with NBC News Radio, America in the Morning and The Osgood File. In the case of NBC News, NBC typically provides the talent for the radio newscasts, while we draft the scripts, edit and select sound inserts, record the talent, put together the newscast for distribution or distribute it live to our affiliates for broadcast on the radio. Our news and entertainment programs are produced at our in-house production facilities, while recordings of live concert performances and sports events are produced on location.
As described above, we control most aspects of the production of our programs, including the creative development, and accordingly, are able to refine the programs’ content to respond to the needs of our listeners, station customers and national advertisers. We determine the content and style of a program based on the target audience we wish to reach.
As part of our agreement for live concerts and special events, we often retain a copy of the recording of the concert, sporting event, special event and interviews for use in our radio programs and as additions to our extensive audio library, which we believe is a valuable resource for use in future programming. The library contains previously broadcast programs, thousands of live concert performances, over 19,000 artist interviews, daily news programs, Capitol Hill hearings and other special events.
We typically package our Network business radio commercial airtime on a national network basis, covering stations in relevant markets, either locally, regionally or nationally. This packaged airtime typically appeals to advertisers seeking a broad demographic reach. Because we generally sell our commercial airtime on a national network basis rather than station-by-station, we generally do not compete for advertising dollars with individual local radio stations. We believe that this is a key factor in maintaining our network relationships.
ADVERTISING SALES AND MARKETING
Our advertising sales force is comprised of approximately 130 sales representatives and sales managers. We maintain sales offices in all of our operations centers, which are located in several markets throughout the country. Each sales office is able to sell available commercial airtime in any and all of our markets. As an example, an airline advertiser can purchase sponsorship advertising packages in multiple markets from our local sales representative in the city in which the airline is headquartered. We also combine our commercial airtime into multiple “sponsorship” packages which we sell as an information sponsorship package to advertisers throughout our networks on a local, regional or national basis, primarily during morning and afternoon drive periods.
82
Table of Contents
Business
TURNAROUND STRATEGIES AND REVENUE ENHANCEMENT INITIATIVES
Since September 2008, we have implemented a significant number of key turnaround strategies and revenue enhancement initiatives, including:
| Ø | Re-Engineering of Traffic Operations |
| Ø | Regionalization. We have regionalized 60 operating centers to 13 hubs, allowing us to regionalize data gathering, improve the quality and consistency of our products and leverage talent in larger offices. |
| Ø | Reduction of reliance on aircraft. We have reduced our reliance on aircraft by using video and speed and flow technology and working with strategic partners. |
| Ø | Cost Reduction Programs |
| Ø | Reduction of salary/headcount. We have been actively reducing headcount, salaries and redundant overhead. In addition to headcount reductions and company-wide salary reductions announced in April 2009, on September 29, 2009, we announced compensation reduction and furlough actions (aggregating 10 days of pay per each participating full-time employee), which actions shall result in additional cost savings in 2009. |
| Ø | Reduction of programming costs. We have been reviewing the profitability of our program portfolio in order to reduce production and other costs associated with these programs while optimizing affiliate station coverage. These efforts include the elimination of unprofitable programs. |
| Ø | Reduction of affiliate compensation. We are in the process of negotiating reductions in the compensation we pay to radio stations that carry certain of our programs. |
| Ø | Revenue Initiatives |
| Ø | Investment in sales force. We have been selectively building out our sales force to expand our market presence across regions and products, particularly in the radio, television and digital areas of our Metro business. |
| Ø | Renewed focus on sales and inventory management. We are focused on implementing technology and data reporting that allow us to increasingly optimize our advertising including utilization and pricing. |
| Ø | Expansion of product offerings. We have developed and are providing product offerings, such as copy splitting, 15 second spots and pre-recorded advertisements. |
| Ø | Addition of new programming. We have added and will continue to add new programming such as The Fred Thompson Show and programming pursuant to recent deals with The Weather Channel and Sports USA. |
| Ø | Management Reorganization |
| Ø | We have engaged a new, experienced management team to provide greater leadership. |
| Ø | We have reorganized our corporate structure to increase accountability for each of our Network and Metro businesses. |
RESTRUCTURING
On April 23, 2009, we completed a refinancing of substantially all of our outstanding long-term indebtedness (approximately $241 million in principal amount) and a recapitalization of our equity (the “Restructuring”).
83
Table of Contents
Business
As part of the Restructuring, our then existing debtholders released all of their respective existing obligations in exchange for (1) $117.5 million of Senior Notes, (2) 34,962 shares of Series B Preferred Stock, and (3) a one-time cash payment of $25 million. We also entered into the Senior Credit Facility, pursuant to which we have a $15.0 million revolving line of credit and a $20.0 million unsecured non-amortizing term loan. As of the date of this prospectus, we have borrowed the entire amount under the term loan and $5.0 million under the revolving line of credit.
In addition, as part of the Restructuring, Gores (1) agreed to purchase, at a discount, approximately $22.6 million principal amount of our then existing debt held by debt holders who did not wish to participate in the Senior Notes, (2) agreed to guarantee the Senior Credit Facility payments due to the NFL in an amount of up to $10 million for the license and broadcast rights to certain NFL games and NFL-related programming and (3) invested $25.0 million in the Company for 25,000 shares of Series B Preferred Stock. In connection with Gores providing the aforementioned guarantees and purchasing the debt from non-participating holders, the 75,000 shares of Series A Preferred Stock held by Gores immediately prior to the Restructuring, which then had a liquidation preference of approximately $79.0 million, were exchanged for 75,000 shares of Series A-1 Preferred Stock with a per share conversion price which provided Gores with an approximately 54.6% interest in the Company after the Restructuring.
Taking into account Gores’ Series B Preferred Stock, Series A-1 Preferred Stock and common stock, upon the consummation of the Restructuring, Gores’ ownership in the Company increased from approximately 36% to 75.1%. Accordingly, the Restructuring, when considering the ownership held by Gores as well as the ownership held by our then existing debt holders, constituted a change of control transaction that requires the Company to follow the purchase method of accounting, as described by SFAS 141R. We have considered the ownership held by Gores and our then existing debt holders as a collaborative group in accordance with Emerging Issues Task Force D-97, “Push Down Accounting”. As a result, we have followed the acquisition method of accounting, as described by SFAS 141R, “Business Combinations” and applied the SEC rules and guidance regarding “push down” accounting treatment effective April 23, 2009.
RECENT EVENTS
On October 14, 2009, we entered into separate agreements with the holders of our Senior Notes and Wells Fargo Foothill to amend the terms of our Securities Purchase Agreement (governing the Senior Notes) and Senior Credit Facility, respectively, to waive compliance with our debt leverage covenants which were to be measured on December 31, 2009 on a trailing four-quarter basis. As part of the Securities Purchase Agreement amendment, we have agreed to pay down our Senior Notes by using the gross proceeds of the offering and additional cash on hand, if necessary by: (i) $15.0 million if the gross proceeds of the offering are less than $40.0 million and (ii) $20.0 million (or more at our sole discretion) if the gross proceeds of the offering are equal to or greater than $40.0 million. If neither an offering of capital stock nor the proposed sale-leaseback of our Culver City properties occurs on or prior to March 31, 2010, we have agreed to pay down $3.5 million of our Senior Notes. Any such prepayments would be deemed optional prepayments under the Securities Purchase Agreement and made within 5 business days of the date the offering is consummated (in the case of clauses (i) or (ii) above) or April 7, 2010 in the event no offering or sale-leaseback was consummated.
The amendments also included consents by holders of the Senior Notes and Wells Fargo Foothill regarding the Culver City sale-leaseback described in the section entitled “Business—Properties” below and in the case of the amendment to the Senior Credit Facility, an increase in the letters of credit sub-limit from $1.5 to 2.0 million.
On August 3, 2009, we held a special meeting of our stockholders to consider and vote upon the Charter Amendments. The stockholders approved the Charter Amendments, which resulted in the automatic
84
Table of Contents
Business
conversion of all shares of preferred stock into common stock and the cancellation of warrants to purchase 10 million shares of common stock issued to Gores as part of their investment in our Series A Preferred Stock. There are no longer any issued and outstanding warrants to purchase our common stock or any shares of our capital stock that have any preference over the common stock with respect to voting, liquidation, dividends or otherwise. Under the Charter Amendments, each of the newly authorized shares of common stock has the same rights and privileges as previously authorized common stock. Adoption of the Charter Amendments did not affect the rights of the holders of our currently outstanding common stock nor did it change the par value of the common stock.
On July 9, 2009, Gores converted 3,500 shares of Series A-1 Convertible Preferred Stock into 103,512,913 shares of common stock (without taking into account the reverse stock split). Pursuant to the terms of our Certificate of Incorporation, the 291,722 outstanding shares of our Class B common stock were automatically converted into 291,722 shares of common stock (without taking into account the reverse stock split) because as a result of such conversion by Gores because the voting power of the Class B common stock, as a group, fell below ten percent (10%) of the aggregate voting power of issued and outstanding shares of common stock and Class B common stock.
In connection with the Restructuring and the issuance of the Preferred Stock, we determined that the Preferred Stock contained a BCF of approximately $76.9 million, that was partially contingent as described below. BCFs are recognized by allocating to shareholders’ equity that portion of the net proceeds from the sale of a convertible security equal to the intrinsic value of the BCF. Intrinsic value is calculated as the spread, as of the date we agreed to issue our Preferred Stock (the “commitment date”), between the conversion price of our Preferred Stock and the fair value of our common stock multiplied by the number of shares of common stock into which the Preferred Stock is convertible. In our case, because only a portion of the common shares into which the Preferred Stock was convertible were authorized on the commitment date, a portion of the BCF was not immediately recognized because it was contingent on our stockholders approving an increase in the authorized shares. The portion of the BCF attributable to already authorized shares (approximately $10.9 million) was recognized at issuance on April 23, 2009 (issuance BCF) while the majority of the BCF (approximately $66.0 million) was contingent (contingent BCF) upon the authorization of 3,769,344,490 additional common shares. Because such shares were authorized on August 3, 2009, the contingent BCF was recognized on such date in the third quarter and, due to the immediate conversion of the Preferred Stock into common stock on such date, resulted in a deemed dividend that will be included in our earnings per share.
THE GORES GROUP
The Gores Group owns approximately 75.1% of our common stock. Founded in 1987, Gores is a private equity firm focused on investing in businesses which can benefit from the firm’s operating and turnaround expertise. The firm’s current private equity fund has committed equity capital of $1.3 billion.
CBS
From 1994 to 2008, we were managed by CBS Radio Inc. (“CBS Radio”; previously known as Infinity Broadcasting Corporation), a wholly owned subsidiary of CBS Corporation, pursuant to a management agreement between CBS Radio and us. On October 2, 2007, we entered into a definitive agreement with CBS Radio documenting a long-term arrangement through March 31, 2017, which became effective as of March 3, 2008 following approval by our stockholders. As part of the new arrangement, CBS Radio no longer manages us and has agreed to broadcast our commercial inventory for both the Network and Metro businesses through March 31, 2017 in exchange for certain programming and/or cash compensation.
85
Table of Contents
Business
As part of the new arrangement with CBS, we entered into station agreements that document and extend through March 31, 2017 our distribution of network news, local traffic and news programming to CBS Radio stations and extend our rights to, and levels of, commercial inventory for CBS Radio stations. Our compensation of the CBS Radio stations under these agreements adjusts up or down for changes in audience levels as opposed to our previous affiliation agreements under which we paid fixed compensation regardless of fluctuations in audience levels. Our compensation of CBS Radio stations also adjusts up or down for commercial clearance and, in particular, station compensation is subject to pro rata downward adjustment for declining percentages of commercial clearance and we pay no compensation if a station broadcasts 75% or less of our commercial inventory. Additionally, if a particular station fails to achieve commercial clearance of at least 75%, we can exercise our termination right with respect to that station’s affiliation agreement and collect liquidated damages. In addition to certain customary termination rights, the CBS Master Agreement and all other ancillary agreements, other than the mutual release, terminate in the event that 15% or more of the station agreements measured by revenue or number are terminated.
The agreements with the CBS Radio stations also provide protections for us in the event that CBS Radio sells its stations to a third-party. In particular, for the first 35 stations sold by CBS Radio, CBS Radio is required to assign the applicable station agreements to the buyer and if the buyer does not assume such contracts, we may terminate the agreements and CBS is required to reallocate the commercial inventory among its remaining stations for the term of the agreements.
We also entered into an arrangement that provides that our subsidiary Metro Networks Communications, Inc. will be the exclusive source, subject to certain limited exceptions, of traffic information on CBS Radio stations’ analog and HD1 signals.
Further, among other things, the CBS Master Agreement also sets forth the terms and conditions relating to CBS Radio’s ability to sell ten second sponsorships adjacent to traffic reports through March 31, 2010, extended our right of first refusal to syndicate certain CBS Radio programming through March 31, 2017, cancelled all of the then-existing warrants and related registration rights held by CBS, provided for maximum annual bonus of $4.0 million payable to CBS Radio for commercial clearance of 95% or higher and no annual bonus if clearance was below 90%, provided for a $2.0 million payment from CBS Radio if commercial clearance in 2008 for CBS’ top ten markets was less than 93.75% and provides us with the limited ability to defer up to $4.0 million in payments to CBS Radio on two occasions through March 2010. The $2.0 million payment was not paid by CBS Radio, as clearance exceeded targets, and to date, we have made one deferral of $4.0 million in payments.
Certain other existing agreements between CBS Radio and us, including the News Programming Agreement, the Technical Services Agreement and the Trademark License Agreement were also amended and restated through March 31, 2017.
COMPETITION
In the markets in which we operate, we compete for advertising revenue with other forms of communications media, including print, radio, television, cable, outdoor and out-of-home, direct response, yellow page directories, Internet/new media and point-of-sale.
In our traffic and local radio information service business we believe that we are larger than Clear Channel Communications, whom we believe to be the next largest provider of traffic and local radio information services to radio stations in the United States. Based on Clear Channel’s list of affiliates, that is publicly available and by subscription services in the radio industry, we believe Clear Channel’s Total Traffic provides traffic to approximately 950 radio stations, most of which are radio stations it owns.
86
Table of Contents
Business
After Clear Channel, we believe Traffic.com (purchased in 2007 by NAVTEQ, which is now owned by Nokia Communications) is our next largest traffic and local radio information service competitor based on information generally available to the industry. However, we believe neither Traffic.com nor Clear Channel approaches our national reach of 2,189 stations and the number of affiliates we serve in top markets (including 396 in the top 10 DMAs (designated geographic areas defined by Nielsen Media Research Company) and 747 in the top 25 DMAs).
In our Network business, Clear Channel’s Premiere Radio Networks division and Citadel Media (formerly ABC Radio Networks) represent our main competitors in the network radio business, which also includes networks such as American Radio Urban Network, Crystal Media Networks, Dial Global and United Stations Radio Network. Based on the six most recent RADAR reports (released on such dates indicated below), the share of gross impressions (listeners) for Westwood One, Premiere and Citadel Media was as follows:
| RADAR book | Westwood One | Premiere | Citadel | |||
| 101 (June 2009) |
23.3 | 25.8 | 25.0 | |||
| 100 (March 2009) |
23.6 | 25.4 | 25.3 | |||
| 99 (December 2008) |
24.1 | 23.1 | 26.1 | |||
| 98 (September 2008) |
25.4 | 24.4 | 27.7 | |||
| 97 (June 2008) |
25.1 | 24.8 | 28.3 | |||
| 96 (March 2008) |
24.5 | 25.6 | 28.0 |
Based on the information known to us, we believe the significant majority of our decline in audience is due to the introduction of PPM™ which has affected the industry as a whole, however, some of our audience decline has been impacted by a change in affiliates. In addition to the foregoing, there are several multi-market businesses providing local radio and television programming services in various markets. With the recent introduction of both HD Digital Radio™ and digital television, we believe demand for high quality national and local programming may increase.
We believe that the quality of our programming and the strength of our affiliate relations and advertising sales forces enable us to compete effectively with other forms of communications media. Our programs are distributed to radio stations and other station affiliates that we believe will have the largest and most desirable listening audience for each of our programs. We believe that in comparison with any other independent radio syndication producer and distributor or radio network, we have a more diversified selection of programming from which national advertisers and radio stations may choose. Since we both produce and distribute our programs, we are able to more effectively respond to the demands of advertisers and radio stations.
The increase in the number of program formats has led to increased competition among local radio stations for audience. As stations attempt to differentiate themselves in an increasingly competitive environment, demand for quality programming may increase, including from outside programming sources. This demand has been intensified by high operating and production costs at local radio stations and increased competition for local advertising revenue. While we compete with radio stations for advertising revenue, we do not compete with such stations directly as our advertising inventory is sold on a network basis and placed within the framework of our programming.
TRADEMARKS
We have approximately 40 trademarks, of which only two, the Westwood One and Metro Networks names, are considered material to our business. Such trademarks have been registered since 1982 and 1994, respectively, and we make maintenance filings with respect to each such trademark every 10 years.
87
Table of Contents
Business
FCC REGULATION
Certain of our program origination and distribution activities involve the use of FCC-licensed radio frequencies. We are required to apply for, maintain and renew such licenses in accordance with the Communications Act of 1934, as amended, and the FCC’s rules, and to operate our FCC-licensed facilities in accordance with that Act and those rules.
EMPLOYEES
On September 30, 2009, we had approximately 1,526 employees, including 491 part-time employees. In addition, we maintain continuing relationships with numerous independent writers, program hosts, technical personnel and producers. Approximately 517 of our employees are covered by collective bargaining agreements. We believe relations with our employees, unions and independent contractors are satisfactory.
PROPERTIES
Our headquarters are located at 40 West 57th Street, 5th Floor, New York, New York 10019. We own three buildings in Culver City, California: (1) an approximately 15,000 square-foot building, which contains administrative, sales and marketing; (2) an approximately 10,000 square-foot building, which contains our two traffic and news reporting divisions, Metro Networks and Shadow Broadcast Services; and (3) an approximately 8,000 square-foot building, which contains our production facilities. We currently anticipate that we will enter into a ten-year sale-leaseback of the Culver City properties, however, no assurance can be given that such sale-leaseback will be consummated. In addition, we lease operation centers/broadcast studios and marketing and administrative offices, including our headquarters, across the United States consisting of over 290,000 square feet in the aggregate, pursuant to the terms of various lease agreements.
We believe that our facilities are adequate for our current level of operations.
LEGAL PROCEEDINGS
On September 12, 2006, Mark Randall, derivatively on behalf of Westwood One, Inc., filed suit in the Supreme Court of the State of New York, County of New York, against us and certain of our current and former directors and certain former executive officers. The complaint alleges breach of fiduciary duties and unjust enrichment in connection with the granting of certain options to our former directors and executives. Plaintiff seeks judgment against the individual defendants in favor of us for an unstated amount of damages, disgorgement of the options which are the subject of the suit (and any proceeds from the exercise of those options and subsequent sale of the underlying stock) and equitable relief. Subsequently, on December 15, 2006, Plaintiff filed an amended complaint which asserts claims against certain of our former directors and executives who were not named in the initial complaint filed in September 2006 and dismisses claims against other former directors and executives named in the initial complaint. On March 2, 2007, we filed a motion to dismiss the suit. On April 23, 2007, Plaintiff filed its response to our motion to dismiss. On May 14, 2007, we filed our reply in furtherance of its motion to dismiss Plaintiff’s amended complaint. On August 3, 2007, the Court granted such motion to dismiss and denied Plaintiff’s request for leave to replead and file a further amended complaint. On September 20, 2007, Plaintiff appealed the Court’s dismissal of its complaint and moved for “renewal” under CPLR 2221(e). Oral argument on Plaintiff’s motion for renewal occurred on October 31, 2007. On April 22, 2008, Plaintiff withdrew its motion for renewal, without prejudice to renew.
88
Table of Contents
Our current executive officers and directors are as follows:
| Name | Age | Position | ||
| Norman J. Pattiz |
66 | Chairman of the Board of Directors | ||
| Roderick M. Sherwood, III |
56 | President, Chief Financial Officer and Principal Accounting Officer | ||
| David Hillman |
40 | Chief Administrative Officer; Executive Vice President, General Counsel and Secretary | ||
| Steven R. Kalin |
45 | President, Metro Networks division, and Chief Operating Officer | ||
| Gary Schonfeld |
57 | President, Network division | ||
| Jonathan S. Marshall |
46 | Executive Vice President, Business Affairs and Strategic Development | ||
| Andrew P. Bronstein |
51 | Director | ||
| Jonathan I. Gimbel |
30 | Director | ||
| Scott M. Honour |
43 | Director | ||
| H. Melvin Ming |
65 | Director | ||
| Michael Nold |
38 | Director | ||
| Emanuel Nunez |
51 | Director | ||
| Mark Stone |
45 | Director | ||
| Ian Weingarten |
37 | Director | ||
| Ronald W. Wuensch |
67 | Director |
OFFICER AND DIRECTOR BIOGRAPHIES
Norman J. Pattiz founded Westwood One in 1976 and has held the position of Chairman of the Board of Directors since that time. He was also our Chief Executive Officer until February 3, 1994. From May 2000 to March 2006, Mr. Pattiz served on the Broadcasting Board of Governors (BBG) of the United States of America, which oversees all US non–military international broadcast services. As chairman of the Middle East Committee, Mr. Pattiz was the driving force behind the creation of Radio Sawa, the BBG’s 24/7 music, news and information radio network, and Alhurra Television, the US sponsored, Arabic–language satellite TV channel to the entire Middle East. Mr. Pattiz has served as a Regent of the University of California since September 2001, and chairs the Regents’ Oversight Committee of the Department of Energy Laboratories, including Los Alamos, Lawrence Livermore and Lawrence Berkeley. He is a past president of the Broadcast Education Association, and a member of the Council on Foreign Relations and the Pacific Council on International Policy. He is Director of the Office of Foreign Relations of the Los Angeles Sheriff’s Department, and serves on the Region 1, Homeland Security Advisory Council. In November 2009, Mr. Pattiz will be inducted into the National Radio Hall of Fame in recognition of his significant off air contributions to the radio industry.
Roderick M. Sherwood, III was appointed President of Westwood One effective October 20, 2008 and Executive Vice President, Chief Financial Officer, and Principal Accounting Officer of Westwood One effective September 17, 2008. Mr. Sherwood served as Chief Financial Officer, Operations of The Gores Group, LLC from November 2005 to September 5, 2008, where he was responsible for leading the financial oversight of all Gores portfolio companies. From October 2002 to September 2005, Mr. Sherwood served as Senior Vice President and Chief Financial Officer of Gateway, Inc., where he was primarily responsible for overseeing financial performance and operational improvements and
89
Table of Contents
Management
exercising corporate financial control, planning, and analysis. During his tenure at Gateway, he also oversaw Gateway’s acquisition of eMachines. From August 2000 to September 2002, Mr. Sherwood served as Executive Vice President and Chief Financial Officer of Opsware, Inc. (formerly Loudcloud, Inc.), an enterprise software company. Prior to Opsware, Mr. Sherwood also served in a number of operational and financial positions at Hughes Electronics Corporation, including President and General Manager of Spaceway (broadband services), Executive Vice President of DIRECTV International and Chief Financial Officer of Hughes Telecommunications & Space Company. He also served in a number of positions during 14 years at Chrysler Corporation, including Assistant Treasurer and Director of Corporate Financial Analysis.
David Hillman serves as our Chief Administrative Officer; Executive Vice President, Business Affairs and General Counsel. Mr. Hillman joined Westwood One in June 2000 as Vice President, Labor Relations and Associate General Counsel, which positions he held through September 2004, and thereafter became Senior Vice President, General Counsel in October 2004. He became an Executive Vice President in February 2006 and Chief Administrative Officer on July 10, 2007. Mr. Hillman has a B.A. from Dartmouth College and a J.D. from Fordham University School of Law.
Steven R. Kalin was appointed our Chief Operating Officer effective July 7, 2008 and President of the Metro Networks division on October 20, 2008. Mr. Kalin has 20 years of media experience, encompassing both traditional and digital platforms and strategic, business development and operational roles. From 2002 to 2007, Mr. Kalin served as Executive Vice President and Chief Operating Officer of Rodale, Inc., a global publisher of health and wellness information. From September 2000 to January 2002, Mr. Kalin was COO and then CEO of Astata, a business to business wireless software company. From September 1998 to June 2000, Mr. Kalin served as Chief Financial Officer and Chief Operating Officer of Medscape, a leading online website for physicians. From October 1995 to August 1998, Mr. Kalin was Vice President of Business Development for ESPN Internet Ventures and with ESPN Enterprises. At the start of his career, Mr. Kalin was a consultant with McKinsey & Company in the firm’s media practice. Mr. Kalin holds a B.A. from Brown University and an M.B.A. from Harvard Business School.
Gary Schonfeld serves as our President, Network division, a position he has held since October 2008. Mr. Schonfeld co-founded radio network MediaAmerica in 1987 and served as President. He became President of Jones MediaAmerica upon the acquisition of MediaAmerica by Jones Media Group in July 1998. He served in that position until the acquisition of Jones Media Group by Triton Radio Network in June 2008. Prior to founding MediaAmerica, Mr. Schonfeld served as Vice-President Eastern Sales Region for Westwood One, an account executive with CBS Radio Networks and in various positions with Fairchild Publications, Y&R Advertising, and ABC Radio. Mr. Schonfeld has a B.A. from the University of Vermont and an M.A. from the University of Michigan.
Jonathan S. Marshall serves as our EVP/Business Affairs and Strategic Development, a position he has held since April 2008. Mr. Marshall has experience in both deal making and the broadcast traffic business. From 2005 through 2008, Mr. Marshall was a sole practitioner at JS Marshall & Assoc., an entertainment finance law firm based in Los Angeles. Previous to that he served as COO/General Counsel to RKO Pictures, LLC in Los Angeles from 2001 through 2005 and General Counsel to The Shooting Gallery, Inc. from 1997 through 2001. Mr. Marshall was an associate at Loeb and Loeb, LLP from 1995 through 1997 and at Shearman & Sterling from 1988 through 1995. Mr. Marshall obtained his J.D. from Tulane Law School in 1988 and his undergraduate degree in 1985 from Tulane University. Mr. Marshall has been a member of the California Bar since 1988.
90
Table of Contents
Management
Andrew P. Bronstein has been a member of our board of directors since April 23, 2009. Mr. Bronstein is currently a Managing Director of Glendon Partners, the operations affiliate of The Gores Group, LLC, which is the investment manager of Gores Capital Partners L.P., Gores Capital Partners II, L.P. and their related investment entities, and the managing member of Gores Radio Holdings, LLC. Mr. Bronstein is responsible for portfolio company financial oversight and controls and financial due diligence activities for Gores. Before joining Glendon Partners in 2008, Mr. Bronstein was President of APB Consulting LLC, a consulting firm that solved complex financial and accounting issues and led acquisition due diligence for public and private companies. From 1992 to 2006, Mr. Bronstein was Corporate Controller and Principal accounting Officer (and Vice President commencing in 1994) of SunGard Data Systems Inc., a Fortune 500 software and services company. Before 1992, Mr. Bronstein worked for Coopers & Lybrand, a predecessor of PricewaterhouseCoopers, as a senior manager and director of its high technology practice in Philadelphia, PA. Mr. Bronstein graduated with distinction from Northeastern University with a B.S. in Accounting and a concentration in Finance. He is a CPA.
Jonathan I. Gimbel has been a member of our board of directors since April 23, 2009. Mr. Gimbel is currently a Vice President of The Gores Group, LLC, which is the investment manager of Gores Capital Partners L.P., Gores Capital Partners II, L.P. and their related investment entities, and the managing member of Gores Radio Holdings, LLC. Mr. Gimbel is responsible for the negotiation and execution of certain Gores acquisitions, divestitures and financing activities in addition to originating new investment opportunities. Prior to joining Gores in 2003, Mr. Gimbel was an analyst at Credit Suisse First Boston, where he focused primarily on mergers and acquisitions and leveraged finance transactions in the Media and Telecommunications group. Mr. Gimbel graduated with honors from the University of Texas with a Bachelor of Business Administration in Finance and Accounting and holds an M.B.A. from the Harvard Business School.
Scott M. Honour has been a member of our board of directors since June 19, 2008. Mr. Honour joined Gores in 2002 and is currently Senior Managing Director of The Gores Group, LLC, which is the investment manager of Gores Capital Partners L.P., Gores Capital Partners II, L.P. and their related investment entities, and the managing member of Gores Radio Holdings, LLC. From 2001 to 2002, Mr. Honour served as a Managing Director at UBS Warburg and was an investment banker at Donaldson, Lufkin & Jenrette from 1991 to 2002. Mr. Honour earned his B.S. in Business Administration and B.A. in Economics, cum laude, from Pepperdine University, and his M.B.A. from the Wharton School of the University of Pennsylvania with an emphasis in finance and marketing. Mr. Honour is also a director of various Gores portfolio companies.
H. Melvin Ming has been a member of our board of directors since July 7, 2006. Since October 2002, Mr. Ming has been the Chief Operating Officer of Sesame Workshop, the producers of Sesame Street and other children’s educational media. Mr. Ming joined Sesame Workshop in 1999 as the Chief Financial Officer. Prior to joining Sesame Workshop, Mr. Ming was the Chief Financial Officer of the Museum of Television and Radio in New York from 1997 to 1999; Chief Operating Officer at WQED in Pittsburgh from 1994—1996; and Chief Financial Officer and Chief Administrative Officer at Thirteen/WNET New York from 1984 to 1994. Mr. Ming is a CPA and graduated from Temple University in Philadelphia, PA.
Michael Nold has been a member of our board of directors since April 23, 2009. Mr. Nold is currently a Managing Director of Glendon Partners, the operations affiliate of The Gores Group, LLC, which is the investment manager of Gores Capital Partners L.P., Gores Capital Partners II, L.P. and their related investment entities, and the managing member of Gores Radio Holdings, LLC. Mr. Nold is responsible for oversight of select Gores portfolio companies and operational due diligence efforts. Before joining Glendon Partners in 2008, Mr. Nold was Vice President Strategy & Corporate Development at Hewlett-Packard, where he worked from 2004-2008. At HP, Mr. Nold focused on the global Services and
91
Table of Contents
Management
Technology Solutions divisions and also co-led Hewlett-Packard’s Corporate Strategy group, responsible for prioritizing and driving key transformational initiatives across Hewlett-Packard. Previously, Mr. Nold held leadership positions, in strategy and marketing, at United Technologies and Avanex Corporation from 2001 to 2004. Prior to that, Mr. Nold served as a management consultant with Bain & Company. Mr. Nold earned a B.S.E. in Industrial & Operations Engineering from the University of Michigan and an M.B.A. in Finance and Marketing from The Wharton School.
Emanuel Nunez has been a member of our board of directors since June 19, 2008. Mr. Nunez is currently an agent in the Motion Picture department of Creative Artists Agency (CAA), a talent and literary agency based in Los Angeles, where he is involved in the representation of actors, directors, production companies and film financiers with respect to transactions ranging from traditional talent employment and production arrangements, to the territorial sales of motion picture distribution rights worldwide, as well as the structuring of many international co-productions. Prior to joining CAA in 1991, Mr. Nunez was at International Creative Management (ICM) and was an attorney for an entertainment law firm in Los Angeles. In 2006, Nunez was named a Commissioner for the Latin Media & Entertainment Commission, an organization that advises the Mayor of New York City on strategic business development of the Latin Media and Entertainment Industry. Mr. Nunez holds a J.D. from the Pepperdine University School of Law and a B.S. from Rutgers University.
Mark Stone has been a member of our board of directors since June 19, 2008. Mr. Stone is currently President, Gores Operations Group, and Senior Managing Director of The Gores Group, LLC, which is the investment manager of Gores Capital Partners L.P., Gores Capital Partners II, L.P. and their related investment entities, and the managing member of Gores Radio Holdings, LLC. Mr. Stone has responsibility for Gores’ worldwide operations group, oversight of all Gores portfolio companies and operational due diligence efforts. Mr. Stone joined Gores in 2005 from Sentient Jet, a provider of private jet membership, where he served as CEO from 2002 to 2004. Prior to Sentient Jet, from 1998 to 2002, Mr. Stone served as CEO of Narus, a global telecommunication software company and from 1997 to 1998, as CEO of Sentex Systems, an international security and access control manufacturing company. Mr. Stone holds an M.B.A. in Finance and Multinational Management from The Wharton School and a B.S. in Finance with Computer Science and Mathematics concentrations from the University of Maine. Mr. Stone is also a director of various Gores portfolio companies.
Ian Weingarten has been a member of our board of directors since June 19, 2008. Mr. Weingarten is currently a Managing Director of The Gores Group, LLC, which is the investment manager of Gores Capital Partners L.P., Gores Capital Partners II, L.P. and their related investment entities, and the managing member of Gores Radio Holdings, LLC. Prior to joining The Gores Group in 2002, Mr. Weingarten was a director at UBS Investment Bank. Prior thereto, Mr. Weingarten was an investment professional at Apollo Management, L.P. as well as a private investment firm investing capital for two high net worth families. Mr. Weingarten was previously a member of the mergers & acquisitions group within the investment banking division at Goldman Sachs & Co. Mr. Weingarten graduated summa cum laude from The Wharton School of the University of Pennsylvania, with a B.S. in Economics and a dual concentration in Finance and Entrepreneurial Management. Mr. Weingarten is also a director of various Gores portfolio companies and is a member of the Board of Governors at Cedars-Sinai Medical Center.
Ronald W. Wuensch has been a member of our board of directors since July 6, 2009. In 1992, Mr. Wuensch founded Wuensch Consulting (WC), which specializes in providing private consulting services to boards of directors and chief executive officers regarding specific issues on economic value and business design. From 1988 to 1992, Mr. Wuensch served as Group Executive for a $50 billion
92
Table of Contents
Management
financial services holding company and prior thereto was Senior Vice President for a multi-bank holding company, President of a bank holding company, and a consulting partner with Arthur Young and with KPMG. In addition, Mr. Wuensch has extensive experience as a board member of several public and private companies. He is currently an Executive Professor at the University of Houston’s Bauer College of Business, Wolff Center for Entrepreneurship. Mr. Wuensch is a graduate of Baylor University and a Certified Public Accountant licensed in Texas.
BOARD COMPOSITION
Our board of directors is set at eleven members. We currently have 10 members and one vacancy. In order to ensure compliance with the independence requirements of the NASDAQ Global Market, the composition of the board of directors may change prior to and following the offering. It is our intention to be in full and timely compliance with all applicable rules of the NASDAQ Global Market and applicable law, including with respect to the independence of our directors. We intend to rely on the “controlled company” exception to the board of directors and committee composition requirements under the rules of the NASDAQ Global Market. The “controlled company” exception does not modify the independence requirements for the audit committee, and we intend to comply with the requirements of the Sarbanes-Oxley Act of 2002 and the NASDAQ Global Market rules which require that our audit committee be composed of at least three independent directors.
BOARD COMMITTEES
Our board of directors has the authority to appoint committees to perform certain management and administration functions. Our board of directors currently has an audit committee and a compensation committee.
The audit committee selects, on behalf of our board of directors, an independent public accounting firm to be engaged to audit our financial statements, discusses with the independent auditors their independence, reviews and discusses the audited financial statements with the independent auditors and management and recommends to our board of directors whether the audited financials should be included in our Annual Reports on Form 10-K filed with the SEC. Mr. Bronstein is the chairman of our audit committee and the other members of our audit committee are Mr. Ming, Mr. Nunez and Mr. Wuensch. In connection with the consummation of this offering, Mr. Bronstein will cease to serve as a member and as chairman at which time the audit committee will consist of three members, all of whom will be independent directors.
The compensation committee reviews and either approves, on behalf of our board of directors, or recommends to the board of directors for approval (1) the annual salaries and other compensation of our executive officers and (2) individual stock and stock option grants. The compensation committee also provides assistance and recommendations with respect to our compensation policies and practices and assists with the administration of our compensation plans. As of the date of this filing, a chairman of our compensation committee has not been elected. The members of our compensation committee are Mr. Bronstein, Mr. Ming, Nr. Nold, Mr. Pattiz and Mr. Stone.
COMPENSATION COMMITTEE INTERLOCKS AND INSIDER PARTICIPATION
There are no interlocking relationships requiring disclosure under the applicable rules promulgated under the US federal securities laws.
93
Table of Contents
Management
LIMITATION OF LIABILITY AND INDEMNIFICATION
For information concerning limitation of liability and indemnification applicable to our directors, executive officers and, in certain cases, employees, please see “Description of Capital Stock” located elsewhere in this prospectus.
94
Table of Contents
Certain relationships and related party transactions
GORES
Senior notes
As part of the Restructuring, we entered into a Securities Purchase Agreement (the “Securities Purchase Agreement”) with: (1) holders of our then outstanding Old Notes that were issued under the Note Purchase Agreement, dated as of December 3, 2002, as amended, among us and the holders of the notes issued thereunder, and (2) lenders under the Facility (such lenders, collectively with the holders of the Old Notes, the “Debt Holders”).
Pursuant to the Securities Purchase Agreement, including the agreements and instruments attached as exhibits thereto, in consideration for releasing all of their respective claims under the Old Notes and the Old Credit Agreement, the Debt Holders (including Gores, our principal stockholder, with respect to debt purchased by Gores in the Cash Out, as described below) collectively received (1) $117.5 million of Senior Notes, maturing July 15, 2012, which Senior Notes represent the portion of our indebtedness under the Old Credit Agreement and the Old Notes deemed to be continuing by the Securities Purchase Agreement; (2) 34,962 shares of Series B Preferred Stock; and (3) a one-time cash payment of $25.0 million. Gores purchased at a discount approximately $22.6 million principal amount of our then existing debt held by Debt Holders who did not wish to participate in the Senior Notes as set forth in the Securities Purchase Agreement (the “Cash Out”). See “Description of Certain Indebtedness—15% Senior Secured Notes due 2012.”
Gores guarantees
In connection with the Restructuring, we also entered into the Senior Credit Facility with Wells Fargo Foothill, LLC as the arranger, administrative agent and initial lender, pursuant to which we obtained a $15.0 million revolving line of credit (which includes a $1.5 million letter of credit sub-facility) on a senior unsecured basis and a $20.0 million unsecured non-amortizing term loan. We borrowed the entire amount of the term loan on the closing date and did not make any borrowings of revolving loans. Loans under the Senior Credit Facility will mature on July 15, 2012 and proceeds of the term loan will be used to, among other things, consummate the transactions contemplated by the Restructuring, and pay fees and expenses in connection therewith. See “Description of Certain Indebtedness—Senior Credit Facility.” Gores is guaranteeing all indebtedness under the Senior Credit Facility.
Additionally, as contemplated by the Restructuring, Gores is guaranteeing payments due to the NFL in an amount of up to $10 million for the license and broadcast rights to certain NFL games and NFL-related programming.
Master mutual release
In connection with the Restructuring, we and the holders of the Old Notes and loans under the Old Credit Agreement (including Gores with respect to debt purchased by Gores in the Cash Out) entered into an agreement (the “Master Mutual Release”), pursuant to which we, our subsidiaries, the holders of the Old Notes and the lenders under the Old Credit Agreement released all of their respective claims for indemnity, reimbursement, expense and payment of the obligations in respect of the Old Notes and the Old Credit Agreement, except to the extent such obligations were continued under the Senior Notes.
95
Table of Contents
Certain relationships and related party transactions
Purchase agreement
In connection with the Restructuring, Gores (1) agreed to purchase, at a discount, approximately $22.6 million principal amount of our then existing debt held by debt holders who did not wish to participate in the Senior Notes, (2) agreed to guarantee the Senior Credit Facility and a $10.0 million contractual commitment by one of our wholly owned subsidiaries and (3) invested $25.0 million in the Company for 25,000 shares of Series B Preferred Stock. In connection with Gores providing the guarantees and purchasing the debt from non-participating holders, the 75,000 shares of Series A Preferred Stock held by Gores immediately prior to the Restructuring, which then had a liquidation preference of approximately $79.0 million, were exchanged for 75,000 shares of Series A-1 Preferred Stock.
Investor rights agreement
We also entered into an Investor Rights Agreement (the “Investor Rights Agreement”) with Gores and the other holders of the Senior Notes (the “Original Investor Stockholders”). Pursuant to the Investor Rights Agreement, as long as the Original Investor Stockholders in the aggregate hold at least 60% of the common stock (including the Preferred Stock on an as-converted basis) owned by the Original Investor Stockholders on the date of the Restructuring, immediately after giving effect to the transactions contemplated by the Securities Purchase Agreement, the Board of Directors shall nominate for election as director, one nominee designated in writing to Gores and us by the holders of a majority of the common stock (including Preferred Stock on an as-converted basis) held by such Original Investor Stockholders. Gores has agreed to vote in favor of any such nominee that is reasonably acceptable to Gores. In addition, as part of the Investor Rights Agreement, the Original Investor Stockholders were granted certain pre-emptive rights, tag-along rights, drag-along rights and piggyback registration rights.
Gores registration rights agreement
As part of Gores’ original purchase of our stock, Gores is entitled to registration rights under the terms of a Registration Rights Agreement (the “Registration Rights Agreement”) for the common stock owned by Gores, including shares of common stock issuable upon conversion of the Preferred Stock and/or exercise of the warrants held by Gores (collectively, the “Registrable Securities”). Under such agreement, we will file upon Gores’ request a resale shelf registration statement and will also provide Gores up to four (4) demand registrations. We are obligated to keep such shelf registration continuously effective under the Securities Act of 1933, as amended (the “Securities Act”), until the earliest of: (i) the fifth (5th) anniversary of such registration statement, (ii) when all Registrable Securities covered by such Registration Statement have been sold and (iii) the date as of which each of the holders of Registrable Securities is permitted to sell its Registrable Securities without registration pursuant to Rule 144 without volume limitations or any other restrictions.
In connection with the Restructuring, we and Gores amended the Registration Rights Agreement to, among other things, make the piggyback registration rights granted to the Original Investor Stockholders under the Investor Rights Agreement consistent with those contained in the Registration Rights Agreement.
GLENDON PARTNERS, INC.
For consulting services rendered by Glendon Partners (“Glendon”), an operating group associated with Gores, our principal stockholder, in connection with the Restructuring, we paid Glendon on the closing date of the Restructuring (ie, April 23, 2009) $0.65 million. These fees consist of payment for services rendered by various members of Glendon, including directors Andrew Bronstein and Michael Nold, who
96
Table of Contents
Certain relationships and related party transactions
in connection with the Restructuring provided professional services to us in the areas of operational improvement, tax, finance, accounting, legal and insurance/risk management. Glendon consists of experienced professionals who provide consulting services to Gores’ portfolio companies, including Westwood One. The fee for such services was based on Glendon’s hourly billing rates. Since such date, we have paid $0.4 million to Glendon for continued operational support. In addition, on Gores’ behalf, we paid the fees of Gores’ advisers (including legal counsel and financial advisers but excluding Glendon) pursuant to the terms of the Restructuring, which fees totaled approximately $2.8 million (of which approximately $0.2 million was paid in late 2008). We anticipate that Glendon will continue to provide such services during fiscal year 2009. Any payments made to Glendon for consulting services are permitted under our new credit arrangements with the holders of our Senior Notes and Wells Fargo Foothill provided such payments do not exceed $1.5 million in 2009 for services provided before or during 2009 and $1.0 million in each calendar year thereafter for services provided in such year.
CBS RADIO
On March 3, 2008, we closed the Master Agreement with CBS Radio which documents a long-term arrangement between the parties through March 31, 2017. On that date, the Management Agreement and CBS Representation Agreement terminated and the CBS warrants were cancelled as described in more detail below. A number of CBS Radio’s radio stations are affiliated with our radio networks and we purchase several programs from CBS Radio. See “Business—CBS.” We previously considered CBS Radio to be an affiliate of ours because, prior to the Restructuring, CBS Radio owned approximately 16 million shares of our common stock, which then amounted to approximately 16% of our outstanding equity on an as-converted basis. Additionally, as described below, when the Management Agreement was in place, CBS Radio provided the services of our CEO and CFO and had two directors on our Board. When the Management Agreement was terminated, the CBS directors resigned and CBS Radio ceased providing a CEO and CFO to us. Although CBS Radio’s equity ownership was significantly diluted on April 23, 2009 when the Restructuring occurred, because the conversion of the Preferred Stock into common stock did not occur until August 3, 2009, we did not cease viewing CBS Radio as our affiliate until such date.
Until March 3, 2008, we had a Management Agreement and Representation Agreement with CBS Radio to operate the CBS Radio Networks until March 31, 2009. In return for receiving services under the Management Agreement, we paid CBS Radio an annual base fee and provided CBS Radio the opportunity to earn an incentive bonus if we exceeded pre-determined targeted cash flows. In 2006, 2007 and 2008, we paid CBS Radio a base fee of $3.3 million, $3.4 million and $0.6 million, respectively, however, no incentive bonus was paid to CBS Radio in such years as targeted cash flow levels were not achieved during such periods. In addition to the Management Agreement and Representation Agreement, we also entered into other transactions with affiliates of CBS Radio, including Viacom, in the normal course of business, including affiliation agreements with many of CBS Radio’s radio stations and agreements with CBS Radio and its affiliates for programming rights.
During 2006, 2007 and 2008, we incurred expenses aggregating approximately $75.4 million, $66.6 million and $73.0 million, respectively, for the Representation Agreement, affiliation agreements and the purchase of programming rights from CBS Radio and its affiliates. The description and amounts regarding related party transactions set forth in this prospectus also reflect transactions between us and Viacom. Viacom is an affiliate of CBS Radio, as National Amusements, Inc. beneficially owns a majority of the voting powers of all classes of common stock of each of CBS Corporation and Viacom. As a result of this change in ownership and the fact that CBS Radio ceased to manage us in March 2008, we no longer consider CBS Radio to be a related party effective as of August 3, 2009. In addition to the base fee
97
Table of Contents
Certain relationships and related party transactions
and incentive compensation described above, we granted to CBS Radio seven fully vested and nonforfeitable warrants to purchase an aggregate of 4,500,000 shares of common stock (comprised of two warrants to purchase 1,000,000 shares of common stock per warrant and five warrants to purchase 500,000 shares of common stock per warrant). On March 3, 2008, all warrants issued to CBS Radio were cancelled in accordance with the terms of the CBS Master Agreement. The registration rights agreement covering the shares of common stock issuable upon exercise of the warrants was also terminated on March 3, 2008, however, we and CBS Radio entered into a new registration rights agreement which provides registration rights to the 80,000 shares of common stock held by CBS Radio and its affiliates.
In addition to the foregoing, CBS Radio enters into other agreements with us in the ordinary course to purchase programming rights and affiliate stations with our network and traffic operations.
During 2006 and 2007, when the Management Agreement was still in place, CBS Radio provided to us the services of a chief executive officer and a chief financial officer. Prior to the hiring of Mr. Thomas Beusse on January 8, 2008, CBS Radio employed our CEO and reimbursed us for costs related to our CFO who, beginning with the hiring of Mr. Andrew Zaref in 2004, was employed by us. CBS Radio reimbursed the Company for Mr. Beusse’s salary between January 8, 2008 and March 3, 2008 when the new Master Agreement closed. Pursuant to the terms of such agreement, we and CBS Radio agreed to share equally the severance costs associated with the termination of Peter Kosann (CEO prior to Mr. Beusse) and Andrew Zaref (CFO). For each of 2006, 2007 and 2008, based on information known to us we believe the aggregate costs related to the services of a CEO and CFO (eg, salary, bonus, benefits, taxes and severance in the case of Messrs. Kosann and Zaref) that were paid by CBS Radio were approximately $1.5 million, $1.8 million and $1.3 million, respectively.
GERALD GREENBERG
Gerald Greenberg, one of our directors from May 1994 to June 2008, through his company Mirage Music Entertainment, Inc. (“Mirage”) entered into a two-year consulting agreement with us on July 1, 2008 in connection with our active review of our audio archive, including the development of a plan to monetize such assets. Under the terms of the agreement, Mr. Greenberg, who has extensive contacts and relationships in the music industry, will serve as a consultant to us in connection with the aforementioned archive project, and will provide assistance to us in connection with negotiating exploitation rights to certain archive material. Mirage will also be compensated for any unique opportunities originated and presented by it to us, as further set forth in the consulting agreement. In connection with such agreement, on the effective date thereof (ie, July 1, 2008), Mr. Greenberg received a stock option to purchase 100,000 shares of common stock at an exercise price of $1.30 (the closing price of the common stock on July 1, 2008). Mirage received a minimum annual retainer of $0.1 million in year one and eighty eight thousand dollars in year two (“Retainer”) and will receive a project fee equal to 10% of net profit in excess of the Retainer for projects in which Mirage undertakes an active and integral role. If the programming for which the idea, concept and talent originates solely from Mirage, it will receive 20% (not 10%) of net profit in excess of the Retainer. While we continue to believe there are opportunities to generate revenue related to our audio archive, given the complexity of the exploitation rights issues involved in further exploitation of the archive materials, we have not yet developed a plan as to how to generate revenue (monetize) our audio archive materials. Further, neither we nor Mirage have entered into any contracts with third parties related to the audio archive. We believe that any action or plan to monetize our audio archive would likely require a negotiation on rights in which we believe Mirage would be particularly helpful.
98
Table of Contents
Certain relationships and related party transactions
NORMAN J. PATTIZ
Norm Pattiz, our founder, Chairman of the Board of Directors and a director since our founding in 1974, intends to form a production company (“NPC”), which he would wholly own and over which he would exercise operating control. NPC would only produce programming that we have considered and evaluated, and determined that we should not produce at our own cost and expense. On June 15, 2009, our Board approved Amendment No. 5 to our employment agreement with Mr. Pattiz. As part of such Amendment No. 5, we and Mr. Pattiz agreed that if we formally reject a program that is submitted to us, Mr. Pattiz will have the right to negotiate a programming deal for himself with respect to such formally rejected content, provided that Mr. Pattiz provides us with a right of first refusal to distribute the programming, which right of first refusal we must exercise within 30 days of notice from Mr. Pattiz. In connection with this provision, our Board waived a provision of our Code of Ethics which prohibits, among other things, any of our directors or employees from being an owner, officer, partner or employee of an organization (other than Westwood One) involved in the radio, music or entertainment business.
99
Table of Contents
On August 20, 2009, there were approximately 366 holders of record of our common stock, several of which represent “street accounts” of securities brokers.
Prior to November 24, 2008, our common stock traded on the NYSE under the symbol “WON.” As a result of the decline in our stock price, our common stock was delisted from the New York Stock Exchange as of November 24, 2008. Effective November 24, 2008, our common stock was quoted on the OTC Bulletin Board under the symbol “WWON.OB”. On August 5, 2009, our ticker symbol changed to WWOZ.OB in connection with our reverse stock split.
The following table sets forth the high and low sales prices per share of our common stock on the OTC Bulletin Board and NYSE, as applicable, for the periods indicated. The over-the-counter market quotations reflect inter-dealer prices, without retail mark-up, mark-down or commission and may not necessarily reflect actual transactions. On , 2009, the last reported sales price of our common stock as reported on the OTC Bulletin Board was $ per share.
| 2009 | High | Low | ||||
| First Quarter |
$ | 0.12 | $ | 0.02 | ||
| Second Quarter |
0.12 | 0.05 | ||||
| Third Quarter (through August 4, 2009) |
0.06 | 0.04 | ||||
| Third Quarter (from August 5, 2009 through October 28, 2009)(1) |
11.00 | 3.25 | ||||
| 2008 | High | Low | ||||
| First Quarter |
$ | 2.39 | $ | 1.46 | ||
| Second Quarter |
2.42 | 1.02 | ||||
| Third Quarter |
1.45 | 0.41 | ||||
| Fourth Quarter |
0.54 | 0.02 | ||||
| 2007 | High | Low | ||||
| First Quarter |
$ | 7.33 | $ | 6.00 | ||
| Second Quarter |
8.38 | 6.44 | ||||
| Third Quarter |
7.30 | 2.23 | ||||
| Fourth Quarter |
3.03 | 1.76 | ||||
The amounts in the table for the periods ending on or prior to August 4, 2009 do not reflect the 200 for 1 reverse stock split of our outstanding common stock and the conversion of all outstanding shares of Series A-1 Preferred Stock and Series B Preferred Stock into common stock that occurred on August 3, 2009.
| (1) | Reflects 200 for 1 reverse stock split. |
100
Table of Contents
Principal and selling stockholders
The following table shows the beneficial ownership of our common stock on September 30, 2009 by:
| Ø | each person who we know beneficially owns more than 5% of our common stock; |
| Ø | our directors and named executive officers; |
| Ø | all of our directors and officers as a group; and |
| Ø | the selling stockholders. |
Beneficial ownership, which is determined in accordance with the rules and regulations of the SEC, means the sole or shared power to vote or direct the voting or to dispose or direct the disposition of our common stock. The number of shares of our common stock beneficially owned by a person includes shares of common stock issuable with respect to options held by the person that are exercisable within 60 days. The percentage of our common stock beneficially owned by a person assumes that the person has exercised all options the person holds that are exercisable within 60 days, and that no other persons exercised any of their options. Except as otherwise indicated, the business address for each of the following persons is 40 West 57th Street, 5th Floor, New York, New York 10019. Except as otherwise indicated in the footnotes to the table or in cases where community property laws apply, we believe that each person identified in the table possesses sole voting and investment power over all shares of common stock shown as beneficially owned by the person. Percentage of beneficial ownership before the offering is based on 20,312,226 shares of common stock outstanding as of September 30, 2009 and reflects a 200 for 1 reverse stock split that occurred on August 3, 2009. Percentage of beneficial ownership after the offering is based on shares of common stock outstanding after the completion of this offering.
| Common stock | ||||||||||
| Before the offering | Number of shares being sold in the offering |
After completion of the offering | ||||||||
| Name and Address of Beneficial Owner(1) | Number of shares |
Percentage of common stock |
Number of shares |
Percentage of common stock | ||||||
| 5% Stockholders and Selling Stockholders |
||||||||||
| Gores Radio Holdings, LLC(2) |
15,257,507 | 75.1 | ||||||||
| Directors and Named Executive Officers |
||||||||||
| Norman J. Pattiz(3)(6) |
6,489 | * | ||||||||
| Roderick Sherwood(4) |
7,500 | * | ||||||||
| David Hillman(5) |
1,181 | * | ||||||||
| Jonathan Marshall(9) |
1,650 | * | ||||||||
| Andrew P. Bronstein(4) |
— | * | ||||||||
| Jonathan I. Gimbel(4) |
— | * | ||||||||
| Scott M. Honour(4) |
— | * | ||||||||
| H. Melvin Ming(6) |
1,004 | * | ||||||||
| Michael F. Nold(4) |
— | * | ||||||||
| Emanuel Nunez(6) |
1,367 | * | ||||||||
| Mark Stone(4) |
— | * | ||||||||
| Ian Weingarten(4) |
— | * | ||||||||
| Ronald Wuensch(8) |
— | * | ||||||||
| All directors and officers as a group(7) |
19,191 | * | ||||||||
| * | Indicates less than 1%. |
(footnotes on following page)
101
Table of Contents
Principal and selling stockholders
| (1) | The persons in the table have sole voting and investment power with respect to all shares of common stock, unless otherwise indicated. The numbers presented above do not include unvested and/or deferred restricted stock units (“RSUs”) which have no voting rights until shares are distributed in accordance with their terms. All dividend equivalents on vested RSUs and shares of restricted stock (both vested and unvested) are included in the numbers reported above. Tabular information for the entities listed above is based on information contained in the most recent Schedule 13D/13G filings and other filings made by such persons with the Securities and Exchange Commission as well as other information made available to us. |
| (2) | Gores Radio Holdings, LLC is managed by The Gores Group, LLC. Gores Capital Partners II, L.P. and Gores Co-Invest Partnership II, L.P. (collectively, the “Gores Funds”) are members of Gores Radio Holdings, LLC. Each of the members of Gores Radio Holdings, LLC has the right to receive dividends from, or proceeds from, the sale of investments by Gores Radio Holdings, LLC, including the shares of common stock, in accordance with their membership interests in Gores Radio Holdings, LLC. Gores Capital Advisors II, LLC (“Gores Advisors”) is the general partner of the Gores Funds. Alec E. Gores is the managing member of The Gores Group, LLC. Each of the members of Gores Advisors (including The Gores Group, LLC and its members) has the right to receive dividends from, or proceeds from, the sale of investments by the Gores Entities, including the shares of common stock, in accordance with their membership interests in Gores Advisors. Under applicable law, certain of these individuals and their respective spouses may be deemed to be beneficial owners having indirect ownership of the securities owned of record by Gores Radio Holdings, LLC by virtue of such status. Each of the foregoing entities and the partners, managers and members thereof disclaim ownership of all shares reported herein in excess of their pecuniary interests, if any. |
| (3) | Includes vested and unexercised stock options for 1,132 shares granted under the 1989 Stock Incentive Plan, the 1999 Stock Incentive Plan and the 2005 Equity Compensation Plan. Also includes 2,250 shares of common stock pledged by Mr. Pattiz to Merrill Lynch in connection with the Merrill Contract that Mr. Pattiz entered into on September 27, 2004 with Merrill Lynch. Under the Merrill Contract, in exchange for a lump-sum cash payment of $7,182,000, Mr. Pattiz agreed to deliver upon the earlier of September 2009 or the termination of the Merrill Contract, a pre-determined number of shares of common stock pursuant to formulas set forth in the Merrill Contract. Mr. Pattiz may also settle the amount in cash. Also includes 1,500 shares of common stock held indirectly by the Pattiz Family Trust. |
| (4) | Each of Messrs. Bronstein, Gimbel, Honour, Nold, Sherwood, Stone and Weingarten disclaims beneficial ownership of our securities owned by Gores Radio Holdings, LLC, except to the extent of any pecuniary interest therein. |
| (5) | Includes 939 vested and unexercised options granted under the 1999 Stock Incentive Plan and 2005 Equity Compensation Plan and 54 unvested shares of restricted stock (including dividend equivalents) granted under the 2005 Equity Compensation Plan. Includes 2 shares of common stock held in the Company 401(k) account. |
| (6) | Represents vested RSUs granted under the 2005 Equity Compensation Plan. Does not include deferred RSUs which have no voting rights until shares are distributed in accordance with their terms. In connection with the conversion by Gores on July 9, 2009 of 3,500 shares of Series A-1 Preferred Stock into 517,564 shares of common stock (as adjusted for the reverse stock split), a “Change of Control” was deemed to have occurred under the terms of the Company’s 2005 Equity Compensation Plan and in connection therewith, all previously unvested RSUs granted to Messrs. Pattiz, Ming and Nunez (41, 876 and 1,367 shares, respectively) accelerated and vested in their entirety, which amounts are included above. |
| (7) | Gary Schonfeld and Steven Kalin, who were appointed President, Network division and President, Metro Networks division and Chief Operating Officer, respectively, are included in the number of executive officers described above. As such individuals were not appointed until October and May 2008, respectively, they were not “named executive officers” for fiscal year 2008. |
| (8) | Ronald Wuensch was elected to our Board of Directors on July 6, 2009. |
| (9) | Includes 500 vested and unexercised options granted under the 2005 Equity Compensation Plan. |
We have agreed to indemnify the selling stockholders and persons affiliated with them against certain liabilities to which they may become subject in connection with the offering and sale of the shares contemplated by this prospectus, including liabilities arising under the Securities Act.
102
Table of Contents
We are currently authorized to issue 5,000,000,000 shares of our common stock, par value $0.01 per share, 3,000,000 shares of our Class B stock, par value $0.01 per share, and 10,000,000 shares of preferred stock, par value $0.01 per share. Except as expressly set forth in our certificate of incorporation as summarized below or as otherwise required by the Delaware General Corporation Law, or the DGCL, each share of our common stock and Class B stock shall have identical powers, preference and rights, including rights in liquidation. As of September 30 , 2009, we had outstanding 20,312,226 shares of common stock and there were no shares of our Class B stock or our Preferred Stock outstanding.
On August 3, 2009, we effected a 200 for 1 reverse stock split of our common stock, pursuant to which each 200 shares of our common stock issued and outstanding on August 3, 2009 were automatically converted into one share of common stock. On August 3, 2009, after giving effect to the reverse stock split, Gores beneficially owned 15,257,507 shares of our common stock.
The following summary description of our capital stock is based on our certificate of incorporation and bylaws in effect as of the date of this prospectus and the applicable provisions of the DGCL. For more information on how you can obtain copies of our certificate of incorporation and bylaws, see “Where You Can Find More Information and Incorporation by Reference.” We urge you to read the certificate of incorporation and bylaws in their entirety.
COMMON STOCK AND CLASS B STOCK
Dividend rights
The holders of common stock and Class B stock are entitled to receive dividends and other distributions as may be declared by our Board of Directors out of assets or funds legally available for that purpose, subject to the rights of the holders of any series of preferred stock, and any other provision of our certificate of incorporation. Our certificate of incorporation provides that no cash dividend may be declared and paid to holders of Class B stock unless at the same time the Board of Directors shall also declare and pay to the holders of our common stock a per share dividend of at least 25% greater than the per share dividend declared and paid to holders of Class B stock. The Board of Directors may declare and pay dividends to the holders of our common stock without declaring and paying dividends to the holders of our Class B stock. Our common stock and Class B stock are equal in respect of rights to dividends (other than cash) and distributions, when and as declared, in the form of stock or other of our property.
Our certificate of incorporation provides that if shares of common stock are paid on common stock and shares of Class B stock are paid on Class B stock in an equal amount per share of common stock and Class B stock, such payment will be deemed to be a like dividend or other distribution.
The terms of our Senior Credit Facility and Senior Notes currently restrict us from paying dividends or making distributions, except in limited circumstances.
Conversion of Class B stock
In the event that, (i) the voting power of the Class B stockholders as a group (such voting power to include the voting power of our common stock held by holders of Class B stock) falls below 10% of the aggregate voting power of issued and outstanding shares of our common stock and Class B stock, or
103
Table of Contents
Description of capital stock
(ii) the Board of Directors and the holders of a majority of the outstanding shares of our common stock and Class B stock approve the conversion of all of the Class B stock into shares of common stock, then, without further action on the part of the Class B stockholders or us, all shares of Class B stock then issued and outstanding will be deemed to be converted into shares of common stock, and stock certificates formerly representing such shares of Class B stock will from that time be deemed to represent the like number of shares of common stock. In addition, each share of Class B stock is convertible, at the option of its record holder, into one validly issued, fully paid and non-assessable share of common stock at any time.
Transfer of Class B stock
Our certificate of incorporation provides that no person holding record or beneficial ownership of shares of Class B stock, each referred to in this prospectus as a Class B stockholder, may transfer, and we will not register the transfer of, such shares of Class B stock, except to a permitted transferee of such Class B stockholder as defined in our certificate of incorporation. In certain circumstances set forth in our certificate of incorporation, changes in ownership or control of a Class B stockholder will also result in the conversion of such holder’s Class B stock into common stock. Upon any purported transfer of shares of our Class B stock not permitted under our certificate of incorporation, all shares of Class B stock purported to be transferred will be deemed to be converted into shares of common stock, and stock certificates formerly representing such shares of Class B stock will from that time be deemed to represent the like number of shares of common stock.
Voting rights
Each share of common stock entitles the holder to one vote and each share of Class B stock entitles the holder to 50 votes at each annual or special meeting of our stockholders and for all other purposes on all matters being voted on by our stockholders, provided that, at such time as shares of Class B stock become outstanding, holders of the common stock, voting separately as a class with each holder of the outstanding shares of common stock being entitled to one vote in person or by proxy for each share of the common stock standing in his name, shall have the right to elect directors to the Board of Directors such that one-fifth (calculated to the nearest whole number, rounding fractional number of five-tenths (.5) to the next highest whole number) of the total number of directors on the Board of Directors shall have been elected by the holders of the common stock. The holders of our common stock and Class B stock vote as a single class on all matters submitted to a vote of our stockholders, except as otherwise set forth in our certificate of incorporation or as provided by law. Except as otherwise may be required by applicable law, neither the holders of common stock nor the holders of Class B stock have cumulative voting rights.
Right to receive liquidation distributions
In the event of our liquidation, dissolution or winding up, the holders of our common stock and the holders of Class B stock will be entitled to receive assets and funds available for distribution after payments to creditors and to the holders of any preferred stock that may at the time be outstanding, in proportion to the number of shares held by them, respectively, without regard to class.
The transfer agent and registrar for our common stock is Computershare Trust Company, N.A. Our common stock is traded on the OTC Bulletin Board under the symbol “WWOZ.OB”. We have applied to list our common stock on the NASDAQ Global Market under the symbol “WWON”.
104
Table of Contents
Description of capital stock
PREFERRED STOCK
No shares of our preferred stock are outstanding as of the date of this prospectus. However, pursuant to our certificate of incorporation our Board of Directors has the authority to cause up to 10,000,000 shares of our preferred stock to be issued from time to time in one or more series, with the powers, preferences, rights, qualifications, limitations and restrictions pertaining to our preferred stock, or any series thereof to be fixed by our Board of Directors. The ability of our Board of Directors to issue preferred stock without stockholder approval could have the effect of delaying, deferring or preventing a change in control of us or the removal of our existing management. The Preferred Stock has a beneficial conversion feature contained in the Preferred Stock and accretion of the Preferred Stock to redemption value as described above in this prospectus in more detail.
ANTI-TAKEOVER EFFECTS OF OUR RESTATED CERTIFICATE OF INCORPORATION AND SECTION 203 OF THE DGCL
The DGCL and our Certificate of Incorporation and bylaws contain provisions that could make it more difficult for a potential acquiror to acquire us by means of a tender offer, proxy contest or otherwise. These provisions are expected to discourage certain coercive takeover practices and inadequate takeover bids and to encourage persons seeking to acquire control of us to negotiate first with our board of directors. We believe that the benefits of these provisions outweigh the potential disadvantages of discouraging any such acquisition proposals because, among other things, the negotiation of such proposals may improve their terms.
Section 203 of the DGCL
Section 203 of the DGCL provides, in general, that a stockholder acquiring more than 15% of the voting power of a corporation subject to the statute (referred to in this prospectus as an Interested Stockholder), but less than 85% of the voting power of such corporation, may not engage in certain business combinations (as defined in Section 203 of the DGCL) with the corporation for a period of three years subsequent to the date on which the stockholder became an Interested Stockholder unless (i) prior to such time the corporation’s board of directors approved either the business combination or the transaction in which the stockholder became an Interested Stockholder or (ii) the business combination is approved by the corporation’s board of directors and authorized by a vote of at least 66 2/3% of the voting power of the corporation not owned by the Interested Stockholder. We are subject to the anti-takeover provisions of Section 203 of the DGCL.
Classified board of directors
Our board of directors is divided into three classes of directors serving staggered three-year terms, with the term of office of only one of the three classes expiring each year. A classified board may render a change in control of us or removal of our incumbent management more difficult. We believe, however, that the longer time required to elect a majority of a classified board of directors helps to ensure the continuity and stability of our management and policies.
Election of directors
Our Certificate of Incorporation and bylaws provide that the affirmative vote of the holders of a plurality of votes cast in the election of directors at an annual meeting will be required to elect a director. Pursuant to the Certificate of Incorporation, our board of directors may amend the bylaws to alter the vote required to elect directors.
105
Table of Contents
Description of capital stock
Number of directors; vacancies; removal
Our Certificate of Incorporation provides that the number of directors will determined in accordance with our bylaws. Our bylaws provide that a majority of our entire board of directors may at any time increase or decrease the number of directors. However, unless our bylaws are amended, the number of directors may never be less than three nor more than thirteen. Pursuant to the Certificate of Incorporation, our board of directors may amend the bylaws. Except as may be provided by the board of directors in setting the terms of any class or series of preferred stock, any and all vacancies on the board of directors may be filled only by the affirmative vote of a majority of the remaining directors in office, even if the remaining directors do not constitute a quorum, and any director elected to fill a vacancy will serve for the remainder of the full term of the directorship in which the vacancy occurred and until a successor is elected and qualifies.
Our Certificate of Incorporation provides that a director may be removed only for cause and then only by the affirmative vote of at least 75% of the votes entitled to be cast generally in the election of directors; provided, that the affirmative vote only a majority of the votes entitled to be cast generally in the election of directors is required for such removal if such removal is approved by a majority of the continuing directors.
Action by stockholders
Under our Certificate of Incorporation, stockholder action can be taken only at an annual or special meeting of stockholders unless such action is approved by a majority of the continuing directors in which case such action may be taken by written consent of the stockholders having not less than the minimum voting power that would be necessary to take such action at a meeting of stockholders at which all shares entitled to vote thereon were present and voted, provided all other requirements of applicable law and the Certificate of Incorporation have been satisfied. These provisions, combined with the requirements of our bylaws regarding the calling of a stockholder-requested special meeting of stockholders discussed below, may have the effect of delaying consideration of a stockholder proposal until the next annual meeting.
Advance notice provisions for stockholder nominations and stockholder proposals
Our bylaws provide that with respect to an annual meeting of stockholders, nominations of individuals for election to the board of directors and the proposal of business to be considered by stockholders may be made only (1) pursuant to our notice of the meeting, (2) by or at the direction of the board of directors or (3) by a stockholder who is a stockholder of record both at the time of giving the advance notice required by the bylaws and at the time of the meeting, who is entitled to vote at the meeting in the election of each individual so nominated or on any such other business and who has complied with the advance notice procedures of the bylaws.
The purpose of requiring stockholders to give us advance notice of nominations and other business is to afford our board of directors a meaningful opportunity to consider the qualifications of the proposed nominees and the advisability of any other proposed business and, to the extent deemed necessary or desirable by our board of directors, to inform stockholders and make recommendations about such qualifications or business, as well as to provide a more orderly procedure for conducting meetings of stockholders. Although our bylaws do not give our board of directors any power to disapprove stockholder nominations for the election of directors or proposals recommending certain action, they may have the effect of precluding a contest for the election of directors or the consideration of stockholder proposals if proper procedures are not followed and of discouraging or deterring a third party from conducting a solicitation of proxies to elect its own slate of directors or to approve its own proposal without regard to whether consideration of such nominees or proposals might be harmful or beneficial to us and our stockholders.
106
Table of Contents
Description of capital stock
Calling of special meetings of stockholders
Our bylaws provide that special meetings of stockholders may be called only by our board of directors and certain of our officers.
LIMITATION OF LIABILITY AND INDEMNIFICATION MATTERS
Under our Certificate of Incorporation, directors have no personal liability to us or our any of our stockholders for monetary damages for breach of fiduciary duty as a director, except for liability: (1) for any breach of the director’s duty of loyalty to us or our stockholders; (2) for acts or omissions not in good faith or which involve intentional misconduct or a knowing violation of law; (3) under Section 174 of the DGCL; (4) or for any transaction from which the director derived an improper personal benefit.
Our bylaws provide that we will indemnify our directors and officers to the fullest extent permitted by Delaware law, as it now exists or may in the future be amended. Our bylaws provide that we shall advance the expenses incurred by a director or officer in advance of the final disposition of an action or proceeding. Our bylaws also authorize the board of directors to provide indemnification rights and advancement of expenses to any of our employees or agents similar to that provided to the directors and officers under the bylaws.
107
Table of Contents
Shares eligible for future sale
Upon the closing of this offering, we will have outstanding an aggregate of shares of common stock. Of these shares, shares of common stock to be sold in this offering, or shares if the underwriters exercise their over-allotment option in full, will be freely tradable without restriction or further registration under the Securities Act, unless the shares are held by any of our affiliates, as that term is defined in Rule 144 of the Securities Act. Certain remaining shares were issued and sold by us in private transactions and are eligible for public sale only if registered under the Securities Act or sold in accordance with Rule 144 or Rule 701, each of which is discussed below. In addition, we have outstanding stock options held by employees and directors for the purchase of shares of common stock.
The holders of substantially all of our currently outstanding stock are subject to lock-up agreements under which they have agreed not to transfer or dispose of, directly or indirectly, any shares of common stock or any securities convertible into or exercisable or exchangeable for shares of common stock, for a period of either 120 or 180 days after the date of this prospectus, which is subject to extension in some circumstances, as discussed below.
As a result of the lock-up agreements described below and the provisions of Rule 144 and Rule 701 under the Securities Act, the shares of our common stock (excluding the shares to be sold in this offering) will be available for sale in the public market as follows:
| Ø | shares will be available for sale on the date of this prospectus; |
| Ø | shares of common stock shares will be eligible for sale upon the expiration of the lock-up agreements, as more particularly and except as described below, beginning after expiration of the lock-up period pursuant to Rule 144 or Rule 701. |
RULE 144
In general, under Rule 144, a person (or persons whose shares are aggregated) who is not our affiliate, has not been our affiliate for the previous three months preceding a sale, and who has beneficially owned restricted shares of our common stock for at least six months (including any period of consecutive ownership of preceding non-affiliated holders) may sell all such shares. An affiliate or a person who has been our affiliate within the previous 90 days, and who has beneficially owned shares of our common stock for at least six months, may sell within any three-month period a number of shares that does not exceed the greater of:
| Ø | one percent of the number of shares of our common stock then outstanding, which will equal approximately shares immediately after this offering; and |
| Ø | the average weekly trading volume of our common stock during the four calendar weeks preceding the filing of a notice on Form 144 with respect to the sale. |
All sales under Rule 144 are subject to the availability of current public information about us. Sales under Rule 144 by affiliates or persons who have been affiliates within the previous 90 days are also subject to manner of sale provisions and notice requirements. Upon expiration of the applicable lock-up period, subject to any extension of the lock-up period under circumstances described below, approximately shares of our outstanding restricted securities will be eligible for sale under Rule 144.
108
Table of Contents
Shares eligible for future sale
RULE 701
Rule 701 generally allows a stockholder who purchased shares of our common stock pursuant to a written compensatory plan or contract and who is not deemed to have been an affiliate of our company during the immediately preceding 90 days to sell these shares in reliance upon Rule 144, but without being required to comply with the public information and holding period provisions of Rule 144. Rule 701 also permits affiliates of our company to sell their Rule 701 shares under Rule 144 without complying with the holding period requirements of Rule 144.
LOCK-UP AGREEMENTS
For a description of the lock-up agreements with the underwriters that restrict sales of shares by us, or directors, executive officers, and stockholders, see the information under the heading “Underwriting.”
REGISTRATION RIGHTS
After the closing of this offering, stockholders holding shares of our common stock have the right, subject to various conditions and limitations, to include their shares in registration statements relating to our securities. By exercising their registration rights and causing a large number of shares to be registered and sold in the public market, these holders could cause the price of the common stock to fall. In addition, any demand to include such shares in our registration statements could have a material adverse effect on our ability to raise needed capital.
109
Table of Contents
Description of certain indebtedness
EXISTING INDEBTEDNESS
As of the date of this prospectus, we have the following outstanding long term debt:
15% Senior secured notes due 2012
We currently have outstanding $120.4 million of Senior Notes (of which $2.9 million is PIK interest), maturing July 15, 2012. The Senior Notes bear interest at 15.0% per annum payable 10% in cash and 5% in-kind (PIK interest). The PIK interest will be added to principal quarterly, but will not be payable until maturity. The Senior Notes may be prepaid at any time, in whole or in part, without premium or penalty. The Senior Notes are mandatorily prepayable upon, among other things, certain asset sales and the occurrence of a “Change of Control” (as defined in the Senior Notes).
The Senior Notes are guaranteed by our domestic subsidiaries (the “Guarantors” and, together with us, the “Loan Parties”) and are secured, pursuant to an amendment to our security agreement with the Debt Holders, by a first priority lien on substantially all of the assets of the Loan Parties, including a pledge of all of the outstanding capital stock of the Guarantors.
The Loan Parties are subject to restrictive covenants that, among other things, limit their ability to incur debt, incur liens, make investments, make capital expenditures, consummate acquisitions, pay dividends, sell assets and enter into mergers and similar transactions. Additionally, we may not exceed a maximum senior leverage ratio (the principal amount outstanding under the Senior Notes over our Consolidated EBITDA (as defined in the Senior Notes)), which is a 6.25 to 1.0 ratio on December 31, 2009 but begins to decline on a quarterly basis thereafter, including to a 4.5 to 1.0 ratio on December 31, 2010 and a 3.5 to 1.0 ratio on December 31, 2011. The Senior Notes contain customary representations and warranties and affirmative covenants. As described in the section entitled “Prospectus Summary—Recent Events” above, we recently obtained waivers of compliance with our debt leverage covenants for the fourth quarter of 2009 measurement period which means our debt leverage covenant will first be measured on March 31, 2010 and thereafter on a quarterly basis on a trailing four-quarter basis.
The Senior Notes also contain customary events of default, including, without limitation, nonpayment of principal or other amounts when due; breach of covenants, inaccuracy of representations and warranties, cross-default to other indebtedness of the Company or its subsidiaries, certain ERISA-related events, certain voluntary and involuntary bankruptcy events, certain judgment related defaults and invalidity or imperfected liens on collateral. The Guarantors’ obligations under the guaranty will be triggered upon the occurrence of an event of default.
If an event of default occurs and is continuing under the Senior Notes, any holder or holders of more than 50% in principal amount of the Senior Notes may accelerate all of our obligations under the Senior Notes. For events of default related to nonpayment of principal or interest, any two holders of the Senior Notes (other than Gores) holding at least 15% (in the aggregate) of principal amount of the Senior Notes affected by the event of default, may accelerate our obligations under the Senior Notes held by them. For other events of default, the obligations under the Senior Notes are automatically accelerated.
Senior credit facility
In connection with the Restructuring, we also entered into the Senior Credit Facility with Wells Fargo Foothill, LLC as the arranger, administrative agent and initial lender, pursuant to which we obtained a
110
Table of Contents
Description of certain indebtedness
$15.0 million revolving line of credit (which includes a $1.5 million letter of credit sub-facility) on a senior unsecured basis and a $20.0 million unsecured non-amortizing term loan, the obligations in respect of which are subordinated to obligations in respect of the Senior Notes. As of the date of this prospectus, we have borrowed the entire amount of the term loan and $5.0 million under the revolving line of credit. Loans under the Senior Credit Facility will mature on July 15, 2012.
Our obligations under the Senior Credit Facility are guaranteed by the Guarantors and Gores. Loans under the Senior Credit Facility are, subject to restrictions in the Senior Notes, mandatorily prepayable upon, among other things, certain asset sales and a change of control.
Loans under the Senior Credit Facility bear interest, at our option, at either LIBOR plus 4.5% per annum (with a LIBOR floor of 2.5%) or a base rate plus 4.5% per annum (with a base rate floor of the greater of 3.75% and the one-month LIBOR rate). The Senior Credit Facility contains substantially identical restrictive covenants (including a maximum senior leverage ratio calculated in a manner consistent with the Senior Notes), affirmative covenants and representations and warranties as those found in the Senior Notes, subject, in the case of certain covenants, to a cushion on baskets and covenant levels from those contained in the Senior Notes.
The Senior Credit Facility contains customary events of default, including, without limitation, nonpayment of principal or other amounts when due; breach of covenants; inaccuracy of representations and warranties; cross-acceleration to other indebtedness of the Company or its subsidiaries; certain ERISA-related events; certain voluntary and involuntary bankruptcy events; certain judgment related defaults; and certain events related to Gores, including defaults by Gores under the Gores guaranty and defaults by Gores under their other agreements with Wells Fargo Foothill, LLC and other third parties unrelated to us. The Guarantors’ obligations under the guaranty will be triggered upon demand by the agent following our failure to timely comply with our obligations under any loan document to which we are a party.
111
Table of Contents
Subject to the terms and conditions set forth in an underwriting agreement, each of the underwriters named below has severally agreed to purchase from us and the selling stockholders the aggregate number of shares of common stock set forth opposite their respective names below:
| Underwriters | Number of shares | |
| UBS Securities LLC |
||
| Thomas Weisel Partners LLC |
||
| Roth Capital Partners |
||
| Moelis & Company LLC |
||
| Total |
||
Of the shares to be purchased by the underwriters, will be purchased from us and will be purchased from the selling stockholders.
The underwriting agreement provides that the obligations of the several underwriters are subject to various conditions, including approval of legal matters by counsel. The nature of the underwriters’ obligations commits them to purchase and pay for all of the shares of common stock listed above if any are purchased.
The underwriters expect to deliver the shares of common stock to purchasers on or about , 2009.
OVER-ALLOTMENT OPTION
We and the selling stockholders named in this prospectus have granted a 30-day option to the underwriters to purchase up to additional shares of our common stock at the public offering price, less the underwriting discount, as set forth on the cover page of this prospectus. If the underwriters exercise this option in whole or in part, then each of the underwriters will be separately committed, subject to the conditions described in the underwriting agreement, to purchase the additional shares of our common stock in proportion to their respective commitments set forth in the table above.
COMMISSIONS AND DISCOUNTS
The underwriters propose to offer the shares of common stock directly to the public at the public offering price set forth on the cover page of this prospectus, and at this price less a concession not in excess of $ per share of common stock to other dealers specified in a master agreement among underwriters who are members of the Financial Industry Regulatory Association. The underwriters may allow, and the other dealers specified may re-allow, concessions not in excess of $ per share of common stock to these other dealers. After this offering, the offering price, concessions and other selling terms may be changed by the underwriters. Our common stock is offered subject to receipt and acceptance by the underwriters and to the other conditions, including the right to reject orders in whole or in part.
112
Table of Contents
Underwriting
The following table summarizes the compensation to be paid to the underwriters by us and the selling stockholders and the proceeds, before expenses, payable to us and the selling stockholders:
| Per share
|
Total | ||||||||
| Without over-allotment |
With over-allotment | ||||||||
| Public offering price |
$ | $ | $ | ||||||
| Underwriting discount paid by us |
$ | $ | $ | ||||||
| Underwriting discount paid by selling stockholders |
$ | $ | $ | ||||||
| Proceeds, before expenses, to us |
$ | $ | $ | ||||||
| Proceeds, before expenses, to the selling stockholders |
$ | $ | $ | ||||||
The expenses of the offering, not including the underwriting discount, are estimated at approximately $ million and are payable by us. We have agreed to reimburse the underwriters for all reasonable expenses of this offering, including reasonable legal fees and disbursements related to any required review by FINRA.
In addition, in connection with the offering, we will also pay a transaction advisory fee of $200,000 to Thomas Weisel Partners LLC.
INDEMNIFICATION OF UNDERWRITERS
We and the selling stockholders have agreed to indemnify the underwriters against any losses, claims, damages or liabilities to which the underwriters may become subject, under the Securities Act or otherwise, insofar as such losses, claims damages or liabilities (or actions in respect thereof) arise out of or are based upon an untrue statement or alleged untrue statement of a material fact included in, or the omission of or alleged omission of a material fact from, this prospectus, the registration statement of which this prospectus is a part or any free writing prospectus, as well as payments or other expenses related to the underwriters’ investigating or defending any action or claim. If the indemnification provided by us and the selling stockholders is unavailable or insufficient to indemnify the underwriters for such losses, claims damages or liabilities (or actions in respect thereof), we and the selling stockholders have agreed to contribute to the amount paid or payable by the underwriters as a result of such losses, claims, damages or liabilities (or actions in respect thereof) in such proportion as is appropriate to reflect the relative benefits received by us and the selling stockholders on the one hand and the underwriters on the other hand from this offering. Each selling stockholder’s obligation to indemnify the underwriters against any losses, claims, damages or liabilities shall be only to the extent that an untrue statement or alleged untrue statement of a material fact or omission or alleged omission of a material fact was made in this prospectus, the registration statement of which this prospectus is a part or any free writing prospectus in reliance upon and in conformity with information relating to such selling stockholder furnished to us in writing by such selling stockholder expressly for use herein or therein. The liability of each selling stockholder under the indemnity and contribution provisions of the underwriting agreement shall be limited to an amount equal to the public offering price of the shares of common stock sold by such selling stockholder, less the underwriting discount, as set forth on the front cover page hereof. The indemnification and contribution obligations of our company and the selling stockholders shall not apply to any losses, claims, damages or liabilities arising out of or based upon an untrue statement or alleged untrue statement of a material fact included in, or the omission of or alleged omission of a material fact from, this prospectus, the registration statement of which this prospectus is a part or any free writing prospectus made in reliance upon written information furnished to us by the underwriters.
113
Table of Contents
Underwriting
NO SALES OF SIMILAR SECURITIES
All of our directors, certain of our executive officers and Gores have agreed not to offer, sell, contract to sell, pledge, grant any option to purchase, make any short sale or otherwise transfer or dispose of, either directly or indirectly, any shares of common stock, any options or warrants to purchase any shares of common stock or any securities convertible into or exchangeable for shares of common stock, owned directly by them or with respect to which they have beneficial ownership and whether owned as of the date of this prospectus or hereafter acquired, without the prior written consent of UBS Securities LLC and Thomas Weisel Partners LLC for a period of 180 days after the date of this prospectus. Holders who received our common stock in connection with the Securities Purchase Agreement and CBS Radio have agreed to the above restrictions for a period of 120 days after the date of this prospectus. Notwithstanding the foregoing, if (a) during the period that begins on the date that is 15 calendar days plus three business days before the last day of the 180-day period or the 120-day period, as applicable, and ends on the last day of the 180-day period or the 120-day period, as applicable, we issue an earnings release or publicly announce material news or if a material event relating to us occurs, or (b) prior to the expiration of the 180-day period or the 120-day period, as applicable, we announce that we will release earnings results during the 16-day period beginning on the last day of the 180-day period or the 120-day period, as applicable, the above restrictions will continue to apply until the expiration of the 15 calendar day plus three business day period after the date we issued the earnings release, publicly announced the material news or the material event occurred unless otherwise waived by UBS Securities LLC and Thomas Weisel Partners LLC. Each of UBS Securities LLC and Thomas Weisel Partners LLC has advised us that it does not have any pre-established conditions to shortening or waiving the terms of lock-up agreements and that it would consider doing so after evaluating the facts and circumstances of each person’s request. We do not anticipate requesting a waiver or shortening of the lock-up agreements from UBS Securities LLC and Thomas Weisel Partners LLC and have no reason to believe that any person who has or will enter into a lock-up agreement with UBS Securities LLC and Thomas Weisel Partners LLC in connection with the offering will make such a request.
The restrictions described in the immediately preceding paragraph do not apply to:
| Ø | sales of shares of common stock offered in this offering; |
| Ø | transactions relating to shares of common stock acquired in open market transactions after the completion of the offering; |
| Ø | exercises of options or warrants by the holders thereof; |
| Ø | sales to us; |
| Ø | the transfer of shares of common stock by gift, will or intestacy; |
| Ø | the transfer of shares to any trust for the stockholder’s direct or indirect benefit or a member of the immediate family of the stockholder; and |
| Ø | the distribution of shares of common stock to partners, members, stockholders or affiliates of our stockholders; |
provided that in the case of each of the last three types of transactions, subject to limited exceptions, each donee, distributee, transferee and recipient agrees to be subject to the restrictions described in the immediately preceding paragraph and no filing under Section 16 of the Exchange Act is required or shall be made voluntarily in connection with these transactions. In addition, our directors and officers are permitted under certain circumstances to enter into a written plan or agreement that meets the requirements of Rule 10b5-1 under the Securities Exchange Act.
114
Table of Contents
Underwriting
We have agreed that for a period of 180 days after the date of this prospectus, we will not, without the prior written consent of UBS Securities LLC and Thomas Weisel Partners LLC, offer, sell or otherwise dispose of any shares of common stock, except for:
| Ø | the shares of common stock offered in this offering; |
| Ø | the shares of common stock issuable upon exercise of options outstanding on the date of this prospectus; and |
| Ø | the shares of our common stock that are issued under the equity incentive plans described in this prospectus. |
These restrictions will remain in effect beyond the 180-day period under the same circumstances described above.
NASDAQ GLOBAL MARKET LISTING
We have applied to list our common stock on the NASDAQ Global Market under the trading symbol “WWON.”
SHORT SALES, STABILIZING TRANSACTIONS AND PENALTY BIDS
In order to facilitate this offering, persons participating in this offering may engage in transactions that stabilize, maintain or otherwise affect the price of our common stock during and after this offering. Specifically, the underwriters may engage in the following activities in accordance with SEC rules.
Short sales. Short sales involve the sales by the underwriters of a greater number of shares than they are required to purchase in the offering. Covered short sales are short sales made in an amount not greater than the underwriters’ over-allotment option to purchase additional shares from us and the selling stockholders in this offering. The underwriters may close out any covered short position by either exercising their over-allotment option to purchase shares or purchasing shares in the open market. In determining the source of shares to close out the covered short position, the underwriters will consider, among other things, the price of shares available for purchase in the open market as compared to the price at which they may purchase shares through the over-allotment option. Naked short sales are any short sales in excess of such over-allotment option. The underwriters must close out any naked short position by purchasing shares in the open market. A naked short position is more likely to be created if the underwriters are concerned that there may be downward pressure on the price of the common stock in the open market after pricing that could adversely affect investors who purchase in this offering.
Stabilizing transactions. The underwriters may make bids for or purchases of the shares for the purpose of pegging, fixing or maintaining the price of the shares, so long as stabilizing bids do not exceed a specified maximum.
Penalty bids. If the underwriters purchase shares in the open market in a stabilizing transaction or syndicate covering transaction, they may reclaim a selling concession from the underwriters and selling group members who sold those shares as part of this offering. Stabilization and syndicate covering transactions may cause the price of the shares to be higher than it would be in the absence of these transactions. The imposition of a penalty bid might also have an effect on the price of the shares if it discourages presales of the shares.
The transactions above may have the effect of raising or maintaining the market price of our common stock or preventing or retarding a decline in the market price of our common stock. As a result, the price of our common stock may be higher than the price that might otherwise exist in the open market. The
115
Table of Contents
Underwriting
transactions above may occur on the NASDAQ Global Market or otherwise. Neither we nor the underwriters make any representation or prediction as to the effect that the transactions described above may have on the price of the shares. If these transactions are commenced, they may be discontinued without notice at any time.
DISCRETIONARY SALES
The underwriters have informed us that they do not intend to confirm sales to discretionary accounts that exceed 5% of the total number of shares offered by them.
STAMP TAXES
If you purchase shares of common stock offered in this prospectus, you may be required to pay stamp taxes and other charges under the laws and practices of the country of purchase, in addition to the public offering price listed on the cover page of this prospectus.
RELATIONSHIPS
The underwriters may in the future perform investment banking and advisory services for us from time to time for which they may in the future receive customary fees and expenses. The underwriters may, from time to time, engage in transactions with or perform services for us in the ordinary course of their business.
116
Table of Contents
The validity of the shares of common stock offered by this prospectus has been passed upon for us by Richards, Layton & Finger, P.A. Certain other legal matters relating to the issuance and sale of common stock have been passed upon for us by Proskauer Rose LLP and for the underwriters by Paul, Hastings, Janofsky & Walker LLP. Proskauer Rose LLP has represented The Gores Group and the underwriters from time to time on unrelated matters.
The audited financial statements as of December 31, 2008 and December 31, 2007 and for each of the three years in the period ended December 31, 2008 included in this prospectus and management’s assessment of the effectiveness of internal control over financial reporting (which is included in Management’s Report on Internal Control over Financial Reporting) incorporated in this prospectus by reference to the Annual Report on Form 10-K of Westwood One, Inc. for the year ended December 31, 2008 have been so included or incorporated in reliance on the report (which contains a paragraph relating to certain actions taken by management to remove substantial doubt about our ability to continue as a going concern) of PricewaterhouseCoopers LLP, an independent registered public accounting firm, given on the authority of said firm as experts in auditing and accounting.
117
Table of Contents
Where you can find more information and incorporation by reference
We have filed with the SEC a registration statement on Form S-1 under the Securities Act with respect to the shares of common stock we are offering. This prospectus and the information incorporated by reference herein contains all information about us and our common stock that may be material to an investor in this offering. The registration statement includes exhibits to which you should refer for additional information about us.
We file with or submit to the SEC annual, quarterly and current periodic reports, proxy statements and other information meeting the informational requirements of the Exchange Act. This information is available free of charge by calling us collect at (212) 641-2000, by written request directed to us at Westwood One, Inc., 40 West 57th Street, 5th Floor, New York, NY or on our website at www.westwoodone.com. You also may inspect and copy these reports, proxy statements and other information, as well as the registration statement and related exhibits and schedules, at the Public Reference Room of the SEC at 100 F Street, NE, Washington, D.C. 20549. You may obtain information on the operation of the Public Reference Room by calling the SEC at 1-800-SEC-0330. The SEC maintains an Internet site that contains reports, proxy and information statements and other information filed electronically by us with the SEC which are available on the SEC’s Internet site at www.sec.gov. Copies of these reports, proxy and information statements and other information may be obtained, after paying a duplicating fee, by electronic request at the following e-mail address: publicinfo@sec.gov, or by writing the SEC’s Public Reference Room, 100 F Street, NE, Washington, D.C. 20549-0102.
The SEC allows us to “incorporate by reference” documents we file with the SEC into this prospectus, which means that we can disclose important information to you by referring you to those documents. The information incorporated by reference is considered part of this prospectus. Any statement in this prospectus or incorporated by reference into this prospectus shall be automatically modified or superseded for purposes of this prospectus to the extent that a statement contained herein or in a subsequently filed document that is incorporated by reference into this prospectus modifies or supersedes such prior statement. Any statement so modified or superseded shall not be deemed, except as so modified or superseded, to constitute a part of this prospectus and prior to the termination of the offering.
The following documents have been filed by us with the SEC and are incorporated by reference into this prospectus:
| Ø | Amendment No. 1 to the Annual Report on Form 10-K for the fiscal year ended December 31, 2008 (filed with the SEC on April 30, 2009); |
| Ø | Quarterly Report on Form 10-Q for the quarterly period ended March 31, 2009 (filed with the SEC on May 11, 2009); |
| Ø | Current Reports on Form 8-K or Form 8-K/A filed with the SEC on March 5, 2009, April 6, 2009, April 27, 2009 (two reports), June 18, 2009, June 22, 2009, June 26, 2009, July 8, 2009, August 25, 2009, August 26, 2009 and October 15, 2009 (with the exception of any information contained in such documents which has been “furnished” under Item 2.02 and/or Item 7.01 of Form 8-K, which information is not deemed “filed” and which is not incorporated by reference into this prospectus); |
| Ø | Definitive Proxy Statement on Schedule 14A filed with the SEC on July 20, 2009; |
| Ø | Quarterly Report on Form 10-Q for the quarterly period ended June 30, 2009 (filed with the SEC on August 14, 2009) as amended on August 21, 2009. |
118
Table of Contents
Index to consolidated financial statements and financial statement schedule
| Page | ||
| Audited Consolidated Financial Statements |
||
| F-2 | ||
| F-4 | ||
| Consolidated Statements of Operations for the years ended December 31, 2008, 2007 and 2006 |
F-5 | |
| F-6 | ||
| Consolidated Statements of Cash Flows for the years ended December 31, 2008, 2007 and 2006 |
F-7 | |
| F-8 | ||
| Financial Statement Schedule: |
||
| F-43 | ||
| All other schedules have been omitted because they are not applicable, the required information is immaterial, or the required information is included in the consolidated financial statements or notes thereto. | ||
| Unaudited Consolidated Financial Statements |
||
| F-44 | ||
| F-45 | ||
| F-46 | ||
| F-47 | ||
| F-48 | ||
F-1
Table of Contents
Report of independent registered public accounting firm
To the Shareholders and Board of Directors of Westwood One, Inc:
In our opinion, the consolidated financial statements listed in the accompanying index present fairly, in all material respects, the financial position of Westwood One, Inc. and its subsidiaries at December 31, 2008 and December 31, 2007, and the results of their operations and their cash flows for each of the three years in the period ended December 31, 2008 in conformity with accounting principles generally accepted in the United States of America. In addition, in our opinion, the financial statement schedule listed in the accompanying index presents fairly, in all material respects, the information set forth therein when read in conjunction with the related consolidated financial statements. Also in our opinion, the Company maintained, in all material respects, effective internal control over financial reporting as of December 31, 2008, based on criteria established in Internal Control — Integrated Framework issued by the Committee of Sponsoring Organizations of the Treadway Commission (COSO). The Company’s management is responsible for these financial statements and financial statement schedule, for maintaining effective internal control over financial reporting and for its assessment of the effectiveness of internal control over financial reporting, included in Management’s Report on Internal Control over Financial Reporting, appearing under Item 9A of the Company’s Form 10-K for the year ended December 31, 2008 (not presented herein). Our responsibility is to express opinions on these financial statements, on the financial statement schedule, and on the Company’s internal control over financial reporting based on our integrated audits. We conducted our audits in accordance with the standards of the Public Company Accounting Oversight Board (United States). Those standards require that we plan and perform the audits to obtain reasonable assurance about whether the financial statements are free of material misstatement and whether effective internal control over financial reporting was maintained in all material respects. Our audits of the financial statements included examining, on a test basis, evidence supporting the amounts and disclosures in the financial statements, assessing the accounting principles used and significant estimates made by management, and evaluating the overall financial statement presentation. Our audit of internal control over financial reporting included obtaining an understanding of internal control over financial reporting, assessing the risk that a material weakness exists, and testing and evaluating the design and operating effectiveness of internal control based on the assessed risk. Our audits also included performing such other procedures as we considered necessary in the circumstances. We believe that our audits provide a reasonable basis for our opinions.
We previously concluded that there was substantial doubt about the Company’s ability to continue as a going concern. As discussed in Note 1, management has subsequently taken certain actions which we have concluded remove that substantial doubt.
A company’s internal control over financial reporting is a process designed to provide reasonable assurance regarding the reliability of financial reporting and the preparation of financial statements for external purposes in accordance with generally accepted accounting principles. A company’s internal control over financial reporting includes those policies and procedures that: (1) pertain to the maintenance of records that, in reasonable detail, accurately and fairly reflect the transactions and dispositions of the assets of the company; (2) provide reasonable assurance that transactions are recorded as necessary to permit preparation of financial statements in accordance with generally accepted accounting principles, and that receipts and expenditures of the company are being made only in accordance with authorizations of management and directors of the company; and (3) provide reasonable assurance regarding prevention or timely detection of unauthorized acquisition, use, or disposition of the company’s assets that could have a material effect on the financial statements.
F-2
Table of Contents
Report of independent registered public accounting firm
Because of its inherent limitations, internal control over financial reporting may not prevent or detect misstatements. Also, projections of any evaluation of effectiveness to future periods are subject to the risk that controls may become inadequate because of changes in conditions, or that the degree of compliance with the policies or procedures may deteriorate.
/s/ PricewaterhouseCoopers LLP
New York, New York
March 30, 2009, except with respect to our opinion on the consolidated financial statements insofar as it relates to (i) the disclosures under the heading “Basis of Presentation, Going Concern and Management Plans Update” in Note 1 and (ii) discussion of the April 23, 2009 refinancing and recapitalization transaction in Note 6 and Note 20, as to which the date is June 22, 2009 and (iii) the effects of the reverse stock split as discussed under the heading “Earnings per Share” in Note 1, as to which the date is August 24, 2009.
F-3
Table of Contents
Consolidated balance sheet
(In thousands, except share and per share amounts)
| December 31, 2008 |
December 31, 2007 |
|||||||
| ASSETS |
||||||||
| CURRENT ASSETS: |
||||||||
| Cash and cash equivalents |
$ | 6,437 | $ | 6,187 | ||||
| Accounts receivable, net of allowance for doubtful accounts of $3,632 (2008) and $3,602 (2007) |
94,273 | 108,271 | ||||||
| Warrants, current portion |
— | 9,706 | ||||||
| Prepaid and other assets |
18,758 | 13,990 | ||||||
| Total Current Assets |
119,468 | 138,154 | ||||||
| Property and equipment, net |
30,417 | 33,012 | ||||||
| Goodwill |
33,988 | 464,114 | ||||||
| Intangible assets, net |
2,660 | 3,443 | ||||||
| Deferred tax asset |
14,220 | 12,916 | ||||||
| Other assets |
4,335 | 18,118 | ||||||
| TOTAL ASSETS |
$ | 205,088 | $ | 669,757 | ||||
| LIABILITIES, REDEEMABLE PREFERRED STOCK AND SHAREHOLDERS’ EQUITY (DEFICIT) |
||||||||
| CURRENT LIABILITIES: |
||||||||
| Accounts payable |
$ | 27,807 | $ | 17,378 | ||||
| Amounts payable to related parties |
22,680 | 30,859 | ||||||
| Deferred revenue |
2,397 | 5,815 | ||||||
| Income taxes payable |
— | 7,246 | ||||||
| Accrued expenses and other liabilities |
25,565 | 29,562 | ||||||
| Current maturity of long-term debt |
249,053 | — | ||||||
| Total Current Liabilities |
327,502 | 90,860 | ||||||
| Long-term debt |
— | 345,244 | ||||||
| Other liabilities |
6,993 | 6,022 | ||||||
| TOTAL LIABILITIES |
334,495 | 442,126 | ||||||
| Commitments and Contingencies |
||||||||
| Redeemable preferred stock: $.01 par value, authorized: 10,000 shares; issued and outstanding: 75 shares of Series A Convertible Preferred Stock; liquidation preference $1,000 per share, plus accumulated dividends |
73,738 | — | ||||||
| SHAREHOLDERS’ (DEFICIT) EQUITY |
||||||||
| Common stock, $.01 par value: authorized: 300,000 shares; issued and outstanding: 101,253 (2008) and 87,105 (2007) |
1,013 | 872 | ||||||
| Class B stock, $ .01 par value: authorized: 3,000 shares; issued and outstanding: 292 (2008 and 2007) |
3 | 3 | ||||||
| Additional paid-in capital |
293,120 | 290,786 | ||||||
| Net unrealized gain |
267 | 5,955 | ||||||
| Accumulated deficit |
(497,548 | ) | (69,985 | ) | ||||
| TOTAL SHAREHOLDERS’ (DEFICIT) EQUITY |
(203,145 | ) | 227,631 | |||||
| TOTAL LIABILITIES, REDEEMABLE PREFERRED STOCK AND SHAREHOLDERS’ EQUITY (DEFICIT) |
$ | 205,088 | $ | 669,757 | ||||
See accompanying notes to consolidated financial statements
F-4
Table of Contents
Consolidated statements of operations
(In thousands, except per share amounts)
| Year ended December 31, | ||||||||||||
| 2008 | 2007 | 2006 | ||||||||||
| Recast-note 1 | Recast-note 1 | Recast-note 1 | ||||||||||
| NET REVENUE |
$ | 404,416 | $ | 451,384 | $ | 512,085 | ||||||
| Operating Costs (includes related party expenses of $73,049, $66,633 and $75,514 respectively) |
360,492 | 350,440 | 395,196 | |||||||||
| Depreciation and Amortization (includes related party warrant amortization of $1,618, $9,706 and $9,706 respectively) |
11,052 | 19,840 | 20,756 | |||||||||
| Corporate General and Administrative Expenses (includes related party expenses of $610, $3,394 and $3,273, respectively) |
13,442 | 13,171 | 14,618 | |||||||||
| Goodwill Impairment |
430,126 | — | 515,916 | |||||||||
| Restructuring Charges |
14,100 | — | — | |||||||||
| Special Charges (includes related party expenses of $5,000, $0 and $0, respectively) |
13,245 | 4,626 | 1,579 | |||||||||
| 842,457 | 388,077 | 948,065 | ||||||||||
| OPERATING (LOSS) INCOME |
(438,041 | ) | 63,307 | (435,980 | ) | |||||||
| Interest Expense |
16,651 | 23,626 | 25,590 | |||||||||
| Other Income |
(12,369 | ) | (411 | ) | (926 | ) | ||||||
| INCOME TAX (BENEFIT) EXPENSE |
(14,760 | ) | 15,724 | 8,809 | ||||||||
| NET (LOSS) INCOME |
$ | (427,563 | ) | $ | 24,368 | $ | (469,453 | ) | ||||
| NET (LOSS) INCOME attributable to Common Shareholders |
$ | (430,644 | ) | $ | 24,363 | $ | (469,528 | ) | ||||
| (LOSS) EARNINGS PER SHARE (Recast-Note 1) |
||||||||||||
| COMMON STOCK |
||||||||||||
| BASIC |
$ | (878.73 | ) | $ | 56.59 | $ | (1,091.76 | ) | ||||
| DILUTED |
$ | (878.73 | ) | $ | 56.38 | $ | (1,091.76 | ) | ||||
| CLASS B STOCK |
||||||||||||
| BASIC |
$ | — | $ | 3.20 | $ | 51.20 | ||||||
| DILUTED |
$ | — | $ | 3.20 | $ | 51.20 | ||||||
| WEIGHTED AVERAGE SHARES OUTSTANDING (Recast-Note 1): |
||||||||||||
| COMMON STOCK |
||||||||||||
| BASIC |
490 | 431 | 430 | |||||||||
| DILUTED |
490 | 432 | 430 | |||||||||
| CLASS B STOCK |
||||||||||||
| BASIC |
1 | 1 | 1 | |||||||||
| DILUTED |
1 | 1 | 1 | |||||||||
See accompanying notes to consolidated financial statements
F-5
Table of Contents
Consolidated statements of shareholders’ (deficit) equity
(In thousands)
| Additional paid-in capital |
(Accumulated retained earnings |
Unrealized for sale securities |
Total holders’ equity |
Compre- income |
|||||||||||||||||||||||||||||||||||
| Common stock | Class B stock | Treasury stock | |||||||||||||||||||||||||||||||||||||
| Shares | Amount | Shares | Amount | Shares | Amount | ||||||||||||||||||||||||||||||||||
| Balance as of December 31, 2005 |
86,674 | $ | 867 | 292 | $ | 3 | $ | 300,419 | $ | 402,740 | $ | — | — | $ | — | $ | 704,029 | ||||||||||||||||||||||
| Net loss for 2006 |
— | — | — | — | — | (469,453 | ) | — | — | — | (469,453 | ) | (469,453 | ) | |||||||||||||||||||||||||
| Comprehensive income |
— | — | — | — | — | — | 4,570 | — | — | 4,570 | 4,570 | ||||||||||||||||||||||||||||
| Equity based compensation |
— | — | — | — | 12,269 | — | — | — | — | 12,269 | — | ||||||||||||||||||||||||||||
| Issuance common stock under equity based compensation plans |
387 | 4 | — | — | 388 | — | — | — | — | 392 | — | ||||||||||||||||||||||||||||
| Excess windfall (shortfall) benefits on stock option exercises |
— | — | — | — | (131 | ) | — | — | — | — | (131 | ) | — | ||||||||||||||||||||||||||
| Cancellations of vested equity grants |
— | — | — | — | (10,351 | ) | — | — | — | — | (10,351 | ) | — | ||||||||||||||||||||||||||
| Cancellation of warrants |
— | — | — | — | 290 | — | — | — | — | 290 | — | ||||||||||||||||||||||||||||
| Cash dividend paid |
— | — | — | — | — | (27,640 | ) | — | — | — | (27,640 | ) | — | ||||||||||||||||||||||||||
| Purchase of treasury stock |
— | — | — | — | — | — | — | (750 | ) | (11,044 | ) | (11,044 | ) | — | |||||||||||||||||||||||||
| Retirement of treasury stock |
(750 | ) | (7 | ) | — | — | (11,037 | ) | — | — | 750 | 11,044 | — | — | |||||||||||||||||||||||||
| Balance as of December 31, 2006 |
86,311 | $ | 864 | 292 | $ | 3 | $ | 291,847 | $ | (94,353 | ) | $ | 4,570 | — | $ | — | $ | 202,931 | $ | (464,883 | ) | ||||||||||||||||||
| Net income for 2007 |
— | — | — | — | — | 24,368 | — | — | — | 24,368 | 24,368 | ||||||||||||||||||||||||||||
| Comprehensive income |
— | — | — | — | — | — | 1,385 | — | — | 1,385 | 1,385 | ||||||||||||||||||||||||||||
| Equity based compensation |
— | — | — | — | 9,606 | — | — | — | — | 9,606 | — | ||||||||||||||||||||||||||||
| Issuance common stock under equity based compensation plans |
794 | 8 | — | — | (344 | ) | — | — | — | — | (336 | ) | — | ||||||||||||||||||||||||||
| Cancellations of vested equity grants |
— | — | — | — | (7,099 | ) | — | — | — | — | (7,099 | ) | — | ||||||||||||||||||||||||||
| Cancellation of warrants |
— | — | — | — | (1,561 | ) | — | — | — | — | (1,561 | ) | — | ||||||||||||||||||||||||||
| Cash dividend paid |
— | — | — | — | (1,663 | ) | — | — | — | — | (1,663 | ) | — | ||||||||||||||||||||||||||
| Balance as of December 31, 2007 |
87,105 | $ | 872 | 292 | $ | 3 | $ | 290,786 | $ | (69,985 | ) | $ | 5,955 | — | $ | — | $ | 227,631 | $ | 25,753 | |||||||||||||||||||
| Net loss for 2008 |
— | — | — | — | — | (427,563 | ) | — | — | — | (427,563 | ) | (427,563 | ) | |||||||||||||||||||||||||
| Comprehensive income |
— | — | — | — | — | — | (5,688 | ) | — | — | (5,688 | ) | (5,688 | ) | |||||||||||||||||||||||||
| Equity based compensation |
— | — | — | — | 5,443 | — | — | — | — | 5,443 | — | ||||||||||||||||||||||||||||
| Issuance common stock under equity based compensation plans |
110 | 1 | — | — | (1,727 | ) | — | — | — | — | (1,726 | ) | — | ||||||||||||||||||||||||||
| Issuance of common stock |
14,038 | 140 | — | — | 22,471 | — | — | — | — | 22,611 | — | ||||||||||||||||||||||||||||
| Issuance of warrants |
— | — | — | — | 440 | — | — | — | — | 440 | — | ||||||||||||||||||||||||||||
| Cancellations of vested equity grants |
— | — | — | — | (4,722 | ) | — | — | — | — | (4,722 | ) | — | ||||||||||||||||||||||||||
| Cancellation of warrants |
— | — | — | — | (19,571 | ) | — | — | — | — | (19,571 | ) | — | ||||||||||||||||||||||||||
| Balance as of December 31, 2008 |
101,253 | $ | 1,013 | 292 | $ | 3 | $ | 293,120 | $ | (497,548 | ) | $ | 267 | — | $ | — | $ | (203,145 | ) | $ | (433,251 | ) | |||||||||||||||||
See accompanying notes to consolidated financial statements
F-6
Table of Contents
Consolidated statements of cash flows
(In thousands)
| Year ended December 31, | ||||||||||||
| 2008 | 2007 | 2006 | ||||||||||
| CASH FLOW FROM OPERATING ACTIVITIES: |
||||||||||||
| Net (loss) income |
$ | (427,563 | ) | $ | 24,368 | $ | (469,453 | ) | ||||
| Adjustments to reconcile net (loss) income to net cash provided by operating activities: |
||||||||||||
| Depreciation and amortization |
11,052 | 19,840 | 20,756 | |||||||||
| Goodwill Impairment |
430,126 | — | 515,916 | |||||||||
| Loss on disposal of property and equipment |
1,257 | — | — | |||||||||
| Deferred taxes |
(13,907 | ) | (6,480 | ) | (20,546 | ) | ||||||
| Non-cash stock compensation |
5,443 | 9,606 | 12,269 | |||||||||
| Gain on sale of marketable securities |
(12,420 | ) | — | — | ||||||||
| Amortization of deferred financing costs |
1,674 | 481 | 359 | |||||||||
| (4,338 | ) | 47,815 | 59,301 | |||||||||
| Changes in assets and liabilities: |
||||||||||||
| Decrease in Accounts receivable |
13,998 | 7,234 | 17,278 | |||||||||
| (Increase) Decrease in Prepaid and other assets |
(2,515 | ) | (990 | ) | 6,367 | |||||||
| (Decrease) in Deferred revenue |
(3,418 | ) | (2,335 | ) | (936 | ) | ||||||
| (Decrease) Increase in Income taxes payable |
(7,246 | ) | 1,097 | (15,724 | ) | |||||||
| Increase (Decrease) in Accounts payable, accrued expenses and other liabilities |
13,736 | (29,435 | ) | 32,813 | ||||||||
| (Decrease) Increase in Amounts payable to related parties |
(8,179 | ) | 4,515 | 5,152 | ||||||||
| Net Cash Provided By Operating Activities |
2,038 | 27,901 | 104,251 | |||||||||
| CASH FLOW FROM INVESTING ACTIVITIES: |
||||||||||||
| Capital expenditures |
(7,313 | ) | (5,849 | ) | (5,880 | ) | ||||||
| Proceeds from sale of marketable securities |
12,741 | — | — | |||||||||
| Collection of loan receivable |
— | — | 2,000 | |||||||||
| Acquisition of companies and other |
— | — | 75 | |||||||||
| Net Cash Provided (Used) In Investing Activities |
5,428 | (5,849 | ) | (3,805 | ) | |||||||
| CASH FLOW FROM FINANCING ACTIVITIES: |
||||||||||||
| Issuance of common stock |
22,760 | — | 392 | |||||||||
| Issuance of series A convertible preferred stock and warrants |
74,168 | — | — | |||||||||
| Debt repayments and payments of capital lease obligations |
(104,737 | ) | (25,730 | ) | (60,685 | ) | ||||||
| Termination of swap contracts |
2,150 | — | — | |||||||||
| Dividend payments |
— | (1,663 | ) | (27,640 | ) | |||||||
| Repurchase of common stock |
— | — | (11,044 | ) | ||||||||
| Deferred financing costs |
(1,556 | ) | — | (352 | ) | |||||||
| Excess windfall tax benefits from stock option exercises |
— | — | 12 | |||||||||
| Net Cash Used in Financing Activities |
(7,216 | ) | (27,393 | ) | (99,317 | ) | ||||||
| NET INCREASE (DECREASE) IN CASH AND CASH EQUIVALENTS |
250 | (5,341 | ) | 1,129 | ||||||||
| CASH AND CASH EQUIVALENTS AT BEGINNING OF PERIOD |
6,187 | 11,528 | 10,399 | |||||||||
| CASH AND CASH EQUIVALENTS AT END OF PERIOD |
$ | 6,437 | $ | 6,187 | $ | 11,528 | ||||||
See accompanying notes to consolidated financial statements
F-7
Table of Contents
Westwood One, Inc.
Notes to consolidated financial statements
(in thousands, except per share amounts)
NOTE 1
Nature of business
In this report, “Westwood One,” “Company,” “registrant,” “we,” “us” and “our” refer to Westwood One, Inc. We are a provider of programming, information services and content to the radio, TV and digital sectors. We are one of the largest domestic outsource providers of traffic reporting services and one of the nation’s largest radio networks, producing and distributing national news, sports, talk, music and special event programs, in addition to local news, sports, weather, video news and other information programming. We deliver our content to over 5,000 radio and television stations in the US. The commercial airtime that we sell to our advertisers is acquired from radio and television affiliates in exchange for our programming, content, information, and in certain circumstances, cash compensation.
From 1994 to 2008, Westwood One was managed by CBS Radio, Inc. (“CBS Radio”, previously known as Infinity Broadcasting Corporation (“Infinity”), a wholly-owned subsidiary of CBS Corporation, pursuant to a management agreement between us and CBS Radio (then Infinity) which was scheduled to expire on March 31, 2009 (the “Management Agreement”). On October 2, 2007, we entered into a new arrangement with CBS Radio that was approved by shareholders on February 12, 2008 and became effective on March 3, 2008. On such date, the Management Agreement terminated. See Note 2—“Related Party Transactions” for additional information with respect to the new arrangement.
Basis of presentation, going concern and management plans update
The accompanying consolidated financial statements have been prepared assuming we will continue as a going concern. We have incurred significant declines in operating results since 2002. In the fourth quarter of 2008, we failed to pay our most recent semi-annual interest payment due in respect of the existing Senior Notes and were not in compliance with our maximum leverage ratio covenant under the existing Facility and the Senior Notes at December 31, 2008. Both of these events constitute a separate default under the existing Term Loan and Revolving Credit Facility (collectively the “Facility”) and the Senior Notes. In addition, on February 27, 2009, our outstanding Facility matured and became due and payable in its entirety. We did not pay such amount, which also constitutes an event of default under the Facility and the Senior Notes. As of March 30, 2009, our lenders had not sought to exercise remedies that were available to them under applicable law or their respective existing debt agreements. The parties were working on negotiating definitive documentation relating to a refinancing of all of our outstanding indebtedness (approximately $247,000, including unpaid interest see Note 6). Based on the facts and circumstances that existed at March 30, 2009 we concluded that if we were unable to consummate the refinancing or the lenders chose to exercise the remedies available to them, we would have been forced to seek the protection of the bankruptcy laws and that these factors raised substantial doubt about our ability to continue as a going concern.
On April 23, 2009, we completed the refinancing of our outstanding long-term indebtedness and the recapitalization of our equity (see Note 20—Subsequent Events). As part of the recapitalization, we entered into a Securities Purchase Agreement (“Securities Purchase Agreement”) with: (1) holders of the Company’s outstanding Senior Notes both of which were issued under the Note Purchase Agreement, dated as of December 3, 2002 and (2) lenders under the Credit Agreement, dated as of March 3, 2004 (the “Old Credit Agreement”).
F-8
Table of Contents
Notes to consolidated financial statements
(in thousands, except per share amounts)
Pursuant to the Securities Purchase Agreement, in consideration for releasing all of their respective claims under the Senior Notes and the Old Credit Agreement, the debt holders collectively received: (1) $117,500 of new senior secured notes maturing July 15, 2012 (the “New Senior Notes”); (2) 34,962 shares of 8.0% Series B Convertible Preferred Stock, par value $0.01 per share (the “Series B Preferred Stock”); and (3) a one-time cash payment of $25,000. Gores purchased at a discount certain debt held by debt holders who did not wish to participate in the New Senior Notes as set forth in the Securities Purchase Agreement.
In connection with the Debt Restructuring, we also entered into a Credit Agreement (the “Credit Agreement”) with Wells Fargo Foothill, LLC, as the arranger, administrative agent and initial lender, pursuant to which we obtained a $15,000 revolving line of credit (which includes a $1,500 letter of credit sub-facility) on a senior unsecured basis and a $20,000 unsecured non-amortizing term loan, the obligations in respect of which are subordinated to obligations in respect of the New Senior Notes. We borrowed the entire amount of the term loan on the Closing Date and did not make any borrowings under the revolving line of credit. Loans under the Credit Agreement will mature on July 15, 2012 and proceeds of the term loan will be used to, among other things, consummate the transactions contemplated by the Restructuring, and pay fees and expenses in connection therewith. Proceeds of the revolving loans are expected to be used for working capital and general corporate purposes.
In connection with the Equity Restructuring, Gores (1) agreed to purchase, at a discount, certain debt held by debt holders who did not wish to participate in the Senior Notes, (2) agreed to guarantee the Senior Credit Facility and a $10,000 contractual commitment by one of our wholly owned subsidiaries and (3) invested $25,000 in the Company for 25,000 shares of 8.0% Series B Convertible Preferred Stock (the “Series B Convertible Preferred Stock”). In connection with Gores providing the guarantees and purchasing the debt from non-participating holders, the 75,000 shares of 7.0% Series A Convertible Preferred Stock (the “Series A Preferred Stock”) held by Gores immediately prior to the Restructuring, which then had a liquidation preference of approximately $79,000, were exchanged for 75,000 shares of 7.50% Series A-1 Convertible Preferred Stock (the “Series A-1 Preferred Stock”).
As described above, based on the facts and circumstances that existed on March 30, 2009, the Company had previously disclosed there was substantial doubt about its ability to continue as a going concern.
Management has subsequently reviewed the impact of the refinancing and recapitalization, including projected covenant compliance under the new debt, the results of our restructuring plan and our current forecasted results and has concluded that the conditions that gave rise to substantial doubt about the Company’s ability to continue as a going concern have been removed.
Principles of consolidation
The consolidated financial statements include the accounts of all majority and wholly-owned subsidiaries.
Geographic and segment information
Statement of Financial Accounting Standards 131, “Disclosures about Segments of an Enterprise and Related Information” requires disclosure of financial and descriptive information about reportable operating segments, revenue by products or services, and revenue and assets by geographic areas. We
F-9
Table of Contents
Notes to consolidated financial statements
(in thousands, except per share amounts)
established a new organizational structure in the fourth quarter of 2008, pursuant to which we manage and report our business in two operating segments: Network and Metro/Traffic. We evaluated performance based on segment operating (loss) income. Administrative functions such as finance, human resources and information systems are centralized. However, where applicable, portions of the administrative function costs are allocated between the operating segments. The operating segments do not share programming or report distribution.
Revenue recognition
Revenue is recognized when earned, which occurs at the time commercial advertisements are broadcast. Payments received in advance are deferred until earned and such amounts are included as a component of Deferred Revenue in the accompanying Balance Sheet.
We considered matters such as credit and inventory risks, among others, in assessing arrangements with our programming and distribution partners. In those circumstances where we function as the principal in the transaction, the revenue and associated operating costs are presented on a gross basis in the consolidated statement of operations. In those circumstances where we function as an agent or sales representative, our effective commission is presented within Revenue with no corresponding operating expenses.
Barter transactions represent the exchange of commercial announcements for programming rights, merchandise or services. These transactions are recorded at the fair market value of the commercial announcements relinquished, or the fair value of the merchandise and services received. A wide range of factors could materially affect the fair market value of commercial airtime sold in future periods (See the section entitled “Cautionary Statement regarding Forward-Looking Statements” in Item 1 and Item 1A “Risk Factors”), which would require us to increase or decrease the amount of assets and liabilities and related revenue and expenses recorded from prospective barter transactions.
Revenue is recognized on barter transactions when the advertisements are broadcast. Expenses are recorded when the merchandise or service is utilized. Barter revenue of $13,152, $15,854 and $22,923 has been recognized for the years ended December 31, 2008, 2007 and 2006, respectively, and barter expenses of $12,740, $16,116 and $19,433 have been recognized for the years ended December 31, 2008, 2007 and 2006, respectively.
Equity-Based compensation
We account for equity based compensation under Financial Accounting Standards Board Statement of Financial Accounting Standards No. 123 (Revised 2004), “Share-Based Payment” (“SFAS 123R”) which requires that companies record expense for stock compensation on a fair value based method.
Depreciation
Depreciation is computed using the straight line method over the estimated useful lives of the assets, as follows:
| Buildings |
40 years | |
| Leasehold Improvements |
Shorter of life or lease term | |
| Recording, broadcasting and studio equipment |
5 - 10 years | |
| Furniture and equipment and other |
3 - 10 years |
F-10
Table of Contents
Notes to consolidated financial statements
(in thousands, except per share amounts)
Use of estimates
The preparation of financial statements in conformity with generally accepted accounting principles in the United States requires management to make estimates and assumptions that affect the reported amounts of assets, liabilities, revenue and expenses as well as the disclosure of contingent assets and liabilities. Management continually evaluates its estimates and judgments including those related to allowances for doubtful accounts, useful lives of property, plant and equipment and intangible assets and the valuation of such, barter inventory, fair value of stock options granted, forfeiture rate of equity based compensation grants, income taxes and valuation allowances on such and other contingencies. Management bases its estimates and judgments on historical experience and other factors that are believed to be reasonable in the circumstances. Actual results may differ from those estimates under different assumptions or conditions.
Cash equivalents
We consider all highly liquid instruments purchased with a maturity of less than three months to be cash equivalents. The carrying amount of cash equivalents approximates fair value because of the short maturity of these instruments.
Allowance for doubtful accounts
We maintain an allowance for doubtful accounts for estimated losses which may result from the inability of our customers to make required payments. We base our allowance on the likelihood of recoverability of accounts receivable by aging category, based on past experience and taking into account current collection trends that are expected to continue. If economic or specific industry trends worsen beyond our estimates, we would be required to increase our allowance for doubtful accounts. Alternatively, if trends improve beyond our estimates, we would be required to decrease our allowance for doubtful accounts. Our estimates are reviewed periodically, and adjustments are reflected through bad debt expense in the period they become known. Changes in our bad debt experience can materially affect our results of operations. Our allowance for bad debts requires us to consider anticipated collection trends and requires a high degree of judgment. In addition, as fully described herein, our results in any reporting period could be impacted by relatively few but significant bad debts.
Program rights
Program rights are stated at the lower of cost, less accumulated amortization, or net realizable value. Program rights and the related liabilities are recorded when the license period begins and the program is available for use, and are charged to expense when the event is broadcast.
Financial instruments
We use derivative financial instruments (fixed-to-floating interest rate swap agreements) for the purpose of hedging specific exposures and hold all derivatives for purposes other than trading. All derivative financial instruments held reduce the risk of the underlying hedged item and are designated at inception as hedges with respect to the underlying hedged item. Hedges of fair value exposure are entered into in order to hedge the fair value of a recognized asset, liability or a firm commitment. Derivative contracts are entered into with major creditworthy institutions to minimize the risk of credit loss and are structured to be 100% effective. In 2007, we had designated the interest rate swaps as a fair value hedge. Accordingly pursuant to SFAS No. 133, “Accounting for Derivative Instruments and Hedging Activities,” as amended, the fair value of the swaps were included in other current assets (liabilities) on
F-11
Table of Contents
Notes to consolidated financial statements
(in thousands, except per share amounts)
the consolidated balance sheet with a corresponding adjustment to the carrying value of the underlying debt at December 31, 2007. In December 2008 we terminated the remaining interest rate swaps, resulting in cash proceeds of $2,150, which has been classified as a financing cash inflow in our Statement of Cash Flows. The resulting gain of $2,150 from the termination of the derivative contracts is being amortized over the life of the debt.
Goodwill and intangible assets
Goodwill represents the excess of cost over fair value of net assets of businesses acquired. In accordance with Statement of Financial Accounting Standards No. 142 (“SFAS 142”) “Goodwill and Other Intangible Assets”, the value assigned to goodwill and indefinite lived intangible assets is not amortized to expense, but rather the estimated fair value of the reporting unit is compared to its carrying amount on at least an annual basis to determine if there is a potential impairment. If the fair value of the reporting unit is less than its carrying value, an impairment loss is recorded to the extent that the implied fair value of the reporting unit goodwill and intangible assets is less than their carrying value.
Prior to 2008, we operated as a single reportable operating segment: the sale of commercial time. As part of our re-engineering initiative implemented in the second half of 2008, we installed separate management for the Network and Metro/Traffic divisions providing discrete financial information and management oversight. Accordingly, we have determined that each division is an operating segment. A reporting unit is the operating segment or a business which is one level below the operating segment. Our reporting units are consistent with our operating segments and impairment has been tested at this level.
In order to estimate the fair values of assets and liabilities a company may use various methods including discounted cash flows, excess earnings, profit split and income methods. Utilization of any of these methods requires that a company make important assumptions and judgments about future operating results, cash flows, discount rates, and the probability of various scenarios, as well as the proportional contribution of various assets to results and other judgmental allocations. In conjunction with the change to two reporting units, we determined that using the discounted cash flow model in its entirety to be the best evaluation of the fair value of our two reporting units. In prior periods, we evaluated the fair value of our one reporting unit based on a weighted average of seventy-five percent from a discounted cash flow approach and twenty-five percent from the quoted market price of our stock.
On an annual basis and upon the occurrence of certain events, we are required to perform impairment tests on our identified intangible assets with indefinite lives, including goodwill, which testing could impact the value of our business. In 2008, we determined that our goodwill was impaired and recorded impairment charges totaling $430,126 ($206,053 in the second quarter and $224,073 in the fourth quarter as a result of our annual impairment test). The remaining value of our goodwill is approximately $33,988.
Intangible assets subject to amortization primarily consist of affiliation agreements that were acquired in prior years. Such affiliate contracts, when aggregated, create a nationwide audience that is sold to national advertisers. The intangible asset values assigned to the affiliate agreements for each acquisition were determined based upon the expected discounted aggregate cash flows to be derived over the life of the affiliate relationship. The method of amortizing the intangible asset values reflects, based upon our historical experience, an accelerated rate of attrition in the affiliate base over the expected life of the affiliate relationships. Accordingly, we amortized the value assigned to affiliate agreements on an accelerated basis (periods ranging from 4 to 20 years with a weighted-average amortization period of approximately 8 years) consistent with the pattern of cash flows which are expected to be derived. We
F-12
Table of Contents
Notes to consolidated financial statements
(in thousands, except per share amounts)
review the recoverability of our finite-lived intangible assets for recoverability whenever events or circumstances indicate that the carrying amount of an asset may not be recoverable. Recoverability is assessed by comparison to associated undiscounted cash flows. No impairment of intangible assets has been identified in any period presented.
Income taxes
We use the asset and liability method of financial accounting and reporting for income taxes required by Statement of Financial Accounting Standards No. 109 (“SFAS 109”), “Accounting for Income Taxes”. Under SFAS 109, deferred income taxes reflect the tax impact of temporary differences between the amount of assets and liabilities recognized for financial reporting purposes and the amounts recognized for tax purposes.
Effective January 1, 2007, we adopted FIN No. 48, “Accounting for Uncertainty in Income Taxes” which resulted in no material adjustment in the liability for unrecognized tax benefits. We classified interest expense and penalties related to unrecognized tax benefits as income tax expense. FIN 48 clarifies the accounting for uncertainty in income taxes recognized in an enterprise’s financial statements in accordance with SFAS No. 109 and prescribes a recognition threshold and measurement attribute for the financial statement recognition and measurement of a tax position taken or expected to be taken in a tax return. The evaluation of a tax position in accordance with this interpretation is a two-step process. The first step is recognition, in which the enterprise determines whether it is more likely than not that a tax position will be sustained upon examination, including resolution of any related appeals or litigation processes, based on the technical merits of the position. The second step is measurement. A tax position that meets the more-likely-than-not recognition threshold is measured to determine the amount of benefit to recognize in the financial statements.
We determined, based upon the weight of available evidence, that it is more likely than not that our deferred tax asset will be realized. We have experienced a long history of taxable income which would enable us to carryback any potential future net operating losses and taxable temporary differences that can be used as a source of income. As such, no valuation allowance was recorded during the year ended December 31, 2008. We will continue to assess the need for a valuation allowance at each future reporting period.
Earnings per share
We have outstanding two classes of common stock (common stock and Class B stock) and a class of preferred stock (7.50% Series A Convertible Preferred Stock, referred to herein as the “Series A Preferred Stock”). Both the Class B stock and the Series A Preferred Stock are convertible to common stock. With respect to dividend rights, the common stock is entitled to cash dividends of at least ten percent higher than those declared and paid on our Class B stock, and the Series A Preferred Stock is also entitled to dividends as discussed in Note 3 The Series A Preferred Stock is therefore considered a participating security requiring use of the “two-class” method for the computation of basic net income (loss) per share in accordance with EITF 03-06. Losses are not allocated to the Series A Preferred Stock in the computation of basic earnings per share as the Series A Preferred Stock is not obligated to share in losses. Diluted earnings per share is computed using the “if-converted” method.
Basic earnings per share (“EPS”) excludes the effect of common stock equivalents and is computed using the “two-class” computation method, which divides the sum of distributed earnings to common and Class B stockholders and undistributed earnings allocated to Common stockholders and Series A
F-13
Table of Contents
Notes to consolidated financial statements
(in thousands, except per share amounts)
Preferred stockholders on a pro rata basis, after Series A Preferred Stock dividends, by the weighted average number of shares of common stock outstanding during the period. Diluted earnings per share reflects the potential dilution that could result if securities or other contracts to issue common stock were exercised or converted into common stock. Diluted earnings per common share assumes the exercise of stock options using the treasury stock method and the conversion of Class B stock and Series A Preferred Stock using the “if-converted” method.
On August 3, 2009 at a special meeting of stockholders, certain amendments to our Certification of Incorporation (also referred to herein as our Charter) were approved by our stockholders. Such amendments consisted of an increase in the number of authorized shares of our common stock from 300,000,000 to 5,000,000,000 and a two hundred to one (200:1) reverse stock split which was approved and effective on August 3, 2009. Accordingly, the reverse stock split has been reflected retrospectively in EPS for all periods herein. No amounts other than EPS-related amounts have been adjusted to reflect the 200:1 reverse stock split herein.
F-14
Table of Contents
Notes to consolidated financial statements
(in thousands, except per share amounts)
The following is a reconciliation of our shares of common stock and Class B stock outstanding for calculating basic and diluted net (loss) income per share:
| Year ended December 31, | |||||||||||
| 2008 | 2007 | 2006 | |||||||||
| Recast | Recast | Recast | |||||||||
| Net (Losses) Income |
$ | (427,563 | ) | $ | 24,368 | $ | (469,453 | ) | |||
| Less: Accumulated Preferred Stock dividends |
(3,081 | ) | — | — | |||||||
| Less: distributed earnings to Common shareholders |
— | 1,658 | 27,565 | ||||||||
| Less: distributed earnings to Class B shareholders |
— | 5 | 75 | ||||||||
| Undistributed earnings |
$ | (430,644 | ) | $ | 22,705 | $ | (497,093 | ) | |||
| Earnings—Common stock |
|||||||||||
| Basic | |||||||||||
| Distributed earnings to Common shareholders |
$ | — | $ | 1,658 | $ | 27,565 | |||||
| Undistributed earnings allocated to Common shareholders |
(430,644 | ) | 22,705 | (497,093 | ) | ||||||
| Total Earnings—Common stock, basic | $ | (430,644 | ) | $ | 24,363 | $ | (469,528 | ) | |||
| Diluted | |||||||||||
| Distributed earnings to Common shareholders |
$ | — | $ | 1,658 | $ | 27,565 | |||||
| Distributed earnings to Class B shareholders |
— | 5 | — | ||||||||
| Undistributed earnings allocated to Common shareholders |
(430,644 | ) | 22,705 | (497,093 | ) | ||||||
| Total Earnings—Common stock, diluted | $ | (430,644 | ) | $ | 24,368 | $ | (469,528 | ) | |||
| Weighted average Common shares outstanding, basic |
490 | 431 | 430 | ||||||||
| Share-based compensation |
— | — | — | ||||||||
| Warrants |
— | — | — | ||||||||
| Weighted average Class B shares |
— | 1 | — | ||||||||
| Weighted average Common shares outstanding, diluted |
490 | 432 | 430 | ||||||||
| (Loss) Earnings per Common share, basic |
|||||||||||
| Distributed earnings, basic |
$ | — | $ | 3.85 | $ | 64.10 | |||||
| Undistributed earnings—basic |
(873.73 | ) | 52.73 | (1,155.85 | ) | ||||||
| Total |
$ | (873.73 | ) | $ | 56.59 | $ | (1,091.76 | ) | |||
| (Loss) Earnings per Common share, diluted |
|||||||||||
| Distributed earnings, diluted |
$ | — | $ | 3.84 | $ | 64.10 | |||||
| Undistributed earnings—diluted |
(873.73 | ) | 52.54 | (1,155.85 | ) | ||||||
| Total |
$ | (873.73 | ) | $ | 56.38 | $ | (1,091.76 | ) | |||
| Earnings per share—Class B Stock |
|||||||||||
| Basic | |||||||||||
| Distributed earnings to Class B shareholders |
$ | — | $ | 5 | $ | 75 | |||||
| Undistributed earnings allocated to Class B shareholders |
— | — | — | ||||||||
| Total Earnings—Class B Stock, basic |
$ | — | $ | 5 | $ | 75 | |||||
| Diluted | |||||||||||
| Distributed earnings to Class B shareholders |
$ | — | $ | 5 | $ | 75 | |||||
| Undistributed earnings allocated to Class B shareholders |
— | — | — | ||||||||
| Total Earnings—Class B Stock, diluted | $ | — | $ | 5 | $ | 75 | |||||
| Weighted average Class B shares outstanding, basic |
1 | 1 | 1 | ||||||||
| Share-based compensation |
— | — | — | ||||||||
| Warrants |
— | — | — | ||||||||
| Weighted average Class B shares outstanding, diluted |
1 | 1 | 1 | ||||||||
| Earnings per Class B share, basic |
|||||||||||
| Distributed earnings, basic |
$ | — | $ | 3.20 | $ | 51.20 | |||||
| Undistributed earnings—basic |
— | — | — | ||||||||
| Total |
$ | — | $ | 3.20 | $ | 51.20 | |||||
| Earnings per Class B share, diluted |
|||||||||||
| Distributed earnings, diluted |
$ | — | $ | 3.20 | $ | 51.20 | |||||
| Undistributed earnings—diluted |
— | — | — | ||||||||
| Total |
$ | — | $ | 3.20 | $ | 51.20 | |||||
F-15
Table of Contents
Notes to consolidated financial statements
(in thousands, except per share amounts)
Common equivalent shares are excluded in periods in which they are anti-dilutive. The following options, restricted stock, restricted stock units and warrants were excluded from the calculation of diluted earnings per share because the combined exercise price, unamortized fair value, and excess tax benefits were greater than the average market price of our common stock for the years presented (no amounts other than EPS have been adjusted to reflect the reverse stock split):
| 2008 | 2007 | 2006 | ||||
| Options |
7,000 | 6,426 | 6,993 | |||
| Restricted Stock |
364 | 971 | 326 | |||
| Restricted Stock Units |
1,216 | 203 | 226 | |||
| Warrants |
10,000 | 3,000 | 3,500 |
The per share exercise prices of the options excluded were $0.05-$38.34 in 2008, $1.87-$38.34 in 2007 and $9.13-$38.34 in 2006. The per share exercise prices of the warrants excluded were $5-$7 in 2008, and $43.11-$67.98 in 2007 and 2006.
Recent accounting pronouncements
In October 2008, the FASB issued FSP 157-3 (“FSP 157-3”) “Determining the Fair Value of a Financial Asset When the Market for That Asset Is Not Active.” FSP 157-3 clarifies the applications of SFAS No. 157 in a market that is not active, and addresses application issues such as the use of internal assumptions when relevant observable data does not exist, the use of observable market information when the market is not active, and the use of market quotes when assessing the relevance of observable and unobservable data. FSP 157-3 is effective immediately for all periods presented in accordance with SFAS No. 157 (defined below). The adoption of FSP 157-3 did not have any significant impact on our consolidated financial statements or the fair values of our financial assets and liabilities.
In February 2008, FSP 157-1 “Application of FASB Statement No. 157 to FASB Statement No. 13 and Other Accounting Pronouncements That Address Fair Value Measurements for Purposes of Lease Classification or Measurement under Statement 13” was issued. FSP 157-1 removed leasing transactions accounted for under Statement 13 and related guidance from the scope of SFAS No. 157. FSP 157-2 “Partial Deferral of the Effective Date of Statement 157” (FSP 157-2), also issued in February 2008, deferred the effective date of SFAS No. 157 for all non-financial assets and non-financial liabilities to fiscal years beginning after November 15, 2008. The implementation of this standard is not anticipated to have a material impact on our consolidated financial position and results of operation.
In September 2006, the FASB issued “Fair Value Measurements” (“SFAS No. 157”). SFAS No. 157 establishes a common definition of fair value to be applied to US GAAP guidance that requires the use of fair value, establishes a framework for measuring fair value and expands disclosure about such fair value measurements. SFAS No. 157 is effective for fiscal years beginning after November 15, 2007, except for certain non-financial assets where the effective date will be January 1, 2009. Our adoption of SFAS No. 157 did not have a material effect on the consolidated financial position or results of operations.
In March 2008, the FASB issued SFAS No. 161, “Disclosures About Derivative Instruments and Hedging Activities—an amendment of FASB Statement No. 133” (SFAS No. 161). SFAS No. 161 expands quarterly disclosure requirements in SFAS No. 133 about an entity’s derivative instruments and hedging activities. SFAS No. 161 is effective for fiscal years beginning after November 15, 2008. We will include the relevant disclosures in our financial statements beginning with the first quarter of 2009.
F-16
Table of Contents
Notes to consolidated financial statements
(in thousands, except per share amounts)
In December 2007, the FASB issued SFAS No. 141 (revised 2007), “Business Combinations” (“SFAS 141R”). SFAS 141R establishes principles and requirements for how an acquirer recognizes and measures in our financial statements the identifiable assets acquired, the liabilities assumed, any noncontrolling interest in the acquiree and the goodwill acquired. SFAS 141R also establishes disclosure requirements to enable the evaluation of the nature and financial effects of the business combination. SFAS 141R is effective as of the beginning of an entity’s fiscal year that begins after December 15, 2008, and will be adopted by us in the first quarter of fiscal 2009.
In December 2007, the FASB issued SFAS No. 160, “Non-controlling Interests in Consolidated Financial Statements” (SFAS No. 160). SFAS No. 160 establishes requirements for ownership interests in subsidiaries held by parties other than the parent (sometimes called “minority interests”) to be clearly identified, presented, and disclosed in the consolidated statement of financial position within equity, but separate from the parent’s equity. All changes in the parent’s ownership interests are required to be accounted for consistently as equity transactions and any non-controlling equity investments in unconsolidated subsidiaries must be measured initially at fair value. SFAS No. 160 is effective, on a prospective basis, for fiscal years beginning after December 15, 2008. However, presentation and disclosure requirements must be retrospectively applied to comparative financial statements.
Reclassifications and revisions
In 2008, we recorded various adjustments related to prior periods including a reduction of stock-based compensation expense of $1,225, an increase to salary expense to record unused vacation time of $1,107, a write-off of fixed assets of $705 and an unrealized gain of $665.
Certain amounts reported in 2006 have been reclassified to conform to the current year presentation. Revenue from certain contracts were previously recorded net of expenses paid to third party partners. In 2007, we had determined that we should be recording the related revenue and expense gross in our statement of operations. Accordingly, revenue and operating costs for 2006 were increased by $18,089. In addition, a portion of a health care cost credit previously reflected entirely within corporate general and administrative expenses has been reclassified to operating costs. As a result, operating costs for 2006 decreased and corporate general and administrative expenses increased by $1,413.
We conducted an analysis of the impact of such errors and adjustments on various line items of our financial statements and concluded that such errors and adjustments are not material to our Consolidated Financial Statements at December 31, 2008, and did not have any impact on any key trend or indicator of us, including our debt covenants. Accordingly, we determined the adjustments described above are not material to our Consolidated Financial Statements for 2008 or for any prior period’s Consolidated Financial Statements. As a result, we have not restated any prior period amounts.
NOTE 2—RELATED PARTY TRANSACTIONS:
CBS Radio
On March 3, 2008, we closed on the Master Agreement entered into on October 2, 2007 with CBS Radio, which documents a long-term agreement through March 31, 2017. As part of the new agreement, CBS Radio agreed to broadcast certain of our local/regional and national commercial inventory through March 31, 2017 in exchange for certain programming and/or cash compensation. Additionally, the News Programming Agreement, the Technical Services Agreement and the Trademark License Agreement were amended and restated and extended through March 31, 2017. The previous Management Agreement and Representation Agreement were cancelled on March 3, 2008 and $16,300 of compensation previously
F-17
Table of Contents
Notes to consolidated financial statements
(in thousands, except per share amounts)
paid to CBS Radio under those agreements were added to the maximum potential compensation CBS Radio could earn pursuant to its station affiliation with us. In addition, all warrants previously granted to CBS Radio were cancelled on March 3, 2008.
CBS Radio owns 16,000 shares of our common stock and prior to March 3, 2008 provided ongoing management services to us under the terms of the Management Agreement. As payment for services received under the previous Management Agreement, we compensated CBS Radio via an annual base fee and provided CBS Radio the opportunity to earn an incentive bonus if we exceeded pre-determined targeted cash flows. For the years ended December 31, 2008, 2007 and 2006, we paid CBS Radio a base fee of $610, $3,394 and $3,273, respectively. No incentive bonus was paid to CBS Radio in such years as targeted cash flow levels were not achieved during such periods.
Additionally, we granted to CBS Radio seven fully vested and non-forfeitable warrants to purchase 4,500 shares of our common stock in the aggregate (comprised of two warrants to purchase 1,000 shares of common stock per warrant and five warrants to purchase 500 shares of common stock per warrant). Of the seven warrants issued, two 1,000 share warrants had an exercise price of $43.11 and $48.36, respectively, and become exercisable: (A) if the average price of our common stock reaches a price of $64.67 and $77.38, respectively, for at least 20 out of 30 consecutive trading days for any period throughout the ten year term of the warrants or (B) upon the termination of the Management Agreement by us in certain circumstances as described in the terms of such warrants.
The exercise prices for the five remaining warrants were equal to $38.87, $44.70, $51.40, $59.11 and $67.98, respectively. These warrants each had a term of 10 years (only if they become exercisable) and were exercisable on January 2, 2005, 2006, 2007, 2008, and 2009, respectively, subject to a trading price condition. The trading price condition specified that the average price of our common stock for each of the 15 trading days prior to January 2 of the applicable year (commencing on January 2, 2005 with respect to the first 500 warrant tranche and each January 2 thereafter for each of the remaining four warrants) must be equal to at least both the exercise price of the warrant and 120% of the corresponding prior year 15 day trading average. Our stock price did not equal or exceed the predetermined levels with respect to the 2005, 2006, 2007 and 2008 warrants, and therefore, the warrants never became exercisable. In connection with the cancellation of these warrants, on March 3, 2008 we reduced the related deferred tax asset, resulting in a reduction of additional paid in capital of $9,056.
In connection with the issuance of warrants to CBS Radio in May 2002, we originally reflected the fair value of the warrant issuance of $48,530 as a component of Other Assets with a corresponding increase to Additional Paid in Capital in the accompanying Consolidated Balance Sheet. Upon commencement of the term of the service period to which the warrants relate (April 1, 2004), we commenced amortizing the cost of the warrants ratably over the five-year service period. At December 31, 2007, the unamortized value of the May 2002 warrants was $12,132, of which $9,706 was included as a component of Prepaid and Other Assets and $2,426 was included as a component of Other Assets in the accompanying Consolidated Balance Sheet. Related Amortization Expense was $1,618 in 2008 and $9,706 in 2007 and 2006.
In addition to the Management Agreement described above, we also entered into other transactions with CBS Radio and affiliates of CBS Radio, including Viacom, in the normal course of business. Such arrangements include a Representation Agreement (including a related news programming agreement, a license agreement and a technical services agreement with an affiliate of CBS Radio—collectively referred to as the “Representation Agreement”) to operate the CBS Radio Networks, affiliation agreements with many of CBS Radio’s owned and operated radio stations and the purchase of programming rights from
F-18
Table of Contents
Notes to consolidated financial statements
(in thousands, except per share amounts)
CBS Radio and affiliates of CBS Radio. The Management Agreement provided that all transactions between us and CBS Radio or its affiliates, other than the Management Agreement and Representation Agreement which were ratified by our shareholders, must be on a basis that is at least as favorable to us as if the transactions were entered into with an independent third party. In addition, subject to specified exceptions, all agreements between us and CBS Radio or any of its affiliates must be approved by our Board of Directors.
We incurred the following expenses as a result of transactions with CBS Radio or its affiliates in the following years:
| 2008 | 2007 | 2006 | |||||||
| Representation Agreement |
$ | 15,440 | $ | 27,319 | $ | 27,142 | |||
| Programming and Affiliations |
57,609 | 39,314 | 48,372 | ||||||
| Management Agreement (excluding warrant amortization) |
610 | 3,394 | 3,273 | ||||||
| Warrant Amortization |
1,618 | 9,706 | 9,706 | ||||||
| Payment upon closing of Master Agreement |
5,000 | — | — | ||||||
| $ | 80,277 | $ | 79,733 | $ | 88,493 | ||||
Expenses incurred for the Representation Agreement and programming and affiliate arrangements are included as a component of Operating Costs in the accompanying Consolidated Statement of Operations. Expenses incurred for the Management Agreement (excluding warrant amortization) and amortization of the warrants granted to CBS Radio under the Management Agreement (through March 3, 2008) were included as a component of Corporate, General and Administrative Expenses and Depreciation and Amortization, respectively, in the accompanying Consolidated Statement of Operations. The description and amounts regarding related party transactions set forth in these consolidated financial statements and related notes also reflect transactions between us and Viacom. Viacom is an affiliate of CBS Radio, as National Amusements, Inc. beneficially owns a majority of the voting powers of all classes of common stock of each of CBS Corporation and Viacom.
POP Radio
We also have a related party relationship, including a sales representation agreement, with our investee, POP Radio, L.P., which is described in Note 5—“Acquisitions and Investments.”
NOTE 3—PROPERTY AND EQUIPMENT:
| December 31, | ||||||
| 2008 | 2007 | |||||
| Property and equipment is recorded at cost and is summarized as follows: |
||||||
| Land, buildings and improvements |
$ | 11,999 | $ | 12,188 | ||
| Recording, broadcasting and studio equipment |
75,907 | 71,090 | ||||
| Furniture, equipment and other |
18,445 | 19,274 | ||||
| $ | 106,351 | $ | 102,552 | |||
| Less: Accumulated depreciation and amortization |
75,934 | 69,540 | ||||
| Property and equipment, net |
$ | 30,417 | $ | 33,012 | ||
F-19
Table of Contents
Notes to consolidated financial statements
(in thousands, except per share amounts)
Depreciation expense was $8,652, $9,134 and $9,693 for the year ended December 31, 2008, 2007 and 2006, respectively. In 2001, we entered into a capital lease for satellite transponders totaling $6,723. Accumulated amortization related to the capital lease was $4,949 and $4,258 as of December 31, 2008 and 2007, respectively.
NOTE 4—GOODWILL AND INTANGIBLE ASSETS:
Goodwill represents the excess of cost over fair value of net assets of businesses acquired. In accordance with Statement of Financial Accounting Standards No. 142 “Goodwill and Other Intangible Assets” (“SFAS 142”), the value assigned to goodwill and indefinite lived intangible assets is not amortized to expense, but rather the estimated fair value of the reporting unit is compared to its carrying amount on at least an annual basis to determine if there is a potential impairment. If the fair value of the reporting unit is less than its carrying value, an impairment loss is recorded to the extent that the implied fair value of the reporting unit goodwill and intangible assets is less than their carrying value.
Prior to the fourth quarter 2008, we operated as a single reportable operating segment: the sale of commercial time. As part of our Metro/Traffic re-engineering initiative implemented in the fourth quarter of 2008, we installed separate management for the Network and Metro/Traffic divisions providing discreet financial information and management oversight. Accordingly, we have determined that each division is an operating segment. A reporting unit is the operating segment or a business which is one level below the operating segment. Our reporting units are consistent with our operating segments and impairment has been tested at this level.
In the fourth quarter 2008, in conjunction with the change to two reporting units, we determined that solely using the income approach was the best evaluation of the fair value of our two reporting units. In prior periods, we evaluated the fair value of our reporting unit based on a weighted average of the income approach (75% weight) and the quoted market price of our stock (25% weight).
In 2008, we determined that our goodwill was impaired and recorded impairment charges totaling $430,126 ($206,053 in the second quarter and $224,073 in the fourth quarter). The remaining value of our goodwill is $33,988.
In using the income approach to test goodwill for impairment as of December 31, 2008, we made the following assumptions: (a) the discount rate was 14%; (b) market growth rates were based upon management’s estimates of future performance and (c) terminal growth rates were in the 2% to 3% range. The discount rate reflects the volatility of our operating performance and our common stock. The market growth rates and operating performance estimates reflect the current general economic pressures impacting both the national and a number of local economies, and specifically, national and local advertising revenues in the markets in which our affiliates operate.
Earlier in 2008, as a result of a continued decline in our operating performance and stock price, caused in part by reduced valuation multiples in the radio industry, we determined a triggering event had occurred and as a result performed an interim test to determine if our goodwill was impaired at June 30, 2008. The interim test resulted in an impairment of goodwill and accordingly, we recorded a non-cash charge of $206,053. The majority of the goodwill impairment charge is not deductible for income tax purposes.
In connection with the income approach portion of the goodwill impairment test as of June 30, 2008, we used the following assumptions: (a) the discount rate was 12%; (b) market growth rates that were based upon management’s estimates of future performance of our operations and (c) terminal growth rates
F-20
Table of Contents
Notes to consolidated financial statements
(in thousands, except per share amounts)
were in the 2% to 3% range. The discount rate reflects the volatility of our operating performance and our common stock. The market growth rates and operating performance estimates used reflected the general economic pressures impacting both the national and a number of local economies, and specifically, national and local advertising revenues in the markets in which our affiliates operate as of June 30, 2008.
Determining the fair value of our reporting units requires our management to make a number of judgments about assumptions and estimates that are highly subjective and that are based on unobservable inputs. The actual results may differ from these assumptions and estimates; and it is possible that such differences could have a material impact on our financial statements. In addition to the various inputs (ie market growth, discount rates) that we use to calculate the fair value of our reporting units, we evaluate the reasonableness of our assumptions by comparing the total fair value of all our reporting units to our total market capitalization; and by comparing the fair value of our reporting units to recent or proposed transactions.
As noted above, we are required under SFAS 142 to test our goodwill on an annual basis or whenever events or changes in circumstances indicate that these assets might be impaired. As a result, if the current economic trends continue and the credit and capital markets continue to be disrupted, it is possible that we may record further impairments in 2009.
In connection with our annual goodwill impairment testing for 2007, we determined goodwill was not impaired at December 31, 2007.
For the year ended December 31, 2006, we determined there was an impairment of goodwill and recorded a non-cash charge of $515,916.
The changes in the carrying amount of goodwill for the years ended December 31, 2008 and 2007 are as follows:
| 2008 | 2007 | ||||||
| Balance as of January 1, |
$ | 464,114 | $ | 464,114 | |||
| Impairment (Metro/Traffic) |
(303,703 | ) | — | ||||
| Impairment (Network) |
(126,423 | ) | — | ||||
| Balance as of December 31, |
$ | 33,988 | $ | 464,114 | |||
At December 31, 2008 and 2007, the gross value of our amortizable intangible assets was approximately $28,380, with accumulated amortization of approximately $25,720 and $24,937, respectively. Amortization expense was $783, $783 and $783 for the years ended December 31, 2008, 2007 and 2006, respectively. We estimated aggregate amortization expense for intangibles for fiscal year 2009, 2010, 2011, 2012 and 2013 will be $783, $734, $634, $134 and $134, respectively.
NOTE 5—ACQUISITIONS AND INVESTMENTS:
On December 22, 2008, we entered into a License and Services Agreement with TrafficLand which provides us with a three-year license to market and distribute TrafficLand services and products. Concurrent with the execution of the License Agreement, we entered into an option agreement with TrafficLand granting us the right to acquire 100% of the stock of TrafficLand pursuant to the terms of a merger agreement which the parties have negotiated and placed in escrow. Specifically, if we pay the first
F-21
Table of Contents
Notes to consolidated financial statements
(in thousands, except per share amounts)
$3,000 of fees under the License Agreement on or before February 20, 2009, we will have the right to cause the merger agreement to be released from escrow at any time between that payment date and March 31, 2009. Since we have made the minimum Payments required under the License Agreement, we may elect on our own to exercise our option to have the Merger Agreement released from escrow on or prior to April 15, 2009, at which time the Merger Agreement would have been deemed “executed”. The release of the Merger Agreement does not require that we close the merger, which remains subject to additional closing conditions, including the consent of our lenders. Upon consummation of the closing of the merger, the License Agreement would terminate. Costs of $800 associated with this transition have been expensed as of December 31, 2008.
As TrafficLand qualifies as a variable interest entity, we considered qualitative and quantitative factors to determine if we are the primary beneficiary pursuant to FIN 46(R) of this variable interest entity. In connection with the TrafficLand arrangement, as of December 31, 2008 we do not hold an equity interest or a debt interest in the variable interest entity, and we did not absorb a majority of the expected losses or residual returns. Therefore we do not qualify as the primary beneficiary and, accordingly, we have not consolidated this entity.
On March 29, 2006, our cost method investment in The Australia Traffic Network Pty Limited (“ATN”) was converted to 1,540 shares of common stock of Global Traffic Network, Inc. (“GTN”) in connection with the initial public offering of GTN on that date. The investment in GTN was sold during the quarter ended September 30, 2008 and we received proceeds of approximately $12,741 and realized a gain of $12,420. Such gain is included as a component of Other Income/(Loss) in the Consolidated Statement of Operations.
On October 28, 2005, we became a limited partner of POP Radio, LP (“POP Radio”) pursuant to the terms of a subscription agreement dated as of the same date. As part of the transaction, effective January 1, 2006, we became the exclusive sales representative of the majority of advertising on the POP Radio network for five years, until December 31, 2010, unless earlier terminated by the express terms of the sales representative agreement. We hold a 20% limited partnership interest in POP Radio. No additional capital contributions are required by any of the limited partners. This investment is being accounted for under the equity method. The initial investment balance was de minimis , and our equity in earnings of POP Radio through December 31, 2008 was de minimis .
On September 29, 2006, we, along with the other limited partners of POP Radio, elected to participate in a recapitalization transaction negotiated by POP Radio with Alta Communications, Inc. (“Alta”), in return for which we received $529 on November 13, 2006 which was recorded within Other Income in the Consolidated Statement of Operations for the year ended December 31, 2006. Pursuant to the terms of the transaction, if and when Alta elects to exercise warrants it received in connection with the transaction, our limited partnership interest in POP Radio will decrease from 20% to 6%.
NOTE 6—DEBT:
| 2008 | 2007 | |||||
| Revolving Credit Facility/Term Loan |
$ | 41,000 | $ | 145,000 | ||
| 4.64% Senior Notes |
51,475 | 50,000 | ||||
| 5.26% Senior Notes |
154,503 | 150,000 | ||||
| Deferred derivative gain |
2,075 | |||||
| Fair market value of Swap |
— | 244 | ||||
| $ | 249,053 | $ | 345,244 | |||
F-22
Table of Contents
Notes to consolidated financial statements
(in thousands, except per share amounts)
On October 31, 2006 we amended our existing senior loan agreement with a syndicate of banks led by JP Morgan Chase Bank and Bank of America. The Facility, as amended, is comprised of an unsecured five-year $120,000 term loan and a five-year $150,000 revolving credit facility which was automatically reduced to $125,000 effective September 28, 2007. In connection with the original closing of the Facility on March 3, 2004, we borrowed the full amount of the term loan, the proceeds of which were used to repay the outstanding borrowings under a prior facility. Interest on the Facility is variable and is payable at a maximum of the prime rate plus an applicable margin of up to .25% or LIBOR plus an applicable margin of up to 1.25%, at our option. The applicable margin is determined by our Total Debt Ratio, as defined in the underlying agreements. The Facility contains covenants relating to dividends, liens, indebtedness, capital expenditures and restricted payments, as defined, interest coverage and leverage ratios.
On December 3, 2002 we issued, through a private placement, $150,000 of ten year Senior Notes due November 30, 2012 (interest at a fixed rate of 5.26%) and $50,000 of seven year Senior Notes due November 30, 2009 (interest at a fixed rate of 4.64%, collectively referred to as “Senior Notes” or “Notes”). Interest on the Notes is payable semi-annually in May and November. The Notes, which were unsecured, contain covenants relating to leverage and interest coverage ratios that are identical to those contained in our Facility. The Notes may be prepaid at the option of us upon proper notice and by paying principal, interest and an early payment penalty.
In addition, we entered into a seven-year interest rate swap agreement covering $25,000 notional value of our outstanding borrowings under the Senior Notes to effectively float the interest rate at three-month LIBOR plus 74 basis points and two ten-year interest rate swap agreements covering $75,000 notional value of our outstanding borrowings under the Senior Notes to effectively float the interest rate at three-month LIBOR plus 80 basis points. In total, the swaps covered $100,000 which represented 50% of the notional amount of Senior Notes. In November 2007, one of the ten-year interest rate swap agreements covering $50,000 notional value was cancelled, resulting in a payment of $576 to the counter-party. In December 2008, we terminated the remaining interest rate swaps, resulting in cash proceeds of $2,150, which has been classified as a financing cash inflow in our Statement of Cash Flows. The resulting gain of $2,150 from the termination of the derivative contracts is being amortized over the life of the debt.
On December 31, 2007, we had available borrowings under the Facility, subject to the restrictions of our covenants, of approximately $44,000. Additionally, at December 31, 2007, we had borrowed $145,000 under the Facility at a weighted-average interest rate of 6.8% (including the applicable margin of LIBOR plus 1.125%).
Effective February 28, 2008 (with the exception of clause (v) which was effective March 3, 2008), we amended the Facility to: (1) provide security to our lenders (including holders of our Notes); (2) reduce the amount of the revolving facility to $75,000; (3) increase the applicable margin on LIBOR loans to 1.75% and on prime rate loans to 0.75%; (4) change the allowable Total Debt Ratio to 4.0 times our Annualized Consolidated Operating Cash Flow through the remaining term of the Facility; (5) eliminate the provision that deemed the termination of the CBS Radio Management Agreement an event of default; and (6) include covenants prohibiting the payment of dividends and restricted payments. As noted above, as a result of providing the banks in the Facility with a security interest in our assets, the note holders were also provided with security pursuant to the terms of the Note Purchase Agreement.
As discussed in Note 1, in the fourth quarter of 2008, we failed to pay our most recent semi-annual interest payment due in respect of the existing Senior Notes and were not in compliance with our maximum leverage ratio covenant at December 31, 2008. Both of these events constitute a separate
F-23
Table of Contents
Notes to consolidated financial statements
(in thousands, except per share amounts)
default under the Facility and the Senior Notes. In addition, on February 27, 2009, our outstanding Facility matured and became due and payable in its entirety. We did not pay such amount, which also constitutes an event of default under the Facility and the Senior Notes. Our lenders did not seek to exercise remedies that were available to them under applicable law or their respective existing debt agreements. As of March 31, 2009 the parties were working towards a refinancing of all of our outstanding indebtedness (approximately $247,000), however, there was no assurance that the parties would consummate the refinancing or that our lenders would not seek to exercise remedies that were available to them prior to any such consummation. Accordingly, the debt is classified as current in the accompanying financial statements. The total debt obligation included in the balance sheet as of December 31, 2008 includes unpaid interest due in respect to the existing Senior Notes of $5,900.
On April 23, 2009, we completed the refinancing of our outstanding long-term indebtedness and the recapitalization of our equity (see Note 20—Subsequent Events).
The aggregate maturities of debt for the next four years and thereafter, pursuant to our debt agreements including unpaid interest as in effect at December 31, 2008, are as follows (excludes market value adjustments):
| Year | |||
| 2009 |
$ | 246,978 | |
| 2010 |
— | ||
| 2011 |
— | ||
| 2012 |
— | ||
| $ | 246,978 | ||
NOTE 7—FINANCIAL INSTRUMENTS:
Interest rate risk management
In order to achieve a desired proportion of variable and fixed rate debt, we entered into a seven-year interest rate swap agreement covering $25,000 notional value of our outstanding borrowing to effectively float the majority of the interest rate at three-month LIBOR plus 74 basis points and two ten year interest rate swap agreements covering $75,000 notional value of our outstanding borrowing to effectively float majority of the interest rate at three-month LIBOR plus 80 basis points. In total, the swaps initially covered $100,000, which represented 50% of the notional amount of Senior Notes. These swap transactions allow us to benefit from short-term declines in interest rates while having the long-term stability of the other 50% of Senior Notes of fairly low fixed rates. In November 2007, we cancelled one of the ten-year swap agreements covering $50,000 notional value, by paying the counter-party $576. The instruments meet all of the criteria of a fair-value hedge and are classified in the same category as the item being hedged in the accompanying balance sheet. We have the appropriate documentation, including the risk management objective and strategy for undertaking the hedge, identification of the hedged instrument, the hedge item, the nature of the risk being hedged, and how the hedging instrument’s effectiveness offsets the exposure to changes in the hedged item’s fair value. In December 2008, we terminated the remaining interest rate swaps, resulting in cash proceeds of $2,150, which has been classified as a financing cash inflow in our Statement of Cash Flows. The resulting gain of $2,150 from the termination of the derivative contracts is being amortized over the life of the debt.
F-24
Table of Contents
Notes to consolidated financial statements
(in thousands, except per share amounts)
At December 31, 2007, prior to the unwinding of the swaps as described above, we had the following interest rate swaps:
| Interest rate | |||||||||
| Maturity dates | Notional principal amount |
Paid(1) | Received | Variable rate index | |||||
| November 2009 |
$ | 25,000 | 5.08 | 3.91 | 3 Month LIBOR | ||||
| November 2012 |
$ | 25,000 | 5.08 | 4.41 | 3 Month LIBOR | ||||
| (1) | The interest rate paid at December 31, 2006 was 5.37%. |
The estimated fair value of our interest rate swaps at December 31, 2007 was $244. This balance was included in other assets in the accompanying Consolidated Balance Sheet.
Fair value of financial instruments
Our financial instruments include cash, cash equivalents, receivables, accounts payable, borrowings and interest rate contracts. At December 31, 2008 and 2007, the fair values of cash and cash equivalents, receivables and accounts payable approximated carrying values because of the short-term nature of these instruments. In 2008, the estimated fair values of the borrowings were valued based on the current agreement in principle related to the refinancing as discussed in more detail in Note 20—Subsequent Events. In 2007, the estimated fair values of other financial instruments subject to fair value disclosures, determined based on broker quotes or market quotes or rates for the same or similar instruments, and the related carrying amounts are as follows:
| December 31, 2008 | December 31, 2007 | |||||||||||
| Carrying amount |
Fair value | Carrying amount |
Fair value | |||||||||
| Borrowings (Short and Long Term) |
$ | 249,053 | $ | 158,100 | $ | 345,000 | $ | 345,732 | ||||
| Risk management contracts: |
||||||||||||
| Interest rate swaps |
— | — | 244 | 244 | ||||||||
| Series A Preferred Stock |
75,000 | 50,000 | — | — | ||||||||
Credit concentrations
We continually monitor our positions with, and the credit quality of, the financial institutions that are counterparties to our financial instruments, and do not anticipate nonperformance by the counterparties.
Our receivables do not represent a significant concentration of credit risk at December 31, 2008, due to the broad variety of customers and markets in which we operate.
NOTE 8—FAIR VALUE MEASUREMENTS:
SFAS No. 157 establishes a common definition for fair value to be applied to US GAAP requiring use of fair value, establishes a framework for measuring fair value, and expands disclosure about such fair value measurements. SFAS No. 157 is effective for financial assets and financial liabilities for fiscal years beginning after November 15, 2007.
We endeavor to utilize the best available information in measuring fair value. Financial assets and liabilities are classified in their entirety based on the lowest level of input that is significant to the fair value measurement.
F-25
Table of Contents
Notes to consolidated financial statements
(in thousands, except per share amounts)
Fair value hierarchy
SFAS No. 157 specifies a hierarchy of valuation techniques based upon whether the inputs to those valuation techniques reflect assumptions other market participants would use based upon market data obtained from independent sources (observable inputs) or reflect a company’s own assumptions of market participant valuation (unobservable inputs). In accordance with SFAS No. 157, these two types of inputs have created the following fair value hierarchy:
| Ø | Level 1—Quoted prices in active markets that are unadjusted and accessible at the measurement date for identical, unrestricted assets or liabilities; |
| Ø | Level 2—Quoted prices for identical assets and liabilities in markets that are not active, quoted prices for similar assets and liabilities in active markets or financial instruments for which significant inputs are observable, either directly or indirectly; |
| Ø | Level 3—Prices or valuations that require inputs that are both significant to the fair value measurement and unobservable. |
SFAS No. 157 requires the use of observable market data if such data is available without undue cost and effort.
Items measured at fair value on a recurring basis
The following table sets forth our financial assets and liabilities that were accounted for, at fair value on a recurring basis as of December 31, 2008. These amounts are included in the Other Assets in the accompanying Balance Sheet.
| Level 1 | Level 2 | Level 3 | |||||||
| Assets: |
|||||||||
| Investments |
$ | 433 | $ | — | $ | — | |||
| Total Assets |
$ | 433 | $ | — | $ | — | |||
NOTE 9—SHAREHOLDERS’ EQUITY AND SERIES A PREFERRED STOCK:
Our authorized capital stock consists of common stock, Class B stock and Series A Preferred Stock. Our common stock is entitled to one vote per share while Class B stock is entitled to 50 votes per share. Class B stock is convertible to common stock on a share-for-share basis.
In 2005, our Board of Directors authorized us to repurchase shares of common stock to enhance shareholder value. We did not purchase any shares in 2008 or 2007.
In May 2007, the Board of Directors elected to discontinue the payment of a dividend. On March 6, 2007, our Board of Directors declared cash dividends of $0.02 for each issued and outstanding share of common stock and $0.016 for each issued and outstanding share of Class B stock. Dividends were not declared in 2008.
On March 3, 2008 and March 24, 2008, we announced the closing of the sale and issuance of 7,143 shares (14,286 shares in the aggregate) of our common stock to Gores Radio Holdings, LLC (together with certain related entities, “Gores”), an entity managed by The Gores Group, LLC at a price of $1.75 per share for an aggregate purchase amount of $25,000.
F-26
Table of Contents
Notes to consolidated financial statements
(in thousands, except per share amounts)
On June 19, 2008, we completed a $75,000 private placement of the Series A Preferred Stock with an initial conversion price of $3.00 per share and four-year warrants to purchase an aggregate of 10,000 shares of our common stock in three approximately equal tranches with exercise prices of $5.00, $6.00 and $7.00 per share, respectively, to Gores Radio Holdings, LLC.
The holders of Series A Preferred Stock are entitled to receive dividends at a rate of 7.5% per annum, compounded quarterly, which are accrued daily and added to the liquidation preference (initially equal to $1,000 per share, plus accrued dividends). We may redeem the Series A Preferred Stock in whole or in part four years and six months after the original date of issuance. Thereafter, if the Series A Preferred Stock remains outstanding on the fifth anniversary of the original date of issuance, the dividend rate will increase to 15.0% per annum. If the Series A Preferred Stock remains outstanding on the 66th month anniversary of the original issue date, the liquidation preference increases by 50%. In addition to the dividends specified above, if dividends are declared or paid by us on the common stock, then such dividends shall be declared and paid on the Series A Preferred Stock on a pro rata basis. As such the Series A Preferred Stock is considered a participating security as defined in SFAS No. 128—Earnings Per Share.
The Series A Preferred Stock is convertible at the option of the holders, at any time and from time to time, into a number of shares of common stock equal to the Liquidation Preference divided by the conversion price (initially, $3.00 per share, subject to adjustment for stock dividends, subdivisions, reclassifications, combinations or similar type events). After December 20, 2010, we may cause the conversion of the Series A Preferred Stock if the per share closing price of common stock equals or exceeds $4.00 for 60 trading days in any 90 trading day period or if we sell $50,000 or more of our common stock to a third party at a price per share equal to or greater than $4.00.
The Series A Preferred Stock was issued with a deemed liquidation clause that provides that the security becomes redeemable at the election of the holders of a majority of the then outstanding shares of Series A Preferred Stock in the event of a consolidation or merger by us, as defined, or the sale of all or substantially all of the assets of the Company. In accordance with Emerging Issues Task Force (EITF) D-98, the Series A Preferred Stock is required to be classified as mezzanine equity because a change of our control could occur without our approval and thus redemption of the Series A Preferred Stock is not solely under our control. In addition, as it is not probable the Series A Preferred Stock will become redeemable; we have not adjusted the initial carrying amount of the Series A Preferred Stock to its redemption amount or accreted the 7.5% cumulative dividend at the balance sheet date. Through December 31, 2008, the Series A Preferred Stock accumulated dividends were $3,081 and as a result, the Liquidation Preference as defined was $78,081 at December 31, 2008.
The warrants had a fair value of $440 on the date of issuance. The proceeds from the sale were allocated to the Series A Preferred Stock and warrants based upon their relative fair values at the date of issuance. Accordingly, the fair value of the warrants is included in Additional Paid-in Capital.
On March 16, 2009, we were delisted from the NYSE and at this time, we do not have any immediate plans to list on an alternate exchange such as Nasdaq or Amex, which means our common stock will continue to be lightly traded.
No amounts other than EPS have been adjusted to reflect the reverse stock split (see Note 1).
F-27
Table of Contents
Notes to consolidated financial statements
(in thousands, except per share amounts)
NOTE 10—EQUITY-BASED COMPENSATION:
Equity compensation plans
We established stock option plans in 1989 (the “1989 Plan”) and 1999 (the “1999 Plan”) which allow us to grant options to directors, officers and key employees to purchase our common stock at its market value on the date the options are granted. Under the 1989 Plan, 12,600 shares were reserved for grant through March 1999. The 1989 Plan expired, but certain grants made under the 1989 Plan remain outstanding at December 31, 2008. On September 22, 1999, the shareholders ratified the 1999 Plan, which authorized us to grant up to 8,000 shares of common stock. Options granted under the 1999 Plan generally become exercisable after one year in 33% to 20% increments per year and expire within ten years from the date of grant.
On May 19, 2005, the Board modified the 1999 Plan by deleting the provisions of the 1999 Plan that provided for a mandatory annual grant of 10 stock options to outside directors. Also, on May 19, 2005, our shareholders approved the 2005 Equity Compensation Plan (the “2005 Plan”). Among other things, the 2005 Plan allows us to grant restricted stock and restricted stock units (“RSUs”). When it was adopted, a maximum of 9,200 shares of common stock was authorized for the issuance of awards under the 2005 Plan.
Beginning on May 19, 2005, outside directors automatically receive a grant of RSUs equal to $100 in value on the date of each Company annual meeting of shareholders. Newly appointed outside directors receive an initial grant of RSUs equal to $150 in value on the date such director is appointed to our Board. These awards are governed by the 2005 Plan.
Options and restricted stock granted under the 2005 Plan vest in 25%, 33% or 50% increments per year, commencing on the anniversary date of each grant, and options expire within ten years from the date of grant. RSUs awarded to directors generally vest over a three-year period in equal 33% increments per year. Directors’ RSUs vest automatically, in full, upon a change in control or upon their retirement, as defined in the 2005 Plan. RSUs are payable in newly issued shares of our common stock. Recipients of restricted stock and RSUs are entitled to receive dividend equivalents (subject to vesting) when and if we pay a cash dividend on our common stock. Such dividend equivalents are payable, in newly issued shares of common stock, only upon the vesting of the related restricted shares.
Restricted stock has the same cash dividend and voting rights as other common stock and, once issued, is considered to be currently issued and outstanding (even when unvested). Restricted stock and RSUs have dividend equivalent rights equal to the cash dividend paid on common stock. RSUs do not have the voting rights of common stock, and the shares underlying the RSUs are not considered to be issued and outstanding until they vest.
F-28
Table of Contents
Notes to consolidated financial statements
(in thousands, except per share amounts)
Stock options
The following table summarizes stock option activity for 2008:
| 2008 | ||||||
| Shares | Weighted average exercise price | |||||
| Outstanding, beginning of year |
3,888 | $ | 21.86 | |||
| Granted |
6,588 | $ | 1.36 | |||
| Exercised |
— | — | ||||
| Cancelled, forfeited or expired |
(3,476 | ) | $ | 11.76 | ||
| Outstanding, end of year |
7,000 | $ | 7.52 | |||
At December 31, 2008, there were 1,743 vested and exercisable options with a weighted average exercise price of $24.28, aggregate intrinsic value of $0, and weighted average remaining contractual term of 3.60 years. Additionally, at December 31, 2008, 4,655 options were expected to vest with a weighted average exercise price of $2.05, and weighted average remaining term of 8.64 years. The aggregate intrinsic value of these options was $0. The aggregate intrinsic value of options exercised during the years ended December 31, 2008, 2007 and 2006, was $0, $0, and $74, respectively. The aggregate intrinsic value of options represents the total pre-tax intrinsic value (the difference between our closing stock price on the last trading day of fiscal 2008 and the exercise price, multiplied by the number of in-the-money options) that would have been received by the option holders had all option holders exercised their options on December 31, 2008. This amount changed based on the fair market value of our common stock.
As of December 31, 2008, there was $3,573 of unearned compensation cost related to stock options granted under all three of our equity compensation plans. That cost is expected to be recognized over a weighted-average period of 1.48 years. Total compensation expense related to stock options was $2,662, $6,835 and $10,170 in 2008, 2007 and 2006 respectively. Of that expense, $2,502, $3,933 and $5,651, respectively, was included in operating costs in the Statement of Operations and $160, $2,902, and $4,519, respectively, was included in corporate, general and administrative expense in the Statement of Operations.
In the second quarter of 2008, we determined we had incorrectly continued to expense stock-based equity compensation for certain directors and officers who had resigned. We determined that this error was not significant to any prior period results and accordingly reduced non-cash, stock-based compensation by $1,496.
The aggregate estimated fair value of options vesting was $2,360 during the year ended December 31, 2008. The weighted average fair value of the options granted was $0.52, $2.39 and $5.37 during the years ended December 31, 2008, 2007 and 2006, respectively. The estimated fair value of options granted was measured on the date of grant using the Black-Scholes option pricing model with the following weighted average assumptions:
| Year ended December 31, | |||||||||
| 2008 | 2007 | 2006 | |||||||
| Risk-Free Interest Rate |
2.64 | % | 4.52 | % | 4.53 | % | |||
| Expected Term |
4.8 | 5.7 | 6.2 | ||||||
| Expected Volatility |
55.99 | % | 40.12 | % | 45.05 | % | |||
| Expected Dividend Yield |
0.00 | % | 0.79 | % | 2.80 | % | |||
F-29
Table of Contents
Notes to consolidated financial statements
(in thousands, except per share amounts)
The risk-free interest rate for periods within the life of the option is based on a blend of US Treasury bond rates. Beginning with options granted after January 1, 2006, the expected term assumption has been calculated based on historical data. Prior to January 1, 2006, we set the expected term equal to the applicable vesting period. The expected volatility assumption used by us is based on the historical volatility of our stock. The dividend yield represents the expected dividends on our common stock for the expected term of the option.
Additional information related to options outstanding at December 31, 2008, segregated by grant price range, is summarized below:
| Number of options |
Weighted average exercise price |
Remaining weighted average contractual life (in years) | |||||
| Options Outstanding at Exercise Price of: |
|||||||
| $0.00 - $1.87 |
3,878 | $ | 0.96 | 8.75 | |||
| $1.87 - $6.16 |
1,166 | 2.14 | 9.16 | ||||
| $6.37 - $9.88 |
28 | 6.63 | 7.90 | ||||
| $10.09 - $19.93 |
495 | 15.35 | 4.43 | ||||
| $20.25 - $26.96 |
733 | 21.28 | 3.93 | ||||
| $30.19 - $38.34 |
700 | 32.72 | 3.43 | ||||
| 7,000 | $ | 7.50 | 7.47 | ||||
Restricted stock
We have awarded shares of restricted stock to certain key employees. The awards vest over periods ranging from 2 to 4 years. The cost of these restricted stock awards, calculated as the fair market value of the shares on the date of grant, net of estimated forfeitures, is expensed ratably over the vesting period.
The following table summarized the restricted stock activity for 2008:
| 2008 | ||||||
| Shares | Weighted avg grant date fair value per share | |||||
| Unvested, beginning of year |
950 | $ | 7.56 | |||
| Granted |
41 | $ | 0.63 | |||
| Coverted to Common Stock |
(363 | ) | $ | 6.65 | ||
| Forfeited |
(264 | ) | $ | 7.67 | ||
| Unvested, end of year |
364 | $ | 7.55 | |||
As of December 31, 2008, there was $2,173 of unearned compensation cost related to restricted stock grants. The unearned compensation is expected to be recognized over a weighted-average period of 1.11 years. Total compensation expense recognized in 2008, 2007 and 2006 related to restricted stock is $2,162 ($1,772 included in operating costs and $390 in corporate, general and administrative expense), $1,921 ($1,453 included in operating costs and $468 in corporate, general and administrative expense) and $795 ($694 included in operating costs and $101 in corporate, general and administrative expense), respectively.
F-30
Table of Contents
Notes to consolidated financial statements
(in thousands, except per share amounts)
RSUs
We have awarded RSUs to Board members and certain key executives, which vest over three and four years, respectively. The cost of the RSUs, which is determined to be the fair market value of the shares at the date of grant, net of estimated forfeitures, is expensed ratably over the vesting period, or period to retirement eligibility (in the case of directors) if shorter.
The following table summarizes RSU activity for 2008:
| 2008 | ||||||
| Shares | Weighted avg per share | |||||
| Outstanding, beginning of year |
230 | $ | 9.15 | |||
| Granted |
1,093 | $ | 0.69 | |||
| Dividend equivalents |
— | |||||
| Coverted to Common Stock |
(107 | ) | $ | 8.52 | ||
| Forfeited |
— | |||||
| Outstanding, end of year |
1,216 | $ | 1.60 | |||
| Vested, end of year |
31 | |||||
| Unvested, end of year |
1,185 | |||||
As of December 31, 2008, there was $1,010 of unearned compensation cost. The cost is expected to be recognized over a weighted-average period of 1.67 years. Total compensation expense recognized related to RSUs in 2008, 2007 and 2006 was $618, $850 and $1,304, respectively. These costs are included in corporate, general and administrative expense in the accompanying Statement of Operations.
No amounts other than EPS have been adjusted to reflect the reverse stock split (see Note 1).
NOTE 11—OTHER INCOME/(LOSS):
During the year ended December 31, 2008, we sold marketable securities for total proceeds of approximately $12,741 and realized a gain of $12,420. Such gain is included as a component of other income/(loss) in the Consolidated Statement of Operations.
NOTE 12—COMPREHENSIVE INCOME (LOSS):
Comprehensive income (loss) reflects the change in equity of a business enterprise during a period from transactions and other events and circumstances from non-owner sources. Comprehensive net income (loss) represents net income or loss adjusted for net unrealized gains or losses on available for sale securities. Comprehensive income (loss) is as follows:
| Year ended December 31, | |||||||||||
| 2008 | 2007 | 2006 | |||||||||
| Net (Loss) Income |
$ | (427,563 | ) | $ | 24,368 | $ | (469,453 | ) | |||
| Unrealized gain on marketable securities net effect of income taxes |
6,732 | 1,385 | 4,570 | ||||||||
| Adjustment for gains included in net income |
(12,420 | ) | — | ||||||||
| Comprehensive (Loss) Income |
$ | (433,251 | ) | $ | 25,753 | $ | (464,883 | ) | |||
F-31
Table of Contents
Notes to consolidated financial statements
(in thousands, except per share amounts)
NOTE 13—INCOME TAXES:
The components of the provision for income taxes are as follows:
| Year ended December 31, | ||||||||||||
| 2008 | 2007 | 2006 | ||||||||||
| Current |
||||||||||||
| Federal |
$ | (1,220 | ) | $ | 18,466 | $ | 26,304 | |||||
| State |
367 | 3,738 | 3,588 | |||||||||
| $ | (853 | ) | $ | 22,204 | $ | 29,892 | ||||||
| Deferred |
||||||||||||
| Federal |
(11,790 | ) | (5,542 | ) | (18,537 | ) | ||||||
| State |
(2,117 | ) | (938 | ) | (2,546 | ) | ||||||
| (13,907 | ) | (6,480 | ) | (21,083 | ) | |||||||
| Income (Benefit) Tax Expense |
$ | (14,760 | ) | $ | 15,724 | $ | 8,809 | |||||
Deferred income taxes reflect the net tax effects of temporary differences between the carrying amounts of assets and liabilities on our balance sheet and the amounts used for income tax purposes. Significant components of our deferred tax assets and liabilities follow:
| 2008 | 2007 | |||||
| Deferred tax liabilities: |
||||||
| Property and equipment |
$ | 5,076 | $ | 2,404 | ||
| Investment |
166 | 3,709 | ||||
| Other |
295 | 488 | ||||
| Total deferred tax liabilities |
$ | 5,537 | $ | 6,601 | ||
| Deferred tax assets: |
||||||
| Goodwill, intangibles and other |
6,487 | 6,673 | ||||
| Allowance for doubtful accounts |
1,379 | 1,321 | ||||
| Deferred Compensation |
1,444 | 1,443 | ||||
| Equity Based Compensation |
8,460 | 11,401 | ||||
| Accrued expenses and other |
4,016 | — | ||||
| Total deferred tax assets |
$ | 21,786 | $ | 20,838 | ||
| Net deferred tax assets |
$ | 16,249 | $ | 14,237 | ||
| Net deferred tax asset—current |
$ | 2,029 | $ | 1,321 | ||
| Net deferred tax asset—long term |
$ | 14,220 | $ | 12,916 | ||
We determined, based upon the weight of available evidence, that it is more likely than not that our deferred tax asset will be realized. We have experienced a long history of taxable income which would enable us to carryback any potential future net operating losses and taxable temporary differences that can be used as a source of income. As such, no valuation allowance was recorded during the year ended December 31, 2008. We will continue to assess the need for a valuation allowance at each future reporting period.
F-32
Table of Contents
Notes to consolidated financial statements
(in thousands, except per share amounts)
The reconciliation of the federal statutory income tax rate to our effective income tax rate is as follows:
| Year ended December 31, | |||||||||
| 2008 | 2007 | 2006 | |||||||
| Federal statutory rate |
35.0 | % | 35.0 | % | 35.0 | % | |||
| State taxes net of federal benefit |
0.3 | 3.3 | (0.2 | ) | |||||
| Non-deductible portion of goodwill Impairment |
(31.8 | ) | — | (36.6 | ) | ||||
| Other |
(0.2 | ) | 0.9 | (0.1 | ) | ||||
| Effective tax rate |
3.3 | % | 32.2 | % | (1.9 | )% | |||
The 2008 effective income tax rate was impacted by the 2008 goodwill impairment charge being substantially non-deductible for tax purposes. The 2007 effective income tax rate benefited from a change in New York State tax law on our deferred tax balance (approximately $100). The 2006 income tax provision was impacted by the 2006 goodwill impairment and related deferred tax attributes.
In 2008, 2007 and 2006, $0, $0 and $12, respectively, of windfall tax benefits attributable to employee stock exercises were allocated to shareholders’ equity.
We adopted FIN No. 48, “Accounting for Uncertainty in Income Taxes” effective January 1, 2007 that resulted in no material adjustment in the liability for unrecognized tax benefits. At December 31, 2008, we had $6,402 of unrecognized tax benefits. We classified interest expense and penalties related to unrecognized tax benefits as income tax expense. As of December 31, 2007, we had $2,105 of accrued interest and penalties. The accrued interest and penalties increased to $2,510 at December 31, 2008. For the year-ended December 31, 2008, we recognized in our consolidated statement of earnings $405 of interest and penalties.
| Unrecognized tax benefit |
||||
| Balance at January 1, 2007 |
$ | 7,513 | ||
| Additions for current year tax positions |
119 | |||
| Settlements |
(456 | ) | ||
| Reductions related to expiration of statute of limitations |
(706 | ) | ||
| Balance at December 31, 2007 |
$ | 6,470 | ||
| Additions for tax positions |
533 | |||
| Settlements |
(444 | ) | ||
| Reductions related to expiration of statue of limitations |
(157 | ) | ||
| Balance at December 31, 2008 |
$ | 6,402 | ||
We believe it is reasonably possible that within the next twelve months, the entire unrecognized tax benefits balance will reverse.
Substantially all of our unrecognized tax benefits, if recognized, would affect the effective tax rate.
We are no longer subject to US federal income examinations for years before 2005.
With few exceptions, we are no longer subject to state and local income tax examinations by tax authorities for years before 2002.
F-33
Table of Contents
Notes to consolidated financial statements
(in thousands, except per share amounts)
During 2008 we reported a federal net operating loss of approximately $2,700, for which we intend to prepare a Federal carryback claim. Accordingly, we have recorded an income tax receivable of $900. The states in which we operate generally do not permit the carryback of net operating losses. As a result, we must carry any related 2008 state net operating losses forward to be applied against future taxable income. We have recorded a deferred tax benefit of approximately $100 to reflect the expected utilization of these states and local net operating losses in future periods.
NOTE 14—COMMITMENTS AND CONTINGENCIES:
We have various non-cancelable, long-term operating leases for office space and equipment. In addition, we are committed under various contractual agreements to pay for talent, broadcast rights, research, news and other services. The approximate aggregate future minimum obligations under such operating leases and contractual agreements for the five years after December 31, 2008 and thereafter, are set forth below:
| Leases | Other
|
Total
| ||||||||||
| Year | Capital | Operating | ||||||||||
| 2009 |
$ | 960 | $ | 9,007 | $ | 108,442 | $ | 118,409 | ||||
| 2010 |
960 | 6,175 | 91,724 | 98,859 | ||||||||
| 2011 |
640 | 5,645 | 84,915 | 91,200 | ||||||||
| 2012 |
— | 5,546 | 76,089 | 81,635 | ||||||||
| 2013 |
— | 5,469 | 71,915 | 77,384 | ||||||||
| Thereafter |
— | 18,998 | 236,538 | 255,536 | ||||||||
| $ | 2,560 | $ | 50,840 | $ | 669,623 | $ | 723,023 | |||||
Rent expense charged to operations for 2008, 2007 and 2006 was $10,686, $8,523 and $9,295, respectively.
Included in “Other” in the table above is $575,902 of commitments due to CBS Radio and its affiliates pursuant to the agreements described in Note 2 — “Related Party Transactions”.
NOTE 15—SUPPLEMENTAL CASH FLOW AND OTHER INFORMATION:
Supplemental information on cash flows, is summarized as follows:
| Year ended December 31, | |||||||||
| 2008 | 2007 | 2006 | |||||||
| Cash paid for: |
|||||||||
| Interest |
$ | 10,146 | $ | 24,239 | $ | 24,642 | |||
| Income Taxes |
10,179 | 21,814 | 44,676 | ||||||
NOTE 16—RESTRUCTURING CHARGES:
In the third quarter of 2008, we announced a plan to restructure the traffic operations of the Metro/Traffic operating segment and to take actions to address underperforming programming and to implement other cost reductions. The modifications to the traffic business are part of a series of reengineering initiatives identified by management to improve the operating and financial performance in the near term, while setting the foundation for profitable long-term growth. In connection with the re-engineering of our traffic operations and other cost reductions, which included the consolidation of leased offices, staff reductions and the elimination of underperforming programming, and was
F-34
Table of Contents
Notes to consolidated financial statements
(in thousands, except per share amounts)
implemented to a significant degree in the last half of 2008, we recorded $14,100 in restructuring charges for the twelve months ended December 31, 2008. We anticipate further charges of approximately $9,700 as additional phases of the original traffic re-engineering and other programs are implemented and finalized in the second quarter of 2009. The total restructuring charges for the traffic re-engineering and other cost savings programs are projected to be approximately $23,800. In addition, we have introduced and will complete new cost reduction programs in 2009. As these programs are implemented, we anticipate that we will incur new incremental costs for severance of approximately $6,000 and contract terminations of $3,100. In total, we estimate we will record aggregate restructuring charges of approximately $32,900, consisting of: (1) $15,500 of severance, relocation and other employee related costs; (2) $7,400 of facility consolidation and related costs; and (3) $10,000 of contract termination costs.
Restructuring charges have been recorded in accordance with SFAS No. 146, “Accounting for the Costs Associated with Exit or Disposal Activities” and SFAS No. 88, “Employer’s Accounting for Settlements and Curtailments of Defined Benefit Pension Plans and for Termination Benefit”. We account for one-time termination benefits, contract terminations, asset write-offs, and/or costs to terminate lease obligations less assumed sublease income in accordance with SFAS No. 146, which addresses financial accounting and reporting for costs associated with restructuring activities. Under SFAS No. 146, we establish a liability for a cost associated with an exit or disposal activity, including severance and lease termination obligations and other related costs, when the liability is incurred, rather than at the date that we commit to an exit plan.
In determining the charges related to the restructuring, we had to make estimates related to the expenses associated with the restructuring. These estimates may vary from actual costs depending, in part, upon factors that may be beyond our control. We will continue to review the status of our restructuring obligations on a quarterly basis and, if appropriate, record changes to these obligations based on management’s most current estimates.
The restructuring charges identified in the Consolidated Statement of Operations are comprised of the following:
| Restructuring liability | Severance termination cost |
Facilities consolidation related costs |
Contract termination |
Total | ||||||||||||
| Charges |
$ | 6,765 | $ | 831 | $ | 6,504 | $ | 14,100 | ||||||||
| Payments |
(3,487 | ) | (41 | ) | (1,108 | ) | (4,636 | ) | ||||||||
| Non-Cash utilization |
(80 | ) | (1,600 | ) | (1,680 | ) | ||||||||||
| Balance at December 31, 2008 |
$ | 3,198 | $ | 790 | $ | 3,796 | $ | 7,784 | ||||||||
NOTE 17—SPECIAL CHARGES:
During 2008, we incurred costs relating to the negotiation of a new long-term arrangement with CBS Radio, legal and professional expenses attributable to negotiations relating to refinancing our debt, and consultancy expenses associated with developing a cost savings and re-engineering initiative designed to improve our traffic information and reporting operations. We incurred costs aggregating $4,626 and $1,579 in 2007 and 2006, respectively, related to the negotiation of a new long-term arrangement with CBS Radio and for severance obligations related to executive officer changes.
F-35
Table of Contents
Notes to consolidated financial statements
(in thousands, except per share amounts)
The special charges identified on the Consolidated Statement of Operations are comprised of the following:
| Year ended December 31, | |||||||||
| 2008 | 2007 | 2006 | |||||||
| Professional and other fees related to the new CBS agreements, |
$ | 6,624 | $ | 3,626 | $ | 1,579 | |||
| Gores Investment and debt refinancing |
5,000 | — | — | ||||||
| Closing Payment to CBS related to the new CBS agreements |
— | 1,000 | — | ||||||
| Severance obligations related to executive officer changes |
1,621 | — | — | ||||||
| Re-engineering expenses |
$ | 13,245 | $ | 4,626 | $ | 1,579 | |||
NOTE 18—SEGMENT INFORMATION:
We established a new organizational structure in the fourth quarter of 2008, pursuant to which, we manage and report our business in two operating segments: Network and Metro/Traffic. We evaluated segment performance based on segment revenue and segment operating (loss)/income. Administrative functions such as finance, human resources and information systems are centralized. However, where applicable, portions of the administrative function costs are allocated between the operating segments. The operating segments do not share programming or report distribution. In the event any materials and/or services are provided to one operating segment by the other, the transaction is valued at fair market value. Operating costs and total assets are captured discretely within each segment.
Previously reported results of operations are presented to reflect these changes. Revenue, segment operating (loss)/income, depreciation, unusual items, capital expenditures and identifiable assets at December 31, 2008, 2007 and 2006, are summarized below according to these segments. This change did not impact the total consolidated results of operations. We continue to report certain administrative activities under corporate. We are domiciled in the United States with limited international operations comprising less than one percent of our revenue. No one customer represented more than 10% of our consolidated revenue.
Our Network Division produces and distributes regularly scheduled and special syndicated programs, including exclusive live concerts, music and interview shows, national music countdowns, lifestyle short features, news broadcasts, talk programs, sporting events and sports features.
Our Metro/Traffic Division provides traffic reports and local news, weather and sports information programming to radio and television affiliates and their websites.
| Year ended December 31, | |||||||||
| Net revenue | 2008 | 2007 | 2006 | ||||||
| Network |
$ | 209,532 | $ | 218,939 | $ | 246,317 | |||
| Metro/Traffic |
194,884 | 232,445 | 265,768 | ||||||
| Total Net Revenue |
$ | 404,416 | $ | 451,384 | $ | 512,085 | |||
F-36
Table of Contents
Notes to consolidated financial statements
(in thousands, except per share amounts)
| Year ended December 31, | ||||||||||||
| Segment operating (loss) income | 2008 | 2007 | 2006 | |||||||||
| Network |
$ | 14,562 | $ | 30,943 | $ | 38,192 | ||||||
| Metro/Traffic |
24,577 | 64,033 | 73,173 | |||||||||
| Total Segment Operating Income |
$ | 39,139 | $ | 94,976 | $ | 111,365 | ||||||
| Corporate Expenses |
(19,709 | ) | (27,043 | ) | (29,850 | ) | ||||||
| Restructuring and Special Charges |
(27,345 | ) | (4,626 | ) | (1,579 | ) | ||||||
| Goodwill Impairment |
(430,126 | ) | — | (515,916 | ) | |||||||
| Operating (Loss) Income |
$ | (438,041 | ) | $ | 63,307 | $ | (435,980 | ) | ||||
| Interest Expense |
(16,651 | ) | (23,626 | ) | (25,590 | ) | ||||||
| Other Income |
12,369 | 411 | 926 | |||||||||
| (Loss) Income Before Income Taxes |
$ | (442,323 | ) | $ | 40,092 | $ | (460,644 | ) | ||||
| Year ended December 31, | ||||||||||||
| Depreciation and amortization | 2008 | 2007 | 2006 | |||||||||
| Network |
$ | 3,139 | $ | 3,152 | $ | 3,571 | ||||||
| Metro/Traffic |
6,120 | 6,955 | 7,453 | |||||||||
| Corporate |
1,793 | 9,732 | 9,733 | |||||||||
| Total Depreciation and Amortization |
$ | 11,052 | $ | 19,839 | $ | 20,757 | ||||||
| Year ended December 31, | ||||||||||||
| Assets | 2008 | 2007 | 2006 | |||||||||
| Network |
$ | 92,109 | $ | 218,276 | $ | 217,700 | ||||||
| Metro/Traffic |
80,079 | 399,144 | 417,817 | |||||||||
| Corporate |
32,900 | 52,337 | 61,186 | |||||||||
| Total Assets |
$ | 205,088 | $ | 669,757 | $ | 696,703 | ||||||
| Year ended December 31, | ||||||||||||
| Capital expenditures | 2008 | 2007 | 2006 | |||||||||
| Network |
$ | 5,634 | $ | 1,800 | $ | 751 | ||||||
| Metro/Traffic |
1,538 | 4,042 | 4,059 | |||||||||
| Corporate |
141 | 7 | 1,071 | |||||||||
| Total Capital Expenditures |
$ | 7,313 | $ | 5,849 | $ | 5,881 | ||||||
F-37
Table of Contents
Notes to consolidated financial statements
(in thousands, except per share amounts)
NOTE 19—QUARTERLY RESULTS OF OPERATIONS (UNAUDITED):
The following is a tabulation of the unaudited quarterly results of operations. The quarterly results are presented for the years ended December 31, 2008 and 2007.
| First quarter |
Second quarter |
Third quarter |
Fourth quarter |
For the year |
||||||||||||||||
| Recast-note 1 | Recast-note 1 | Recast-note 1 | Recast-note 1 | Recast-note 1 | ||||||||||||||||
| 2008 |
||||||||||||||||||||
| Net revenue |
$ | 106,627 | $ | 100,372 | $ | 96,299 | $ | 101,118 | $ | 404,416 | ||||||||||
| Operating (loss) |
(3,000 | ) | (195,609 | ) | (7,555 | ) | (231,877 | ) | (438,041 | ) | ||||||||||
| Net (loss) |
(5,338 | ) | (199,744 | ) | (10 | ) | (222,471 | ) | (427,563 | ) | ||||||||||
| Net (loss) per share: |
||||||||||||||||||||
| Basic |
||||||||||||||||||||
| Common Stock |
$ | (11.94 | ) | $ | (396.88 | ) | $ | (2.88 | ) | $ | (443.88 | ) | $ | (878.73 | ) | |||||
| Class B Stock |
— | — | — | — | — | |||||||||||||||
| Diluted |
||||||||||||||||||||
| Common Stock |
$ | (11.94 | ) | $ | (396.88 | ) | $ | (2.88 | ) | $ | (443.88 | ) | $ | (878.73 | ) | |||||
| Class B Stock |
— | — | — | — | — | |||||||||||||||
| 2007 |
||||||||||||||||||||
| Net revenue |
$ | 113,959 | $ | 111,025 | $ | 108,083 | $ | 118,317 | $ | 451,384 | ||||||||||
| Operating Income |
7,262 | 16,618 | 19,686 | 19,741 | 63,307 | |||||||||||||||
| Net income |
715 | 6,897 | 8,452 | 8,304 | 24,368 | |||||||||||||||
| Net income per share: |
||||||||||||||||||||
| Basic |
||||||||||||||||||||
| Common Stock |
$ | 1.65 | $ | 16.02 | $ | 19.62 | $ | 19.28 | $ | 56.59 | ||||||||||
| Class B Stock |
$ | 3.20 | — | — | — | $ | 3.20 | |||||||||||||
| Diluted |
||||||||||||||||||||
| Common Stock |
$ | 1.65 | $ | 15.94 | $ | 19.55 | $ | 19.21 | $ | 56.38 | ||||||||||
| Class B Stock |
$ | 3.20 | — | — | — | $ | 3.20 | |||||||||||||
On August 3, 2009, a 200:1 reverse stock split was declared and effective and EPS has been adjusted accordingly.
In the fourth quarter of 2008 we recorded net adjustments of approximately $2,391 of expense for unused vacation time, a write-off of fixed assets and other miscellaneous items related to other periods. Additionally, in the second quarter of 2008, we recorded a decrease to our operating loss of approximately $1,496 for an adjustment to stock-based compensation.
In the third quarter and second quarter of 2007, we recorded net adjustments of approximately $1,000 that had the effect of increasing net income, and net adjustments of approximately $1,000 that had the effect of reducing net income, respectively. These adjustments were primarily comprised of the reversal of expense accruals offset by predominantly billing/revenue adjustments in the third quarter and overaccruals in the second quarter. In the fourth quarter, we recorded an adjustment of approximately $500 that had the effect of increasing net income related to an error in calculating our health care accrual in the fourth quarter, with no impact on the full year results.
We do not believe these adjustments are material to our Consolidated Financial Statements in any quarter or year of any prior period’s Consolidated Financial Statements. As a result, we have not restated any prior period amounts.
F-38
Table of Contents
Notes to consolidated financial statements
(in thousands, except per share amounts)
NOTE 20—SUBSEQUENT EVENTS:
On February 27, 2009, the debt outstanding under our Facility matured and became due and payable in its entirety (See Note 6 — Debt). We have not paid such amount, which constitutes an event of default under the credit agreement. In addition, we failed to pay our most recent semi-annual interest payment due in respect of the Senior Notes, which constitutes an event of default under the Note Purchase Agreement for the Senior Notes.
On March 3, 2009, we reached an agreement in principle with our existing lenders to refinance all of our outstanding indebtedness (approximately $241,000 in principal amount plus unpaid interest) in exchange for: (1) $25,000 in cash; (2) a series of new senior secured notes in an expected aggregate principal amount of $117,500; and (3) 25% of our pro forma common stock. The new notes are expected to mature on July 15, 2012.
On April 23, 2009 (the “Closing Date”), we completed the refinancing of our outstanding long-term indebtedness and the recapitalization of our equity.
Debt Restructuring
Securities purchase agreement
As part of the recapitalization, we entered into a Securities Purchase Agreement (“Securities Purchase Agreement”) with: (1) holders of the Company’s outstanding Senior Notes both of which were issued under the Note Purchase Agreement, dated as of December 3, 2002 and (2) lenders under the Credit Agreement, dated as of March 3, 2004 (the “Old Credit Agreement”).
Pursuant to the Securities Purchase Agreement, in consideration for releasing all of their respective claims under the Senior Notes and the Old Credit Agreement, the debt holders collectively received: (1) $117,500 of new senior secured notes maturing July 15, 2012 (the “New Senior Notes”); (2) 34,962 shares of 8.0% Series B Convertible Preferred Stock, par value $0.01 per share (the “Series B Preferred Stock”); and (3) a one-time cash payment of $25,000. Gores purchased at a discount certain debt held by debt holders who did not wish to participate in the New Senior Notes as set forth in the Securities Purchase Agreement.
The New Senior Notes bear interest at 15.0% per annum, payable 10% in cash and 5% in-kind (PIK interest). The PIK interest will be added to principal quarterly but will not be payable until maturity. The New Senior Notes may be prepaid at any time, in whole or in part, without premium or penalty. Payment of the New Senior Notes is mandatory upon, among other things, certain asset sales and the occurrence of a “change of control” (as such term is defined in the Securities Purchase Agreement).
The New Senior Notes are guaranteed by our domestic subsidiaries (the “Guarantors”) and are secured, pursuant to an amendment of our security agreement with the debt holders, by a first priority lien on substantially all of our assets.
We are subject to restrictive covenants that, among other things, limit our ability to incur debt, incur liens, make investments, make capital expenditures, consummate acquisitions, pay dividends, sell assets and enter into mergers and similar transactions beyond specified baskets and identified carve-outs. Additionally, we may not exceed the maximum senior leverage ratio (the principal amount outstanding under the New Senior Notes over our consolidated EBITDA). The Securities Purchase Agreement contains customary representations and warranties and affirmative covenants.
F-39
Table of Contents
Notes to consolidated financial statements
(in thousands, except per share amounts)
The Securities Purchase Agreement also contains customary events of default, including, without limitation, nonpayment of principal or other amounts when due; breach of covenants; inaccuracy of representations and warranties; cross-default to our other indebtedness or our subsidiaries; certain ERISA-related events; certain voluntary and involuntary bankruptcy events; certain judgment related defaults; and invalidity or imperfected liens on collateral. The Guarantors’ obligations under the guaranty will be triggered upon the occurrence of an event of default.
If an event of default occurs and is continuing under the Securities Purchase Agreement, any holder or holders of more than 50% in principal amount of the New Senior Notes may accelerate all of our obligations under the New Senior Notes. For events of default related to nonpayment of principal or interest, any two holders of the New Senior Notes (other than Gores) holding at least 15% (in the aggregate) of principal amount of the New Senior Notes affected by the event of default, may accelerate our obligations under the New Senior Notes held by them. For other events of default, the obligations under the New Senior Notes are automatically accelerated.
New credit agreement
In connection with the Debt Restructuring, we also entered into a Credit Agreement (the “Credit Agreement”) with Wells Fargo Foothill, LLC, as the arranger, administrative agent and initial lender, pursuant to which we obtained a $15,000 revolving line of credit (which includes a $1,500 letter of credit sub-facility) on a senior unsecured basis and a $20,000 unsecured non-amortizing term loan, the obligations in respect of which are subordinated to obligations in respect of the New Senior Notes. We borrowed the entire amount of the term loan on the Closing Date and did not make any borrowings under the revolving line of credit. Loans under the Credit Agreement will mature on July 15, 2012 and proceeds of the term loan will be used to, among other things, consummate the transactions contemplated by the Restructuring, and pay fees and expenses in connection therewith. Proceeds of the revolving loans are expected to be used for working capital and general corporate purposes.
Our obligations under the Credit Agreement are guaranteed by the Guarantors and Gores. Payment of the loans, under the Credit Agreement, is mandatory upon, among other things, certain asset sales and the occurrence of a change of control.
Loans under the Credit Agreement bear interest at our option at either LIBOR plus 4.5% per annum (with a LIBOR floor of 2.5%) or a base rate plus 4.5% per annum (with a base rate floor of the greater of 3.75% and the one-month LIBOR rate). The Credit Agreement contains substantially similar restrictive covenants (including a maximum senior leverage ratio calculated in a manner consistent with the Securities Purchase Agreement), affirmative covenants and representations and warranties as those found in the Securities Purchase Agreement, subject, in the case of certain covenants, to a cushion on baskets and covenant levels from those contained in the Securities Purchase Agreement.
The Credit Agreement contains customary events of default including, without limitation, nonpayment of principal or other amounts when due; breach of covenants; inaccuracy of representations and warranties; cross-acceleration to our other indebtedness; certain ERISA-related events; certain voluntary and involuntary bankruptcy events; certain judgment-related defaults; and certain events related to Gores, including defaults by Gores under the Gores guarantee and defaults by Gores under their other agreements with Wells Fargo Foothill unrelated to us. The Guarantors’ obligations under the guaranty will be triggered upon the occurrence of an event of default.
If an event of default occurs and is continuing under the Credit Agreement, the lenders may, among other things, terminate their obligations (including the revolver commitments) under the Credit Agreement and accelerate our obligations.
F-40
Table of Contents
Notes to consolidated financial statements
(in thousands, except per share amounts)
Equity Restructuring
Purchase agreement
In connection with the Equity Restructuring, we entered into a Purchase Agreement (the “Purchase Agreement”) with Gores Radio Holdings, LLC. In exchange for the then outstanding shares of Series A Preferred Stock held by Gores, we issued 75,000 shares of 7.50% Series A-1 Convertible Preferred Stock, par value $0.01 per share (the “Series A-1 Preferred Stock”). In addition Gores purchased 25,000 shares of Series B Preferred Stock (together with the Series A-1 Preferred Stock, the “Preferred Stock”), for an aggregate purchase price of $25,000.
Terms of series A-1 preferred stock
Holders of the Series A-1 Preferred Stock will be entitled to receive dividends at a rate of 7.50% per annum, compounded quarterly, which will be added to the liquidation preference (initially equal to $1,065 per share). The Series A-1 Preferred Stock ranks pari passu with the Series B Preferred Stock. If the Series A-1 Preferred Stock remains outstanding after June 19, 2013, the dividend rate will increase to 15.00% per annum. Holders of the Series A-1 Preferred Stock will also be entitled to receive dividends declared or paid on our common stock on an as-converted basis.
The Series A-1 Preferred Stock is convertible at the option of the holders into a number of shares of common stock by dividing the number of shares of Series A-1 Preferred Stock to be converted by the multiple of the liquidation preference and the conversion price in effect at the close of business on the conversion date.
After March 19, 2013, we have the sole option to redeem the Series A-1 Preferred Stock at any time provided we concurrently offer to redeem the same proportion (based on liquidation preference) of the Series B Preferred Stock on the same terms and conditions and at the same time. If the Series A-1 Preferred Stock remains outstanding after December 19, 2013, the liquidation preference per share will increase by 50%.
Terms of series B preferred stock
Holders of the Series B Preferred Stock will be entitled to receive dividends at a rate of 8.0% per annum, compounded quarterly, which will be added to the liquidation preference (initially equal to $1,000 per share). The Series B Preferred Stock ranks pari passu with the Series A-1 Preferred Stock. If the Series B Preferred Stock remains outstanding after June 19, 2013, the dividend rate will increase to 15.00% per annum. Holders of the Series B Preferred Stock will also be entitled to receive dividends declared or paid on the Common Stock on an as-converted basis.
The Series B Preferred Stock is convertible at the option of the holders into a number of shares of Common Stock by dividing the number of shares of Series B Preferred Stock to be converted by the multiple of the liquidation preference and the conversion price in effect at the close of business on the conversion date.
NOTE 21—SUBSEQUENT EVENTS (UNAUDITED):
A special meeting of stockholders to consider certain amendments to our Certificate of Incorporation (the “Charter Amendments) was held on August 3, 2009 where such amendments were approved by our stockholders. The Charter Amendments: (1) increased the number of authorized shares of our common stock from 300,000 to 5,000,000 (2) effected a reverse stock split of our outstanding common stock at a
F-41
Table of Contents
Notes to consolidated financial statements
(in thousands, except per share amounts)
ratio of two hundred to one (200:1) (see Note 1), (3) defined the term “Continuing Directors” that was used but not defined in the Certificate of Incorporation, (4) amended the Certificate of Incorporation to delete Article Sixteenth of the Certificate of Incorporation that set forth higher approval thresholds than those required under the Delaware General Corporation Law with respect to certain amendments of the Certificate of Incorporation and (5) amended the Certificate of Incorporation to delete the provision in Article Seventeenth relating to Article Sixteenth.
The Charter Amendments were made in connection with the refinancing of our debt which closed on April 23, 2009. On such date, the Series A-1 Convertible Preferred Stock and Series B Convertible Preferred Stock (collectively, the “Preferred Stock”) was issued but not converted because we did not have sufficient authorized shares of common stock into which the Preferred Stock could be converted. The Certificates of Designation for the Series A-1 Preferred Stock and Series B Preferred Stock, state that when the authorized shares of common stock were increased by a sufficient amount to allow the conversion of all Preferred Stock, the Preferred Stock would convert automatically, without further action required by us or any shareholder, into shares of common stock.
As previously disclosed, on July 9, 2009, Gores converted three thousand five hundred shares of Series A-1 Convertible Preferred Stock into 103,513 shares of common stock. Such conversion triggered the conversion of 292 shares of Class B Common into 292 shares of common stock pursuant to the terms of our Charter.
The conversion of Preferred Stock that occurred on August 3, 2009 increased the number of shares of common stock issued and outstanding from 206,263 to 4,062,446 on a pre-split basis, which was reduced to 20,312 shares after the 200:1 reverse stock split. While such technically resulted in substantial dilution to our common stockholders, the ownership interest of each of our common stockholders did not change substantially after the conversion of the Preferred Stock into common stock as the Preferred Stock that was issued on April 23, 2009 when our Refinancing closed from the time of its issuance participated on an as-converted basis with respect to voting, dividends and other economic rights as the common stock. Effective August 3, 2009, when the Charter Amendments were approved, the warrants issued to Gores on June 19, 2008 were cancelled.
F-42
Table of Contents
Schedule II — valuation and qualifying accounts
Allowance for doubtful accounts
| Balance at beginning of period |
Additions and expenses |
Deductions write-offs and other adjustments |
Balance at end of period | ||||||||||
| 2008 |
$ | 3,602 | $ | 439 | $ | (409 | ) | $ | 3,632 | ||||
| 2007 |
$ | 4,387 | $ | 139 | $ | (924 | ) | $ | 3,602 | ||||
| 2006 |
$ | 2,797 | $ | 2,323 | $ | (733 | ) | $ | 4,387 | ||||
F-43
Table of Contents
Part I. financial information
Westwood One, Inc.
Unaudited consolidated balance sheets
(In thousands, except per share amounts)
| Successor Company | Predecessor Company | |||||||||||
| June 30, 2009 | December 31, 2008 | |||||||||||
| (unaudited) | (derived from audited) | |||||||||||
| ASSETS |
||||||||||||
| CURRENT ASSETS: |
||||||||||||
| Cash and cash equivalents |
$ | 7,980 | $ | 6,437 | ||||||||
| Accounts receivable |
82,448 | 94,273 | ||||||||||
| Prepaid and other assets |
17,026 | 18,758 | ||||||||||
| Total Current Assets |
107,454 | 119,468 | ||||||||||
| Property and equipment, net |
36,357 | 30,417 | ||||||||||
| Goodwill |
86,414 | 33,988 | ||||||||||
| Intangible assets, net |
112,032 | 2,660 | ||||||||||
| Deferred tax asset |
2,385 | 14,220 | ||||||||||
| Other assets |
2,414 | 4,335 | ||||||||||
| TOTAL ASSETS |
$ | 347,056 | $ | 205,088 | ||||||||
| LIABILITIES, REDEEMABLE PREFERRED STOCK AND SHAREHOLDERS’ EQUITY (DEFICIT) |
||||||||||||
| CURRENT LIABILITIES: |
||||||||||||
| Accounts payable |
$ | 17,588 | $ | 27,807 | ||||||||
| Amounts payable to related parties |
20,128 | 22,680 | ||||||||||
| Deferred revenue |
2,681 | 2,397 | ||||||||||
| Accrued expenses and other liabilities |
19,648 | 25,565 | ||||||||||
| Current maturity of long-term debt |
— | 249,053 | ||||||||||
| Total Current Liabilities |
60,045 | 327,502 | ||||||||||
| Long-term debt |
128,078 | — | ||||||||||
| Deferred tax liability |
63,845 | — | ||||||||||
| Due to Gores |
10,891 | — | ||||||||||
| Other liabilities |
10,551 | 6,993 | ||||||||||
| TOTAL LIABILITIES |
273,410 | 334,495 | ||||||||||
| Commitments and Contingencies |
||||||||||||
| Redeemable Preferred Stock: $.01 par value, authorized: 75 shares; issued and outstanding: 75 shares of 7.5% Series A-1 Preferred Stock; liquidation preference $1,065 per share, plus accumulated dividends |
38,880 | |||||||||||
| Redeemable Preferred Stock: $.01 par value, authorized: 60 shares; issued and outstanding: 60 shares of 8.0% Series B Convertible Preferred Stock; liquidation preference $1,000 per share, plus accumulated dividends |
30,476 | |||||||||||
| Redeemable Preferred Stock: $.01 par value, authorized: 10,000 shares; issued and outstanding: 75 shares of 7.5% Series A Convertible Preferred Stock; liquidation preference $1,000 per share, plus accumulated dividends |
— | 73,738 | ||||||||||
| Total Redeemable Preferred Stock |
69,356 | 73,738 | ||||||||||
| SHAREHOLDERS’ (DEFICIT) EQUITY |
||||||||||||
| Common stock, $.01 par value: authorized: 300,000 shares; issued and outstanding: 510 (2009) and 101,253 (2008) |
5 | 1,013 | ||||||||||
| Class B stock, $.01 par value: authorized: 3,000 shares; issued and outstanding: 292 (2009 and 2008) |
3 | 3 | ||||||||||
| Additional paid-in capital |
10,561 | 293,120 | ||||||||||
| Net unrealized gain |
(95 | ) | 267 | |||||||||
| Accumulated deficit |
(6,184 | ) | (497,548 | ) | ||||||||
| TOTAL SHAREHOLDERS’ EQUITY (DEFICIT) |
4,290 | (203,145 | ) | |||||||||
| TOTAL LIABILITIES, REDEEMABLE PREFERRED STOCK AND SHAREHOLDERS’ EQUITY (DEFICIT) |
$ | 347,056 | $ | 205,088 | ||||||||
See accompanying notes to consolidated financial statements
F-44
Table of Contents
Westwood One, Inc.
Unaudited consolidated statement of operations
(In thousands, except share and per share amounts)
(unaudited)
| Successor Company | Predecessor Company | |||||||||||||||||||||||
| For the period April 24, 2009 to June 30, 2009 |
For the period April 1, 2009 to April 23, 2009 |
Three months June 30, 2008 |
For the period January 1, 2009 |
Six months ended June 30, 2008 |
||||||||||||||||||||
| NET REVENUE |
$ | 58,044 | $ | 25,607 | $ | 100,372 | $ | 111,474 | $ | 206,998 | ||||||||||||||
| Operating Costs |
52,116 | 20,187 | 85,411 | 111,580 | 179,640 | |||||||||||||||||||
| Depreciation and Amortization |
5,845 | 521 | 2,421 | 2,585 | 6,397 | |||||||||||||||||||
| Corporate General and Administrative Expenses |
2,407 | 1,482 | 1,199 | 4,248 | 4,665 | |||||||||||||||||||
| Goodwill Impairment |
— | — | 206,053 | — | 206,053 | |||||||||||||||||||
| Restructuring Charges |
1,454 | 536 | — | 3,976 | — | |||||||||||||||||||
| Special Charges |
368 | 7,010 | 897 | 12,819 | 8,853 | |||||||||||||||||||
| 62,190 | 29,736 | 295,981 | 135,208 | 405,608 | ||||||||||||||||||||
| OPERATING (LOSS) INCOME |
(4,146 | ) | (4,129 | ) | (195,609 | ) | (23,734 | ) | (198,610 | ) | ||||||||||||||
| Interest Expense (Income) |
4,692 | (41 | ) | 4,352 | 3,222 | 9,751 | ||||||||||||||||||
| Other Income |
(4 | ) | (59 | ) | (43 | ) | (359 | ) | (85 | ) | ||||||||||||||
| INCOME (LOSS) BEFORE INCOME TAX |
(8,834 | ) | (4,029 | ) | (199,918 | ) | (26,596 | ) | (208,276 | ) | ||||||||||||||
| INCOME TAX (BENEFIT) EXPENSE |
(2,650 | ) | (254 | ) | (174 | ) | (7,635 | ) | (3,194 | ) | ||||||||||||||
| NET (LOSS) INCOME |
$ | (6,184 | ) | $ | (3,775 | ) | $ | (199,744 | ) | $ | (18,961 | ) | $ | (205,082 | ) | |||||||||
| NET (LOSS) INCOME attributable to Common Stockholders |
$ | (9,595 | ) | $ | (5,387 | ) | $ | (199,932 | ) | $ | (22,037 | ) | $ | (205,270 | ) | |||||||||
| (LOSS) EARNINGS PER SHARE COMMON STOCK |
||||||||||||||||||||||||
| BASIC |
$ | (18.85 | ) | $ | (10.67 | ) | $ | (396.69 | ) | $ | (43.64 | ) | $ | (431.24 | ) | |||||||||
| DILUTED |
$ | (18.85 | ) | $ | (10.67 | ) | $ | (396.69 | ) | $ | (43.64 | ) | $ | (431.24 | ) | |||||||||
| CLASS B STOCK |
||||||||||||||||||||||||
| BASIC |
$ | — | $ | — | $ | — | $ | — | $ | — | ||||||||||||||
| DILUTED |
$ | — | $ | — | $ | — | $ | — | $ | — | ||||||||||||||
| WEIGHTED AVERAGE SHARES |
||||||||||||||||||||||||
| OUTSTANDING: |
||||||||||||||||||||||||
| COMMON STOCK |
||||||||||||||||||||||||
| BASIC |
509 | 505 | 504 | 505 | 476 | |||||||||||||||||||
| DILUTED |
509 | 505 | 504 | 505 | 476 | |||||||||||||||||||
| CLASS B STOCK* |
||||||||||||||||||||||||
| BASIC |
292 | 292 | 292 | 292 | 292 | |||||||||||||||||||
| DILUTED |
292 | 292 | 292 | 292 | 292 | |||||||||||||||||||
| * | Reverse stock split not reflected in total. Class B Stock was converted into common stock prior to effectiveness of reverse stock split. |
See accompanying notes to consolidated financial statements
F-45
Table of Contents
Westwood One, Inc.
Unaudited consolidated statement of cash flows
(In thousands, except share and per share amounts)
(unaudited)
| Successor Company |
Predecessor Company |
|||||||||||||
| For the period April 24, 2009 to June 30, 2009 |
For the period January 1, 2009 to April 23, 2009 |
Six months ended June 30, 2008 |
||||||||||||
| CASH FLOW FROM OPERATING ACTIVITIES: |
||||||||||||||
| Net (loss) |
$ | (6,184 | ) | $ | (18,961 | ) | $ | (205,082 | ) | |||||
| Adjustments to reconcile net (loss) to net cash provided by operating activities: |
||||||||||||||
| Depreciation and amortization |
5,845 | 2,585 | 6,397 | |||||||||||
| Goodwill impairment |
206,053 | |||||||||||||
| Loss on disposal of property and equipment |
76 | 188 | ||||||||||||
| Deferred taxes |
2,162 | (6,874 | ) | (7,196 | ) | |||||||||
| Non-cash stock compensation |
852 | 2,110 | 2,455 | |||||||||||
| Amortization of deferred financing costs |
331 | 792 | ||||||||||||
| Net change in assets and liabilities (net of effect of Refinancing): |
(17,078 | ) | 19,844 | (8,261 | ) | |||||||||
| Net Cash (Used) By Operating Activities |
(14,327 | ) | (777 | ) | (4,842 | ) | ||||||||
| CASH FLOW FROM INVESTING ACTIVITIES: |
||||||||||||||
| Capital expenditures |
(1,546 | ) | (1,384 | ) | (6,078 | ) | ||||||||
| Net Cash (Used) In Investing Activities |
(1,546 | ) | (1,384 | ) | (6,078 | ) | ||||||||
| CASH FLOW FROM FINANCING ACTIVITIES: |
||||||||||||||
| Issuance of common stock |
22,750 | |||||||||||||
| Issuance of series A convertible preferred stock and warrants |
74,178 | |||||||||||||
| Issuance of series B convertible preferred stock |
25,000 | |||||||||||||
| Debt repayments |
(25,000 | ) | (85,000 | ) | ||||||||||
| Payments of capital lease obligations |
(152 | ) | (271 | ) | (343 | ) | ||||||||
| Proceeds from term loan |
20,000 | |||||||||||||
| Deferred financing costs |
— | (1,537 | ) | |||||||||||
| Net Cash Provided (Used) in Financing Activities |
19,848 | (271 | ) | 10,048 | ||||||||||
| NET INCREASE (DECREASE) IN CASH AND CASH EQUIVALENTS |
3,975 | (2,432 | ) | (872 | ) | |||||||||
| CASH AND CASH EQUIVALENTS AT BEGINNING OF PERIOD |
4,005 | 6,437 | 6,187 | |||||||||||
| CASH AND CASH EQUIVALENTS AT END OF PERIOD |
$ | 7,980 | $ | 4,005 | $ | 5,315 | ||||||||
| Supplemental disclosure of cash flow information: |
||||||||||||||
| Non-cash financing activities(1) |
||||||||||||||
| Cancellation of long-term debt(2) |
— | 252,060 | — | |||||||||||
| Issuance of new long-term debt(2) |
117,500 | — | — | |||||||||||
| (1) | All of the Series A Preferred Stock was exchange for all of the Series A-1 Preferred Stock. |
| (2) | 34,962 shares of the Series B Preferred Stock was issued to our lenders in exchange in part for the cancellation of prior indebtedness. |
See accompanying notes to consolidated financial statements
F-46
Table of Contents
Westwood One, Inc
Unaudited consolidated statements of shareholders’ equity
(In thousands, except per share amounts)
PREDECESSOR COMPANY
| Common stock | Class B stock | Additional paid-in capital |
(Accumulated deficit) retained earnings |
Unrealized gain (loss) on available for sale securities |
Total share- holders’ equity |
Accumulated other compre- hensive (loss) |
|||||||||||||||||||||||
| Shares | Amount | Shares | Amount | ||||||||||||||||||||||||||
| Balance as of December 31, 2008 |
101,253 | $ | 1,013 | 292 | $ | 3 | $ | 293,120 | $ | (497,548 | ) | $ | 267 | $ | (203,145 | ) | $ | (433,251 | ) | ||||||||||
| Net loss |
(18,961 | ) | (18,961 | ) | (18,961 | ) | |||||||||||||||||||||||
| Comprehensive income |
219 | 219 | 219 | ||||||||||||||||||||||||||
| Equity based compensation |
2,110 | 2,110 | |||||||||||||||||||||||||||
| Issuance common stock under equity based compensation plans |
777 | 7 | (939 | ) | (932 | ) | |||||||||||||||||||||||
| Issuance of common stock |
— | ||||||||||||||||||||||||||||
| Preferred stock accretion |
(6,157 | ) | — | (6,157 | ) | ||||||||||||||||||||||||
| Cancellations of vested equity grants |
(890 | ) | (890 | ) | |||||||||||||||||||||||||
| Ending Balance as of April 23, 2009 |
102,030 | $ | 1,020 | 292 | $ | 3 | $ | 287,244 | $ | (516,509 | ) | $ | 486 | $ | (227,756 | ) | $ | (451,993 | ) | ||||||||||
SUCCESSOR COMPANY
| Common stock | Class B stock | Additional paid-in capital |
(Accumulated deficit) retained earnings |
Unrealized gain (loss) on available for sale securities |
Total Share- holders’ equity |
Accumulated other compre- hensive (loss) |
|||||||||||||||||
| Shares | Amount | Shares | Amount | ||||||||||||||||||||
| Revalued Capital |
510 | 5 | 292 | 3 | 2,256 | 2,264 | |||||||||||||||||
| Net loss |
(6,184 | ) | (6,184 | ) | (6,184 | ) | |||||||||||||||||
| Comprehensive (loss) |
(95 | ) | (95 | ) | (95 | ) | |||||||||||||||||
| Equity based compensation |
852 | 852 | |||||||||||||||||||||
| Issuance common stock under equity based compensation plans |
(19 | ) | (19 | ) | |||||||||||||||||||
| Preferred stock accretion |
(2,979 | ) | (2,979 | ) | |||||||||||||||||||
| Cancellations of vested equity grants |
(59 | ) | (59 | ) | |||||||||||||||||||
| Beneficial conversion feature |
10,510 | 10,510 | |||||||||||||||||||||
| Balance as of June 30, 2009 |
510 | 5 | 292 | 3 | 10,561 | (6,184 | ) | (95 | ) | 4,290 | (6,279 | ) | |||||||||||
See accompanying notes to consolidated financial statements
F-47
Table of Contents
Westwood One, Inc.
Notes to consolidated financial statements
(in thousands, except per share amounts)
NOTE 1—BASIS OF PRESENTATION:
In this report, “Westwood One,” “Company,” “registrant,” “we”, “us” and “our” refer to Westwood One, Inc. The accompanying unaudited consolidated financial statements have been prepared by us pursuant to the rules of the Securities and Exchange Commission (“SEC”). These financial statements should be read in conjunction with the audited financial statements and footnotes included in this prospectus.
In the opinion of management, all adjustments, consisting of normal and recurring adjustments necessary for a fair statement of the financial position, the results of operations and cash flows for the periods presented have been recorded. The results of operations for the periods ended April 23, 2009 and June 30, 2009 are not necessarily indicative of the operating results for a full fiscal year.
On April 23, 2009, we completed a refinancing of substantially all of our outstanding long-term indebtedness (approximately $241,000 in principal amount) and a recapitalization of our equity (the “Refinancing”). As part of the Refinancing we entered into a Purchase Agreement (the “Purchase Agreement”) with Gores Radio Holdings, LLC (currently our ultimate parent) (together with certain related entities “Gores”). In exchange for the then outstanding shares of Series A Preferred Stock held by Gores, we issued 75,000 shares of 7.50% Series A-1 Convertible Preferred Stock, par value $0.01 per share (the “Series A-1 Preferred Stock”). In addition Gores purchased 25,000 shares of 8.0% Series B Convertible Preferred Stock (the “Series B Preferred Stock” and together with the Series A-1 Preferred Stock, the “Preferred Stock”), for an aggregate purchase price of $25,000.
Additionally and simultaneously, we entered into a Securities Purchase Agreement (“Securities Purchase Agreement”) with: (1) holders of our then outstanding Senior Notes (“Old Notes”) both series of which were issued under the Note Purchase Agreement, dated as of December 3, 2002 and (2) lenders under the Credit Agreement, dated as of March 3, 2004 (the “Old Credit Agreement”). Gores purchased at a discount approximately $22,600 in principal amount of our then existing debt held by debt holders who did not wish to participate in the New Senior Notes, which upon completion of the Refinancing was exchanged for $10,797 of the New Senior Notes. Gores also agreed to guarantee the Senior Credit Facility and a $10,000 contractual commitment by one of our wholly owned subsidiaries. Gores currently holds $10,891 (including PIK interest) of the New Senior Notes shown in the line item Due to Gores on our balance sheet. Pursuant to the Securities Purchase Agreement, in consideration for releasing all of their respective claims under the Senior Notes and the Old Credit Agreement, the participating debt holders collectively received in exchange for their outstanding debt: (1) $117,500 of new senior secured notes maturing July 15, 2012 (the “New Senior Notes”); (2) 34,962 shares of Series B Preferred Stock, and (3) a one-time cash payment of $25,000.
As a result of the Refinancing, Gores acquired approximately 75.1% of our equity (in preferred and common stock) and our then existing lenders acquired approximately 23.0% of our equity (in preferred and common stock). We have considered the ownership held by Gores and our existing debt holders as a collaborative group in accordance with Emerging Issues Task Force D-97, “Push Down Accounting”. As a result, have followed the acquisition method of accounting, as described by SFAS No. 141 (revised 2007), “Business Combinations” (“SFAS 141R”), and have applied the SEC rules and guidance regarding
F-48
Table of Contents
Notes to consolidated financial statements
(in thousands, except per share amounts)
“push down” accounting treatment. Accordingly, our consolidated financial statements and transactional records prior to the closing of the Refinancing reflect the historical accounting basis in our assets and liabilities and are labeled predecessor company, while such records subsequent to the Refinancing are labeled successor company and reflect the push down basis of accounting for the new fair values in our financial statements. This is presented in our consolidated financial statements by a vertical black line division which appears between the columns entitled predecessor company and successor company on the statements and relevant notes. The black line signifies that the amounts shown for the periods prior to and subsequent to the Refinancing are not comparable.
Based on the complex structure of the Refinancing described above, a valuation was performed to determine the acquisition price using the Income Approach employing a Discounted Cash Flow (DCF) methodology. The DCF method explicitly recognizes that the value of a business enterprise is equal to the present value of the cash flows that are expected to be available for distribution to the equity and/or debt holders of a company. In the valuation of a business enterprise, indications of value are developed by discounting future net cash flows available for distribution to their present worth at a rate that reflects both the current return requirements of the market and the risk inherent in the specific investment.
We used a multi-year DCF model to derive a Total Invested Capital (TIC) value which was adjusted for cash, non-operating assets and any negative net working capital to calculate a Business Enterprise Value (BEV) which was then used to value our equity. In connection with the Income Approach portion of this exercise, we made the following assumptions: (a) the discount rate was based on an average of a range of scenarios with rates between 15% and 16%; (b) management’s estimates of future performance of our operations and; (c) a terminal growth rate of 2%. The discount rate and market growth rate reflect the risks associated with the general economic pressure impacting both the economy in general and more specifically and substantially the advertising industry. All costs and professional fees incurred as part of the Refinancing totaling approximately $15,777 have been expensed as special charges in periods ended April 23, 2009 and prior (the predecessor company).
The allocation of Business Enterprise Value is as follows:
| Current Assets |
$ | 104,641 | |
| Goodwill |
86,414 | ||
| Intangibles |
116,910 | ||
| Property, Plant and Equipment, Net |
36,270 | ||
| Other Assets |
21,913 | ||
| Current Liabilities |
81,160 | ||
| Deferred Income Taxes |
77,879 | ||
| Due to Gores |
10,797 | ||
| Other Liabilities |
10,458 | ||
| Long-term Debt |
106,703 | ||
| Total Business Enterprise Value |
$ | 79,151 | |
We expect to finalize the valuation and complete the allocation of the Business Enterprise Value as soon as practicable but no later than one year from the acquisition date.
The following unaudited pro forma financial summary for the three and six months ended June 30, 2008 and 2009 gives effect to the Refinancing, the resultant acquisition accounting and the conversion of all of the Series A-1 Preferred Stock and the Series B Preferred Stock to common stock and the effects of the 200:1 reverse stock split as if each had been consummated on January 1, 2008 and January 1, 2009,
F-49
Table of Contents
Notes to consolidated financial statements
(in thousands, except per share amounts)
respectively. The pro forma information does not purport to be indicative of what the financial condition or results of operations would have been had the Refinancing been completed on the applicable dates of the pro forma financial information.
| Unaudited pro forma | ||||||||||||||||
| Three months ended June 30, |
Six months ended June 30, |
|||||||||||||||
| 2009 | 2008 | 2009 | 2008 | |||||||||||||
| Revenue |
$ | 83,651 | $ | 100,372 | $ | 169,518 | $ | 206,998 | ||||||||
| Net Loss |
(15,275 | ) | (209,013 | ) | (35,589 | ) | (222,258 | ) | ||||||||
| EPS |
$ | (0.75 | ) | $ | (10.29 | ) | $ | (1.75 | ) | $ | (10.94 | ) | ||||
In the 23-day period ended April 23, 2009, we determined that we had incorrectly recorded a credit to interest expense, which should have been recorded in the three-month period ended March 31, 2009, for the settlement of an amount owed to a former employee. We determined that this error was not significant to any prior period results and accordingly reduced the 23-day period’s interest expense by $754. Also in the period ended April 23, 2009, we determined that we incorrectly calculated the accretion of our preferred shares to redemption value which should have been recorded in the three-month period ended March 31, 2009. We determined that this error was not significant to any prior results and does not affect our Net (Loss) Income. However, it does reduce the 23-day period’s Net Loss attributable to Common Stockholders by $1,262. We do not believe these adjustments are material to our current period consolidated financial statements or to any prior period’s consolidated financial statements. As a result, we have not restated any prior period amounts.
NOTE 2—EARNINGS PER SHARE:
Prior to the Refinancing described in Note 1—Basis of Presentation, we had outstanding two classes of common stock (common stock and Class B stock) and a class of preferred stock (7.5% Series A Convertible Preferred Stock, referred to herein as the “Series A Preferred Stock”). Both the Class B stock and the Series A Preferred Stock were convertible into common stock. To the extent declared by our board of directors, the common stock was entitled to cash dividends of at least ten percent higher than those declared and paid on our Class B stock, and the Series A Preferred Stock was also entitled to receive such dividends on an as-converted basis if and when declared by the Board.
As described in more detail above, as part of the Refinancing, we issued Series A-1 Preferred Stock and Series B Preferred Stock. To the extent declared by our board of directors, the Series A Preferred Stock and Series B Preferred Stock were also entitled to receive such dividends on as as-converted basis if and when declared by the board of directors. The Series A Preferred Stock, Series A-1 Preferred Stock and Series B Preferred Stock are considered participating securities requiring use of the “two-class” method for the computation of basic net income (loss) per share in accordance with EITF Issue No. 03-6, Participating Securities and the Two-Class Method under FASB Statement No. 128, Earnings per Share (“EITF 03-06”). Losses were not allocated to the Series A Preferred Stock, Series A-1 Preferred Stock or Series B Preferred Stock in the computation of basic earnings per share (“EPS”) as the Series A Preferred Stock, Series A-1 Preferred Stock and the Series B Preferred Stock were not obligated to share in losses. Diluted earnings per share is computed using the “if-converted” method.
Basic EPS excludes the effect of common stock equivalents and is computed using the “two-class” computation method, which divides the sum of distributed earnings to common and Class B stockholders and undistributed earnings allocated to common stockholders and preferred stockholders on a pro rata
F-50
Table of Contents
Notes to consolidated financial statements
(in thousands, except per share amounts)
basis, after Series A Preferred Stock dividends, by the weighted average number of shares of common stock outstanding during the period. Diluted earnings per share reflects the potential dilution that could result if securities or other contracts to issue common stock were exercised or converted into common stock. Diluted earnings per share assumes the exercise of stock options using the treasury stock method and the conversion of Class B stock, Series A Preferred Stock, Series A-1 Preferred Stock and Series B Preferred Stock using the “if-converted” method.
Common equivalent shares are excluded in periods in which they are anti-dilutive. Options, restricted stock, restricted stock units, warrants (see Note 11—Equity Based Compensation) and Series A Preferred Stock were excluded from the predecessor company calculations of diluted earnings per share because the conversion price, combined exercise price, unamortized fair value and excess tax benefits were greater than the average market price of our common stock for the periods presented. Options, restricted stock, restricted stock units, warrants, Series A-1 Preferred Stock and Series B Preferred Stock were excluded from the successor company calculations of diluted earnings per share because the conversion price, combined exercise price, unamortized fair value and excess tax benefits were greater than the average market price of our common stock for the periods presented.
In connection with the Refinancing and the issuance of the Preferred Stock, we have determined that such Preferred Stock contain a beneficial conversion feature (“BCF”), that is partially contingent. The BCF is measured as the spread between the effective conversion price and the market price of common stock on the commitment date and then multiplying this spread by the number of conversion shares, as adjusted for the contingent shares. A portion of the BCF has been recognized at issuance (issuance BCF) while the majority of the BCF is contingent (contingent BCF) upon the authorization of additional common shares which did not occur until August 3, 2009.
The total BCF, which is limited to the carrying value of the preferred stock, is approximately $76,900, of which $10,900 relates to the issuance BCF and will be amortized using the effective yield method over the period until conversion (4 years) resulting in a reduction to income allocable to common shareholders of $400 for the period ending June 30, 2009 The contingent BCF which amounts to $66,000 (and was limited to the carrying amount of the Preferred Stock), will be recognized when the contingency is resolved in the third quarter (August 3, 2009) which due to the immediate conversion, will result in, among other effects, a deemed dividend that will be included in earnings per share calculation.
F-51
Table of Contents
Notes to consolidated financial statements
(in thousands, except per share amounts)
EPS calculations for all periods reflect the effects of the 200:1 reverse stock split (see Note 18—Subsequent Events).
| Successor Company | Predecessor Company | |||||||||||||||||||||||
| For the period April 24, 2009 to June 30, 2009 |
For the period April 1, 2009 to April 23, 2009 |
Three months ended June 30, 2008 |
For the period January 1, 2009 to April 23, 2009 |
Six months ended June 30, 2008 |
||||||||||||||||||||
| Net (Losses) Income |
$ | (6,184 | ) | $ | (3,775 | ) | $ | (199,744 | ) | $ | (18,961 | ) | $ | (205,082 | ) | |||||||||
| Less: Accumulated Preferred Stock dividends and accretion |
(3,411 | ) | (1,612 | ) | (188 | ) | (3,076 | ) | (188 | ) | ||||||||||||||
| Less: distributed earnings to common stockholders |
— | — | — | — | — | |||||||||||||||||||
| Less: distributed earnings to Class B stockholders |
— | — | — | — | — | |||||||||||||||||||
| Undistributed earnings |
$ | (9,595 | ) | $ | (5,387 | ) | $ | (199,932 | ) | $ | (22,037 | ) | $ | (205,270 | ) | |||||||||
| Earnings—common stock |
||||||||||||||||||||||||
| Basic |
||||||||||||||||||||||||
| Distributed earnings to common stockholders |
$ | — | $ | — | $ | — | $ | — | $ | — | ||||||||||||||
| Undistributed earnings allocated to common stockholders |
(9,595 | ) | (5,387 | ) | (199,932 | ) | (22,037 | ) | (205,270 | ) | ||||||||||||||
| Total Earnings—common stock, basic |
$ | (9,595 | ) | $ | (5,387 | ) | $ | (199,932 | ) | $ | (22,037 | ) | $ | (205,270 | ) | |||||||||
| Diluted |
||||||||||||||||||||||||
| Distributed earnings to common stockholders |
$ | — | ||||||||||||||||||||||
| Distributed earnings to Class B stockholders |
— | |||||||||||||||||||||||
| Undistributed earnings allocated to common stockholders |
(9,595 | ) | (5,387 | ) | (199,932 | ) | (22,037 | ) | (205,270 | ) | ||||||||||||||
| Total Earnings—common stock, diluted |
$ | (9,595 | ) | $ | (5,387 | ) | $ | (199,932 | ) | $ | (22,037 | ) | $ | (205,270 | ) | |||||||||
| Weighted average common shares outstanding, basic |
||||||||||||||||||||||||
| Share-based compensation |
509 | 505 | 504 | 505 | 476 | |||||||||||||||||||
| Warrants |
— | — | — | — | ||||||||||||||||||||
| Weighted average Class B shares |
— | — | — | — | ||||||||||||||||||||
| Weighted average common shares outstanding, diluted |
509 | 505 | 504 | 505 | 476 | |||||||||||||||||||
| (Loss) Earnings per common share, basic |
||||||||||||||||||||||||
| Distributed earnings, basic |
$ | — | $ | — | $ | — | $ | — | $ | — | ||||||||||||||
| Undistributed earnings—basic |
(18.85 | ) | (10.67 | ) | (396.69 | ) | (43.64 | ) | (431.24 | ) | ||||||||||||||
| Total |
$ | (18.85 | ) | $ | (10.67 | ) | $ | (396.69 | ) | $ | (43.64 | ) | $ | (431.24 | ) | |||||||||
| (Loss) Earnings per common share, diluted |
||||||||||||||||||||||||
| Distributed earnings, diluted |
$ | — | $ | — | $ | — | $ | — | $ | — | ||||||||||||||
| Undistributed earnings—diluted |
(18.85 | ) | (10.67 | ) | (396.69 | ) | (43.64 | ) | (431.24 | ) | ||||||||||||||
| Total |
$ | (18.85 | ) | $ | (10.67 | ) | $ | (396.69 | ) | $ | (43.64 | ) | $ | (431.24 | ) | |||||||||
| Earnings per share—Class B Stock |
||||||||||||||||||||||||
| Basic |
||||||||||||||||||||||||
| Distributed earnings to Class B stockholders |
$ | — | $ | — | $ | — | $ | — | $ | — | ||||||||||||||
| Undistributed earnings allocated to Class B stockholders |
— | — | — | — | — | |||||||||||||||||||
| Total Earnings—Class B Stock, basic |
$ | — | $ | — | $ | — | $ | — | $ | — | ||||||||||||||
| Diluted |
||||||||||||||||||||||||
| Distributed earnings to Class B stockholders |
$ | — | $ | — | $ | — | $ | — | $ | — | ||||||||||||||
| Undistributed earnings allocated to Class B stockholders |
— | — | — | — | — | |||||||||||||||||||
| Total Earnings— Class B Stock, diluted |
$ | — | $ | — | $ | — | $ | — | $ | — | ||||||||||||||
| Weighted average Class B shares outstanding, basic |
292 | 292 | 292 | 292 | 292 | |||||||||||||||||||
| Share-based compensation |
— | — | — | — | — | |||||||||||||||||||
| Warrants |
— | — | — | — | — | |||||||||||||||||||
| Weighted average Class B shares outstanding, diluted |
292 | 292 | 292 | 292 | 292 | |||||||||||||||||||
| Earnings per Class B share, basic |
||||||||||||||||||||||||
| Distributed earnings, basic |
$ | — | $ | — | $ | — | $ | — | $ | — | ||||||||||||||
| Undistributed earnings—basic |
— | — | — | — | — | |||||||||||||||||||
| Total |
$ | — | $ | — | $ | — | $ | — | $ | — | ||||||||||||||
| Earnings per Class B share, diluted |
||||||||||||||||||||||||
| Distributed earnings, diluted |
$ | — | $ | — | $ | — | $ | — | $ | — | ||||||||||||||
| Undistributed earnings—diluted |
— | — | — | — | — | |||||||||||||||||||
| Total |
$ | — | $ | — | $ | — | $ | — | $ | — | ||||||||||||||
F-52
Table of Contents
Notes to consolidated financial statements
(in thousands, except per share amounts)
NOTE 3—RELATED PARTY TRANSACTIONS:
On March 3, 2008, we closed the new Master Agreement with CBS Radio, which documents a long-term arrangement through March 31, 2017. As part of the new arrangement, CBS Radio agreed to broadcast certain of our local/regional and national commercial inventory through March 31, 2017 in exchange for certain programming and/or cash compensation. Additionally, the News Programming Agreement, the Technical Services Agreement and the Trademark License Agreement were amended and restated and extended through March 31, 2017. The previous Management Agreement and Representation Agreement were cancelled on March 3, 2008 and $16,300 of compensation previously paid to CBS Radio under those agreements, was added to the maximum potential compensation CBS Radio affiliate stations could earn pursuant to their affiliations with us. In addition, all warrants previously granted to CBS Radio were cancelled on March 3, 2008.
We incurred the following expenses relating to transactions with CBS Radio and/or its affiliates:
| Successor Company | Predecessor Company | ||||||||||||||||||
| For the period April 24, 2009 to June 30, 2009 |
For the period April 1, 2009 to April 23, 2009 |
Three months ended June 30, 2008 |
For the period to April 23, 2009 |
Six months June 30, 2008 | |||||||||||||||
| Representation Agreement |
$ | — | $ | — | $ | — | $ | — | $ | 2,583 | |||||||||
| News Agreement |
2,502 | 859 | 3,247 | 4,107 | 6,362 | ||||||||||||||
| Programming and Affiliate Arrangements |
9,689 | 4,112 | 15,198 | 20,884 | 27,375 | ||||||||||||||
| Consulting Fees |
296 | 804 | 2,517 | ||||||||||||||||
| Management Agreement (excluding warrant amortization) |
— | — | — | — | 610 | ||||||||||||||
| Warrant Amortization |
— | — | — | — | 1,618 | ||||||||||||||
| Payment upon closing of Master Agreement |
— | — | — | — | 5,000 | ||||||||||||||
| $ | 12,487 | $ | 5,775 | $ | 18,445 | $ | 27,508 | $ | 43,548 | ||||||||||
Expenses incurred for the Representation Agreement and programming and affiliate arrangements are included as a component of operating costs in the accompanying Consolidated Statement of Operations. Expenses incurred for the Management Agreement (excluding warrant amortization) and amortization of the warrants granted to CBS Radio under the Management Agreement are included as a component of corporate general and administrative expenses and depreciation and amortization, respectively, in the accompanying Consolidated Statement of Operations. The expense incurred upon closing of the Master Agreement is included as a component of special charges in the accompanying Consolidated Statement of Operations. The description and amounts regarding related party transactions set forth in these consolidated financial statements and related notes, also reflect transactions between us and Viacom. Viacom is an affiliate of CBS Radio, as National Amusements, Inc. beneficially owns a majority of the voting power of all classes of common stock of each of CBS Corporation and Viacom. As a result of the Charter Amendments approved on August 3, 2009, CBS Radio which previously owned approximately 15.8% of our common stock, now owns less than 1% of our common stock. As a result of this change in ownership and the fact that CBS Radio ceased to manage us in March 2008, we no longer consider CBS Radio to be a related party effective as of August 3, 2009.
F-53
Table of Contents
Notes to consolidated financial statements
(in thousands, except per share amounts)
Gores Radio Holdings
We have a related party relationship with Gores. As a result of our Refinancing, Gores created a holding company which owns approximately 75.1% of our equity and is our ultimate parent company. Gores currently also holds $10,891 (including PIK interest) of our New Senior Notes as a result of purchasing debt from certain of our former debt holders who did not wish to participate in the issuance of the New Senior Notes on April 23, 2009 in connection with our Refinancing. Such debt is classified as Due to Gores on our balance sheet.
We recorded fees related to consultancy and advisory services rendered by Gores and Glendon Partners, an operating group associated with Gores as follows:
| Successor Company | Predecessor Company | ||||||||||||||||||
| For the period April 24, 2009 to June 30, 2009 |
For the period April 1, 2009 to April 23, 2009 |
Three months ended June 30, 2008 |
For the period January 1, 2009 to April 23, 2009 |
Six months ended June 30, 2008 | |||||||||||||||
| Consultancy and Advisory Fees |
$ | — | $ | 470 | $ | — | $ | 1,533 | $ | — | |||||||||
| Gores Radio Holdings, LLC |
230 | 230 | |||||||||||||||||
| Glendon Partners Fees |
296 | 104 | — | 754 | — | ||||||||||||||
| $ | 296 | $ | 804 | $ | — | $ | 2,517 | $ | — | ||||||||||
POP Radio
We also have a related party relationship, including a sales representation agreement, with our investee, POP Radio, L.P. We recorded fees as follows:
| Successor Company | Predecessor Company | ||||||||||||||||||
| For the period April 24, 2009 to June 30, 2009 |
For the period April 1, 2009 to April 23, 2009 |
Three months ended June 30, 2008 |
For the period January 1, 2009 to April 23, 2009 |
Six months ended June 30, 2008 | |||||||||||||||
| Program commission expense |
$ | 248 | $ | 85 | $ | 453 | $ | 416 | $ | 1,180 | |||||||||
| $ | 248 | $ | 85 | $ | 453 | $ | 416 | $ | 1,180 | ||||||||||
Related Party Expense by Category:
| Successor Company | Predecessor Company | ||||||||||||||||||
| For the period April 24, 2009 to June 30, 2009 |
For the period April 1, 2009 to April 23, 2009 |
Three months ended June 30, 2008 |
For the period January 1, 2009 to April 23, 2009 |
Six months ended June 30, 2008 | |||||||||||||||
| Operating Costs |
$ | 12,191 | $ | 4,971 | $ | 18,445 | $ | 24,991 | $ | 36,320 | |||||||||
| Depreciation and Amortization |
— | — | — | — | 1,618 | ||||||||||||||
| Corporate, General and Administrative |
— | — | — | — | 610 | ||||||||||||||
| Special Charges |
296 | 804 | — | 2,517 | 5,000 | ||||||||||||||
| $ | 12,487 | $ | 5,775 | $ | 18,445 | $ | 27,508 | $ | 43,548 | ||||||||||
F-54
Table of Contents
Notes to consolidated financial statements
(in thousands, except per share amounts)
NOTE 4—PROPERTY AND EQUIPMENT:
Property and equipment is recorded at cost and is summarized as follows:
| Successor Company | Predecessor Company | |||||||||
| June 30, 2009 | December 31, 2008 | |||||||||
| Land, buildings and improvements |
$ | 18,397 | $ | 11,999 | ||||||
| Recording, broadcasting and studio equipment |
73,761 | 75,907 | ||||||||
| Furniture, equipment and other |
18,116 | 18,445 | ||||||||
| $ | 110,274 | $ | 106,351 | |||||||
| Less: Accumulated depreciation |
73,917 | 75,934 | ||||||||
| Property and equipment, net |
$ | 36,357 | $ | 30,417 | ||||||
Depreciation expense is recorded as follows:
| Successor Company | Predecessor Company | ||||||||||||||||||
| For the period April 24, 2009 to June 30, 2009 |
For the period April 1, 2009 to April 23, 2009 |
Three months ended June 30, 2008 |
For the period January 1, 2009 to April 23, 2009 |
Six months ended June 30, 2008 | |||||||||||||||
| Depreciation Expense |
$ | 1,322 | $ | 474 | $ | 2,225 | $ | 2,354 | $ | 4,388 | |||||||||
| $ | 1,322 | $ | 474 | $ | 2,225 | $ | 2,354 | $ | 4,388 | ||||||||||
In 2001, we entered into a capital lease for satellite transponders totaling $6,723. Accumulated amortization related to the capital lease was $5,294 for the period ended June 30, 2009 and $4,949 for the period ended December 31, 2008.
NOTE 5—GOODWILL
Goodwill represents the excess of cost over fair value of net assets of businesses acquired. In accordance with Statement of Financial Accounting Standards No. 142 “Goodwill and Other Intangible Assets” (“SFAS 142”), the value assigned to goodwill and indefinite lived intangible assets is not amortized to expense, but rather the estimated fair value of the reporting unit is compared to its carrying amount on at least an annual basis to determine if there is a potential impairment. If the fair value of the reporting unit is less than its carrying value, an impairment loss is recorded to the extent that the implied fair value of the reporting unit goodwill and intangible assets is less than their carrying value.
Prior to the fourth quarter 2008, we operated as a single reportable operating segment: the sale of commercial time. As part of our Metro re-engineering initiative implemented in the fourth quarter of 2008, we installed separate management for the Network and Metro Traffic businesses in order to provide discrete financial information and management oversight. Accordingly, we have determined that each business is an operating segment. A reporting unit is the operating segment or a business which is one level below the operating segment. Our reporting units are consistent with our operating segments and impairment is assessed at this level.
As a result of the Refinancing described in Note 1—Basis of Presentation, we have followed the acquisition method of accounting, as described by SFAS 141R. Accordingly, we have revalued our assets and liabilities using our best estimate of current fair value. The majority of goodwill is not expected to be tax deductible. The increase in the value of goodwill is primarily attributable to deferred taxes associated
F-55
Table of Contents
Notes to consolidated financial statements
(in thousands, except per share amounts)
with the fair value of our intangible assets (see Note 6—Intangibles) and deferred taxes arising from the cancellation of our prior indebtedness. The value assigned to goodwill is not amortized but rather the estimated fair value of the reporting unit is compared to its carrying amount on at least an annual basis to determine if there is a potential impairment. If the fair value of the reporting unit is less than its carrying value, an impairment loss is recorded to the extent that the implied fair value of the reporting unit’s goodwill and intangible assets is less than its carrying value. Our consolidated financial statements prior to the closing of the Refinancing reflect the historical accounting basis in our assets and liabilities and are labeled predecessor company, while the periods subsequent to the Refinancing are labeled successor company and reflect the push down basis of accounting for the fair values which were allocated to our segments based on the Business Enterprise Value of each. The fair values in our financial statements including goodwill as presented in the table below.
On an annual basis and upon the occurrence of certain events, we are required to perform impairment tests on our identified intangible assets with indefinite lives, including goodwill, which testing could impact the value of our business.
| Total | Metro | Network | |||||||
| Predecessor Company |
33,988 | 23,792 | 10,196 | ||||||
| Goodwill, April 23, 2009 |
$ | 33,988 | $ | 23,792 | $ | 10,196 | |||
| Successor Company |
86,414 | 61,354 | 25,060 | ||||||
| Goodwill, June 30, 2009 |
$ | 86,414 | $ | 61,354 | $ | 25,060 | |||
F-56
Table of Contents
Notes to consolidated financial statements
(in thousands, except per share amounts)
NOTE 6—INTANGIBLES
In accordance with SFAS 141R which is applicable to the Refinancing described in Note 1—Basis of Presentation, we have revalued our intangibles using our best estimate of current fair value. The value assigned to indefinite lived intangible assets, our trademark, is not amortized to expense but tested at least annually for impairment or upon a triggering event. Our identified definite lived intangible assets are: our relationship with radio and television affiliates, or other distribution partners from which we obtain commercial airtime we sell to advertisers; internally developed software for systems unique to our business; contracts which provide information and talent for our programming; real estate leases; and insertion order commitments from advertisers. The values assigned to definite lived assets are amortized over their estimated useful life using, where applicable, contract completion dates, lease expiration dates, historical data on affiliate relationships and software usage. On an annual basis and upon the occurrence of certain events, we are required to perform impairment tests on our identified intangible assets with indefinite lives, including goodwill, which testing could impact the value of our business.
| Estimated
|
Successor Company | Predecessor Company | |||||||||||||||||||
| For the period April 24, 2009 to June 30, 2009 |
For the period April 1, 2009 to April 23, 2009 |
Three months June 30, 2008 |
For the period January 1, 2009 to April 23, 2009 |
Six months ended June 30, 2008 | |||||||||||||||||
| Trademarks |
Indefinite | $ | 20,900 | $ | — | $ | — | $ | — | $ | — | ||||||||||
| Affiliate Relationships |
10 years | 72,100 | 2,477 | 3,211 | 2,661 | 3,395 | |||||||||||||||
| Internally Developed Software |
5 years | 5,600 | |||||||||||||||||||
| Client Contracts |
5 years | 8,930 | |||||||||||||||||||
| Leases |
7 years | 980 | |||||||||||||||||||
| Insertion Orders |
9 months | 8,400 | |||||||||||||||||||
| Opening Balance |
116,910 | 2,477 | 3,211 | 2,661 | 3,395 | ||||||||||||||||
| Amortization Expense |
4,878 | 47 | 184 | 231 | 368 | ||||||||||||||||
| Ending Balance |
$ | 112,032 | $ | 2,430 | $ | 3,027 | $ | 2,430 | $ | 3,027 | |||||||||||
NOTE 7—ACQUISITIONS AND INVESTMENTS:
TrafficLand
On December 22, 2008, Metro Networks Communications, Inc. entered into a License and Services Agreement with TrafficLand (the “License Agreement”) which provides us with a three-year license to market and distribute TrafficLand services and products. Concurrent with the execution of the License Agreement, Westwood One, Inc. (Metro’s parent), TLAC, Inc. (a wholly-owned subsidiary of Westwood formed for such purpose) and TrafficLand entered into an option agreement with TrafficLand granting us the right to acquire 100% of the stock of TrafficLand pursuant to the terms of a Merger Agreement which the parties have negotiated and placed in escrow. As a result of payments previously made under the License Agreement, we have the right to cause the Merger Agreement to be released from escrow at any time on or prior to December 1, 2009 (such date has been extended from the original date of
F-57
Table of Contents
Notes to consolidated financial statements
(in thousands, except per share amounts)
March 31, 2009). The Merger Agreement if released, would remain subject to closing conditions, including the consent of our lenders. Upon consummation of the closing of the merger, the License Agreement would terminate.
As TrafficLand qualifies as a variable interest entity, we have considered qualitative and quantitative factors to determine if we are the primary beneficiary pursuant to FIN 46(R) of this variable interest entity. In connection with the TrafficLand arrangement, as of June 30, 2009, we did not hold an equity interest or a debt interest in the variable interest entity, and we did not absorb a majority of the expected losses or residual returns. Therefore, we do not qualify as the primary beneficiary and, accordingly, we have not consolidated TrafficLand.
NOTE 8—DEBT:
On April 23, 2009, we completed the Refinancing of our outstanding long-term indebtedness and the recapitalization of our equity with our existing lenders and Gores (see Note 1 — Basis of Presentation) and entered into a Securities Purchase Agreement with: (1) holders of our Old Notes, the two series of which were issued under the Note Purchase Agreement, dated as of December 3, 2002 and (2) certain participating lenders under the Old Credit Agreement, dated as of March 3, 2004.”). Gores purchased at a discount approximately $22,600 in principal amount of our then existing debt held by debt holders who did not wish to participate in the New Senior Notes which upon completion of the Refinancing was exchanged for $10,797 of the New Secured Notes which is classified on our balance sheet as Due to Gores. Pursuant to the Securities Purchase Agreement, in consideration for releasing all of their respective claims under the Senior Notes and the Old Credit Agreement, the debt holders collectively received in exchange for their then outstanding debt: (1) $117,500 of New Senior Notes; (2) 34,962 shares of Series B Preferred Stock and (3) a one-time cash payment of $25,000. We also entered into a senior credit facility pursuant to which we have a $15,000 revolving line of credit (which includes a $1,500 letter of credit sub-facility) on a senior unsecured basis and a $20,000 unsecured non-amortizing term loan (collectively, the “Senior Credit Facility”), the obligations in respect of which are subordinated to obligations in respect of the New Senior Notes. As of June 30, 2009, we had borrowed the entire amount under the term loan but had not borrowed under the revolving line of credit.
As of December 31, 2008, prior to the refinancing of our debt on April 23, 2009, our debt consisted of an unsecured, five-year $120,000 term loan and a five-year $75,000 revolving credit facility. Interest on the facility was variable and payable at a maximum of the prime rate plus an applicable margin of up to 0.75% or LIBOR plus an applicable margin of up to 1.75%, at our option. The facility contained covenants relating to dividends, liens, indebtedness, capital expenditures and restricted payments, as defined, interest coverage and leverage ratios. As a result of an amendment to our facility in the first quarter of 2008, we provided security to our lenders (including holders of our Old Notes) on substantially all of our assets and amended our allowable total debt covenant to 4.0 times Annualized Consolidated Operating Cash Flow through the remaining term of the facility.
Prior to April 23, 2009, we also had $200,000 in Old Notes which we issued on December 3, 2002, which consisted of: 5.26% Senior Notes due November 30, 2012 (in an aggregate principal amount of $150,000) and 4.64% Senior Notes due November 30, 2009 (in an aggregate principal amount of $50,000). Interest on the Old Notes was payable semi-annually in May and November. The Old Notes contained covenants relating to leverage and interest coverage ratios that were identical to those contained in our facility.
F-58
Table of Contents
Notes to consolidated financial statements
(in thousands, except per share amounts)
At December 31, 2008, we had approximately $9,000 outstanding under our revolving credit facility and $32,000 outstanding under the term loan. In the fourth quarter of 2008, we did not make a semi-annual interest payment on our Old Notes and the amount of the unpaid interest is included in the debt balance at December 31, 2008.
The following table summarizes our debt:
| Successor Company | Predecessor Company | ||||||||||
| June 30, 2009 | December 31, 2008 | ||||||||||
| Revolving Credit Facility/Term Loan |
$ | 20,000 | (1) | $ | 41,000 | ||||||
| 4.64% Senior Notes due on November 30, 2009 |
— | 51,475 | |||||||||
| 15.0% Senior Secured Notes due on July 15, 2012 |
108,078 | (2) | — | ||||||||
| Due to Gores due on July 15, 2012 |
10,891 | (2) | — | ||||||||
| 5.26% Senior Notes due on November 30, 2012 |
— | 154,503 | |||||||||
| Deferred Derivative Gain |
— | 2,075 | |||||||||
| $ | 138,969 | $ | 249,053 | ||||||||
| (1) | Interest rate of 7.0% on Term Loan. |
| (2) | Includes 5.0% PIK interest which accrues on a quarterly basis |
Our Senior Credit Facility and New Senior Notes require us to comply with certain financial and operational covenants. These covenants include, without limitation: restrictions on our ability to incur debt, incur liens, make investments, make capital expenditures, consummate acquisitions, pay dividends, sell assets and enter into mergers and similar transactions, and a maximum senior leverage ratio expressed as the principal amount of the New Senior Notes divided by our consolidated Adjusted EBITDA (defined as operating income (loss) from our Statement of Operations adjusted to exclude: depreciation and amortization, stock-based stock compensation, special charges and goodwill impairment and certain other income and expense amounts). This financial covenant is measured every quarter beginning on December 31, 2009 on a trailing, four-quarter basis. The covenant is 6.25 to 1.0 on December 31, 2009 and declines on a quarterly basis thereafter, including to a 4.5 to 1.0 ratio on December 31, 2010 and a 3.5 to 1.0 ratio on December 31, 2011. Failure to comply with these covenants would result in a default under our Senior Credit Facility and New Senior Notes.
Gores, our ultimate parent company as a result of the Refinancing, currently holds $10,891 (including PIK interest) of our New Senior Notes because it purchased debt from certain of our former debt holders who did not wish to participate in the issuance of the New Senior Notes in connection with our Refinancing. The debt is classified as Due to Gores on our balance sheet.
We determined that in the 23-day period ended April 23, 2009, we incorrectly recorded a credit to interest expense, which should have been recorded in the first quarter, for the settlement of an amount owed to a former employee. We determined that this error was not significant to any prior period results and accordingly reduced the 23-day period’s interest expense by $754. We do not believe this adjustment is material to our Consolidated Financial Statements for the 23-day period ended April 23, 2009 or to any prior period’s Consolidated Financial Statements. As a result, we have not restated any prior period amounts.
F-59
Table of Contents
Notes to consolidated financial statements
(in thousands, except per share amounts)
Our weighted average interest rate is as follows:
| Successor Company | Predecessor Company | ||||||||||||||||||
| For the period April 24, 2009 to June 30, 2009 |
For the period April 1, 2009 to April 23, 2009 |
Three months ended June 30, 2008 |
For the period January 1, 2009 to April 23, 2009 |
Six months ended June 30, 2008 |
|||||||||||||||
| Weighted Average Interest Rate |
13.0 | % | 4.2 | % | 3.8 | % | 6.6 | % | 5.2 | % | |||||||||
NOTE 9—FAIR VALUE MEASUREMENTS:
Fair value of financial instruments
Our financial instruments include cash, cash equivalents, receivables, accounts payable, borrowings and interest rate contracts. At June 30, 2009 and December 31, 2008, the fair values of cash and cash equivalents, receivables and accounts payable approximated carrying values because of the short-term nature of these instruments. In 2009 the estimated fair value of the borrowings was based on the appraised value at the Refinancing. In 2008, the estimated fair values of the borrowings were valued based on the then current agreement in principle related to the Refinancing:
| June 30, 2009 | December 31, 2008 | |||||||||||
| Carrying amount |
Fair value | Carrying amount |
Fair value | |||||||||
| Borrowings (Short and Long Term) |
$ | 138,969 | $ | 137,500 | $ | 249,053 | $ | 158,100 | ||||
| Series A Preferred Stock |
— | — | 75,000 | 50,000 | ||||||||
| Series A-1 Preferred Stock |
38,880 | 43,071 | — | — | ||||||||
| Series B Preferred Stock |
30,476 | 33,817 | — | — | ||||||||
Statement of Financial Accounting Standard No. 157, “Fair Value Measurements” (“SFAS 157”) establishes a common definition of fair value to be applied to US generally accepted accounting principles (“GAAP”) which requires the use of fair value, establishes a framework for measuring fair value and expands disclosure about such fair value measurements. SFAS 157 is effective for fiscal years beginning after November 15, 2007.
There was no change recorded in our opening balance of Retained Earnings as of January 1, 2009 as we did not have any financial instruments requiring retroactive application per the provisions of SFAS 157.
We endeavor to utilize the best available information in measuring fair value. Financial assets and liabilities are classified in their entirety based on the lowest level of input that is significant to the fair value measurement.
F-60
Table of Contents
Notes to consolidated financial statements
(in thousands, except per share amounts)
Fair value hierarchy
SFAS 157 specifies a hierarchy of valuation techniques based upon whether the inputs to those valuation techniques reflect assumptions other market participants would use based upon market data obtained from independent sources (observable inputs) or reflect our own assumptions of market participant valuation (unobservable inputs). In accordance with SFAS 157, these two types of inputs have created the following fair value hierarchy:
| Ø | Level 1 — Quoted prices in active markets that are unadjusted and accessible at the measurement date for identical, unrestricted assets or liabilities; |
| Ø | Level 2 — Quoted prices for identical assets and liabilities in markets that are not active, quoted prices for similar assets and liabilities in active markets or financial instruments for which significant inputs are observable, either directly or indirectly; |
| Ø | Level 3 — Prices or valuations that require inputs that are both significant to the fair value measurement and unobservable. |
SFAS 157 requires the use of observable market data if such data is available without undue cost and effort.
Items measured at fair value on a recurring basis
The following table sets forth our financial assets and liabilities that were accounted for, at fair value on a recurring basis as of June 30, 2009:
| Level 1 | Level 2 | Level 3 | |||||||
| Assets: |
|||||||||
| Investments |
$ | 634 | $ | — | $ | — | |||
| Total Assets |
$ | 634 | $ | — | $ | — | |||
NOTE 10—SHAREHOLDERS’ EQUITY AND PREFERRED STOCK:
On each of March 3, 2008 and March 24, 2008, respectively, we closed the sale and issuance of 7,143 shares (14,286 shares in the aggregate) of our common stock to Gores at a price of $1.75 per share for an aggregate purchase amount of $25,000 less issuance costs of $2,250.
On June 19, 2008, we completed a $75,000 private placement to Gores of our Series A Preferred Stock with an initial conversion price of $3.00 per share and four-year warrants to purchase an aggregate of 10,000 shares of our common stock in three, approximately equal tranches with exercise prices of $5.00, $6.00 and $7.00 per share.
On April 23, 2009, we entered into a Purchase Agreement with Gores pursuant to which Gores purchased 25,000 shares of Series B Preferred Stock for an aggregate purchase price of $25,000. In exchange for the then outstanding shares of Series A Preferred Stock held by Gores, we issued 75,000 shares of Series A-1 Preferred Stock. On April 23, 2009, we also closed the refinancing of our outstanding debt whereby participating debt holders exchanged their outstanding debt for: (1) $117,500 of New Senior Notes, (2) 34,962 shares of Series B Preferred Stock and (3) a one-time cash payment of $25,000.
F-61
Table of Contents
Notes to consolidated financial statements
(in thousands, except per share amounts)
On July 9, 2009, Gores converted three thousand five hundred shares of Series A-1 Preferred Stock into 103,513 shares of common stock (without taking into account the reverse stock split). Also on July 9, 2009, pursuant to the terms of our Certificate of Incorporation, the 292 outstanding shares of our Class B stock were automatically converted into 292 shares of common stock (without taking into account the reverse stock split) because as a result of such conversion by Gores, the voting power of the Class B stock, as a group, fell below ten percent of the aggregate voting power of issued and outstanding shares of common stock and Class B stock.
On August 3, 2009 at a special meeting of stockholders (see Note 18 — Subsequent Events), certain amendments to our Certification of Incorporation (also referred to herein as our Charter) were approved by our stockholders. Such amendments consisted of an increase in the number of authorized shares of our common stock from 300,000 to 5,000,000 and a two hundred to one (200:1) reverse stock split which was approved and effective on August 3, 2009. Accordingly, the reverse stock split has been reflected retrospectively in EPS for all periods herein. As contemplated by the terms of our Refinancing, the outstanding shares of Series A-1 Preferred Stock and Series B Preferred Stock were converted into shares of our common stock pursuant to the terms of the Certifications of Designation for the Series A-1 Preferred Stock and Series B Preferred Stock.
In accordance with Emerging Issues Task Force (EITF) D-98, the Series A Preferred Stock is required to be classified as mezzanine equity because a change of control of the Company could occur without our approval. Accordingly, the redemption of the Series A Preferred Stock is not solely under our control. We have determined that such redemption is probable and have, accordingly, accreted up to the redemption value of the Series A Preferred Stock.
In accordance with EITF D-98, the Series A-1 Preferred Stock and Series B Preferred Stock is also required to be classified as mezzanine equity because the redemption of these instruments is outside our control. We have recorded the Preferred Stock at fair value as of the date of issuance and have subsequently accreted changes in the redemption value from the date of issuance to the earliest redemption date using the interest method.
In connection with the Refinancing and the issuance of the Preferred Stock, we have determined that such Preferred Stock contain a beneficial conversion feature (“BCF”), that is partially contingent. The BCF is measured as the spread between the effective conversion price and the market price of common stock on the commitment date and then multiplying this spread by the number of conversion shares, as adjusted for the contingent shares. A portion of the BCF has been recognized at issuance (issuance BCF) while the majority of the BCF is contingent (contingent BCF) upon the authorization of additional common shares which did not occur until August 3, 2009.
The total BCF, which is limited to the carrying value of the preferred stock, is approximately $76,900, of which $10,900 relates to the issuance BCF and will be amortized using the effective yield method over the period until conversion (4 years) resulting in a reduction to income allocable to common shareholders of $400 for the period ending June 30, 2009 The contingent BCF which amounts to $66,000 (and was limited to the carrying amount of the Preferred Stock), will be recognized when the contingency is resolved in the third quarter (August 3, 2009) which due to the immediate conversion, will result in, among other effects, a deemed dividend that will be included in earnings per share calculation.
On March 16, 2009, we were delisted from the NYSE and since that date have traded over-the-counter on the OTC Bulletin Board. On August 5, 2009, our ticker symbol changed to WWOZ.OB in connection with our reverse stock split.
F-62
Table of Contents
Notes to consolidated financial statements
(in thousands, except per share amounts)
NOTE 11—EQUITY-BASED COMPENSATION:
Equity compensation activity
We awarded 75 shares of common stock to certain employees in the period January 1, 2009 to April 23, 2009. The awards have restriction periods tied solely to employment and vest over three years. The cost of common stock awards, which is determined to be the fair market value of the shares on the date of grant net of estimated forfeitures, is expensed ratably over the related vesting period.
Our common stock activity is as follows:
| Shares | Weighted average price | |||||
| Predecessor Company |
||||||
| Unvested at December 31, 2008 |
7,000 | $ | 7.58 | |||
| Granted January 1 to April 23, 2009 |
75 | 0.06 | ||||
| Forfeited January 1 to April 23, 2009 |
(667 | ) | 9.3 | |||
| Unvested at April 23, 2009 |
6,408 | $ | 7.32 | |||
| Successor Company |
||||||
| Unvested at April 24, 2009 |
6,408 | $ | 7.32 | |||
| Granted April 24 to June 30, 2009 |
— | — | ||||
| Forfeited April 24 to June 30, 2009 |
(232 | ) | 3.39 | |||
| Unvested at June 30, 2009 |
6,176 | $ | 7.47 | |||
Stock based compensation expense is recorded as follows:
| Successor Company |
Predecessor Company | |||||||||||||||||||
| For the period April 24, 2009 to June 30, 2009 |
For the period April 1, 2009 to April 23, 2009 |
Three months ended June 30, 2008 |
For the period to April 23, 2009 |
Six months ended June 30, 2008 | ||||||||||||||||
| Operating Costs |
$ | 732 | $ | 218 | $ | 1,217 | $ | 1,136 | $ | 2,371 | ||||||||||
| General and Administrative Expense |
120 | 540 | (885 | ) | 974 | 84 | ||||||||||||||
| Total Stock Compensation Expense |
$ | 852 | $ | 758 | $ | 332 | $ | 2,110 | $ | 2,455 | ||||||||||
F-63
Table of Contents
Notes to consolidated financial statements
(in thousands, except per share amounts)
Common equivalent shares outstanding are as follows:
| Successor Company | Predecessor Company | |||||||
| June 30, 2009 | December 31, 2008 | |||||||
| Options |
6,176 | 7,000 | ||||||
| Restricted Stock |
179 | 364 | ||||||
| Restricted Stock Units |
440 | 1,216 | ||||||
| Warrants |
10,000 | 10,000 | ||||||
| 16,795 | 18,580 | |||||||
The per share exercise price of the options excluded were $0.05 — $38.34 for the six months ended June 30, 2009 and the twelve months ended December 31, 2008, respectively.
On April 23, 2009, pursuant to a board of directors resolution, equity compensation awarded to directors who resigned in connection with the terms of the Refinancing accelerated and vested in full. In connection with this acceleration, we recorded stock based compensation expense of $514.
On June 19, 2008, warrants to purchase up to 10,000 shares were issued to Gores. The per share prices of the Gores warrants excluded were $5.00 — $7.00. Effective August 3, 2009, when the Charter Amendments were approved, these warrants were cancelled.
NOTE 12—OTHER INCOME/(LOSS):
| Successor Company |
Predecessor Company | ||||||||||||||||||
| For the period April 24, 2009 to June 30, 2009 |
For the period April 1, 2009 to April 23, 2009 |
Three months ended June 30, 2008 |
For the period January 1, 2009 to April 23, 2009 |
Six months ended June 30, 2008 | |||||||||||||||
| Other Income |
$ | 4 | $ | 59 | $ | 43 | $ | 359 | $ | 85 | |||||||||
NOTE 13—COMPREHENSIVE INCOME (LOSS):
Comprehensive income (loss) reflects the change in equity of a business enterprise during a period from transactions and other events and circumstances from non-owner sources. Our comprehensive net income (loss) represents net income or loss adjusted for unrealized gains or losses on available for sale securities. Comprehensive income (loss) is as follows:
| Successor Company |
Predecessor Company | |||||||||||||||||||||||
| For the period April 24, 2009 to June 30, 2009 |
For the period April 1, 2009 to April 23, 2009 |
Three months ended June 30, 2008 |
For the period January 1, 2009 to April 23, 2009 |
Six months ended June 30, 2008 |
||||||||||||||||||||
| Net (loss) Income |
$ | (6,184 | ) | $ | (3,775 | ) | $ | (199,744 | ) | $ | (18,961 | ) | $ | (205,082 | ) | |||||||||
| Unrealized gain (loss) on marketable securities, net of income taxes |
(95 | ) | 85 | 48 | 219 | 2,596 | ||||||||||||||||||
| Comprehensive (loss) Income |
$ | (6,279 | ) | $ | (3,690 | ) | $ | (199,696 | ) | $ | (18,742 | ) | $ | (202,486 | ) | |||||||||
F-64
Table of Contents
Notes to consolidated financial statements
(in thousands, except per share amounts)
NOTE 14—INCOME TAXES:
We use the asset and liability method of financial accounting and reporting for income taxes required by Statement of Financial Accounting Standards No. 109 “Accounting for Income Taxes” (“SFAS 109”). Under SFAS 109, deferred income taxes reflect the tax impact of temporary differences between the amount of assets and liabilities recognized for financial reporting purposes and the amounts recognized for tax purposes.
We classified interest expense and penalties related to unrecognized tax benefits as income tax expense in accordance with Financial Accounting Standards Board Interpretation No. 48, “Accounting for Uncertainty in Income Taxes- an interpretation of FASB Statement No. 109” (“FIN 48”). FIN 48 clarifies the accounting for uncertainty in income taxes recognized in an enterprise’s financial statements in accordance with SFAS 109 and prescribes a recognition threshold and measurement attribute for the financial statement recognition and measurement of a tax position taken or expected to be taken in a tax return. The evaluation of a tax position in accordance with this interpretation is a two-step process. The first step is recognition, in which the enterprise determines whether it is more likely than not that a tax position will be sustained upon examination, including resolution of any related appeals or litigation processes, based on the technical merits of the position. The second step is measurement. A tax position that meets the more likely than not recognition threshold is measured to determine the amount of benefit to recognize in the financial statements.
We determined, based upon the weight of available evidence, that it is more likely than not that our deferred tax asset will be realized. We have experienced a long history of taxable income which would enable us to carryback any potential future net operating losses and taxable temporary differences that can be used as a source of income. As such, no valuation allowance was recorded for the six months ended June 30, 2009 or 2008. We will continue to assess the need for a valuation allowance at each future reporting period.
As part of our compliance with acquisition accounting, being followed as of April 24, 2009, we have recorded a deferred tax liability which represents the fair value adjustment for book purposes of intangibles as well as plant, property and equipment.
In accordance with the provisions of the Internal Revenue Code, we are planning to make an election to defer the inclusion of cancellation of indebtedness income, which arose as part or our Refinancing, ratably over a five-year period beginning in 2014. We are still evaluating the facts and circumstances surrounding this election and may choose instead to exclude such income under the insolvency exception provision of the Internal Revenue Code; however, the election to defer income is the most likely approach we will take based on our understanding of facts and circumstances at this time. A deferred tax liability has been recorded as a part of acquisition accounting to reflect the future taxable income to be recognized relating to the cancellation of indebtedness income.
NOTE 15—RESTRUCTURING CHARGES:
In the third quarter of 2008, we announced a plan to restructure the traffic operations of the Metro Traffic business (commonly referred to by us as the Metro re-engineering) and to implement other cost reductions. The re-engineering entailed reducing the number of our Metro Traffic operational hubs from 60 to 13 regional centers and produced meaningful reductions in labor expense, aviation expense, station compensation, program commissions and rent.
F-65
Table of Contents
Notes to consolidated financial statements
(in thousands, except per share amounts)
The Metro re-engineering initiative began in the second half of 2008 and has continued in 2009. In the first half of 2009 we also undertook additional reductions in our workforce and terminated certain contracts. In connection with the Metro re-engineering and the other cost reduction initiatives, we recorded $14,100 and $5,429 of restructuring charges in the second half of 2008 and in the six months ended June 30, 2009, respectively. The total accumulated charges are $19,529, and the balance at June 30, 2009 is $8,481.
The restructuring activity follows:
| Severance termination costs |
Facilities consolidation related costs |
Contract termination costs |
Total | |||||||||||||
| Acitivty Thru December 31, 2008 |
||||||||||||||||
| Charges |
$ | 6,765 | $ | 831 | $ | 6,504 | $ | 14,100 | ||||||||
| Payments |
(3,487 | ) | (41 | ) | (1,108 | ) | (4,636 | ) | ||||||||
| Non-Cash utilization |
(80 | ) | (1,600 | ) | (1,680 | ) | ||||||||||
| Balance at December 31, 2008 |
3,198 | 790 | 3,796 | 7,784 | ||||||||||||
| Charges from January 1 to March 31, 2009 |
1,658 | 1,781 | — | 3,439 | ||||||||||||
| Charges from April 1 to April 23, 2009 |
— | 536 | — | 536 | ||||||||||||
| Charges from April 24 to June 30, 2009 |
372 | 1,082 | — | 1,454 | ||||||||||||
| Payments |
(2,971 | ) | (361 | ) | (1,400 | ) | (4,732 | ) | ||||||||
| Non-Cash utilization |
— | — | — | — | ||||||||||||
| Balance at June 30, 2009 |
$ | 2,257 | $ | 3,828 | $ | 2,396 | $ | 8,481 | ||||||||
| Accumulated Charges |
8,795 | 4,230 | 6,504 | 19,529 | ||||||||||||
| Accumulated Payments |
(6,458 | ) | (402 | ) | (2,508 | ) | (9,368 | ) | ||||||||
| Accumulated Non-Cash utilization |
(80 | ) | — | (1,600 | ) | (1,680 | ) | |||||||||
| Balance at June 30, 2009 |
$ | 2,257 | $ | 3,828 | $ | 2,396 | $ | 8,481 | ||||||||
Restructuring charges have been recorded in accordance with SFAS No. 146, “Accounting for the Costs Associated with Exit or Disposal Activities” (“SFAS 146”) and SFAS No. 88, “Employer’s Accounting for Settlements and Curtailments of Defined Benefit Pension Plans and for Termination Benefit” (“SFAS 88”). We account for one-time termination benefits, contract terminations, asset write-offs and/or costs to terminate lease obligations less assumed sublease income in accordance with SFAS 146, which addresses financial accounting and reporting for costs associated with restructuring activities. Under SFAS 146, we establish a liability for a cost associated with an exit or disposal activity, including severance and lease termination obligations and other related costs, when the liability is incurred, rather than at the date that we commit to an exit plan.
We made certain estimates in determining the restructuring charges indicated above. These estimates may vary from actual costs depending, in part, upon factors that may be beyond our control. We will continue to review the status of our restructuring obligations and, if appropriate, record changes to these obligations based on management’s most current estimates.
F-66
Table of Contents
Notes to consolidated financial statements
(in thousands, except per share amounts)
NOTE 16—SPECIAL CHARGES:
The special charges line item on the Consolidated Statement of Operations is comprised of the following:
| Successor Company |
Predecessor Company | ||||||||||||||||||
| For the period April 24, 2009 to June 30, 2009 |
For the period April 1, 2009 to April 23, 2009 |
Three months ended June 30, 2008 |
For the period January 1, 2009 to April 23, 2009 |
Six months ended June 30, 2008 | |||||||||||||||
| Professional fees related to the new CBS arrangement |
$ | — | $ | — | $ | 206 | $ | — | $ | 3,162 | |||||||||
| Closing payment to CBS related to cancelling the previous CBS agreement |
— | — | — | 5,000 | |||||||||||||||
| Regionalization costs |
72 | 25 | — | 120 | — | ||||||||||||||
| Fees related to the Refinancing |
296 | 6,985 | 691 | 12,699 | 691 | ||||||||||||||
| $ | 368 | $ | 7,010 | $ | 897 | $ | 12,819 | $ | 8,853 | ||||||||||
Fees related to the Refinancing include transaction fees and expenses related to negotiation of the definitive documentation, including the fees of various legal and financial advisors for the constituents involved in the Refinancing (eg Westwood One, Gores, Glendon Partners, the banks, noteholders and the lenders of the new Senior Credit Facility) and other professional fees. Regionalization costs are expenses related to reducing the number of our Metro Traffic operational hubs from 60 to 13 regional centers.
NOTE 17—SEGMENT INFORMATION:
We established a new organizational structure in the fourth quarter of 2008, pursuant to which we manage and report our business in two operating segments: Network and Metro Traffic. We evaluated segment performance based on segment revenue and segment operating (loss)/income. Administrative functions such as finance, human resources and information systems are centralized. However, where applicable, portions of the administrative function costs are allocated between the operating segments. The operating segments do not share programming or report distribution. In the event any materials and/or services are provided to one operating segment by the other, the transaction is valued at fair market value. Operating costs and total assets are captured discretely within each segment. Previously reported results of operations are presented to reflect these changes.
Revenue, segment operating (loss)/income, depreciation, unusual items, capital expenditures and identifiable assets are summarized below according to these segments for the periods indicated. This change did not impact the total consolidated results of operations. We continue to report certain administrative activities under corporate. We are domiciled in the United States with limited international operations comprising less than one percent of our revenue. No one customer represented more than 10% of our consolidated revenue.
Our Network business produces and distributes regularly scheduled and special syndicated programs, including exclusive live concerts, music and interview shows, national music countdowns, lifestyle short features, news broadcasts, talk programs, sporting events and sports features.
F-67
Table of Contents
Notes to consolidated financial statements
(in thousands, except per share amounts)
Our Metro Traffic business provides traffic reports and local news, weather and sports information programming to radio and television affiliates and their websites.
| Successor Company |
Predecessor Company | |||||||||||||||||||||||
| For the period April 24 to June 30, 2009 |
For the period April 1 to April 23, 2009 |
Three months ended June 30, 2008 |
For the period April 23, 2009 |
Six months ended June 30, 2008 |
||||||||||||||||||||
| Net Revenue |
||||||||||||||||||||||||
| Network |
$ | 27,351 | $ | 12,812 | $ | 47,169 | $ | 63,996 | $ | 106,353 | ||||||||||||||
| Metro/Traffic |
30,693 | 12,796 | 53,203 | 47,479 | 100,645 | |||||||||||||||||||
| Total Net Revenue |
$ | 58,044 | $ | 25,607 | $ | 100,372 | $ | 111,474 | $ | 206,998 | ||||||||||||||
| Segment Operating (Loss) Income |
||||||||||||||||||||||||
| Network |
$ | 358 | $ | 647 | $ | 4,048 | $ | (3,818 | ) | $ | 12,121 | |||||||||||||
| Metro/Traffic |
(2,622 | ) | 3,419 | 10,088 | (2,093 | ) | 13,423 | |||||||||||||||||
| Total Segment Operating (Loss) Income |
$ | (2,264 | ) | $ | 4,066 | $ | 14,136 | $ | (5,911 | ) | $ | 25,544 | ||||||||||||
| Corporate Expenses |
(60 | ) | (649 | ) | (2,795 | ) | (1,027 | ) | (9,248 | ) | ||||||||||||||
| Restructuring and Special Charges |
(1,822 | ) | (7,546 | ) | (897 | ) | (16,795 | ) | (8,853 | ) | ||||||||||||||
| Goodwill Impairment |
— | — | (206,053 | ) | — | (206,053 | ) | |||||||||||||||||
| Operating (Loss) Income |
$ | (4,146 | ) | $ | (4,129 | ) | $ | (195,609 | ) | $ | (23,733 | ) | $ | (198,610 | ) | |||||||||
| Interest Expense (Income) |
(4,692 | ) | 41 | (4,352 | ) | (3,222 | ) | (9,751 | ) | |||||||||||||||
| Other Income |
4 | 59 | 43 | 359 | 85 | |||||||||||||||||||
| (Loss) Income Before Income Taxes |
$ | (8,834 | ) | $ | (4,029 | ) | $ | (199,918 | ) | $ | (26,596 | ) | $ | (208,276 | ) | |||||||||
| Depreciation and Amortization |
||||||||||||||||||||||||
| Network |
$ | 1,483 | $ | 225 | $ | 834 | $ | 1,096 | $ | 1,590 | ||||||||||||||
| Metro/Traffic |
4,357 | 295 | 1,580 | 1,480 | 3,176 | |||||||||||||||||||
| Corporate |
5 | 1 | 7 | 9 | 1,631 | |||||||||||||||||||
| Total Depreciation and Amortization |
$ | 5,845 | $ | 521 | $ | 2,421 | $ | 2,585 | $ | 6,397 | ||||||||||||||
| Capital Expenditures |
||||||||||||||||||||||||
| Network |
$ | 993 | $ | 12 | $ | 2,109 | $ | 506 | $ | 5,474 | ||||||||||||||
| Metro/Traffic |
553 | 204 | 203 | 879 | 502 | |||||||||||||||||||
| Corporate |
— | — | 133 | — | 132 | |||||||||||||||||||
| Total Capital Expenditures |
$ | 1,546 | $ | 216 | $ | 2,445 | $ | 1,385 | $ | 6,109 | ||||||||||||||
| Successor Company | Predecessor Company | |||||||||
| June 30, 2009 | December 31, 2008 | |||||||||
| Assets |
||||||||||
| Network |
$ | 121,998 | $ | 92,109 | ||||||
| Metro/Traffic |
202,879 | 80,079 | ||||||||
| Corporate |
22,179 | 32,900 | ||||||||
| Total Assets(1) |
$ | 347,056 | $ | 205,088 | ||||||
F-68
Table of Contents
Notes to consolidated financial statements
(in thousands, except per share amounts)
NOTE 18—SUBSEQUENT EVENTS:
A special meeting of stockholders to consider certain amendments to our Certificate of Incorporation (the “Charter Amendments) was held on August 3, 2009 where such amendments were approved by our stockholders. The Charter Amendments: (1) increased the number of authorized shares of our common stock from 300,000 to 5,000,000 (2) effected a reverse stock split of our outstanding common stock at a ratio of two hundred to one (200:1), (3) defined the term “Continuing Directors” that was used but not defined in the Certificate of Incorporation, (4) amended the Certificate of Incorporation to delete Article Sixteenth of the Certificate of Incorporation that set forth higher approval thresholds than those required under the Delaware General Corporation Law with respect to certain amendments of the Certificate of Incorporation and (5) amended the Certificate of Incorporation to delete the provision in Article Seventeenth relating to Article Sixteenth.
The Charter Amendments were made in connection with the refinancing of our debt which closed on April 23, 2009. On such date, the Series A-1 Convertible Preferred Stock and Series B Convertible Preferred Stock (collectively, the “Preferred Stock”) was issued but not converted because we did not have sufficient authorized shares of common stock into which the Preferred Stock could be converted. The Certificates of Designation for the Series A-1 Preferred Stock and Series B Preferred Stock, state that when the authorized shares of common stock were increased by a sufficient amount to allow the conversion of all Preferred Stock, the Preferred Stock would convert automatically, without further action required by us or any shareholder, into shares of common stock.
As previously disclosed, on July 9, 2009, Gores converted three thousand five hundred shares of Series A-1 Convertible Preferred Stock into 103,513 shares of common stock. Such conversion triggered the conversion of 292 shares of Class B Common into 292 shares of common stock pursuant to the terms of our Charter.
The conversion of Preferred Stock that occurred on August 3, 2009 increased the number of shares of common stock issued and outstanding from 206,263 to 4,062,446 on a pre-split basis, which was reduced to 20,312 shares after the 200:1 reverse stock split. While such technically resulted in substantial dilution to our common stockholders, the ownership interest of each of our common stockholders did not change substantially after the conversion of the Preferred Stock into common stock as the Preferred Stock that was issued on April 23, 2009 when our Refinancing closed from the time of its issuance participated on an as-converted basis with respect to voting, dividends and other economic rights as the common stock. Effective August 3, 2009, when the Charter Amendments were approved, the warrants issued to Gores on June 19, 2008 were cancelled.
On October 14, 2009, we entered into separate agreements with the holders of our Senior Notes and Wells Fargo Foothill to amend the terms of our Securities Purchase Agreement (governing the Senior Notes) and Senior Credit Facility, respectively, to waive compliance with our debt leverage covenants which were to be measured on December 31, 2009 on a trailing four-quarter basis. As part of the Securities Purchase Agreement amendment, we have agreed to pay down our Senior Notes by using the gross proceeds of the offering and additional cash on hand, if necessary by: (i) $15,000 if the gross proceeds of the offering are less than $40,000 and (ii) $20,000 (or more at our sole discretion) if the gross proceeds of the offering are equal to or greater than $40,000. If neither an offering of capital stock nor the proposed sale-leaseback of our Culver City properties occurs on or prior to March 31, 2010, we have agreed to pay down $3,500 of our Senior Notes. Any such prepayments would be deemed optional prepayments under the Securities Purchase Agreement and made within 5 business days of the date the offering is consummated (in the case of clauses (i) or (ii) above) or April 7, 2010 in the event no offering or sale-leaseback was consummated.
F-69
Table of Contents
Notes to consolidated financial statements
(in thousands, except per share amounts)
Management believes that after giving effect to certain cost containment measures including furloughs and salary reductions for employees, we will generate sufficient Adjusted EBITDA in order to meet our debt leverage covenant over the next twelve months (namely, on March 31, 2010, June 30, 2010 and September 30, 2010 when the covenants are measured on a trailing four-quarter basis). However, we are operating in an uncertain economic environment with limited visibility on advertising orders for the duration of 2009 and the beginning of 2010. We have agreed to pay down our Senior Notes in an amount of either $15,000 or 20,000, depending on the amount of gross proceeds of a successful offering of our common stock, which will create additional EBITDA cushion under the covenants. If we are unable to achieve our forecasted results, or sufficiently mitigate those results with certain cost reduction measures, and cannot obtain a waiver or amendment of our debt covenant requirements at March 31, 2010 or beyond, it could have a material and adverse effect on our business continuity, results of operations, cash flows and financial condition.
As a result of our Restructuring, we recorded new values for certain intangible assets and goodwill as of April 24, 2009, which values were calculated using the income approach and were based on our then most current forecast. The assumptions underlying our forecasted values were derived from the Company’s then best estimates including the industry’s general forecast of the advertising market which assumed an improvement in the economy and in advertising market conditions in the later half of 2009. In 2009, the television upfronts (where advertisers purchase commercial airtime for the upcoming television season several months before the season begins), which in prior years concluded in the second quarter, were extended through August to complete the upfront advertising sales. During this period, advertisers were slow to commit to buying commercial airtime for the third quarter of 2009. We believed that the conclusion of the television upfronts would help bring more clarity to both purchasers and sellers of advertising however once such upfronts concluded in August, it became increasingly evident from our quarterly bookings, backlog and pipeline data that the downturn in the economy was continuing and affecting advertising budgets and orders. These conditions, namely the weak third quarter and the likely continuation of the current economic conditions into the fourth quarter and the immediate future, caused us to reduce our forecasted results for the remainder of 2009 and 2010. We believe these new forecasted results constituted a triggering event and therefore we conducted a goodwill impairment analysis. The new forecast will more likely than not reduce the fair value of one or more of our reporting units below its carrying value. Accordingly, we performed a Step 1 analysis in accordance with FASB ASC 350 by comparing our recalculated fair value based on our new forecast to our current carrying value. Our initial results indicate an impairment in our Metro Traffic segment. We are currently performing a more detailed Step 2 analysis to compare the implied fair value of goodwill for Metro Traffic with the carrying value of its goodwill. We currently estimate the goodwill impairment to be approximately $54,000. No assurance can be provided as to the ultimate charge which will be recorded in the third quarter of 2009.
For the interim financial period ended June 30, 2009, subsequent events were evaluated through August 14, 2009, the date the financial statements were issued. In addition, the Company has performed an evaluation of subsequent events through the date of this filing, which is the date the financial statements were reissued in this prospectus.
NOTE 19—RECENT ACCOUNTING PRONOUNCEMENTS:
In June 2009, the FASB issued SFAS No. 168, “The FASB Accounting Standards Codification and the Hierarchy of Generally Accepted Accounting Principles — a replacement of FASB Statement No. 162” (SFAS 168). SFAS 168 replaces SFAS No. 162, “The Hierarchy of Generally Accepted Accounting
F-70
Table of Contents
Notes to consolidated financial statements
(in thousands, except per share amounts)
Principles” and establishes the “FASB Accounting Standard Codification” (Codification) as the source of authoritative accounting principles recognized by the FASB to be applied by nongovernmental entities in the preparation of financial statements in conformity with generally accepted accounting principles in the United States. All guidance contained in the Codification carries an equal level of authority. On the effective date of SFAS 168, the Codification will supersede all then-existing non-SEC accounting and reporting standards. All other non-grandfathered non-SEC accounting literature not included in the Codification will become non-authoritative. SFAS 168 is effective for financial statements issued for interim and annual periods ending after September 15, 2009. We have evaluated this new statement, and have determined that it will not have a significant impact on the determination or reporting of our financial results.
In May 2009, the FASB issued SFAS No. 165, “Subsequent Events” (“SFAS 165”), which establishes general standards of accounting for and disclosure of events that occur after the balance sheet date but before financial statements are issued or are available to be issued. In particular, SFAS 165 sets forth: (1) the period after the balance sheet date during which management of a reporting entity should evaluate events or transactions that may occur for potential recognition or disclosure in the financial statements, (2) the circumstances under which an entity should recognize events or transactions occurring after the balance sheet date in its financial statements, and (3) the disclosures that an entity should make about events or transactions that occurred after the balance sheet date. In accordance with SFAS 165, an entity should apply the requirements to interim and annual financial periods ending after June 15, 2009. The implementation of this standard, effective for our interim financial statements ending June 30, 2009, did not have a material impact on our consolidated financial position and results of operations.
In April 2009, the FASB issued FSP FAS 107-1 and APB 28-1, “Interim Disclosures about Fair Value of Financial Instruments” (“FSP FAS 107-1 and APB 28-1”). This FSP amends FASB Statement No. 107, Disclosures about Fair Value of Financial Instruments, to require disclosures about fair value of financial instruments for interim reporting periods of publicly traded companies as well as in annual financial statements. This FSP also amends APB Opinion No. 28, Interim Financial Reporting, to require those disclosures in summarized financial information at interim reporting periods. This FSP is effective for interim reporting periods ending after June 15, 2009, with early adoption permitted for periods ending after March 15, 2009. We have adopted the disclosure requirements of FSP FAS 107-1 and APB 28-1 effective with our second quarter ended June 30, 2009. The adoption of FSP FAS 107-1 and APB 28-1 did not have an impact on the determination or reporting of our financial results.
In March 2009, the Financial Account Standards Board (“FASB’) issued FSP FAS 141(R)-1, Accounting for Assets Acquired and Liabilities Assumed in a Business Combination (“FSP FAS 141(R)-1”), which amends the guidance in SFAS 141R, for the initial recognition and measurement, subsequent measurement, and disclosures of assets and liabilities arising from contingencies in a business combination. In addition, FSP FAS 141(R)-1 amends the existing guidance related to accounting for pre-existing contingent consideration assumed as part of the business combination. FSP FAS 141(R)-1 was adopted by us on January 1, 2009.
In December 2007, the FASB issued SFAS No. 141 (revised 2007), “Business Combinations” (“SFAS 141R”). SFAS 141R establishes principles and requirements for how an acquirer recognizes and measures in our financial statements the identifiable assets acquired, the liabilities assumed, any noncontrolling interest in the acquiree and the goodwill acquired. SFAS 141R also establishes disclosure requirements to enable the evaluation of the nature and financial effects of the business combination. SFAS 141R was effective as of the beginning of an entity’s fiscal year that begins after December 15, 2008. The adoption of SFAS 141R and FSP FAS 141(R)-1 impacted the accounting for our Refinancing (See Note 1 — Basis of Presentation).
F-71
Table of Contents
Notes to consolidated financial statements
(in thousands, except per share amounts)
In November 2008, the EITF issued Issue No. 08-6, Equity Method Investment Accounting Considerations (“EITF 08-6”), which is effective for the Company January 1, 2009. EITF 08-6 addresses the impact that SFAS 141R and SFAS 160 might have on the accounting for equity method investments, including how the initial carrying value of an equity method investment should be determined, how an impairment assessment of an underlying indefinite-lived intangible asset of an equity method investment should be performed and how to account for a change in an investment from the equity method to the cost method. The adoption of this guidance does not have a significant impact on our Consolidated Financial Statements.
In March 2008, the FASB issued SFAS No. 161, “Disclosures About Derivative Instruments and Hedging Activities — an amendment of FASB Statement No. 133” (SFAS No. 161). SFAS No. 161 expands quarterly disclosure requirements in SFAS No. 133 about an entity’s derivative instruments and hedging activities. SFAS No. 161 is effective for fiscal years beginning after November 15, 2008. The relevant disclosures have been included in our Consolidated Financial Statements.
In December 2007, the FASB issued SFAS No. 160, “Non-controlling Interests in Consolidated Financial Statements” (SFAS No. 160). SFAS No. 160 establishes requirements for ownership interests in subsidiaries held by parties other than the parent (sometimes called “minority interests”) to be clearly identified, presented, and disclosed in the consolidated statement of financial position within equity, but separate from the parent’s equity. All changes in the parent’s ownership interests are required to be accounted for consistently as equity transactions and any non-controlling equity investments in unconsolidated subsidiaries must be measured initially at fair value. SFAS No. 160 is effective, on a prospective basis, for fiscal years beginning after December 15, 2008. However, presentation and disclosure requirements must be retrospectively applied to our Consolidated Financial Statements.
F-72
Table of Contents
Glossary of industry terms
For ease of reference in reviewing this prospectus, we have included the following glossary listing common radio and/or television industry terms used herein with their definitions.
Affiliates refer to the stations (radio or television) that broadcast our programming.
Affiliation agreements (also referred to as station agreements) mean the agreements between us, as the provider of programming, and affiliates, the broadcasters of our content.
Barter refers to the payment of goods or services, instead of cash, as consideration for the goods or services provided. We refer to our system as a “barter” model because we primarily provide our programming for commercial inventory, not cash.
Commercial advertising inventory refers to the advertisements (or commercials) that we receive from our affiliates in exchange for the programming we provide to affiliates. We sell that advertising (also referred to as inventory) to advertisers for cash.
Commercial clearance, usually referred to as a percentage (100% meaning perfect compliance), means the number of commercials actually broadcast by an affiliate as a percentage of the number of commercials contractually required to be broadcast by an affiliate. By way of example only, if an affiliate broadcasts 50 of 100 commercials provided, the affiliate has “cleared” 50% of the commercials.
Copy splitting refers to technology that allows us to simultaneously transmit different commercials in the same program, thereby allowing commercials to be customized and targeted for different local markets and regions.
CPM, or cost per thousand, is a commonly used rate for advertising in the radio industry and refers to how much a unit of advertising (commercial) that delivers 1,000 listeners (also referred to as gross impressions in the radio industry) costs.
DMA, or dominant market area, is a term used by Arbitron to delineate exclusive geographic markets that are grouped together for purposes of providing audience ratings to the radio industry. Each county in the United States is assigned to only one DMA.
Pre-recorded advertisements refers to commercials that are recorded in advance of their distribution for broadcast.
RADAR, or Radio’s All Dimension Audience Research, is the standard accepted and used by the radio industry to measure listeners (audience) of national networks. RADAR publishes its ratings on a quarterly basis, which ratings are presented to advertisers in connection with the sale of commercial advertising inventory. The networks measured by RADAR are referred to as “RADAR Networks”.
Radio network is a term used to refer to a company that produces, provides and distributes programming to multiple radio stations, generally nationwide, for the purpose of extending total coverage beyond the limits of a single broadcast signal. The resulting expanded audience is sold to advertisers whose commercials appear in the network-provided programming.
G-1
Table of Contents
Glossary of industry terms
Sponsorship, which relates to our Metro business only, is a commercial, generally 10-15 seconds, and the “billboard” that is broadcast adjacent to the commercial. The billboard is customarily 2-3 seconds in duration and typically identifies the advertiser who paid for (sponsored) the commercial.
Station compensation is the cash compensation we pay to our affiliates, in certain circumstances, in exchange for their agreement to broadcast the commercials we provide to them.
Syndicate or syndication refers to our right to sell for broadcast and distribute programming to radio and television stations.
G-2
Table of Contents
Shares
Common Stock
PROSPECTUS
UBS Investment Bank
Thomas Weisel Partners LLC
Roth Capital Partners
Moelis & Company
Neither we nor any of the underwriters have authorized anyone to provide information different from that contained in this prospectus. When you make a decision about whether to invest in our common stock, you should not rely upon any information other than the information in this prospectus. Neither the delivery of this prospectus nor the sale of our common stock means that information contained in this prospectus is correct after the date of this prospectus. This prospectus is not an offer to sell or solicitation of an offer to buy these shares of common stock in any circumstances under which the offer or solicitation is unlawful.
Through and including , 2009 (the 25th day after the date of this prospectus), all dealers effecting transactions in these securities, whether or not participating in this offering, may be required to deliver a prospectus. This is in addition to the dealers’ obligation to deliver a prospectus when acting as underwriters and with respect to their unsold allotments or subscriptions.
Table of Contents
Part II
Information not required in prospectus
ITEM 13. OTHER EXPENSES OF ISSUANCE AND DISTRIBUTION.
| SEC registration fees |
$ | 2,790 | |
| FINRA filing fee |
$ | 5,500 | |
| NASDAQ Global Market listing fee |
* | ||
| Printing and distributing |
* | ||
| Legal fees and expenses |
* | ||
| Accounting fees and expenses |
* | ||
| Transfer agent fees and expenses |
* | ||
| Miscellaneous |
* | ||
| Total |
$ | * |
Each of the amounts set forth above, other than the SEC registration fees, the FINRA filing fee and the NASDAQ listing fee, is an estimate.
| * | To be filed by amendment. |
ITEM 14. INDEMNIFICATION OF DIRECTORS AND OFFICERS.
Indemnification of directors and officers
The registrant is incorporated under the laws of the State of Delaware. Section 145 of the General Corporation Law of the State of Delaware, or DGCL, provides that a Delaware corporation may indemnify any person who was or is, or is threatened to be made, a party to any threatened, pending or completed action, suit or proceeding, whether civil, criminal, administrative or investigative (other than an action by or in the right of such corporation), by reason of the fact that such person is or was an officer, director, employee or agent of such corporation, or is or was serving at the request of such corporation as a director, officer, employee or agent of another corporation or enterprise. The indemnity may include expenses (including attorneys’ fees), judgments, fines and amounts paid in settlement actually and reasonably incurred by such person in connection with such action, suit or proceeding, provided such person acted in good faith and in a manner he or she reasonably believed to be in or not opposed to the corporation’s best interests and, with respect to any criminal action or proceeding, had no reasonable cause to believe that his or her conduct was unlawful, except that no indemnification is permitted without judicial approval if such person is adjudged to be liable to the corporation. Where a present or former officer or director is successful on the merits or otherwise in the defense of any action referred to above, the corporation must indemnify him or her against the expenses (including attorneys’ fees) which such officer or director has actually and reasonably incurred.
Section 145 further provides that the indemnification provisions of Section 145 shall not be deemed exclusive of any other rights to which those seeking indemnification may be entitled under any bylaw, agreement, vote of stockholders or disinterested directors or otherwise, both as to action in such person’s official capacity and as to action in another capacity while holding such office. The registrant’s restated certificate of incorporation as currently in effect, or Certificate of Incorporation, contains a provision eliminating the liability of a director to the registrant and its stockholders for monetary damages for breaches of fiduciary duty as a director. However, neither the DGCL nor the registrant’s Certificate of
II-1
Table of Contents
Part II
Incorporation currently allows such provision to limit the liability of a director for: (i) any breach of the director’s duty of loyalty to the registrant or its stockholders; (ii) acts or omissions not in good faith or which involve intentional misconduct or a knowing violation of law; (iii) payment of dividends, stock purchases or redemptions that violate the DGCL; or (iv) any transaction from which the director derived an improper personal benefit. Such limitation of liability also does not affect the availability of equitable remedies such as injunctive relief or rescission.
Section 145 further authorizes a corporation to purchase and maintain insurance on behalf of any person who is or was a director, officer, employee or agent of the corporation, or is or was serving at the request of the corporation as a director, officer, employee or agent of another corporation, partnership, joint venture, trust or other enterprise, against any liability asserted against such person and incurred by such person in any such capacity, arising out of such person’s status as such, whether or not the corporation would otherwise have the power to indemnify such person under Section 145.
The registrant’s amended and restated bylaws as currently in effect, or the Bylaws, provide that, the registrant shall indemnify its directors and officers to the fullest extent authorized or permitted by applicable law, as now or hereafter in effect, and the Certificate of Incorporation, and such right to indemnification shall continue as to a person who has ceased to be a director or officer of the registrant and shall inure to the benefit of his or her heirs, executors and personal and legal representatives; provided, however, that, except for proceedings to enforce rights to indemnification, the registrant shall not be obligated to indemnify any director or officer (or his or her heirs, executors or personal or legal representatives) in connection with a proceeding (or part thereof) initiated by such person unless such proceeding (or part thereof) was authorized or consented to by the board of directors. The right to indemnification conferred by the Bylaws shall include the right to be paid by the registrant the expenses incurred in defending or otherwise participating in any proceeding in advance of its final disposition upon receipt by the registrant of an undertaking by or on behalf of the director or officer receiving advancement to repay the amount advanced if it shall ultimately be determined that such person is not entitled to be indemnified by the registrant under the Bylaws.
The Bylaws also provide that, to the extent authorized from time to time by the Board of Directors, the registrant may provide rights to indemnification and to the advancement of expenses to employees and agents of the registrant similar to those conferred in the Bylaws to directors and officers of the registrant and that the rights to indemnification and to the advancement of expenses conferred in Bylaws shall not be exclusive of any other right which any person may have or hereafter acquire under the Certificate of Incorporation, the Bylaws, any statute, agreement, vote of stockholders or disinterested directors or otherwise.
Under the Bylaws, any repeal or modification of the provisions of the Bylaws relating to indemnification by the stockholders of the registrant shall not adversely affect any rights to indemnification and to the advancement of expenses of a director, officer, employee or agent of the registrant existing at the time of such repeal or modification with respect to any acts or omissions occurring prior to such repeal or modification.
ITEM 15. SALES OF UNREGISTERED SECURITIES.
(a) On each of March 3, 2008 and March 24, 2008, we sold 7,142,857 shares (14,285,714 shares in the aggregate) of our common stock, par value $0.01 per share (“Common Stock”) to Gores Radio Holdings, LLC (“Gores”), an entity managed by The Gores Group, LLC, at a price of $1.75 per share for an aggregate purchase price of $25,000,000. Gores is an “accredited investor” as defined under
II-2
Table of Contents
Part II
Regulation D of the Securities Act, of 1933 as amended and the foregoing shares of our Common Stock sold to Gores were issued pursuant to the exemption from registration contained in Section 4(2) of the Securities Act of 1933, as amended.
(b) On June 19, 2008, we sold to Gores 75,000 shares of our 7.50% Series A Convertible Preferred Stock (“Series A Convertible Preferred Stock”), and warrants to purchase (1) up to 3,330,000 shares of our Common Stock at a strike price of $5.00 per share, (2) up to 3,330,000 shares of our Common Stock at a strike price of $6.00 per share, and (3) up to 3,340,000 shares of our Common Stock at a strike price of $7.00 per share, for an aggregate purchase price of $75,000,000, in each case pursuant to the Purchase Agreement. Gores is an “accredited investor” as defined under Regulation D of the Securities Act, of 1933 as amended and the foregoing shares of our Common Stock sold to Gores were issued pursuant to the exemption from registration contained in Section 4(2) of the Securities Act of 1933, as amended.
(c) On April 23, 2009, we consummated the Restructuring. In connection therewith:
(i) Gores purchased for an aggregate of $1.4 million, $5.0 million aggregate principal amount of our 5.26% Series B Senior Guaranteed Notes due November 30, 2012 (the “Series B Notes”), from a holder of the Series B Notes and purchased for an aggregate of $4.9 million approximately $17.6 million aggregate principal amount of loans from certain lenders under our Credit Agreement, dated as of March 3, 2004, as amended (the “Old Credit Agreement”).
(ii) Gores (i) exchanged all of our 7.50% Series A Preferred Stock that it previously purchased in June 2008 for 75,000 shares of 7.50% Series A-1 Convertible Preferred Stock (the “Series A-1 Preferred Stock”) and (ii) purchased 25,000 shares of our 8.0% Series B Convertible Preferred Stock (the “Series B Preferred Stock” and, together with the Series A-1 Preferred Stock, the “Preferred Stock”) for a per share purchase price of $1,000 and an aggregate purchase price of $25.0 million.
(iii) Holders of our then outstanding 4.64% Series A Senior Guaranteed Notes due November 30, 2009 and Series B Notes and lenders under the Old Credit Agreement, in consideration for releasing all of their respective claims under the such notes and the Old Credit Agreement, collectively received (1) $117.5 million of new senior secured notes (the “Senior Notes”), maturing July 15, 2012; (2) 34,962 shares of Series B Preferred Stock; and (3) a one-time cash payment of $25.0 million. As a result of such transactions, Gores, as a holder of such indebtedness, received approximately $10.8 million aggregate principal amount of Senior Notes, 3,201 additional shares of Series B Preferred Stock and approximately $2.3 million in cash.
(iv) Each of Gores and the other holders of our Senior Notes is an “accredited investor” as defined under Regulation D of the Securities Act, of 1933 as amended and the foregoing shares of our Preferred Stock and Senior Notes were issued pursuant to the exemption from registration contained in Section 4(2) of the Securities Act of 1933, as amended.
The purchasers of the securities described in paragraphs (a)—(c) received written disclosures that the securities had not been registered under the Securities Act and that any resale must be made pursuant to a registration or an available exemption from registration. The sales of these securities were made without general solicitation or advertising.
ITEM 16. EXHIBITS.
The exhibits to this Registration Statement are listed on the Exhibit Index, which is incorporated by reference in this Item 16.
II-3
Table of Contents
Part II
ITEM 17. UNDERTAKINGS.
Insofar as indemnification for liabilities arising under the Securities Act of 1933 may be permitted to directors, officers and controlling persons of the registrant pursuant to the foregoing provisions, or otherwise, the registrant has been advised that in the opinion of the Securities and Exchange Commission such indemnification is against public policy as expressed in the Act and is, therefore, unenforceable. In the event that a claim for indemnification against such liabilities (other than the payment by the registrant of expenses incurred or paid by a director, officer or controlling person of the registrant in the successful defense of any action, suit or proceeding) is asserted by such director, officer or controlling person in connection with the securities being registered, the registrant will, unless in the opinion of its counsel the matter has been settled by controlling precedent, submit to a court of appropriate jurisdiction the question whether such indemnification by it is against public policy as expressed in the Act and will be governed by the final adjudication of such issue.
The undersigned registrant hereby undertakes that:
(1) For purposes of determining any liability under the Securities Act of 1933, the information omitted from the form of prospectus filed as part of this registration statement in reliance upon Rule 430A and contained in a form of prospectus filed by the registrant pursuant to Rule 424(b) (1) or (4) or 497(h) under the Securities Act shall be deemed to be part of this registration statement as of the time it was declared effective.
(2) For the purpose of determining any liability under the Securities Act of 1933, each post-effective amendment that contains a form of prospectus shall be deemed to be a new registration statement relating to the securities offered therein, and the offering of such securities at that time shall be deemed to be the initial bona fide offering thereof.
II-4
Table of Contents
Signatures
Pursuant to the requirements of the Securities Act of 1933, the registrant has duly caused this Registration Statement to be signed on its behalf by the undersigned, thereunto duly authorized, in the City of New York, State of New York, on October 29, 2009.
| WESTWOOD ONE, INC. | ||
| By: | /s/ RODERICK M. SHERWOOD, III | |
| Name: | Roderick M. Sherwood, III | |
| Title: | President and Chief Financial Officer | |
POWER OF ATTORNEY
KNOW ALL MEN BY THESE PRESENTS, the undersigned hereby severally constitute and appoint Roderick M. Sherwood, III, Norman J. Pattiz, David Hillman and Melissa Garza and each of them singly, his true and lawful attorney-in-fact and agent, each with full power of substitution and resubstitution, for him and in his name, place and stead, in any and all capacities, to sign any and all amendments (including post-effective amendments) to this Registration Statement, or any related registration statement filed pursuant to Rule 462 under the Securities Act of 1933, as amended, and to file the same, with exhibits thereto, and other documents in connection therewith, with the Securities and Exchange Commission, granting unto said attorneys-in-fact and agents, and each of them, full power and authority to do and perform each and every act and thing requisite and necessary to be done in connection therewith, as fully to all intents and purposes as he might or could do in person, hereby ratifying and confirming all that each of said attorneys-in-fact and agents, or his substitute or substitutes, may lawfully do or cause to be done by virtue hereof.
Pursuant to the requirements of the Securities Act of 1933, this registration statement has been signed by the following persons in the capacities and on the dates indicated.
| Signature | Title | Date | ||
| * Norman J. Pattiz |
Chairman of the Board of Directors |
October 29, 2009 | ||
| * Roderick M. Sherwood, III |
President, Chief Financial Officer and Principal Accounting Officer |
October 29, 2009 | ||
| * Andrew P. Bronstein |
Director |
October 29, 2009 | ||
| * Jonathan I. Gimbel |
Director |
October 29, 2009 | ||
| * Scott M. Honour |
Director |
October 29, 2009 | ||
| * H. Melvin Ming |
Director |
October 29, 2009 | ||
| * Michael F. Nold |
Director |
October 29, 2009 | ||
II-5
Table of Contents
Signatures
| Signature | Title | Date | ||
| * Emanuel Nunez |
Director |
October 29, 2009 | ||
| * Mark Stone |
Director |
October 29, 2009 | ||
| * Ian Weingarten |
Director |
October 29, 2009 | ||
| * Ronald W. Wuensch |
Director |
October 29, 2009 | ||
| *By: | /s/ MELISSA GARZA | |
| Melissa Garza | ||
| Attorney-in-fact | ||
II-6
Table of Contents
Exhibit index
| Exhibit Number |
Description of Documents | |
| 1.1** | Form of Underwriting Agreement | |
| 3.1 | Restated Certificate of Incorporation of Westwood One, Inc. as currently in effect (incorporated by reference to Exhibit 3.1 to Westwood One, Inc.’s Quarterly Report on Form 10-Q for the quarter ended June 30, 2008). | |
| 3.1.1 | Certificate of Amendment to the Restated Certificate of Incorporation of Westwood One, Inc., as filed with the Secretary of the State of Delaware on August 3, 2009 (incorporated by reference to Westwood One, Inc.’s Quarterly Report on Form 10-Q for the quarter ended June 30, 2009). | |
| 3.2 | Amended and Restated By-Laws of Westwood One, Inc. as currently in effect (incorporated by reference to Exhibit 3.1 to Westwood One, Inc.’s Current Report on Form 8-K filed on April 27, 2009). | |
| 4.1 | Specimen Common Stock Certificate. | |
| 4.2 | Note Purchase Agreement, dated as of December 3, 2002, between Westwood One, Inc. and the noteholders parties thereto (incorporated by reference to Westwood One, Inc.’s Current Report on Form 8-K dated December 4, 2002). | |
| 4.2.1 | First Amendment, dated as of February 28, 2008, to Note Purchase Agreement, dated as of December 3, 2002, by and between Westwood One, Inc. and the noteholders parties thereto (incorporated by reference to Westwood One, Inc.’s Current Report on Form 8-K dated February 28, 2008). | |
| 4.3 | Securities Purchase Agreement, dated as of April 23, 2009, by and among Westwood One, Inc. and the other parties thereto (incorporated by reference to Westwood One, Inc.’s Current Report on Form 8-K dated April 27, 2009). | |
| 4.3.1* | Waiver and First Amendment to Securities Purchase Agreement, dated as of October 14, 2009, by and among Westwood One, Inc. and the other parties thereto. | |
| 4.4 | Certificate of Designations for the 7.50% Series A-1 Convertible Preferred Stock as filed with the Secretary of State of the State of Delaware on April 23, 2009 (incorporated by reference to Westwood One, Inc.’s Current Report on Form 8-K dated April 27, 2009). | |
| 4.5 | Certificate of Designations for the 8.0% Series B Convertible Preferred Stock as filed with the Secretary of State of the State of Delaware on April 23, 2009 (incorporated by reference to Westwood One, Inc.’s Current Report on Form 8-K dated April 27, 2009). | |
| 4.6 | First Amendment to Security Agreement, dated as of April 23, 2009, by and among Westwood One, Inc., each of the subsidiaries of Westwood One, Inc. and The Bank of New York Mellon, as collateral trustee (incorporated by reference to Westwood One, Inc.’s Current Report on Form 8-K dated April 27, 2009). | |
| 5.1 | Form of Opinion of Richards, Layton & Finger, P.A. | |
| 10.1 | Employment Agreement, dated April 29, 1998, between Westwood One, Inc. and Norman J. Pattiz (incorporated by reference to Westwood One, Inc.’s annual report on Form 10-K for the year ended December 31, 1998). | |
[Exhibit Index]
II-7
Table of Contents
Exhibit index
| Exhibit Number |
Description of Documents | |
| 10.2 | Amendment to Employment Agreement, dated October 27, 2003, between Westwood One, Inc. and Norman J. Pattiz (incorporated by reference to Westwood One, Inc.’s annual report on Form 10-K for the year ended December 31, 2003). | |
| 10.2.1 | Amendment No. 2 to Employment Agreement, dated November 28, 2005, between Westwood One, Inc. and Norman J. Pattiz (incorporated by reference to Westwood One, Inc.’s Current Report on Form 8-K dated November 28, 2005). | |
| 10.2.2 | Amendment No. 3, effective January 8, 2008, to the employment agreement by and between Westwood One, Inc. and Norman J. Pattiz (incorporated by reference to Westwood One, Inc.’s Current Report on Form 8-K dated January 8, 2008). | |
| 10.2.3 | Amendment No. 4, effective December 31, 2008, to the employment agreement by and between Westwood One, Inc. and Norman J. Pattiz (incorporated by reference to Westwood One, Inc.’s Current Report on Form 8-K dated June 18, 2009). | |
| 10.2.4 | Amendment No. 5, effective June 11, 2008, to the employment agreement by and between Westwood One, Inc. and Norman J. Pattiz (incorporated by reference to Westwood One, Inc.’s Current Report on Form 8-K dated June 18, 2009). | |
| 10.3 | Form of Indemnification Agreement between Westwood One, Inc. and its directors and executive officers (incorporated by reference to Westwood One, Inc.’s proxy statement dated September 25, 1986). | |
| 10.4 | Credit Agreement, dated March 3, 2004, between Westwood One, Inc., the Subsidiary Guarantors parties thereto, the Lenders parties thereto and JPMorgan Chase Bank as Administrative Agent (incorporated by reference to Westwood One, Inc.’s Annual Report on Form 10-K for the year ended December 31, 2003). | |
| 10.4.1 | Amendment No. 1, dated as of October 31, 2006, to the Credit Agreement, dated as of March 3, 2004, between Westwood One, Inc., the Subsidiary Guarantors parties thereto, the Lenders parties thereto and JPMorgan Chase Bank, N.A., as Administrative Agent (incorporated by reference to Westwood One, Inc.’s Current Report on Form 8-K dated November 6, 2006). | |
| 10.4.2 | Amendment No. 2, dated as of January 11, 2008, to the Credit Agreement, dated as of March 3, 2004, between Westwood One, Inc., the Subsidiary Guarantors parties thereto, the Lenders parties thereto and JPMorgan Chase Bank, N.A., as Administrative Agent (incorporated by reference to Westwood One, Inc.’s Current Report on Form 8-K dated January 11, 2008). | |
| 10.4.3 | Amendment No. 3, dated as of February 25, 2008, to the Credit Agreement, dated as of March 3, 2004, between Westwood One, Inc., the Subsidiary Guarantors parties thereto, the Lenders parties thereto and JPMorgan Chase Bank, N.A., as Administrative Agent (incorporated by reference to Westwood One, Inc.’s Current Report on Form 8-K dated February 25, 2008 (filed on February 29, 2008)). | |
| 10.5 | Purchase Agreement, dated as of August 24, 1987, between Westwood One, Inc. and National Broadcasting Company, Inc. (incorporated by reference to Westwood One, Inc.’s Current Report on Form 8-K dated September 4, 1987). | |
[Exhibit Index]
II-8
Table of Contents
Exhibit index
| Exhibit Number |
Description of Documents | |
| 10.6 | Agreement and Plan of Merger among Westwood One, Inc., Copter Acquisition Corp. and Metro Networks, Inc. dated June 1, 1999 (incorporated by reference to Westwood One, Inc.’s Current Report on Form 8-K dated June 4, 1999). | |
| 10.7 | Amendment No. 1 to the Agreement and Plan of Merger, dated as of August 20, 1999, by and among Westwood One, Inc., Copter Acquisition Corp. and Metro Networks, Inc. (incorporated by reference to Westwood One, Inc.’s Current Report on Form 8-K dated October 1, 1999). | |
| 10.8 | Employment Agreement, effective May 1, 2003, between Westwood One, Inc. and Paul Gregrey, as amended by Amendment 1 to Employment Agreement, effective January 1, 2006 (incorporated by reference to Westwood One, Inc.’s Annual Report on Form 10-K for the year ended December 31, 2005). | |
| 10.8.1 | Amendment No. 2 to Employment Agreement, dated May 4, 2007, between Westwood One, Inc. and Paul Gregrey (incorporated by reference to Westwood One, Inc.’s Quarterly Report on Form 10-Q for the quarter ended March 31, 2007). | |
| 10.9 | Employment Agreement, effective October 16, 2004, between Westwood One, Inc. and David Hillman, as amended by Amendment No. 1 to Employment Agreement, effective January 1, 2006 (incorporated by reference to Westwood One, Inc.’s Annual Report on Form 10-K/A for the year ended December 31, 2006). | |
| 10.9.1 | Amendment No. 2 to the Employment Agreement, effective July 10, 2007, between Westwood One, Inc. and David Hillman (incorporated by reference to Westwood One, Inc.’s Current Report on Form 8-K dated July 10, 2007). | |
| 10.10 | Westwood One, Inc. Amended 1999 Stock Incentive Plan (incorporated by reference to Westwood One, Inc.’s proxy statement dated April 30, 1999). | |
| 10.11 | Amendment to Westwood One, Inc. Amended 1999 Stock Incentive Plan, effective May 25, 2005 (incorporated by reference to Westwood One, Inc.’s Current Report on Form 8-K dated May 25, 2005). | |
| 10.12 | Westwood One, Inc. 1989 Stock Incentive Plan (incorporated by reference to Westwood One, Inc.’s proxy statement dated March 27, 1992). | |
| 10.13 | Amendments to Westwood One, Inc.’s Amended 1989 Stock Incentive Plan (incorporated by reference to Westwood One, Inc.’s proxy statement dated July 20, 1994 and proxy statement dated April 29, 1996). | |
| 10.14 | Leases, dated August 9, 1999, between Lefrak SBN LP and Westwood One Radio Networks, Inc. and between Infinity and Westwood One Radio Networks, Inc. relating to New York, New York offices (incorporated by reference to Westwood One, Inc.’s Annual Report on Form 10-K for the year ended December 31, 1999). | |
| 10.15 | Form of Stock Option Agreement under Westwood One, Inc.’s Amended 1999 Stock Incentive Plan (incorporated by reference to Westwood One, Inc.’s Current Report on Form 8-K dated October 12, 2004). | |
| 10.16 | Employment Agreement, effective January 1, 2004, between Westwood One, Inc. and Andrew Zaref (incorporated by reference to Westwood One, Inc.’s Annual Report on Form 10-K for the year ended December 31, 2004). | |
[Exhibit Index]
II-9
Table of Contents
Exhibit index
| Exhibit Number |
Description of Documents | |
| 10.16.1 | Amendment No. 1 to Employment Agreement, dated as of June 30, 2006, between Westwood One, Inc. and Andrew Zaref (incorporated by reference to Westwood One, Inc.’s Current Report on Form 8-K dated June 30, 2006). | |
| 10.17 | Westwood One, Inc. 2005 Equity Compensation Plan (incorporated by reference to Westwood One, Inc.’s Current Report on Form 8-K dated May 25, 2005). | |
| 10.18 | Form Amended and Restated Restricted Stock Unit Agreement under Westwood One, Inc. 2005 Equity Compensation Plan for outside directors (incorporated by reference to Westwood One, Inc.’s Current Report on Form 8-K dated March 17, 2006). | |
| 10.19 | Form Stock Option Agreement under Westwood One, Inc. 2005 Equity Compensation Plan for directors (incorporated by reference to Westwood One, Inc.’s Current Report on Form 8-K dated December 5, 2005). | |
| 10.20 | Form Stock Option Agreement under Westwood One, Inc. 2005 Equity Compensation Plan for non-director participants (incorporated by reference to Westwood One, Inc.’s Current Report on Form 8-K dated December 5, 2005). | |
| 10.21 | Form Restricted Stock Unit Agreement under Westwood One, Inc. 2005 Equity Compensation Plan for non-director participants (incorporated by reference to Westwood One, Inc.’s Current Report on Form 8-K dated March 17, 2006). | |
| 10.22 | Form Restricted Stock Agreement under Westwood One, Inc. 2005 Equity Compensation Plan for non-director participants (incorporated by reference to Westwood One, Inc.’s Current Report on Form 8-K dated March 17, 2006). | |
| 10.23 | Employment Agreement, effective as of July 16, 2007, by and between Westwood One, Inc. and Gary Yusko (incorporated by reference to Westwood One, Inc.’s Current Report on Form 8-K dated July 10, 2007). | |
| 10.24 | Master Agreement, dated as of October 2, 2007, by and between Westwood One, Inc. and CBS Radio Inc. (incorporated by reference to Westwood One, Inc.’s Current Report on Form 8-K dated October 2, 2007). | |
| 10.25 | Employment Agreement, effective as of January 8, 2008, by and between Westwood One, Inc. and Thomas F.X. Beusse (incorporated by reference to Westwood One, Inc.’s Current Report on Form 8-K dated January 8, 2008). | |
| 10.26 | Consent Agreement, dated as of January 8, 2008, made by and among CBS Radio Inc., Westwood One, Inc., and Thomas F.X. Beusse (incorporated by reference to Westwood One, Inc.’s Current Report on Form 8-K dated January 8, 2008). | |
| 10.27 | Stand-Alone Stock Option Agreement, dated as of January 8, 2008, by and between Westwood One, Inc. and Thomas F.X. Beusse (incorporated by reference to Westwood One, Inc.’s Current Report on Form 8-K dated January 8, 2008). | |
| 10.28 | Letter Agreement, dated February 25, 2008, by and between Westwood One, Inc. and Norman J. Pattiz (incorporated by reference to Westwood One, Inc.’s Current Report on Form 8-K dated February 25, 2008 (filed on February 27, 2008)). | |
| 10.29 | Purchase Agreement, dated February 25, 2008, between Westwood One, Inc. and Gores Radio Holdings, LLC (incorporated by reference to Westwood One, Inc.’s Current Report on Form 8-K dated February 25, 2008 (filed on February 27, 2008)). | |
[Exhibit Index]
II-10
Table of Contents
Exhibit index
| Exhibit Number |
Description of Documents | |
| 10.30 | Registration Rights Agreement, dated March 3, 2008, between Westwood One, Inc. and Gores Radio Holdings, LLC (incorporated by reference to Westwood One, Inc.’s Current Report on Form 8-K dated March 3, 2008). | |
| 10.31 | Intercreditor and Collateral Trust Agreement, dated as of February 28, 2008, by and among Westwood One, Inc., the Subsidiary Guarantors parties thereto, JPMorgan Chase Bank, N.A., as Administrative Agent, the financial institutions that hold the Notes and The Bank of New York, as Collateral Trustee (incorporated by reference to Westwood One, Inc.’s Current Report on Form 8-K dated February 28, 2008). | |
| 10.32 | Shared Security Agreement, dated as of February 28, 2008, by and among Westwood One, Inc., the Subsidiary Guarantors parties thereto, JPMorgan Chase Bank, N.A., as Administrative Agent, and The Bank of New York, as Collateral Trustee (incorporated by reference to Westwood One, Inc.’s Current Report on Form 8-K dated February 28, 2008). | |
| 10.33 | Shared Deed of Trust, Assignment of Rents, Security Agreement and Fixture Filing, dated as of February 28, 2008, by Westwood One, Inc., to First American Title Insurance Company, as Trustee, for the benefit of The Bank of New York, as Beneficiary (incorporated by reference to Westwood One, Inc.’s Current Report on Form 8-K dated February 28, 2008). | |
| 10.34 | Mutual General Release and Covenant Not to Sue, dated as of March 3, 2008, by and between Westwood One, Inc. and CBS Radio Inc. (incorporated by reference to Westwood One, Inc.’s Current Report on Form 8-K dated March 3, 2008). | |
| 10.35 | Amended and Restated News Programming Agreement, dated as of March 3, 2008, by and between Westwood One, Inc. and CBS Radio Inc. (incorporated by reference to Westwood One, Inc.’s Current Report on Form 8-K dated March 3, 2008). | |
| 10.36 | Amended and Restated Technical Services Agreement, dated as of March 3, 2008, by and between Westwood One, Inc. and CBS Radio Inc. (incorporated by reference to Westwood One, Inc.’s Current Report on Form 8-K dated March 3, 2008). | |
| 10.37 | Amended and Restated Trademark License Agreement, dated as of March 3, 2008, by and between Westwood One, Inc. and CBS Radio Inc. (incorporated by reference to Westwood One, Inc.’s Current Report on Form 8-K dated March 3, 2008). | |
| 10.38 | Amended and Restated Registration Rights Agreement, dated as of March 3, 2008, by and between Westwood One, Inc. and CBS Radio Inc. (incorporated by reference to Westwood One, Inc.’s Current Report on Form 8-K dated March 3, 2008). | |
| 10.39 | Lease for 524 W. 57th Street, dated as of March 3, 2008, by and between Westwood One, Inc. and CBS Broadcasting Inc. (incorporated by reference to Westwood One, Inc.’s Current Report on Form 8-K dated March 3, 2008). | |
| 10.40 | Form Westwood One Affiliation Agreement, dated February 29, 2008, between Westwood One, Inc. on its behalf and on behalf of its affiliate, Westwood One Radio Networks, Inc. and CBS Radio Inc., on its behalf and on behalf of certain CBS Radio stations (incorporated by reference to Westwood One, Inc.’s Current Report on Form 8-K dated March 3, 2008). | |
| 10.41 | Form Metro Affiliation Agreement, dated as of February 29, 2008, by and between Metro Networks Communications, Limited Partnership, and CBS Radio Inc., on its behalf and on behalf of certain CBS Radio stations (incorporated by reference to Westwood One, Inc.’s Current Report on Form 8-K dated March 3, 2008). | |
[Exhibit Index]
II-11
Table of Contents
Exhibit index
| Exhibit Number |
Description of Documents | |
| 10.42 | Employment Agreement, dated as of July 7, 2008, between Westwood One, Inc. and Steven Kalin (incorporated by reference to Westwood One, Inc.’s quarterly report on Form 10-Q for the quarter ended June 30, 2008). | |
| 10.43 | Employment Agreement, effective as of September 17, 2008, by and between Westwood One, Inc. and Roderick M. Sherwood, III (incorporated by reference to Westwood One, Inc.’s Current Report on Form 8-K dated September 18, 2008). | |
| 10.44 | Employment Agreement, effective as of October 20, 2008, by and between Westwood One, Inc. and Gary Schonfeld (incorporated by reference to Westwood One, Inc.’s Current Report on Form 8-K dated October 24, 2008). | |
| 10.45 | Separation Agreement, effective as of October 31, 2008, by and between Westwood One, Inc. and Thomas F.X. Beusse (incorporated by reference to Westwood One, Inc.’s Current Report on Form 8-K dated October 30, 2008). | |
| 10.46 | Separation Agreement, effective as of October 31, 2008, by and between Westwood One, Inc. and Paul Gregrey (incorporated by reference to Westwood One, Inc.’s Annual Report on Form 10-K for the year ended December 31, 2008). | |
| 10.47 | License and Services Agreement, dated as of December 22, 2008, by and between Metro Networks Communications, Inc. and TrafficLand, Inc. (incorporated by reference to Westwood One, Inc.’s Current Report on Form 8-K dated December 22, 2008). | |
| 10.48 | Employment Agreement, dated as of May 12, 2008, between Westwood One, Inc. and Andrew Hersam (incorporated by reference to Westwood One, Inc.’s Annual Report on Form 10-K for the year ended December 31, 2008). | |
| 10.49 | Employment Agreement, effective as of April 14, 2008, by and between Westwood One, Inc. and Jonathan Marshall (incorporated by reference to Westwood One, Inc.’s Annual Report on Form 10-K for the year ended December 31, 2008). | |
| 10.50 | Form of Amendment to Employment Agreement for senior executives, amending terms in a manner intended to address Section 409A of the Internal Revenue Code of 1986, as amended (incorporated by reference to Westwood One, Inc.’s Annual Report on Form 10-K for the year ended December 31, 2008). | |
| 10.51 | Amendment No. 1 to Employment Agreement, dated as of December 22, 2008, by and between Westwood One, Inc. and Steven Kalin, amending terms in a manner intended to address Section 409A of the Internal Revenue Code of 1986, as amended (incorporated by reference to Westwood One, Inc.’s Annual Report on Form 10-K for the year ended December 31, 2008). | |
| 10.52 | Credit Agreement, dated as of April 23, 2009, by and among Westwood One, Inc., Wells Fargo Foothill, LLC, and the lenders signatory thereto (incorporated by reference to Westwood One, Inc.’s Current Report on Form 8-K dated April 27, 2009). | |
| 10.52.1* | Waiver and First Amendment to Credit Agreement, dated as of October 14, 2009, by and among Westwood One, Inc., Wells Fargo Foothill, LLC, and the lenders signatory thereto. | |
| 10.53 | Master Mutual Release, dated as of April 23, 2009, by and among Westwood One, Inc. and the other parties party to the Securities Purchase Agreement (incorporated by reference to Westwood One, Inc.’s Current Report on Form 8-K dated April 27, 2009). | |
[Exhibit Index]
II-12
Table of Contents
Exhibit index
| Exhibit Number |
Description of Documents | |
| 10.54 | Purchase Agreement, dated as of April 23, 2009, by and among Westwood One, Inc. and Gores Radio Holdings, LLC (incorporated by reference to Westwood One, Inc.’s Current Report on Form 8-K dated April 27, 2009). | |
| 10.55 | Amendment No. 1 to Registration Rights Agreement, dated as of April 23, 2009, between Westwood One, Inc. and Gores Radio Holdings, LLC (incorporated by reference to Westwood One, Inc.’s Current Report on Form 8-K dated April 27, 2009). | |
| 10.56 | Investor Rights Agreement, dated as of April 23, 2009, among Westwood One, Inc., Gores Radio Holdings, LLC and the other investors signatory thereto and the parties executing a Joinder Agreement in accordance with the terms thereto (incorporated by reference to Westwood One, Inc.’s Current Report on Form 8-K dated April 27, 2009). | |
| 10.57 | Separation Agreement, effective as of March 31, 2009, by and between Westwood One, Inc. and Andrew Hersam (incorporated by reference to Westwood One, Inc.’s Quarterly Report on Form 10-Q for the quarter ended March 31, 2009). | |
| 10.58 | Consulting Agreement made as of April 27, 2009, by and between Westwood One, Inc. and Andrew Hersam (incorporated by reference to Westwood One, Inc.’s Quarterly Report on Form 10-Q for the quarter ended March 31, 2009). | |
| 10.59 | Option Agreement, dated as of December 22, 2008, by and between Registrant and by and among Westwood One, Inc., TLAC, Inc., TrafficLand, Inc. and P. Richard Zitelman, in his capacity as Stockholder Representative, as amended (incorporated by reference to Westwood One, Inc.’s Quarterly Report on Form 10-Q for the quarter ended June 30, 2009). | |
| 21 | List of Subsidiaries (incorporated by reference to Westwood One, Inc.’s Annual Report on Form 10-K for the fiscal year ended December 31, 2008). | |
| 23.1* | Consent of PricewaterhouseCoopers LLP | |
| 23.2 | Consent of Richards, Layton & Finger, P.A. (included in Exhibit 5.1). | |
| 24.1 | Power of Attorney (included on signature page hereto). | |
| * | Filed herewith. |
| ** | To be filed by amendment prior to the effectiveness of the Registration Statement. |
[Exhibit Index]
II-13