Attached files
| file | filename |
|---|---|
| 8-K - UIL FORM 8-K DATED OCTOBER 30, 2009 - UIL HOLDINGS CORP | uil_form8kdated1023009.htm |
| EX-99 - UIL EXHIBIT 99 - EARNINGS RELEASE - UIL HOLDINGS CORP | uil_exh99.htm |

1
EEI
Nov. 2009
44th
Annual EEI Financial Conference
November
2009
-
transforming
investment into future value
Exhibit
99.1

2
EEI
Nov. 2009
Certain
statements contained herein, regarding matters that are not historical facts,
are forward-looking
statements (as defined in the Private Securities Litigation Reform Act of 1995). These include statements
regarding management’s intentions, plans, beliefs, expectations or forecasts for the future. Such forward-
looking statements are based on the Corporation’s expectations and involve risks and uncertainties;
consequently, actual results may differ materially from those expressed or implied in the statements.
Such risks and uncertainties include, but are not limited to, general economic conditions, legislative and
regulatory changes, changes in demand for electricity and other products and services, unanticipated
weather conditions, changes in accounting principles, policies or guidelines, and other economic,
competitive, governmental, and technological factors affecting the operations, timing, markets, products,
services and prices of the Corporation’s subsidiaries. The foregoing and other factors are discussed and
should be reviewed in the Corporation’s most recent Annual Report on Form 10-K and other subsequent
periodic filings with the Securities and Exchange Commission. Forward-looking statements included
herein speak only as of the date hereof and the Corporation undertakes no obligation to revise or update
such statements to reflect events or circumstances after the date hereof or to reflect the occurrence of
unanticipated events or circumstances.
Important
Note to Investors
James
Torgerson
President
and Chief Executive Officer
Anthony
Vallillo
President
and Chief Operating Officer, UI
Richard
Nicholas
Executive
Vice President and Chief Financial Officer

3
EEI
Nov. 2009
UIL
Corporate Structure
UIL
Holdings Corporation
GenConn
Energy LLC
50%
Ø Market cap
of ~ $786 million*
Ø 1,058
employees
Retail
Distribution
Transmission
The
United Illuminating
Company (UI)
Company (UI)
Ø Joint
venture between UI and NRG
Ø Peaking
generation new build
Ø Regulated
transmission
& distribution utility
& distribution utility
Ø ~ 324,000
customers
Ø Full
revenue decoupling
mechanism
mechanism
Ø Weighted
allowed
return on equity of
8.84% in 2009
return on equity of
8.84% in 2009
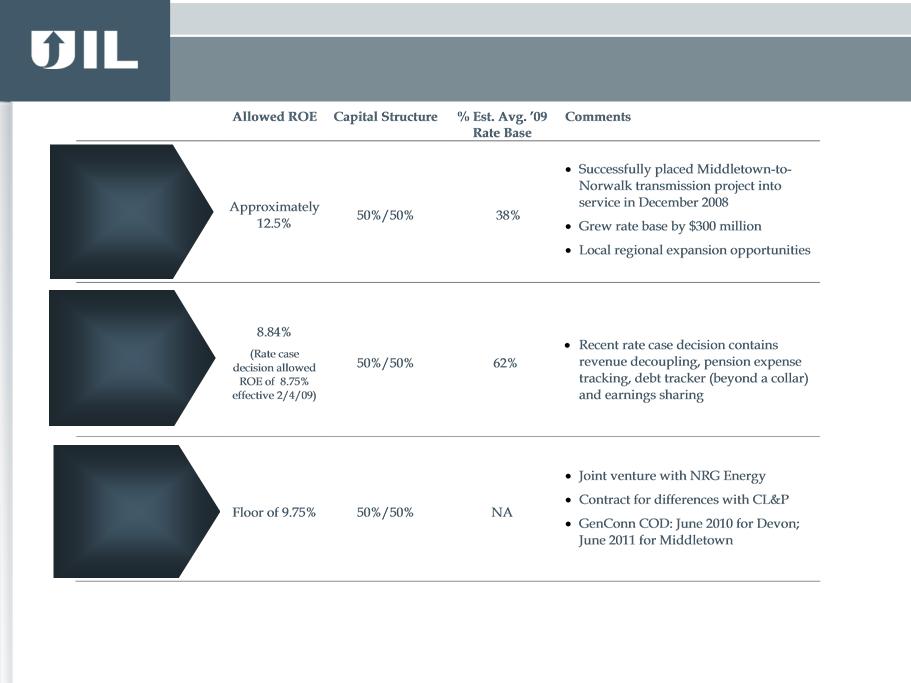
Ø Recently
completed Middletown-
to-Norwalk transmission line
to-Norwalk transmission line
Ø Composite
return on equity
approximately 12.5% in 2009
approximately 12.5% in 2009
Service
Territory in CT
Ø 335 square
miles
Ø Population
of ~736,000
*
As of 10/28/09
4
EEI
Nov. 2009
Progressive
pure-play
electric utility
electric utility
Transmission
focus
(FERC
Regulated)
Regulation
Ø Virtually
100% regulated
Ø Long
history of National 1st quartile reliability
performance
Ø 20 year
leader in Conservation & Load Management programs
Ø Smart Grid
- ahead of the curve
Ø Estimated
38% of 2009 total rate base
Ø 2009
composite return on equity of approximately 12.5% and capital structure of 50%
equity
Ø Identified
future investment opportunities
Ø Recent
distribution rate case includes favorable items such as revenue decoupling
mechanism,
pension
tracker and cost of debt tracking mechanism
Ø Expected
enhanced stability and predictability of earnings
Ø 2009
blended transmission & distribution allowed return on equity of
approximately 10.2%
UIL:
progressive pure-play electric utility with significant growth opportunities and
an attractive dividend yield
Conservative
financial
strategy
strategy
Ø Commitment
to investment grade credit profile
Ø Disciplined
capital investment program
Ø Consistent
history of dividend payments
High
probability
growth
growth
Ø $1.7
billion of projected regulated capital and equity investment for
2009-2018
Ø Base plan
provides significant growth 90+%
probability of occurrence
Ø GenConn:
cost-of-service electric generation development underway
Ø Proven
ability to execute on capital projects, e.g. Middletown-to-Norwalk transmission
line
Investment
Highlights
5
EEI
Nov. 2009
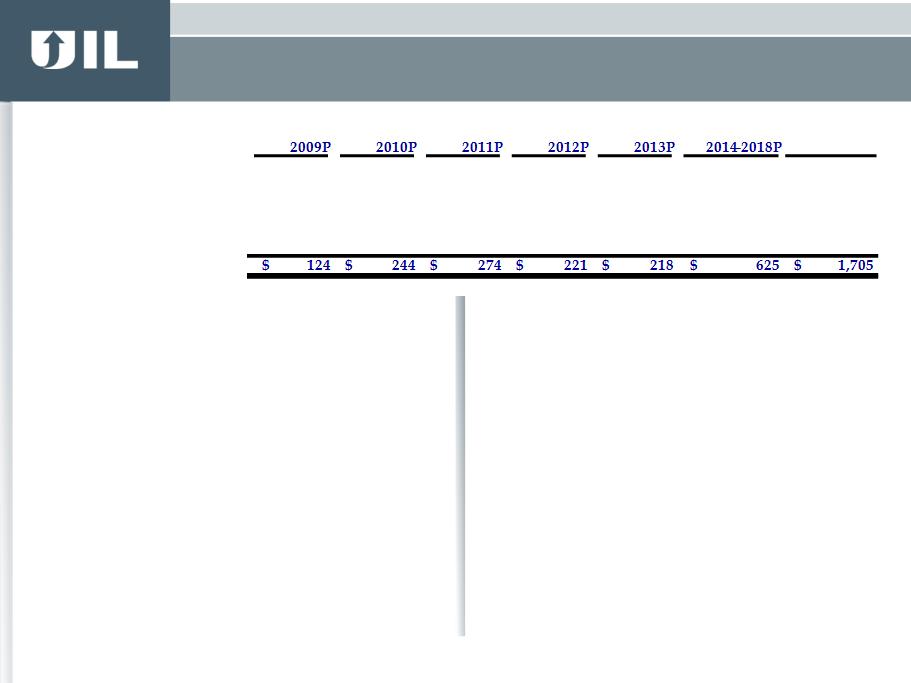
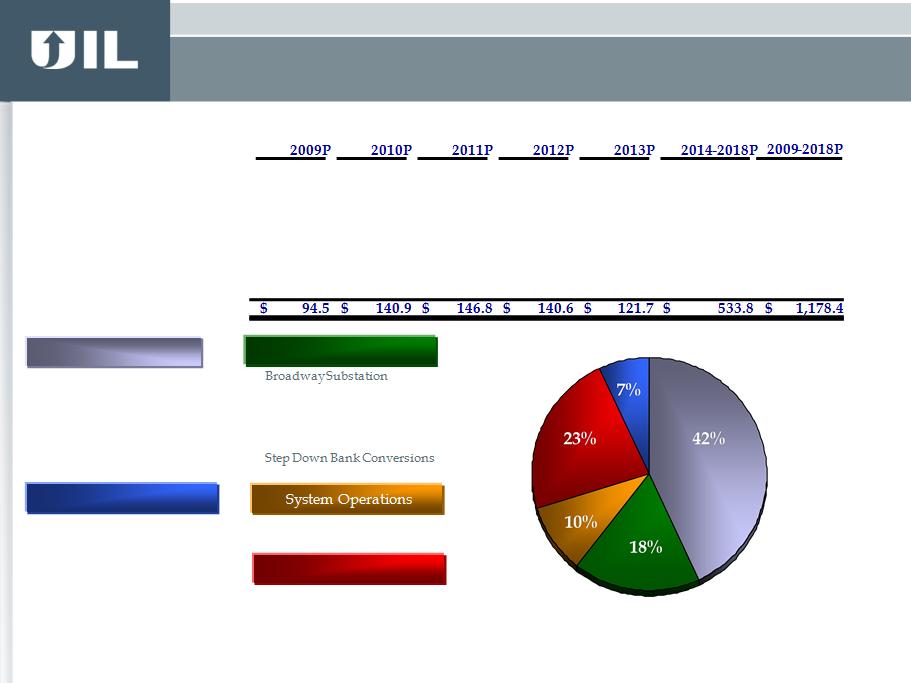
Total
2009-2018P
Distribution
95
$
141
$
147
$
141
$
122
$
534
$
1,178
$
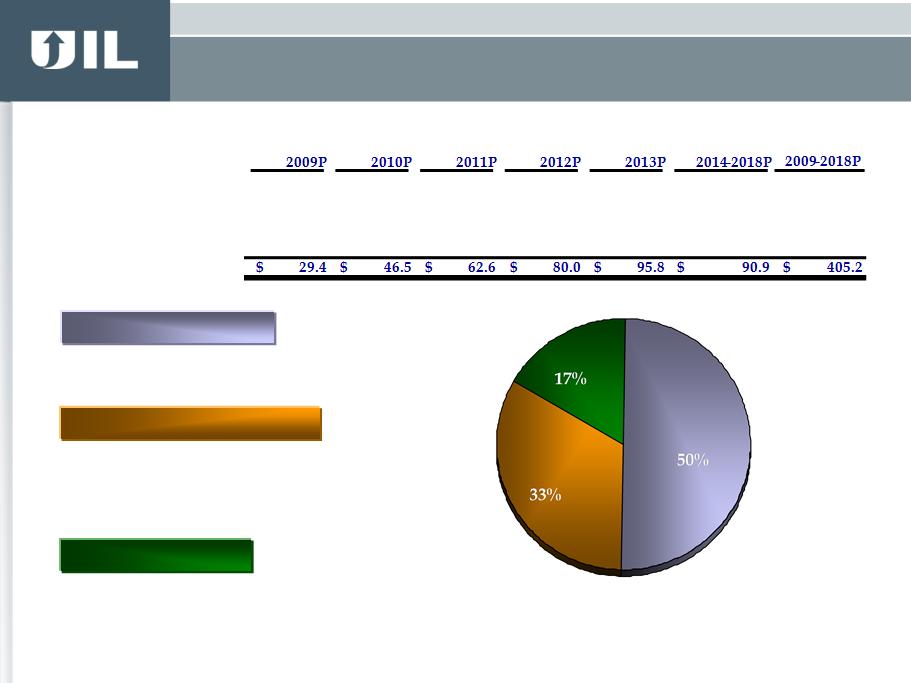
Transmission
29
$
47
$
63
$
80
$
96
$
91
$
405
$
GenConn*
-
$
57
$
65
$
-
$
-
$
-
$
122
$
Total
Base Capital Exp.**
*
Equity investment - Devon plant in-service 6/1/10, Middletown plant in-service
6/1/11.
**
Amounts may not add due to rounding.
($ in
millions)
Base
10-yr CapEx Forecast
Ø High
probability of occurrence (90+%)
» Identified
projects with clear need and
regulatory support
regulatory support
Ø Reflects
decline in future peak load
forecasts
forecasts
» Pushing out
some capacity projects and dollars
beyond prior 10-yr plan
beyond prior 10-yr plan
Growth
Opportunities Beyond Base Forecast
Ø Transmission
investment within the
region
region
» Renewable
Portfolio Standards driving new
transmission
transmission
» Policy
support from New England Governors’
Energy Blueprint
Energy Blueprint
Ø Generation
Opportunities
» Potential
opportunity for ownership of base-
load generation
load generation
Base 10-yr
Capital Expenditure Program
6
EEI
Nov. 2009
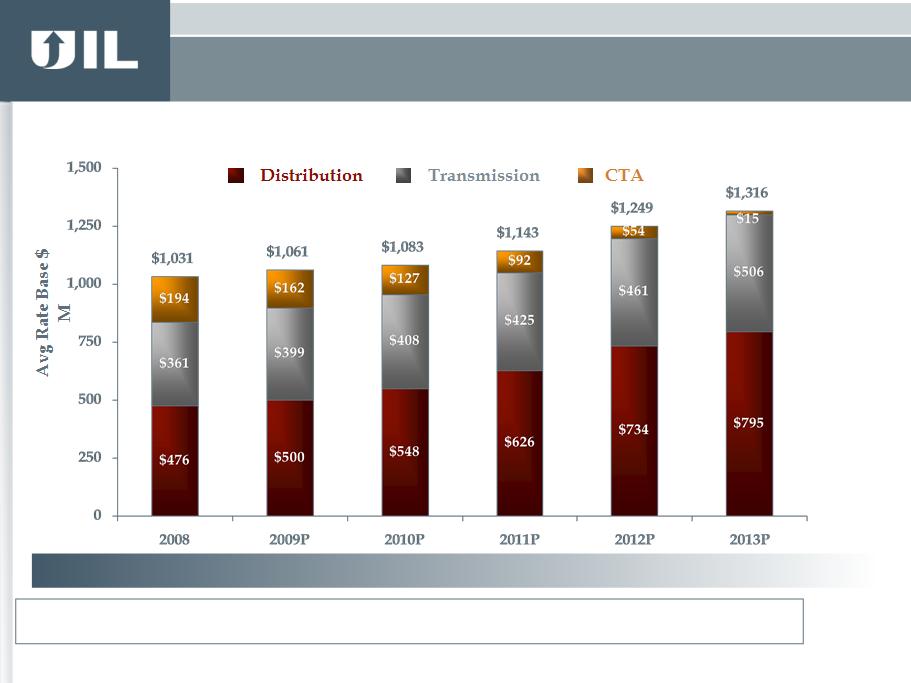
46%
35%
19%
47%
38%
15%
Rate
base growth even with a declining CTA balance
51%
38%
11%
55%
37%
8%
59%
37%
4%
60%
39%
Avg.
GenConn Rate Base Equivalent (UI’s share)
CAGR
5%
1%
$56m
$174m
$232m
$224m
Avg.
GenConn Equity Investment (UI’s share)
$28m
$116m
$112m
$87m
Forecasted
Average Rate Base 2008-2013
(Excluding GenConn Equity Investments)
(Excluding GenConn Equity Investments)

7
EEI
Nov. 2009
|
|
Opportunity
/ Enabler
|
Notes
/ Summary
|
Distribution
|
Transmission
|
In-State
Generation |
|
A
|
Renewable
Portfolio
Standards |
Six
of seven New England states
have adopted standards. CT has limited means to comply. Possible collaboration among New England Transmission Owners. |
|
ü
|
ü
|
|
B
|
New
England
Governors’ Blueprint |
Published
September ’09.
Significant transmission build- out needed (potential $7B to $9B range, could be higher or lower) |
|
ü
|
ü
|
|
C
|
Smart
Grid
|
Advanced
metering, enhanced
monitoring and customer applications |
ü
|
ü
|
|
|
D
|
Reliability,
Capacity,
Aging Infrastructure |
On-going
studies to assess
future needs |
ü
|
ü
|
|
|
E
|
Section
83
CT
Public Act 07-242
|
Allows
UI to purchase, operate
existing plants offered for sale within the state |
|
|
ü
|
Opportunities
not included in 2009-2018 Base Plan
Growth -
Opportunities / Enablers
8
EEI
Nov. 2009
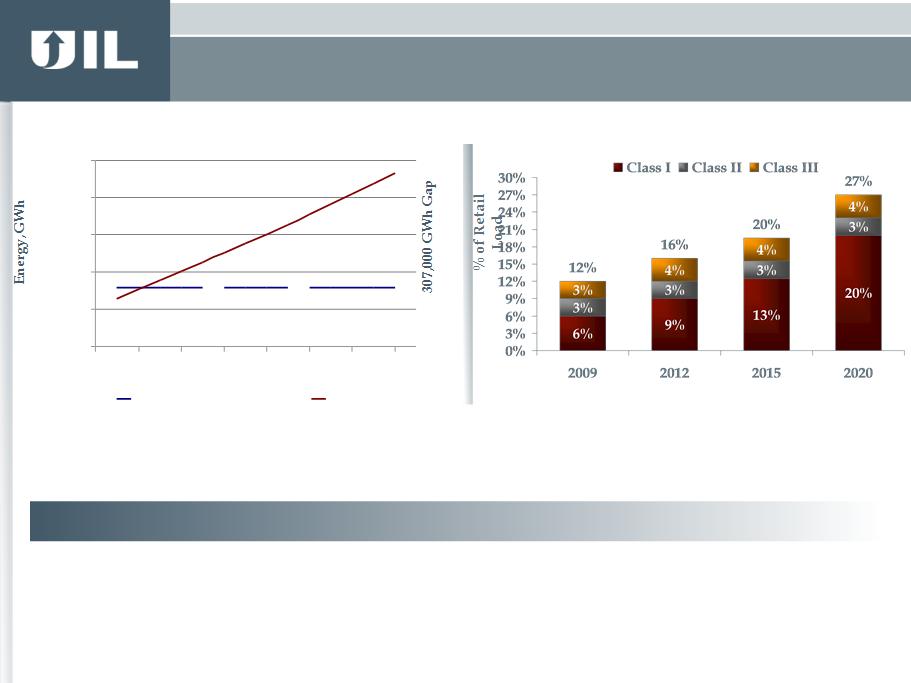
RPS
expected to create investment opportunities for UIL
Class
I
resources include energy derived from solar, wind, fuel cell, methane gas from
landfills, ocean thermal, wave, tidal, run-of-river hydropower and
sustainable
biomass. Data/tables from ISO-NE Update on New England Renewable Portfolio Standards (RPS) and Renewable Resources Outlook, May 15, 2009
biomass. Data/tables from ISO-NE Update on New England Renewable Portfolio Standards (RPS) and Renewable Resources Outlook, May 15, 2009
Class
II
resources include other biomass (NOx emission <0.2 lbs/MMBtu of heat input,
began operation before July 1, 1998), small run-of-river hydroelectric
(<5MW,
began operation before July 1, 2003) and municipal solid waste trash-to-energy facilities
began operation before July 1, 2003) and municipal solid waste trash-to-energy facilities
Class
III
include customer-sited combined heat and power (with operating efficiency
>50% of facilities installed after January 1, 2006), waste heat recovery
systems
(installed on or after April 1, 2007), electricity savings from conservation and load management programs (began on or after January 1, 2006)
(installed on or after April 1, 2007), electricity savings from conservation and load management programs (began on or after January 1, 2006)
Existing
Renewables vs. Region-wide RPS CT RPS
Requirements
Ø Requirement
is ~3 times current renewables level
Ø Gap will
likely be filled by renewables remote from load
-
10,000
20,000
30,000
40,000
50,000
2007
2009
2011
2013
2015
2017
2019
2021
Exist.
Renew. Energy
RPS
Reqmt
10.3%
12.7%
10.8%
30.1%
Growth -
Renewable Portfolio Standards (RPS)
9
EEI
Nov. 2009
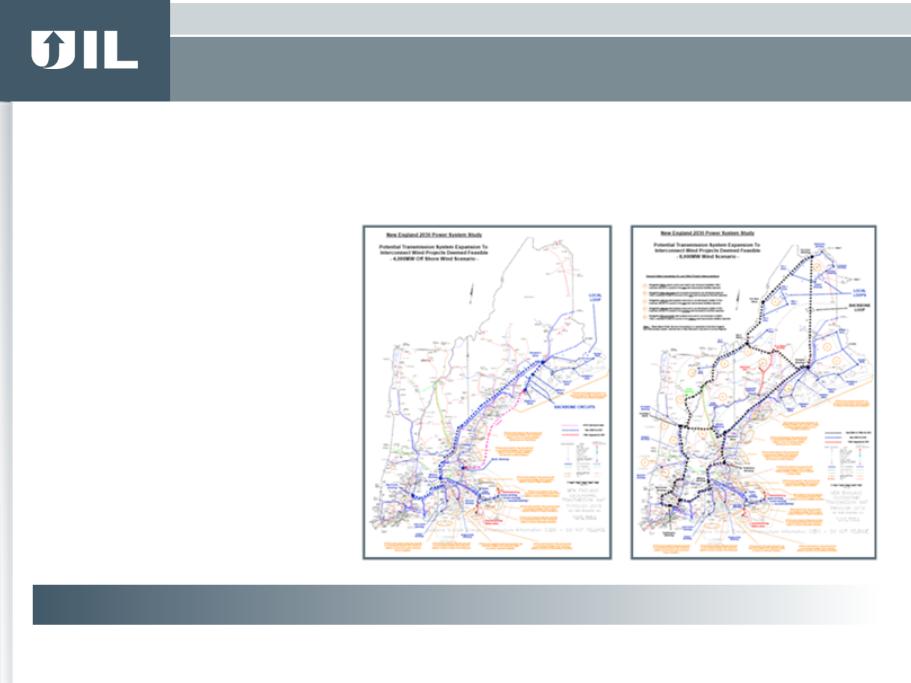
Study
expected to create investment opportunities for UIL
Data
from ISO-NE Preliminary Maps and Cost Estimates for Transmission Scenarios, July
17, 2009. View
distorted intentionally.
ISO-NE
Study:
Ø Basis for
“Blueprint” is the
Renewable Development
Scenario Analysis
Renewable Development
Scenario Analysis
Ø Region
can
develop sufficient
wind resources to satisfy RPS
(and even export)
wind resources to satisfy RPS
(and even export)
Ø Various
scenarios studied, e.g.:
Ø 2,000 MW
on-shore and/or off-
shore
shore
Ø 4,000 MW
on-shore and/or off-
shore
shore
Ø 8,000 MW
on- and off-shore
Ø 12,000 MW
on- and off-shore
Ø Various
reinforcements of
interconnections
interconnections
Transmission
Needed:
Ø Significant
transmission build-out indicated
Ø Potential
$7B to $9B range, could be higher or lower
~4,000
MW by 2030 ~12,000
MW by 2030
Growth -
New England Governors’ Blueprint

10
EEI
Nov. 2009
GenConn
Energy - Devon Site Under Construction

11
EEI
Nov. 2009
UI
Equity Bridge Loan
Ø $121.5m in
total à $88.3m
drawn as of
9/30/09
9/30/09
» $57m due
6/1/10 with Devon in-service
» $64.5m due
6/1/11 with Middletown in-service
NRG
Equity Bridge Loan
Ø $121.5m in
total
GenConn
Project Financing
Ø $291m in
total à includes
$48m working
capital facility
capital facility
Base Plan -
GenConn Energy
Ø 50/50
debt/equity
Status
Ø Devon
Plant
» Turbines
enroute
Ø GenConn
2010 rate case to be filed no later
than December 3, 2009
than December 3, 2009
12
EEI
Nov. 2009
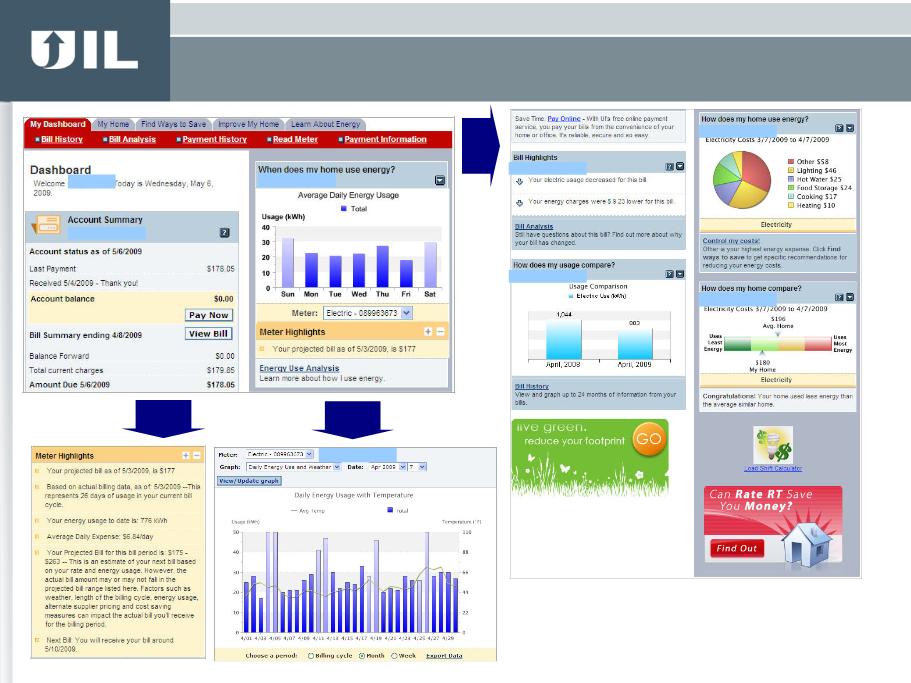
Empowering
the Customer: Current State
“My Account” Dashboard
“My Account” Dashboard

13
EEI
Nov. 2009
Advanced
Metering
Meters
& Meter Equipment
Meter Data
Management
2-way Mesh
Network
Standards
Arc Flash
Mitigation
Customer
Applications
Enhanced
Monitoring
Outage
Management System
SCADA
Network
Systems Communications
Home Area
Network Stimulus
PHEV
Charging Stations
Estimated
Spend $83 million (2009-2018)
UI’s Smart
Grid Base Plan

14
EEI
Nov. 2009
UI - Ahead
of the Curve
Smart
Grid Vision Established - Execution in Progress
Approximately
17% of UI’s Customers are on Time of Use rates
Fixed
one-way wireless network since 2002
Ø Remote
meter reading once a day
Ø Depending
on customer class, meter reading capability
» Hourly
» In 15
minute intervals
Upgraded
to a two-way mesh network in 2009
Ø Allows
2-way communication to and from meters
Ø Allows
communication meter to meter
5,000
Advanced Metering Infrastructure (AMI) meters already installed
Ø 80,000 AMI
meters to be installed by 2012
Ø Remote
disconnect/reconnect capabilities
Ø Network
outage notification and restoration verification

15
EEI
Nov. 2009
AMI
Network
AMI
Host
Software
Wireless
Thermostat
Wireless
Dimmer
Wireless
Dimmer
Wireless
Switch
Wireless
Switch
Wireless
Keypad
InHome
TM
Wireless
Contact Switch
Home
Heartbeat TM
Wireless
Contact Switch
Home
Heartbeat TM
Wireless
Water
Sensor
Sensor
Wireless
Remote
Wireless
Outlet
Dimmer
Home
Theater Controller
AC
Load
Control
Direct
Load
Control
Wireless
Display
Energy
Management
Services
HAN
Software
2-Way Mesh
Network - already
in place
First
prototype Advanced Meters being installed
Enabling
In-Home Displays & Load Control Appliances
Empowering
the Customer: Future State
Interactive Devices and “Smart” Appliances
Interactive Devices and “Smart” Appliances
16
EEI
Nov. 2009
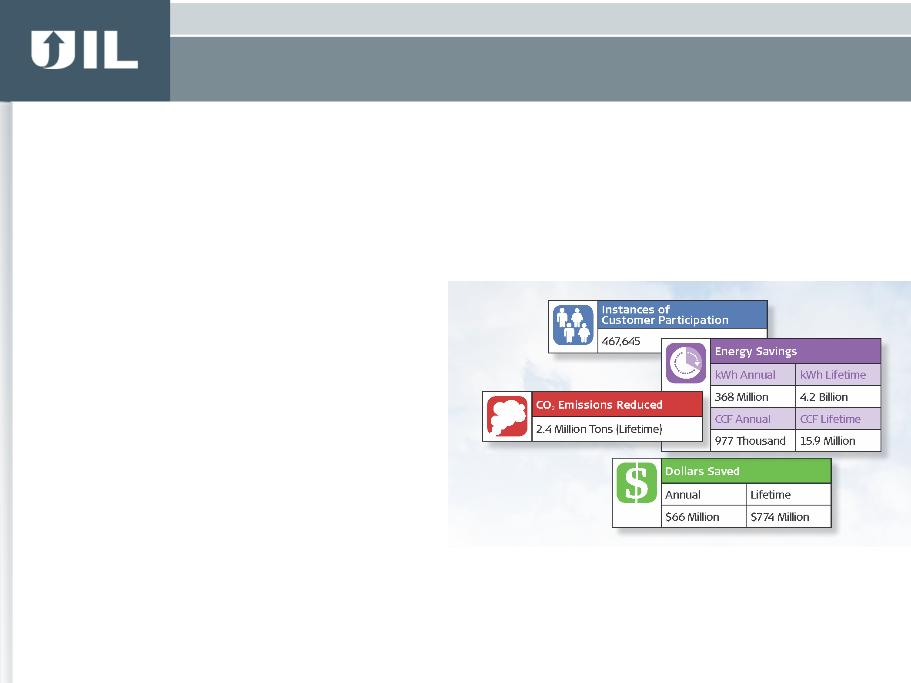
CT
Energy Efficiency Fund Activities in 2008
UI
approximately 20%
UI
has been a leader in energy efficiency programs for more than 2
decades
Leader in
Conservation and Demand Response Programs
Ø Nationally
and internationally
recognized for its programs
recognized for its programs
Ø Small
Business Energy Advantage
Program incorporates innovative
“on-bill financing”
Program incorporates innovative
“on-bill financing”
Ø 973 million
annual lifetime
kilowatt hour savings (5
-year average)
kilowatt hour savings (5
-year average)
Ø 528
thousand annual lifetime tons
of carbon dioxide emissions (5
-year average)
of carbon dioxide emissions (5
-year average)
Ø Annual
pre-tax income
approximately $1 million
approximately $1 million
17
EEI
Nov. 2009
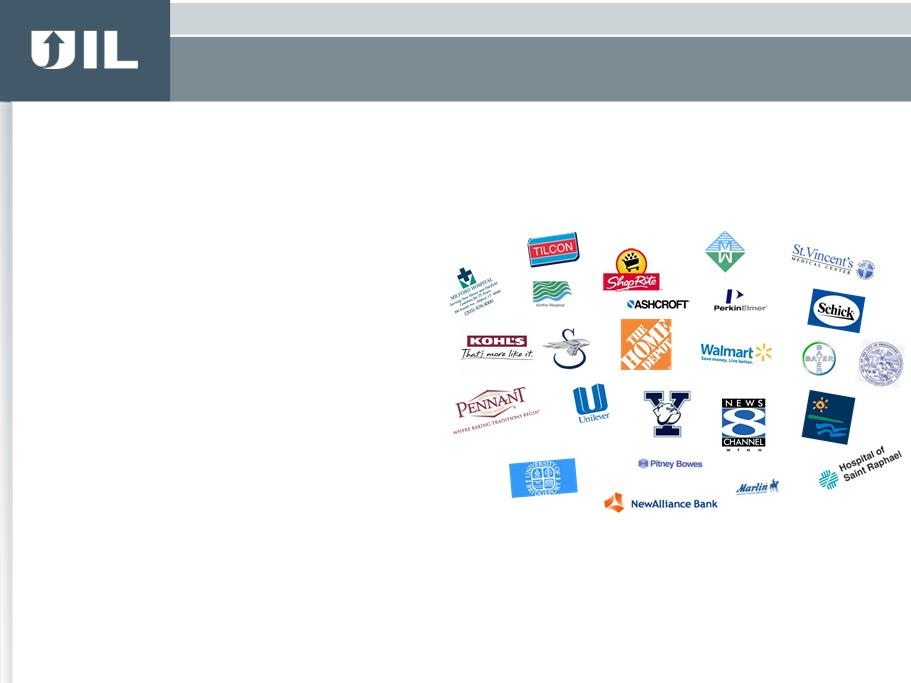
UI
is a leading demand response provider throughout New England
Leader in
Conservation and Demand Response Programs
Ø All the
Home Depot, Walmart and
Kohl’s stores in New England
participate in UI’s Load Response
Program
Kohl’s stores in New England
participate in UI’s Load Response
Program
Ø 600
individual customer assets, 100
MW of load
MW of load
Ø Active in
ISO-NE Market
Committee and Forward Capacity
Working Group to help create
demand response programs that
customers value
Committee and Forward Capacity
Working Group to help create
demand response programs that
customers value
Ø Annual
pre-tax income
approximately $1-$2 million
approximately $1-$2 million
18
EEI
Nov. 2009
Total
Aging
Infrastructure
36.0
$
49.1
$
39.7
$
48.4
$
57.5
$
276.9
$
507.4
$
Capacity
19.8
$
20.0
$
18.3
$
27.5
$
26.5
$
95.7
$
207.8
$
System
Operations
12.6
$
16.1
$
12.5
$
10.1
$
9.1
$
53.8
$
114.2
$
Core
Support
16.2
$
38.9
$
57.2
$
40.4
$
19.3
$
94.0
$
266.1
$
Smart
Grid
(base)
10.0
$
16.8
$
19.2
$
14.2
$
9.4
$
13.4
$
83.0
$
Total
Base Distribution*
Aging
Infrastructure
Cable &
Pole Replacement
Distribution
Transformer
Replacement
Replacement
Splice
Chambers
Substation
Rebuilds
Substation
Removals
Capacity
Shelton
Substation
Bus
Additions
Feeder
Transfers
Core
Support
IT
related
Other
support
Customer
Projects
*
Amounts may not add due to rounding.
Smart
Grid
Advanced
Metering
Meter Data
Management
Outage
Management
SCADA
2-way Mesh
Network
($ in
millions)
Base Plan -
Distribution Investments

19
EEI
Nov. 2009
Advanced
Metering Initiatives
Remote
Connect/Disconnect
Meters
& Meter Equipment
Outage
Management System
Approximate
cost: $48 million (2009-2018)
Status:
On-going
*
Although
UI’s application was not granted by the DOE, UI will continue to invest in a
range of previously approved projects designed to
increase its power grid’s capabilities and in doing so offer measurable benefits to its customers.
increase its power grid’s capabilities and in doing so offer measurable benefits to its customers.
Broadway
Substation
Base
Distribution (and Smart Grid*) Examples
Major
Distribution Programs
Substations
(capacity
& aging infrastructure)
Splice
Chamber Replacement
Cable
Replacement
Approximate
cost: $267 million (2009-2018)
Status:
On-going
20
EEI
Nov. 2009
Substation
Rebuilds
Line/Cable
Replacement
Customer
Projects
NERC/Cyber
Security/IT related
SCADA
Total
Aging
Infrastructure
3.9
$
24.9
$
33.2
$
30.2
$
39.6
$
67.0
$
198.8
$
Capacity
14.1
$
14.5
$
9.5
$
8.4
$
19.7
$
4.2
$
70.4
$
Standards
Compliance/Other
11.4
$
7.1
$
19.8
$
41.5
$
36.6
$
19.7
$
136.0
$
Total
Base Transmission*
Capacity
Standards
Compliance/Other
*Amounts
may not add due to rounding.
($ in
millions)
New
Substations
Reliability
Projects
Aging
Infrastructure
Base Plan -
Transmission Investments
21
EEI
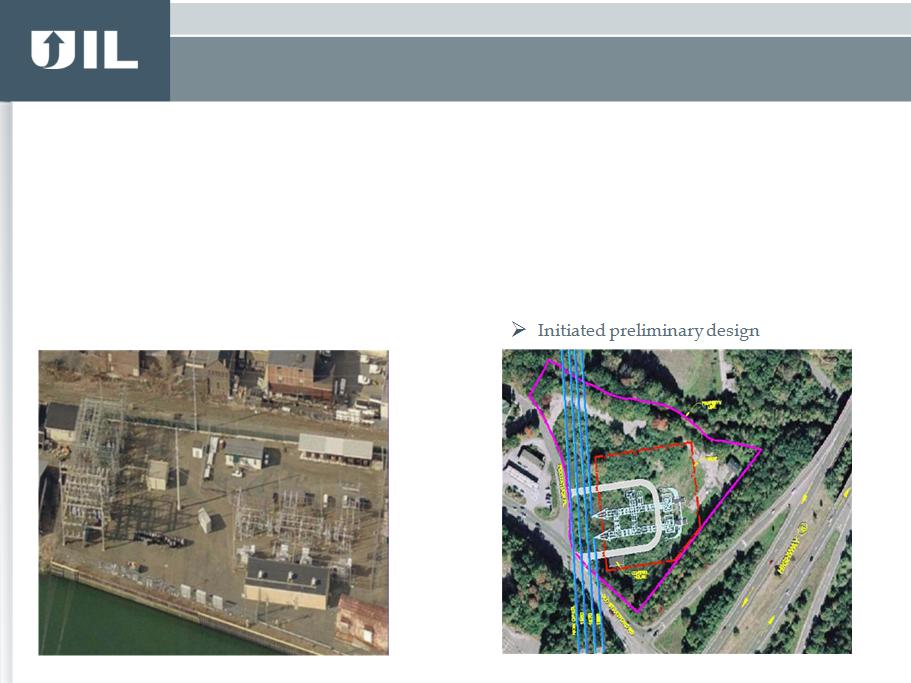
Nov. 2009
Shelton
Substation
Approximate
cost - $34 million
(60%
Transmission, 40% Distribution)
Estimated
in-service - June 2013
Status
Ø Preparing
filing for CT Siting Council
Base -
Transmission Project Examples
Grand
Avenue Switching Station
Approximate
cost - $62 million
(100%
Transmission)
Estimated
in-service - June 2012
Status
Ø CT Siting
Council approval
Ø Continued
preliminary design
22
EEI
Nov. 2009
‘09
Transmission & Distribution Blended Allowed ROE Approx. 10.2%
Transmission
Distribution
&
CTA
Generation

23
EEI
Nov. 2009
Regulatory
Benefits
from 2008 Distribution Rate Case
Ø Rate years
2/4/09 through 2/3/11
» Full
revenue decoupling adjustment
» Cost of
debt tracking mechanism
» Pension
& postretirement expense is recoverable in rates or as a regulatory asset
for
future recovery
future recovery
Ø Portion of
uncollectible expense allocated to Generation Services Charge (GSC)
DPUC
Ø Initiated
informational meetings to discuss "Impact of Recent Economic and
Financial Crisis on Utility Financing & Investment“
Financial Crisis on Utility Financing & Investment“
Ø New docket
(DN 09-10-06) opened to investigate feasibility and desirability of
generic ROE proceeding
generic ROE proceeding

24
EEI
Nov. 2009
3Q
’09 earnings from continuing operations of $21.7 million, or $0.73 per
share,
compared to $21.5 million, or $0.86 per share, in 3Q ’08
compared to $21.5 million, or $0.86 per share, in 3Q ’08
YTD
’09 earnings from continuing operations of $47.6 million, or $1.74 per
share,
compared to $39.4 million, or $1.57 per share, during the same period in ’08
compared to $39.4 million, or $1.57 per share, during the same period in ’08
Ø Successfully
managing O&M costs
Ø Decoupling
adjustment provided Commission-determined revenue requirement
Ø Reasonable
opportunity to achieve distribution allowed return on equity (ROE)
Ø Underlying
transmission growth - higher rate base and equity capitalization
Ø On track to
earn transmission allowed weighted average ROE of approximately
12.5%
3Q &
YTD 2009 Financial Results - Summary

25
EEI
Nov. 2009
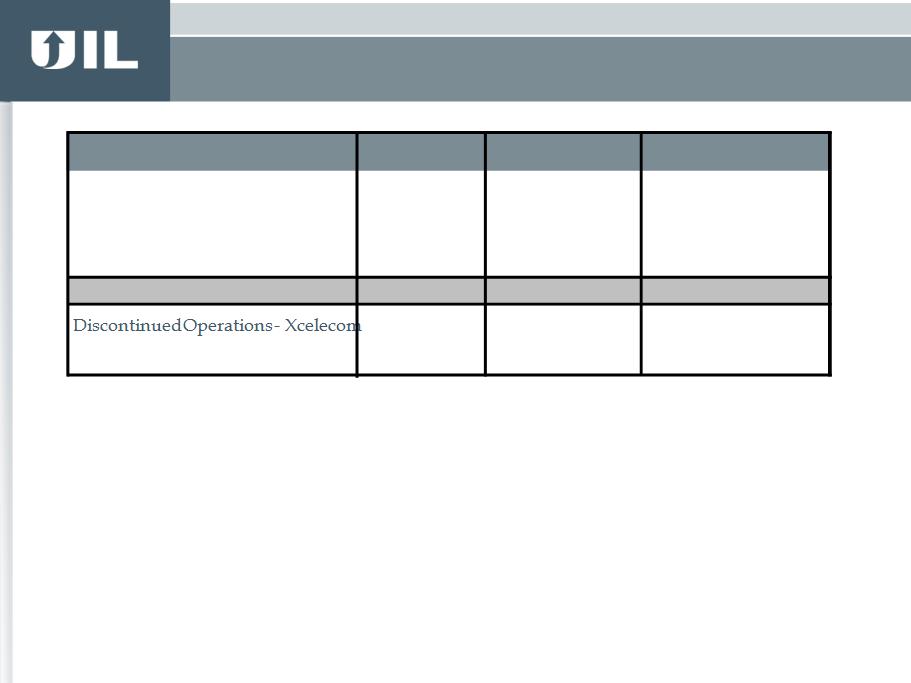
Quarter
Ended September 30,
Nine
Months Ended September 30,
2009
2008
Difference
2009
2008
Difference
UI
Distribution,
CTA and Other
15.4
$
16.2
$
(0.8)
$
30.3
$
24.4
$
5.9
$
Transmission
6.9
6.1
0.8
19.2
17.0
2.2
Total
UI Net Income
22.3
$
22.3
$
-
$
49.5
$
41.4
$
8.1
$
UIL
Corporate
(0.6)
(0.7)
0.1
(1.8)
(1.8)
-
Total
Continuing Operations
21.7
$
21.6
$
0.1
$
47.7
$
39.6
$
8.1
$
Discontinued
Operations - Xcelecom
-
(0.1)
0.1
(0.1)
(0.2)
0.1
Total
Net Income
21.7
$
21.5
$
0.2
$
47.6
$
39.4
$
8.2
$
Average
Shares Outstanding - Basic
29.9
25.1
4.8
27.4
25.1
2.3
EPS
0.73
$
0.86
$
(0.13)
$
1.74
$
1.57
$
0.17
$
The
dilutive effect of the May 2009 issuance of an additional 4,600,000 shares of
common stock in the third quarter and first nine months of 2009
was
$0.13 per share and $0.14 per share, respectively.
3Q &
YTD 2009 Financial Results

26
EEI
Nov. 2009
Ø Successfully
managing O&M expense
Ø Decoupling
adjustment provided DPUC-
determined revenue requirement
determined revenue requirement
Ø Regulatory
true up favorable due to the
absence in 2009 of adjustments recorded in
2008
absence in 2009 of adjustments recorded in
2008
Ø Favorable
uncollectible expense - portion
allocated to GSC ($0.2m in 3Q and $1.1m
YTD)
allocated to GSC ($0.2m in 3Q and $1.1m
YTD)
Ø Pension
& postretirement expense
unfavorable variance primarily due to
negative impact of the financial markets
on pension and postretirement assets.
Such cost increases are fully recoverable
unfavorable variance primarily due to
negative impact of the financial markets
on pension and postretirement assets.
Such cost increases are fully recoverable
Transmission
- growth in both the quarter and YTD
Ø Earning on
higher rate base
Quarter
Ended
Nine
Months Ended
September
30, 2009
September
30, 2009
Favorable/(Unfavorable)
($M)
vs.
2008
vs.
2008
Operating
Revenues
Decoupling
adjustment
1.5
$
3.9
$
Regulatory
true up items
1.4
4.1
Distribution
rates & pricing
(1.4)
1.5
Sales
volume
(2.4)
(5.3)
Other
0.1
0.1
Operation
and Maintenance (O&M) Expense
Customer
service - allocated
(0.5)
1.6
Uncollectibles
1.2
3.3
Outside
services and other expense
1.0
3.3
Pension
& postretirement
(1.5)
(5.4)
Other
Distribution,
CTA & Other Net Income variance
(0.8)
$
5.9
$
Distribution,
CTA & Other Net Income
Earnings
Details Compared to the Same Periods in 2008
Distribution,
CTA & Other - favorable Net Income YTD
27
EEI
Nov. 2009
Liquidity
outlook
Ø UIL &
UI have a $175 million joint credit
facility due December 22, 2011 - $50 million
of limit available for UIL
facility due December 22, 2011 - $50 million
of limit available for UIL
» No
short-term borrowings outstanding under
this facility as of September 30, 2009
this facility as of September 30, 2009
Ø UIL also
has an uncommitted money market
loan facility
loan facility
» No
outstanding balance as of September 30,
2009
2009
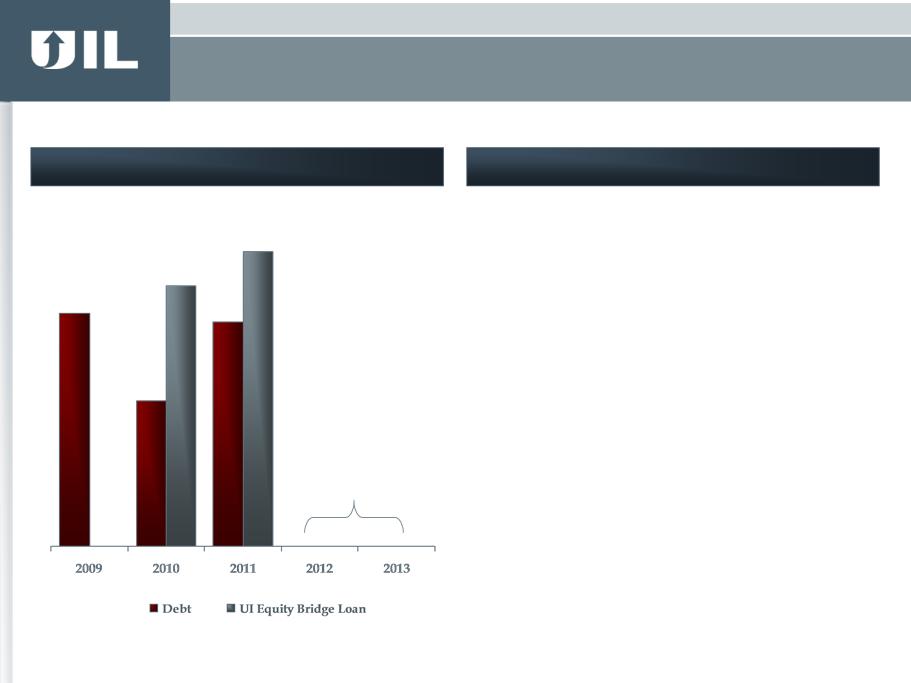
Ø UI must pay
off $121.5 equity bridge loan to
fund its portion of the contribution to
GenConn on the commercial operation date
for each facility, Devon June 2010,
Middletown June 2011
fund its portion of the contribution to
GenConn on the commercial operation date
for each facility, Devon June 2010,
Middletown June 2011
» Borrowings
under this facility as of
September 30, 2009 were $88.3 million
September 30, 2009 were $88.3 million
Ø
No plans to
issue equity before the end of 2010
Debt
maturity schedule as of 9/30/09 ($M)
$49.2
$51.0
$31.8
$57.0
$64.5
NONE
Debt
Maturity and Liquidity
28
EEI
Nov. 2009
2009
expectations are not intended to be additive.
Guidance
Notes
Ø Raised low
end of the 2009 earnings guidance from $1.83 per share
Ø Includes
dilution from equity issuance
Ø Distribution,
CTA & Other positioned for reasonable opportunity to achieve weighted
average
allowed return on equity of 8.84%
allowed return on equity of 8.84%
Ø Transmission
expected to earn an overall allowed weighted average return on equity
of
approximately 12.5%
approximately 12.5%
Ø
2008
Nine
Months Ended
September
30, 2009
2009
EPS Guidance
The United
Illuminating Company
$2.03
$1.81
$1.97 -
$2.07
Distribution,
CTA & Other
1.09
1.11
1.05 -
1.15
Transmission
0.94
0.70
0.90 -
0.95
Corporate
(0.10)
(0.07)
(0.12) -
(0.07)
Total
Continuing Operations
$1.93
$1.74
$1.87
- $1.97
(0.01)
Total
UIL
$1.92
$1.74
YTD 3Q
Earnings & 2009 EPS Guidance as of October 30, 2009

29
EEI
Nov. 2009
2010
Earnings Drivers
Ø Earnings
from GenConn - Devon
» On schedule
to be in-service June 1, 2010
Ø Continual
management of O&M expenses
Ø Executing
on capital expenditure plan
» Rate base
growth
Ø Non-rate
base earnings opportunities
» Conservation
& load management
» ISO-NE
demand response
» Distributed
generation incentives
Ø Earning
distribution allowed ROE

30
EEI
Nov. 2009
Progressive
pure-play
electric utility
electric utility
Transmission
focus
(FERC
Regulated)
Regulation
Ø Virtually
100% regulated
Ø Long
history of National 1st quartile reliability
performance
Ø 20 year
leader in Conservation & Load Management programs
Ø Smart Grid
- ahead of the curve
Ø Estimated
38% of 2009 total rate base
Ø 2009
composite return on equity of approximately 12.5% and capital structure of 50%
equity
Ø Identified
future investment opportunities
Ø Recent
distribution rate case includes favorable items such as revenue decoupling
mechanism,
pension
tracker and cost of debt tracking mechanism
Ø Expected
enhanced stability and predictability of earnings
Ø 2009
blended transmission & distribution allowed return on equity of
approximately 10.2%
UIL:
progressive pure-play electric utility with significant growth opportunities and
an attractive dividend yield
Conservative
financial
strategy
strategy
Ø Commitment
to investment grade credit profile
Ø Disciplined
capital investment program
Ø Consistent
history of dividend payments
High
probability
growth
growth
Ø $1.7
billion of projected regulated capital and equity investment for
2009-2018
Ø Base plan
provides significant growth 90+%
probability of occurrence
Ø GenConn:
cost-of-service electric generation development underway
Ø Proven
ability to execute on capital projects, e.g. Middletown-to-Norwalk transmission
line
Investment
Highlights

31
EEI
Nov. 2009
Q&A
32
EEI
Nov. 2009
Full
revenue
decoupling
decoupling
Ø Annual
true-up
» If revenues
< approved, rates will be adjusted to collect additional
revenues
» If revenues
> approved, excess will be returned to customers
Ø Decoupling
established for two-year pilot period
Other
Ø 50/50
Debt-to-Equity Capitalization with 8.75% ROE
Ø Approved
90% of proposed distribution capital program expenditures
Ø Transferred
approximately $7 million of uncollectibles and other expense to
Generation Services Charge
Generation Services Charge
Pension
Ø Established
a regulatory asset for a portion of 2009 increased pension and
postretirement expense
postretirement expense
» Future
recovery of $10.2 million
Ø Pension
tracker
» 2010
expense true-up based on year-end valuation, which takes into account
changes, if any, in asset values and the discount rate
changes, if any, in asset values and the discount rate
Cost
of debt tracking
mechanism
mechanism
Ø Annual
true-up
» If embedded
debt cost after issuances, differs from allowed embedded cost of debt
of
6.42% for 2009, 6.76% for 2010
6.42% for 2009, 6.76% for 2010
4 True up if
min. 25 basis points and results in +/- $1.5 million interest expense or
greater. $1.5
million deadband à true up covers amounts beyond +/- $1.5 million.
million deadband à true up covers amounts beyond +/- $1.5 million.
Overview of
2008 Distribution Rate Decision