Attached files
| file | filename |
|---|---|
| 8-K - COURTESY COPY OF CURRENT REPORT ON FORM 8-K - PEPCO HOLDINGS LLC | oct30-phi8k.pdf |
| EX-99 - COURTESY COPY OF EEI PRESENTATION - PEPCO HOLDINGS LLC | ex-99.pdf |
| 8-K - CURRENT REPORT ON FORM 8-K - PEPCO HOLDINGS LLC | oct30-phi8k.htm |

MANAGING
TODAY’S
CHALLENGES
Positioning
for Tomorrow’s Growth
44th EEI Financial
Conference • Hollywood,
Florida • November
1 - 4, 2009

Some of
the statements contained in today’s presentations are forward-looking statements
within the meaning of Section 21E of
the Securities Exchange Act of 1934 and are subject to the safe harbor created by the Private Securities Litigation Reform Act of
1995. These statements include all financial projections and any declarations regarding management’s intents, beliefs or current
expectations. In some cases, you can identify forward-looking statements by terminology such as “may,” “will,” “should,” “expects,”
“plans,” “anticipates,” “believes,” “estimates,” “predicts,” “potential” or “continue” or the negative of such terms or other comparable
terminology. Any forward-looking statements are not guarantees of future performance, and actual results could differ materially
from those indicated by the forward-looking statements. Forward-looking statements involve estimates, assumptions, known and
unknown risks, uncertainties and other factors that may cause actual results, levels of activity, performance or achievements to be
materially different from any future results, levels of activity, performance or achievements expressed or implied by such forward-
looking statements. Each forward-looking statement speaks only as of the date of the particular statement, and we undertake no
obligation to publicly update or revise any forward-looking statement, whether as a result of new information, future events or
otherwise. A number of factors could cause actual results or outcomes to differ materially from those indicated by the forward-
looking statements contained in this presentation. These factors include, but are not limited to, prevailing governmental policies
and regulatory actions affecting the energy industry, including with respect to allowed rates of return, industry and rate structure,
acquisition and disposal of assets and facilities, operation and construction of plant facilities, recovery of purchased power
expenses, and present or prospective wholesale and retail competition; changes in and compliance with environmental and safety
laws and policies; weather conditions; population growth rates and demographic patterns; competition for retail and wholesale
customers; general economic conditions, including potential negative impacts resulting from an economic downturn; growth in
demand, sales and capacity to fulfill demand; changes in tax rates or policies or in rates of inflation; rules and changes in
accounting standards or practices; changes in project costs; unanticipated changes in operating expenses and capital
expenditures; the ability to obtain funding in the capital markets on favorable terms; restrictions imposed by Federal and/or state
regulatory commissions, PJM and other regional transmission organizations (NY ISO, ISO New England), the North American
Electric Reliability Council and other applicable electric reliability organizations; legal and administrative proceedings (whether civil
or criminal) and settlements that affect our business and profitability; pace of entry into new markets; volatility in market demand
and prices for energy, capacity and fuel; interest rate fluctuations and credit market concerns; and effects of geopolitical events,
including the threat of domestic terrorism. Readers are referred to the most recent reports filed with the Securities and Exchange
Commission.
Safe
Harbor Statement
1

2009
- Progress on Many Fronts
We
are confident in our plan and are optimistic about longer term
growth
Note: See Safe
Harbor Statement at the beginning of today’s presentation.
|
Long-Term
Strategic Objective
|
Status
|
|
Drive earnings
growth
|
· Four rate
cases filed requesting a total revenue increase of
$146 million · Significant
T&D investments planned (65% growth in rate base
2008 - 2013) |
|
Maintain
dividend and grow longer-term
|
· Commitment to
the dividend
|
|
Reduce overall
business risk and strengthen
investment grade ratings |
· Collateral
management through credit intermediation agreement
· Strategic
analysis of Retail Energy Supply
|
|
Invest in core
T&D business
|
· Two
significant projects - MAPP and Blueprint underway
· 2009 capital
spending tracking to plan
|
|
Implement
Blueprint initiatives
|
· Vendors
selected
· AMI deployment
in DE to begin by year-end 2009
· Legislation
adopted in DC approving AMI deployment
· DOE award of
$168 million for Smart Grid projects
|
|
Achieve
supportive regulatory outcomes
|
· Decoupling
adopted in DC; 60% of regulated distribution revenue
decoupled · Pursuit of
surcharges to minimize regulatory lag
|
|
Prudently
manage complementary
competitive energy businesses |
· Cumberland
plant online - June 1, 2009; Delta plant on schedule
· Expanding
energy services business
|
2
Transmission
& Distribution
Competitive
Energy / Other
2009
- 2013
Forecast
Business
Mix*
70
- 75%
25
- 30%
Note: See Safe
Harbor Statement at the beginning of today’s presentation.
• Growing
regulated
infrastructure
infrastructure
• Leading
edge of
industry transformation
industry transformation
• Complementary
competitive energy
businesses
competitive energy
businesses
• Disciplined
growth
strategy
strategy
…
together offer an
Attractive
total return
Investing
in PHI
*
Percentages based on projected operating income.
PHI
Investments
3
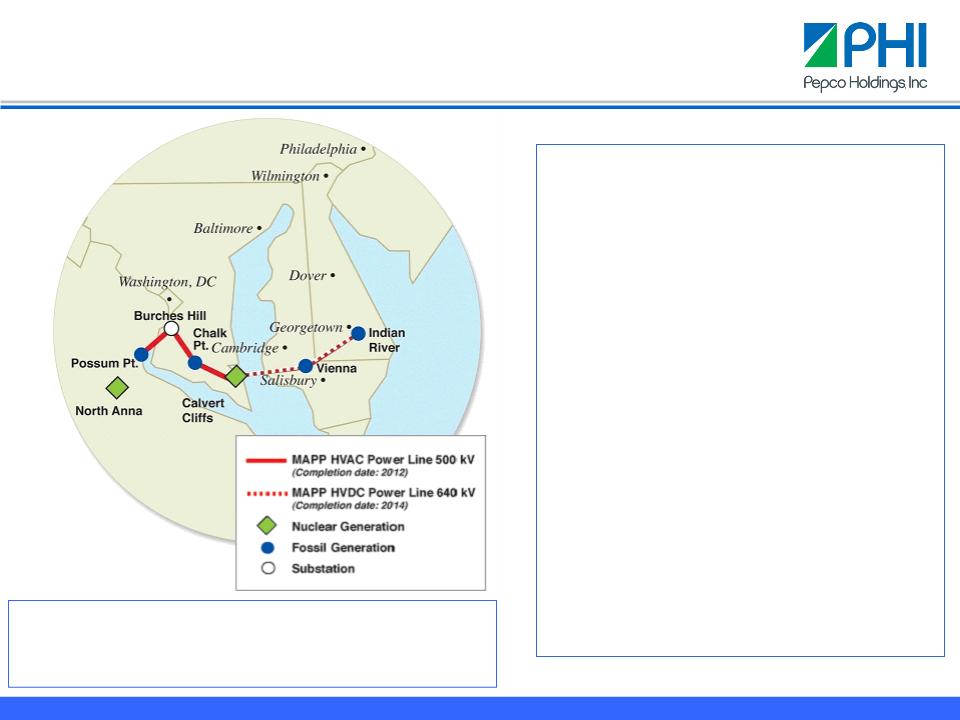
Recent
Events
· Environmental
permitting for Burches
Hill to Chalk Point segment expected
to be complete by early Q1 - 2010
Hill to Chalk Point segment expected
to be complete by early Q1 - 2010
· Cost estimates for
various routes
through Dorchester County to be
finalized Q4 - 2009
through Dorchester County to be
finalized Q4 - 2009
· PSC hearings on need
and
determination for CPCN for MAPP
tentatively scheduled for March 2010;
existing CPCN to be used for Burches
Hill to Chalk Point segment
determination for CPCN for MAPP
tentatively scheduled for March 2010;
existing CPCN to be used for Burches
Hill to Chalk Point segment
· Project is in due
diligence phase of
DOE loan guarantee program
DOE loan guarantee program
• Cost
of project - $1.2 billion
• Construction
activities to begin Q4 2009
• In-service
date - 2014
• Total
length - 150 miles (~ 30 miles on new right-of-way)
Mid-Atlantic
Power Pathway (MAPP)
4
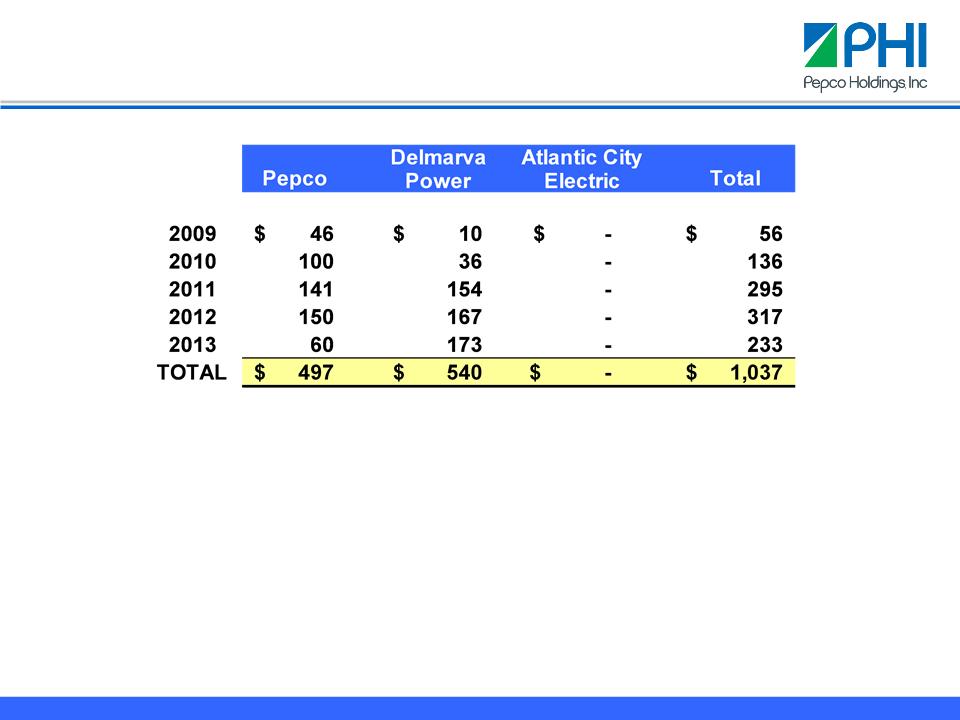
(Dollars
in Millions)
• Current total
estimated cost of project (2008 - 2015) is $1.2 billion
• Application filed
with the Department of Energy (DOE) seeking loans or loan
guarantees ($684 million)
guarantees ($684 million)
– Calvert Cliffs to
Indian River segment; construction expected to begin 2011
– Application passed
the first two levels of DOE review
– Currently in due
diligence phase; decision expected before construction begins
Note: See Safe
Harbor Statement at the beginning of today’s presentation.
MAPP -
Construction Cost and Timing Estimates
5

· Key
vendors selected
· Delaware
deployment
– Completed field
acceptance testing of the AMI
equipment and systems in Q3 - 2009
equipment and systems in Q3 - 2009
– Meter deployment to
begin Q4 - 2009
– Dynamic Pricing
Working Group started work
· District
of Columbia approval of AMI
– Legislation adopted
in June approving AMI
deployment, subject to PSC agreeing to the
sufficiency of federal grants
deployment, subject to PSC agreeing to the
sufficiency of federal grants
– Legislation provides
for cost recovery, and a return
on costs, by the creation of a regulatory asset
on costs, by the creation of a regulatory asset
· Full
deployment expected by 2014, contingent
upon regulatory approvals
upon regulatory approvals
Combines
Smart Grid technology with energy
efficiency programs to help customers control
their energy use and cost, while providing
distribution rate base growth for the Company
efficiency programs to help customers control
their energy use and cost, while providing
distribution rate base growth for the Company
Note: See Safe
Harbor Statement at the beginning of today’s presentation.
Blueprint
for the Future
6
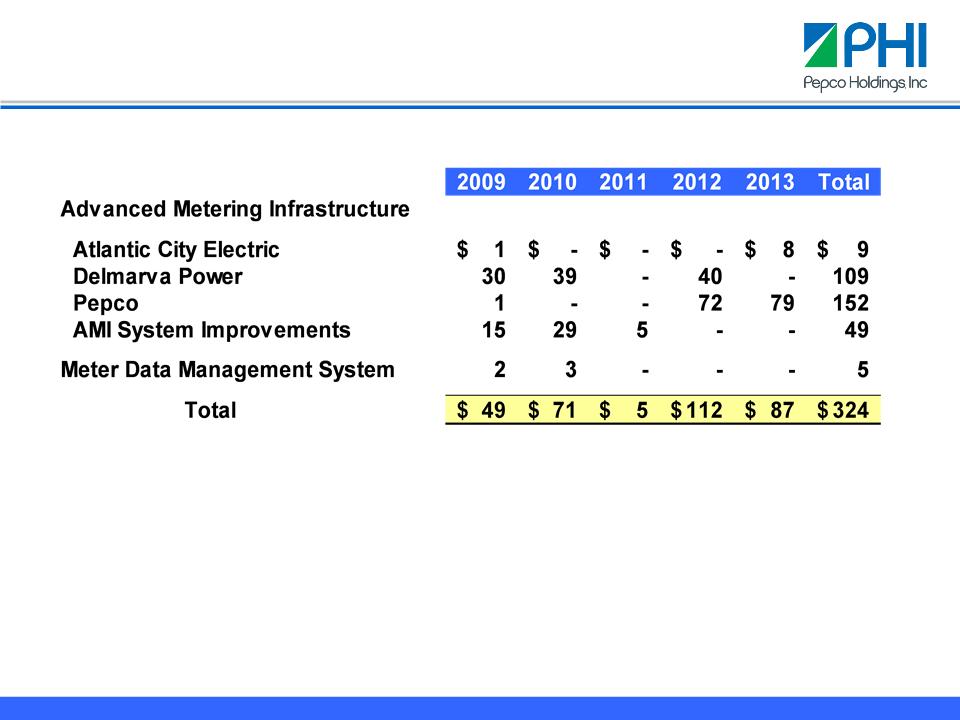
Blueprint for the Future -
Construction Cost and Timing Estimates
(Dollars
in Millions)
• Current
total estimated cost of project (2008 - 2014) is $422 million
• Department
of Energy awarded $168 million in federal stimulus funds for
Smart Grid projects in the District of Columbia, Maryland and New Jersey
Smart Grid projects in the District of Columbia, Maryland and New Jersey
• Grants
will be finalized through negotiations with DOE
Note: See Safe
Harbor Statement at the beginning of today’s presentation.
Note: Construction
cost and timing estimates do not reflect the impact of federal stimulus
funds.
7
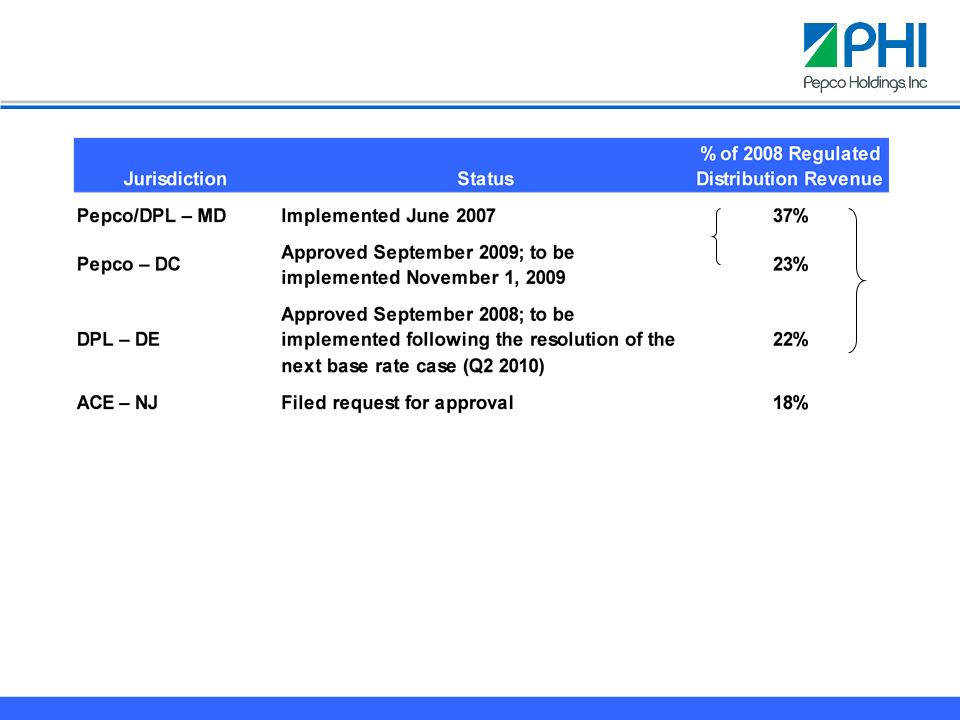
Advantages
of decoupling:
• Fosters
energy conservation as it aligns the interests of customers and
utilities
• Eliminates
revenue fluctuations due to weather and changes in customer usage
patterns
• Provides
for more predictable utility distribution revenues
• Provides
for more reliable fixed-cost recovery
82%
Note: See Safe
Harbor Statement at the beginning of today’s presentation.
60%
Decoupling
Status
8

|
|
Authorized
Return
on Equity
|
2008
Actual
|
Latest
Available
|
|
Delmarva
Power
|
|
|
|
|
Delaware-Electric
|
10.00%
|
9.3%
|
10.1% (2)
|
|
Delaware-Gas
|
10.25%
|
9.4%
|
9.6% (3)
|
|
Maryland
|
10.00%
|
9.8%
|
9.8% (4)
|
|
Pepco
|
|
|
|
|
Maryland
|
10.00%
|
11.2%
|
9.4% (3)
|
|
District
of Columbia
|
9.50%
(5)
|
7.8%
|
7.8% (4)
|
|
|
|
|
|
|
Atlantic
City Electric
|
|
|
|
|
New
Jersey
|
9.75%
|
9.3%
|
8.3% (2)
|
(1) Unadjusted
ROE represents the Return on Equity prior to any adjustments for regulatory
commission
treatment in a base rate case or any other adjustments to actual financials.
treatment in a base rate case or any other adjustments to actual financials.
(2) March
2009
(3) June
2009
(4) December
2008
(5) Reflects
50 basis point reduction for Bill Stabilization Adjustment.
Distribution
Summary (Unadjusted ROE)1
9
Note: See Safe
Harbor Statement at the beginning of today’s presentation.
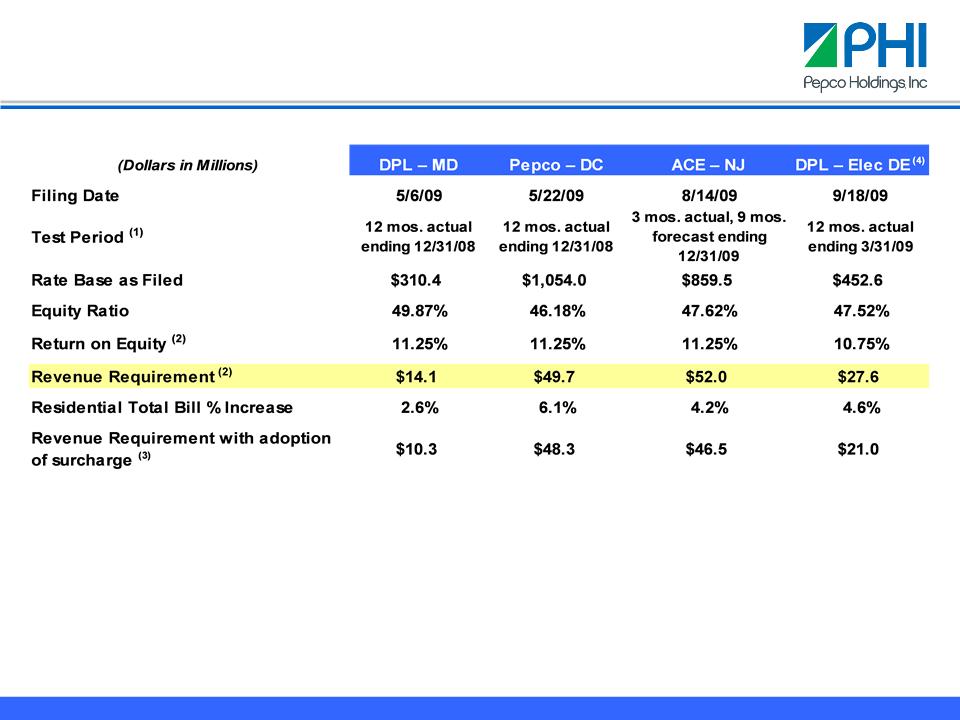
(1) Test
period adjusted for known and measurable changes in all cases; NJ test period to
be updated for actuals during the proceeding.
(2) Return
on equity and revenue requirement as filed by the company assuming
Bill Stabilization Adjustment approval. Return
on equity
recommendation has been updated in the DPL - MD case to 10.75%. The Pepco - DC and ACE - NJ cases may have updated return on
equity recommendations should current market conditions continue.
recommendation has been updated in the DPL - MD case to 10.75%. The Pepco - DC and ACE - NJ cases may have updated return on
equity recommendations should current market conditions continue.
(3) In the
filings, a three year rolling average treatment of pension, OPEB, and bad debt
expense was requested. The
average of these costs
would be recovered through a surcharge (updated annually) with the difference between the average and the actual costs incurred
deferred for future recovery.
would be recovered through a surcharge (updated annually) with the difference between the average and the actual costs incurred
deferred for future recovery.
(4) An
interim rate increase of $2.5 million will be put into effect on November 17,
2009, subject to refund.
Distribution Rate Cases - Summary
10
Note: See Safe
Harbor Statement at the beginning of today’s presentation.
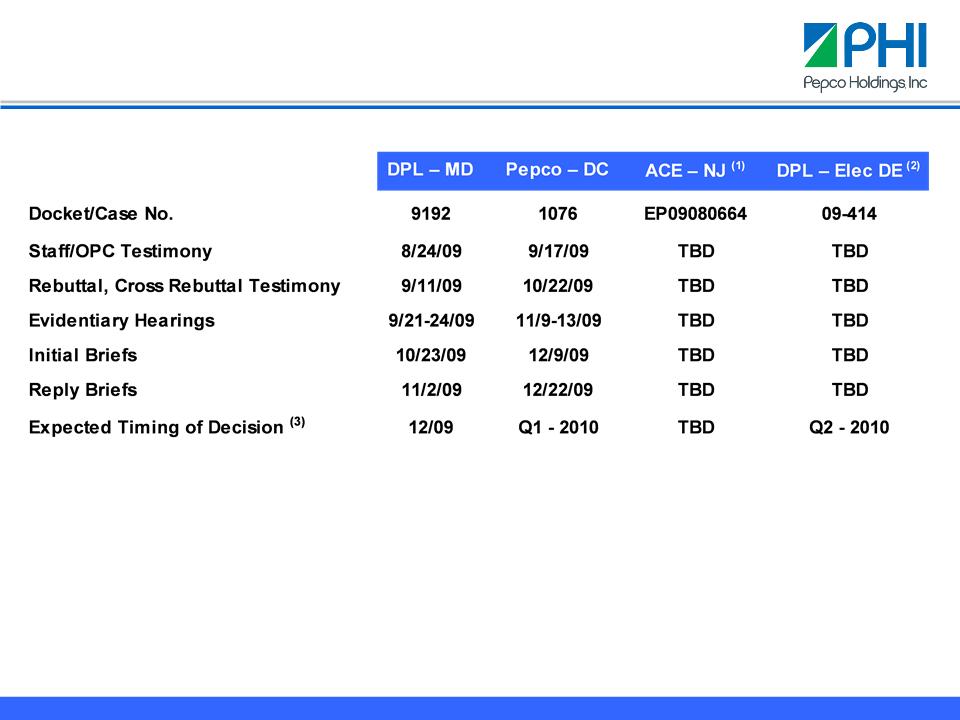
(1) Administrative
Law Judge to convene a prehearing conference by year end to set a procedural
schedule.
(2) Opening
order for the case was issued October 6, 2009, with the intervention period
ending on November 6,
2009. Procedural schedule is expected to be set following the end of the intervention period.
2009. Procedural schedule is expected to be set following the end of the intervention period.
(3) Maryland
and Delaware statutes require completion of cases within seven months or rates
can be put into effect
subject to refund; no statute in the District of Columbia, target to complete cases within nine months of filing;
New Jersey has a nine month statute in place with BPU option to grant extensions.
subject to refund; no statute in the District of Columbia, target to complete cases within nine months of filing;
New Jersey has a nine month statute in place with BPU option to grant extensions.
Distribution
Rate Cases - Timeline
11
Note: See Safe
Harbor Statement at the beginning of today’s presentation.
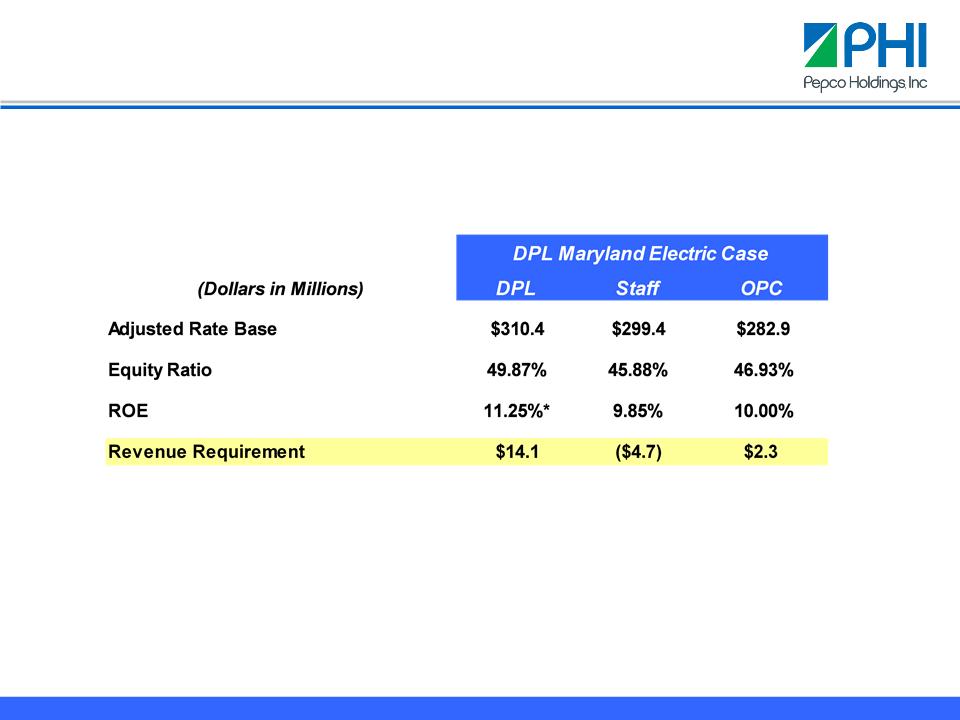
*
Return
on equity recommendation has been updated to 10.75%.
Delmarva
Power - Maryland Electric Case
12
Note: See Safe
Harbor Statement at the beginning of today’s presentation.
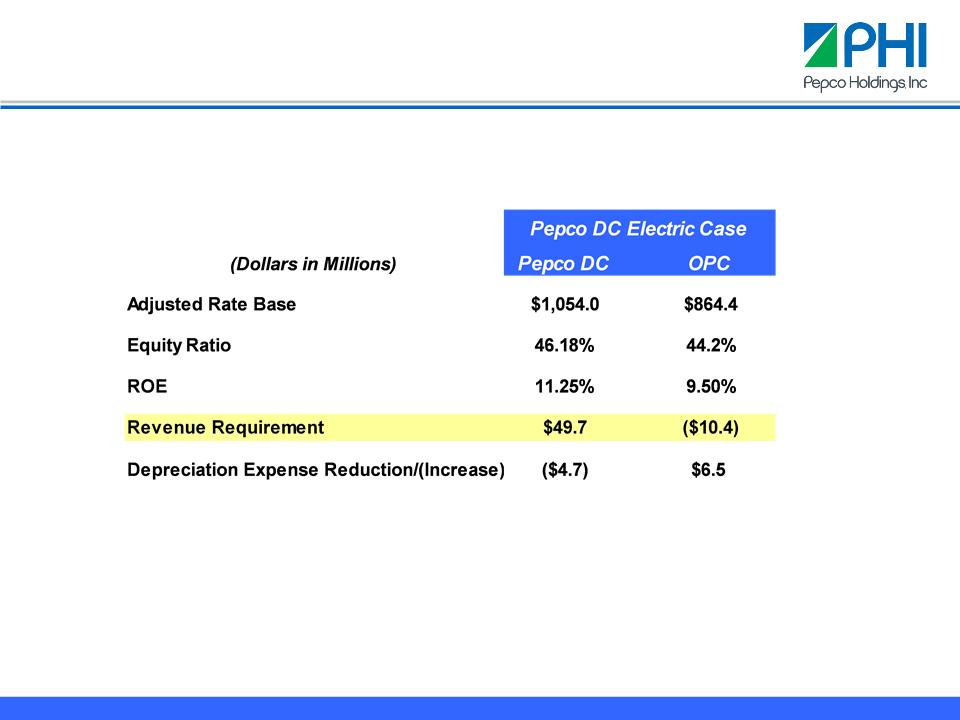
Pepco
- DC Electric Case
13
Vineland
Delta
«
«
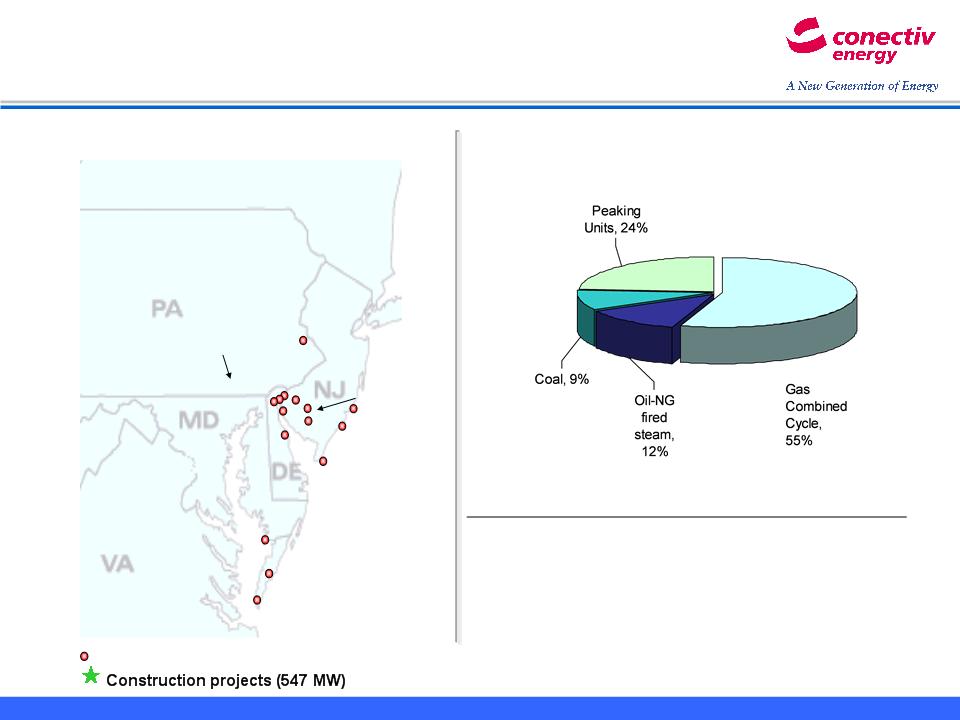
2009
Capacity (4,350 MW)
(Owned
and contracted)
An
Eastern PJM, mid-merit focused generator
Financials
(as of 9/30/09)
Property, Plant
& Equipment $1,340 M
Construction Work in
Process $ 269 M
Employees 424
Note: Excludes
units under development
Existing
sites
Conectiv
Energy Generating Facilities
14
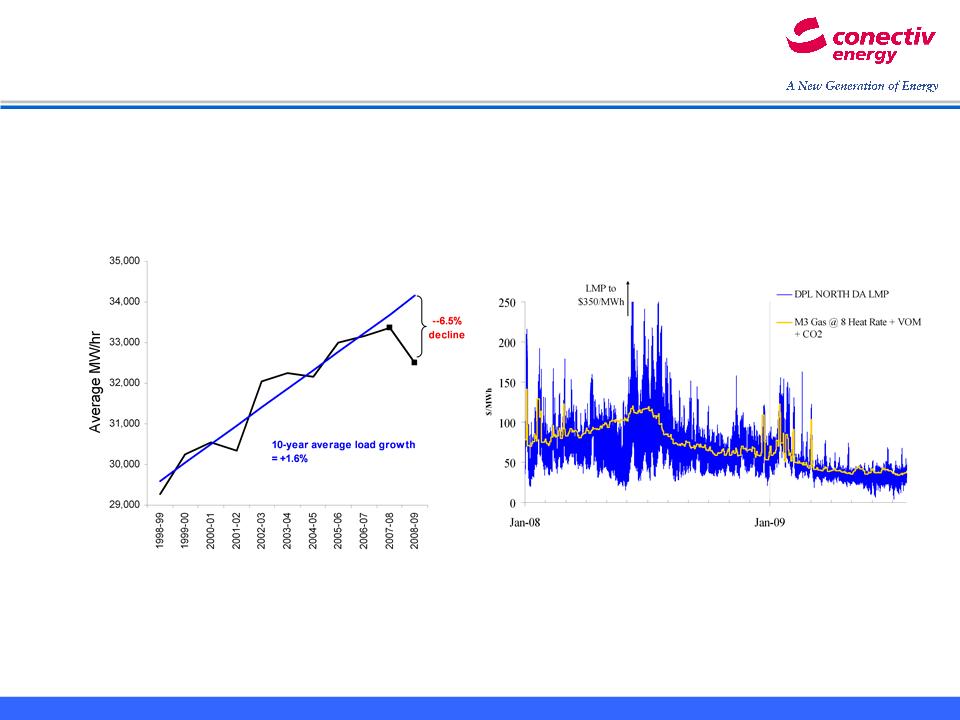
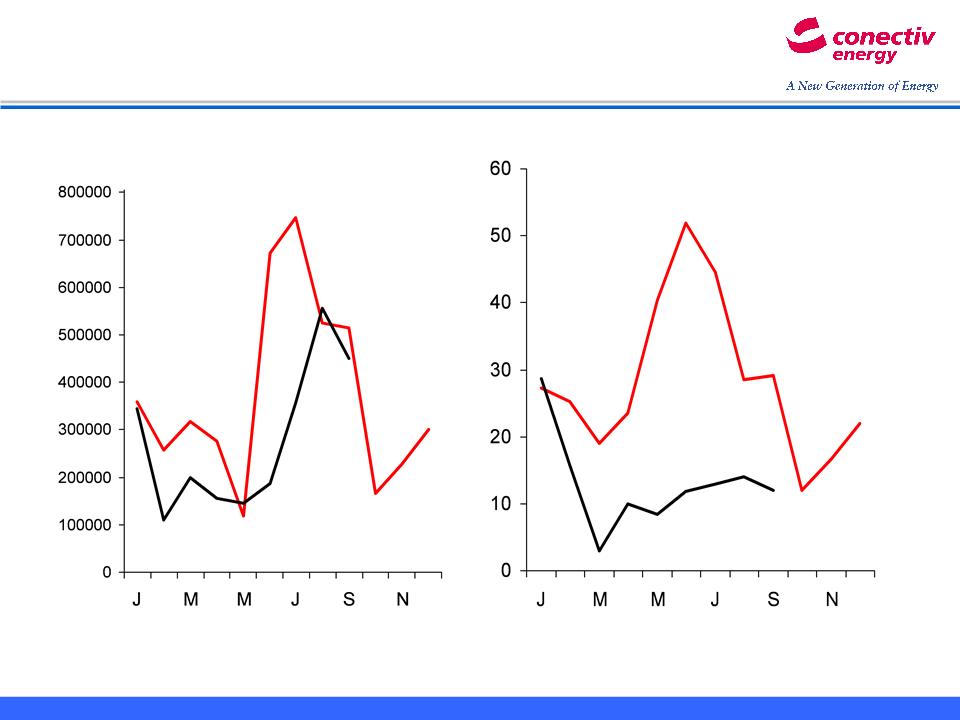
Economic
recession and mild weather have
lowered demand and dampened volatility
lowered demand and dampened volatility
PJM
MAAC Average Load
Gas
CC Hourly Spark Spread
(Jan
2008 - Jul 2009)
Jul-08
Jul-09
Year-to-date
MAAC load is at the same level experienced 6 years ago
15
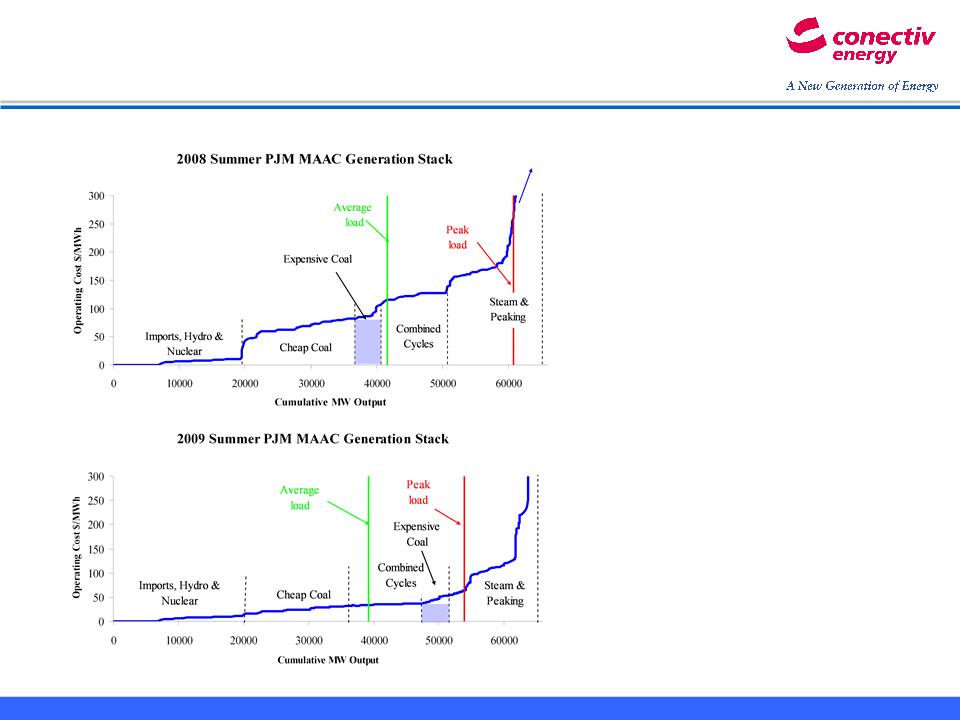
• All fuel prices have
significantly
decreased since last summer -
decreased since last summer -
with
natural gas falling the most -
resulting in much lower power prices
resulting in much lower power prices
• More efficient
combined cycle plants
have displaced “expensive coal”
plants - older sub-critical vintage or
those with high transportation or
environmental costs
have displaced “expensive coal”
plants - older sub-critical vintage or
those with high transportation or
environmental costs
• Mild weather,
efficiency gains, and the
economy have reduced demand -
further reducing the marginal price to
serve the last MW of load
economy have reduced demand -
further reducing the marginal price to
serve the last MW of load
This
has adversely impacted
our 2009 fleet results
our 2009 fleet results
Low
prices and decreased demand have displaced
“expensive coal” generation and compressed margins
“expensive coal” generation and compressed margins
16
MWHR
$/MWHR
Fleet
Generation Volume
Average
Generation Unit Margin
Lower
fleet runs and narrower spreads have resulted in
generation margins that are significantly less than 2008
generation margins that are significantly less than 2008
YTD
Generation volumes are
23% less than 2008 results
23% less than 2008 results
YTD
Generation unit margins are
58% less than 2008 results
58% less than 2008 results
2008
2008
2009
2009
17
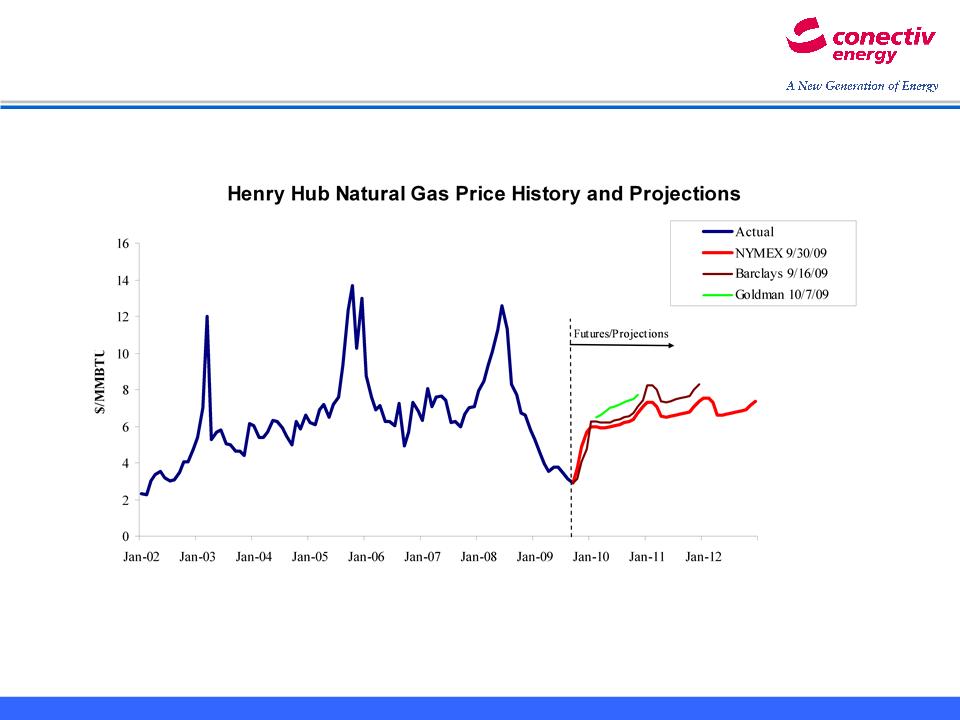
Natural
gas has experienced 2-3 year pricing cycles
On
the positive-side, markets expect
commodity price recovery in 2010-11
commodity price recovery in 2010-11
18
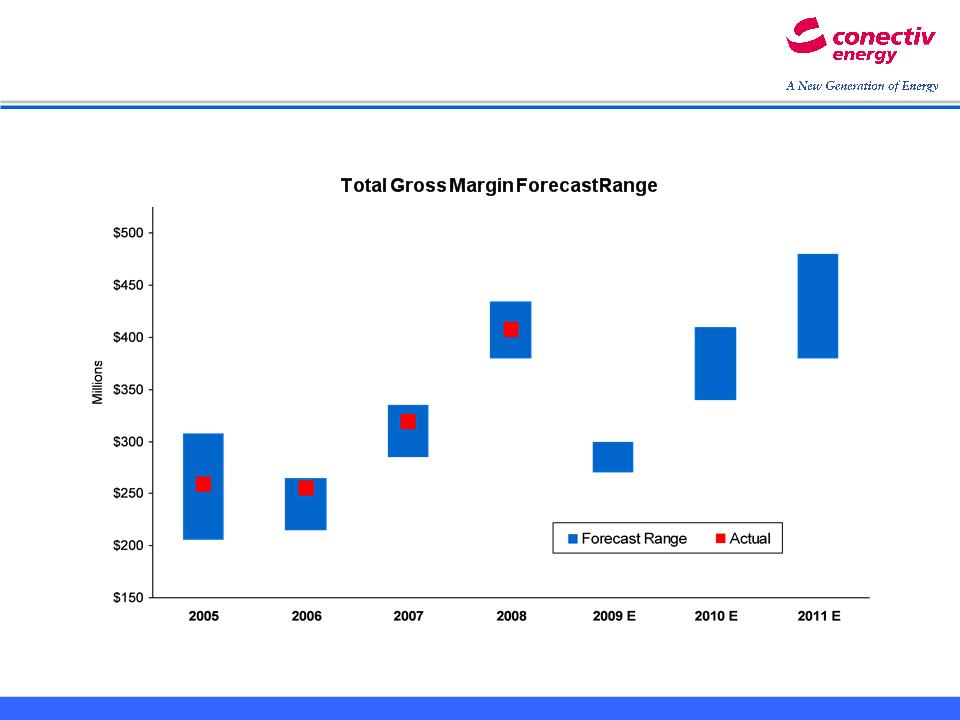
$215
$206
$308
$265
$285
$335
$380
$435
$270
$300
$340
$410
$380
$480
$259
$255
$319
$407
Note: See Safe
Harbor Statement at the beginning of today’s presentation.
Conectiv
Energy Gross Margin Forecast -
narrowed 2010 and 2011 ranges
narrowed 2010 and 2011 ranges
19

Delta
Project - on time; on budget for June 2011
Commercial Operation
Commercial Operation
• 545
MW dual fuel combined cycle plant
located in Peach Bottom Township, PA
located in Peach Bottom Township, PA
• Project
Cost: $470
million
• Project
Summary:
– Construction
~30% complete
– Similar
design with Siemens technology as
Hay Road and Bethlehem plants
Hay Road and Bethlehem plants
– 6-year
tolling agreement with Constellation
provides stable earnings
provides stable earnings
– Permits
and infrastructure allow for
expansion
expansion
20
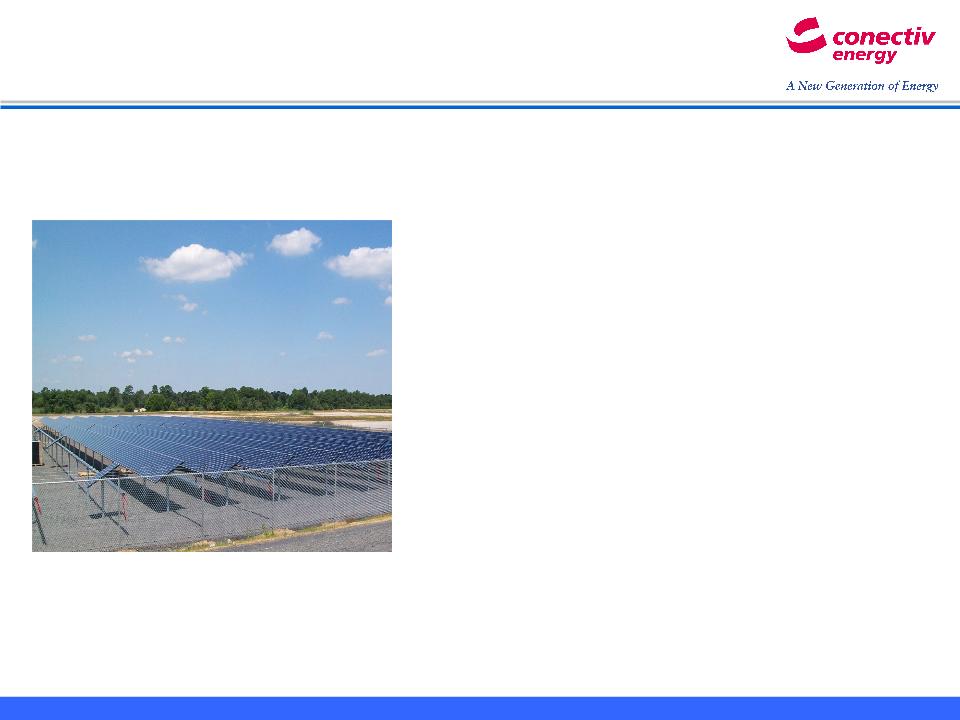
Vineland
Solar Project -
Largest solar facility in New Jersey
Largest solar facility in New Jersey
Note: See Safe
Harbor Statement at the beginning of today’s presentation.
4
MW Solar PV project located in Vineland, NJ
Project
Cost: $20
million
Project
Summary
• Supports
initiative to increase renewable
energy portfolio
energy portfolio
• 25
Year PPA with City of Vineland
• Located
on 28-acre site
Project
Status
• Phase
I: 2.3
MW September
2009
• Phase
II:
1.7 MW December
2009
21

PES
has shifted its strategic focus from
Energy Supply to Energy Services
Energy Supply to Energy Services
PES
earnings contributed
19¢/share
in 2008
Energy
Services 8¢
Services 8¢
Energy
Supply 11¢
Supply 11¢
Overview
• PES provides retail
energy services to large commercial, industrial, and
government customers
government customers
• Energy
Services
– Energy Performance
Contracting (energy efficiency)
– Renewable Energy and
Combined Heat and Power
• Energy
Supply
– Retail Electric and
Natural Gas Supply
• PHI intends to
conclude a strategic analysis
of this business during the 4th quarter 2009
of this business during the 4th quarter 2009
– Power
Generation
• Slated for retirement in
2012
22
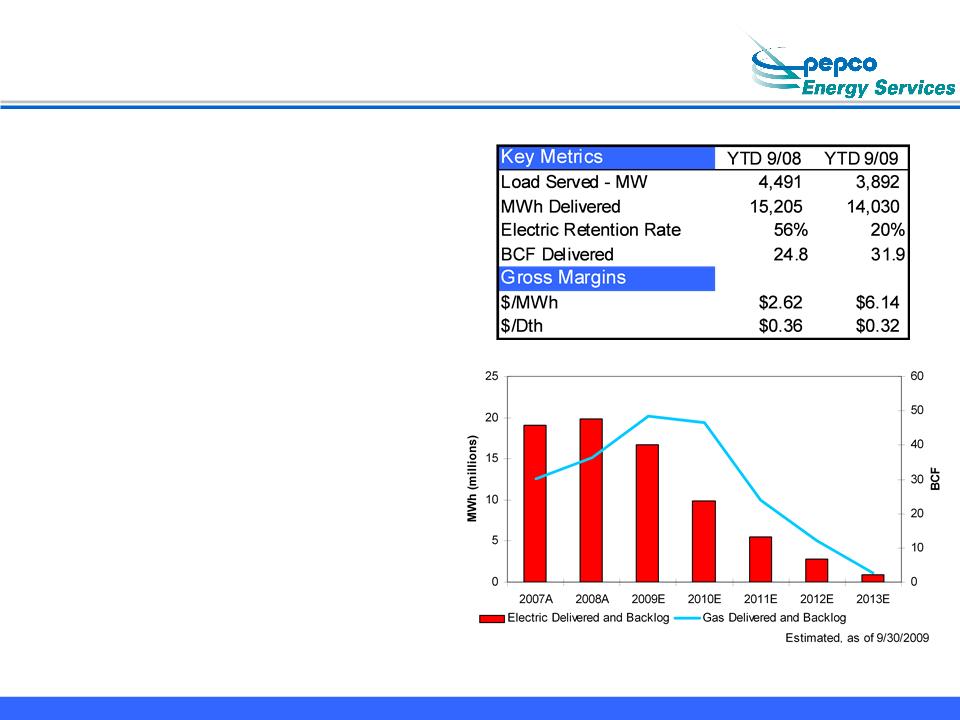
• PES continues to
include a cost of
capital component for all retail supply
proposals to reflect credit market
conditions
capital component for all retail supply
proposals to reflect credit market
conditions
• For all successful
proposals, PES
has been using collateral-free
hedges
has been using collateral-free
hedges
– However, PES’s
retention rate
has been less than 15%
has been less than 15%
• PES expectations of
gross margins
over the long term:
over the long term:
– Historically we have
achieved
approximately $3.00/MWh, although
margins have been in the
$6.00+/MWh range in 2009
approximately $3.00/MWh, although
margins have been in the
$6.00+/MWh range in 2009
– $0.30/Dth range for
natural
gas
gas
Note: See Safe
Harbor Statement at the beginning of today’s presentation.
Retail
electric and natural gas business
23

• PES is well
positioned to grow its energy efficiency business
– Energy Performance
Contracting does not require capital expenditures or
contingent capital; it fits well with PHI’s strategic direction
contingent capital; it fits well with PHI’s strategic direction
– PES has installed
over $750 million of energy efficiency projects since
1995
1995
– PES was ranked the
10th largest ESCO
in North America in a recent
2009 survey
2009 survey
• PES is growing its
development capability to pursue federal energy
efficiency contracts
efficiency contracts
– PES is among a
select group of companies qualified to bid on energy
efficiency projects at all federal facilities
efficiency projects at all federal facilities
– PES has grown its
sales and engineering staff by 40% since 12/31/08
Focused
on growing our energy
efficiency business
efficiency business
24

* Excludes
special items. See
appendix for reconciliation to GAAP.
Third
Quarter 2009
Financial Performance - Drivers
Financial Performance - Drivers
25
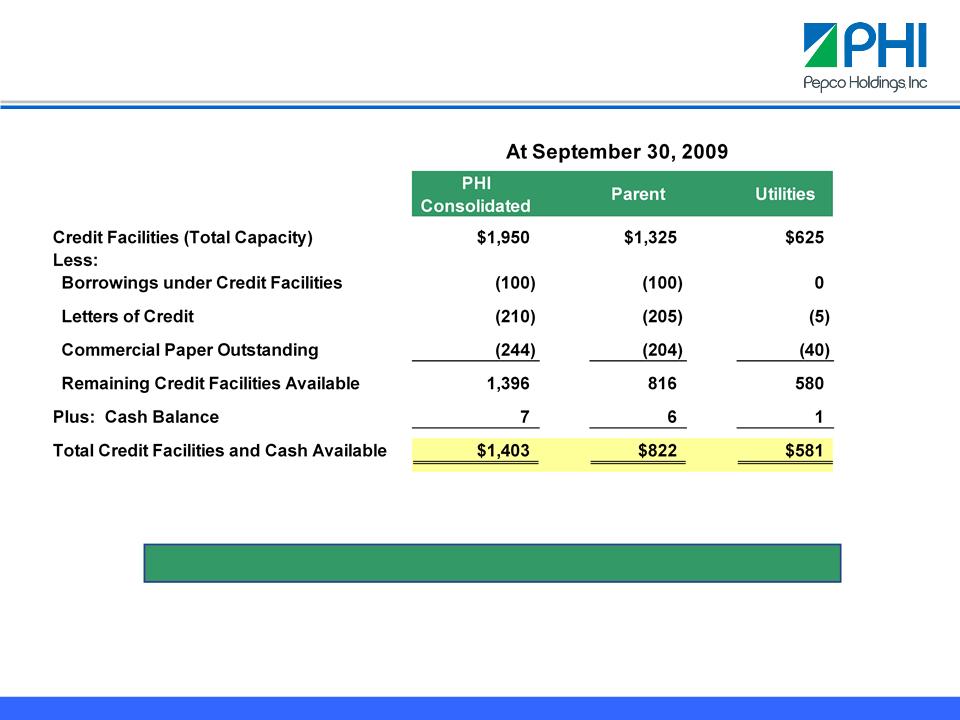
Liquidity
Position
PHI
maintains sufficient liquidity to execute the business plan
Note: See Safe
Harbor Statement at the beginning of today’s presentation.
Millions
of Dollars
26
Millions
of Dollars
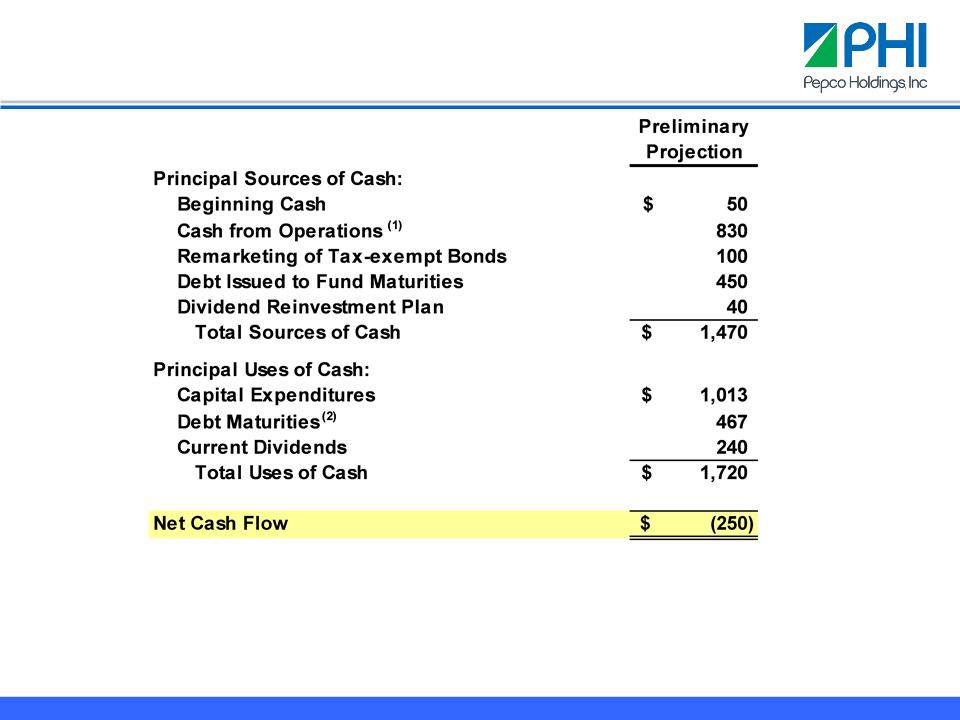
(1) Midpoint
of projected cash from operations range, includes tax refund from NOL carry back
and
assumes the return of cash collateral per the PES retail energy supply backlog schedule. Excludes
any impact from the recent DOE stimulus fund awards.
assumes the return of cash collateral per the PES retail energy supply backlog schedule. Excludes
any impact from the recent DOE stimulus fund awards.
(2) Reflects
Pepco Holdings and Utility debt maturities; excludes debt maturities related to
the Atlantic
City Electric securitization bonds.
City Electric securitization bonds.
Note: See Safe
Harbor Statement at the beginning of today’s presentation.
2010
Principal Sources & Uses of Cash
27

Note: See Safe
Harbor Statement at the beginning of today’s presentation.
2009
• Renewed $400 mm PHI
364-day credit facility in October; new maturity is
October
15, 2010
• Evaluating
pre-funding a portion of the $450 mm PHI debt due May/June 2010
2010
• Evaluation of
capital expenditures continues
– Delay of $400 mm
announced early 2009
– Evaluating
additional delay of 2010 capital expenditures
• Potential
sources
– Stimulus
funds
– Possible
acceleration of PES collateral return
– Small equity
issuance
– Utility debt
issuances
– Sale of selected
assets
– Capacity to fund
with short-term debt
2010
financing is manageable - more specifics to be provided in Q1 -
2010
Financing
and Funding
28
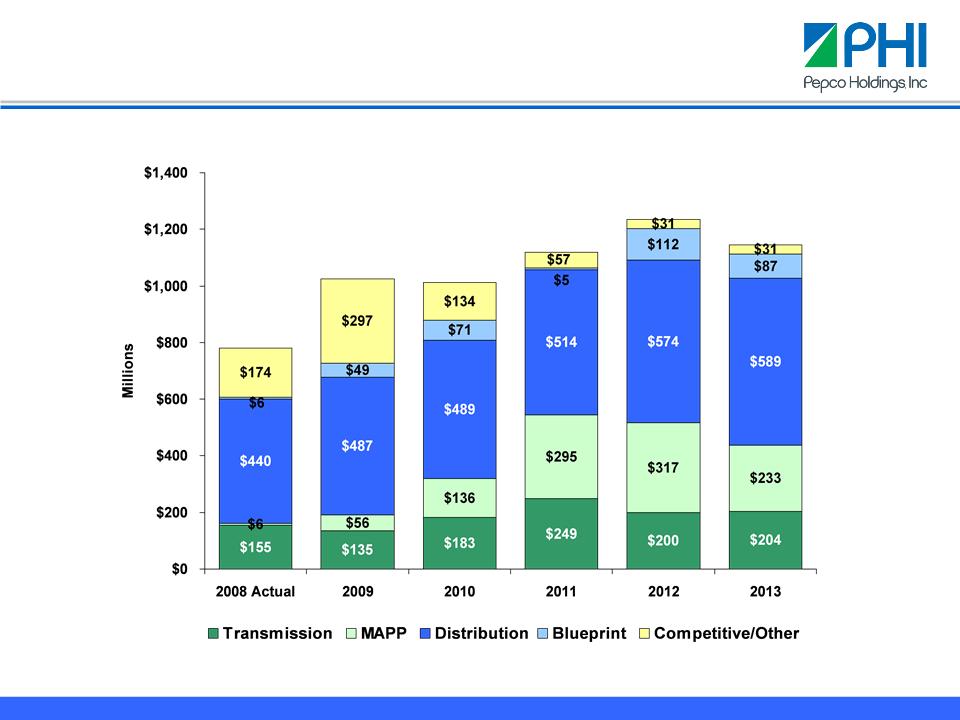
$1,024
$1,013
$1,120
$1,234
$1,144
Construction
Expenditures - Projection
$781
Note: See Safe
Harbor Statement at the beginning of today’s presentation.
29
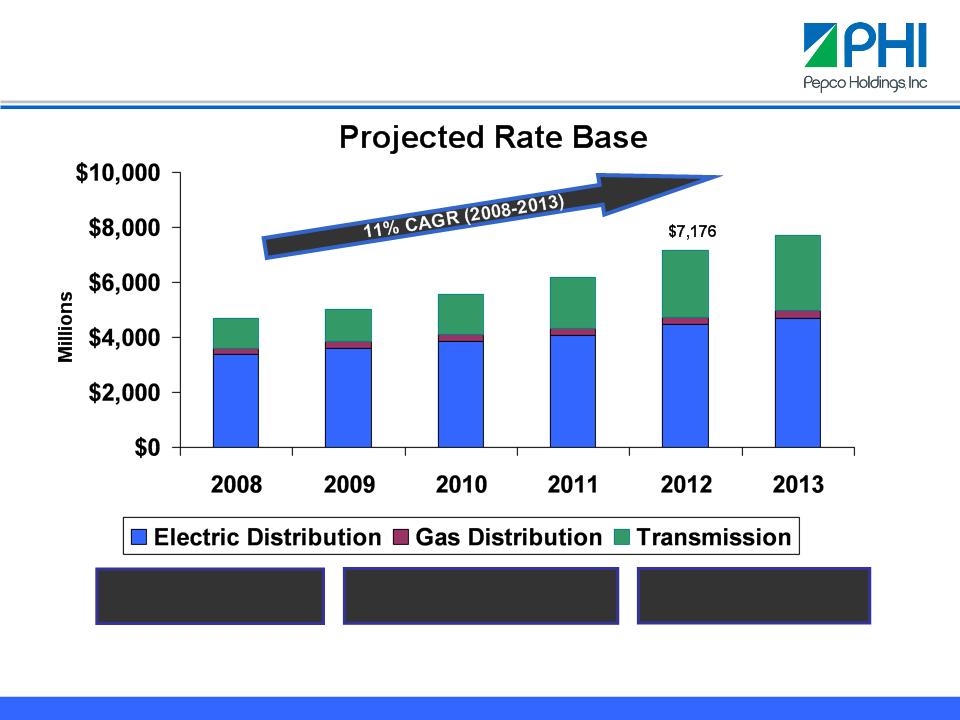
Power
Delivery - A Driver of Growth
Total
Rate Base
Growth - 65%
Growth - 65%
Electric
Distribution Rate
Base Growth - 39%
Base Growth - 39%
Transmission
Rate
Base Growth - 158%
Base Growth - 158%
*
Actual 2008 year end rate base, projected 2009 - 2013 year end rate
bases.
$4,678
$7,712
$5,033
$5,566
$6,192
$3,383
$3,614
$3,854
$4,068
$4,455
$4,708
$231
$233
$243
$250
$259
$263
$1,064
$1,186
$1,469
$1,874
$2,462
$2,741
*
Note: See Safe
Harbor Statement at the beginning of today’s presentation.
30

Cross-Border
Energy Leases - Status
Note: See Safe
Harbor Statement at the beginning of today’s presentation.
• Investment
– Carrying value of
cross-border leases is evaluated each quarter
– Equity investment of
$1.4 billion as of September 30, 2009
• Path
forward
– Concluding the
appeals process with IRS; expect appeals effort to end by year
-end 2009
-end 2009
– Two litigation paths
- pursue in Tax Court or pay the tax and sue for refund in
District Court or Federal Court of Claims; either process could take 18 - 24 mos.
District Court or Federal Court of Claims; either process could take 18 - 24 mos.
• Recent court
decision
– October 21, 2009
U.S. Court of Federal Claims issued a decision in favor of the
taxpayer regarding a lease-in lease-out cross-border lease transaction
taxpayer regarding a lease-in lease-out cross-border lease transaction
– Transaction subject
to the court ruling is similar to PHI’s cross-border energy
lease investments
lease investments
– Currently evaluating
the implications of this decision
31

Potential mitigation
to cash outflow would be the liquidation of the lease portfolio -
PHI could generate sufficient cash proceeds to cover the $695 million of taxes and
interest due within a 6 - 12 month period to satisfy the tax obligation
PHI could generate sufficient cash proceeds to cover the $695 million of taxes and
interest due within a 6 - 12 month period to satisfy the tax obligation
Note: See Safe
Harbor Statement at the beginning of today’s presentation.
Cross-Border
Energy Leases - Alternatives
• Cash payment to the
IRS for a disallowance of tax
benefits would only be required if one of the following
occurs:
benefits would only be required if one of the following
occurs:
– Future settlement
with the IRS
– Litigation is
pursued in District Court or Federal Court of Claims, in which case
a payment would be made currently to the IRS for the 2001 and 2002 tax years
under audit (approximately $72 million plus interest); a suit for refund of the
payment is sought through the litigation process
a payment would be made currently to the IRS for the 2001 and 2002 tax years
under audit (approximately $72 million plus interest); a suit for refund of the
payment is sought through the litigation process
– Litigation is
pursued in Tax Court, and PHI receives an unfavorable decision; in
the worst case of a total disallowance of tax benefits, PHI would be obligated to
pay approximately $595 million of additional taxes and $100 million of interest
at the time a decision is rendered based on September 30, 2009 balances
the worst case of a total disallowance of tax benefits, PHI would be obligated to
pay approximately $595 million of additional taxes and $100 million of interest
at the time a decision is rendered based on September 30, 2009 balances
32

Earnings
Guidance
Note: See Safe
Harbor Statement at the beginning of today’s presentation.
• PHI will begin
providing annual earnings per share
guidance
guidance
• The announcement of
guidance for 2010 is targeted
for the March Analyst Conference
for the March Analyst Conference
33

POM
Investment Case
Note: See Safe
Harbor Statement at the beginning of today’s presentation.
• Long-term earnings
growth
• Commitment to
dividend
• Investment grade
credit quality
• Improved liquidity
position
• Focus on lowering
business risk
34

Appendix
35
Note: See Safe
Harbor Statement at the beginning of today’s presentation.
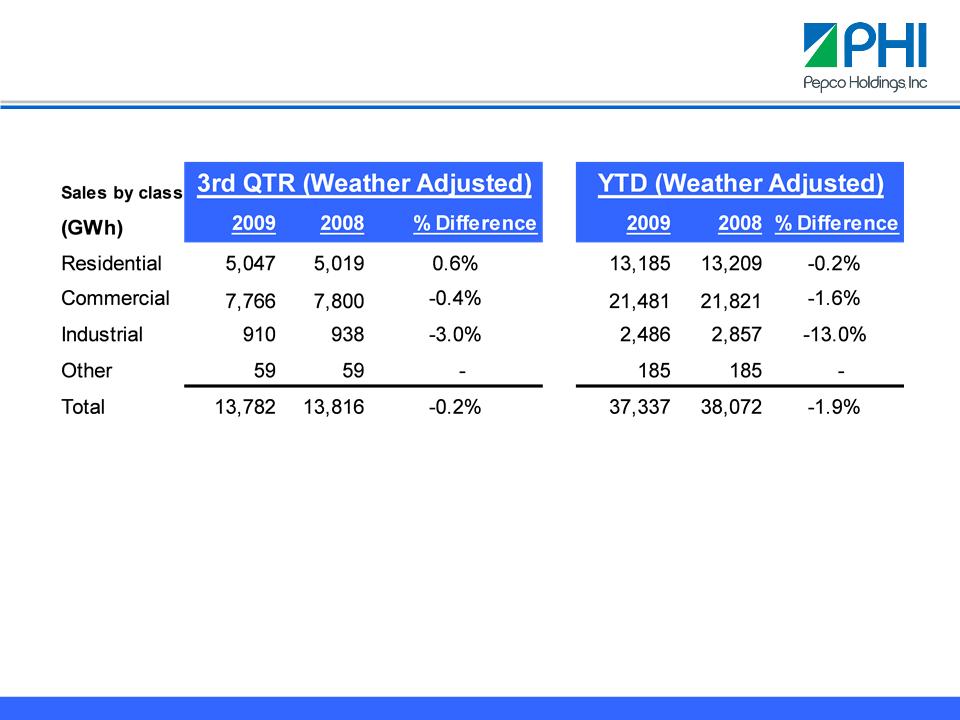
Regulated
T&D Electric Sales
· Although
industrial sales have decreased year-to-date versus last year, the earnings
impact is less
due to smaller margins earned in this class.
due to smaller margins earned in this class.
· 60%
of regulated distribution sales will be decoupled at 11/1/09. By
mid-year 2010, 80% are expected
to be decoupled.
to be decoupled.
· Estimated
2010 weather normalized billed sales are expected to be flat relative to
2009.
· Year-to-date
2009 customer growth is .5% compared to 2008; estimated 2010 customer growth
is
expected to be .6% relative to 2009.
expected to be .6% relative to 2009.
36

* Excludes
special items. See
slide 39 in appendix for reconciliation to GAAP.
Year-to-Date
2009
Financial Performance - Drivers
Financial Performance - Drivers
37
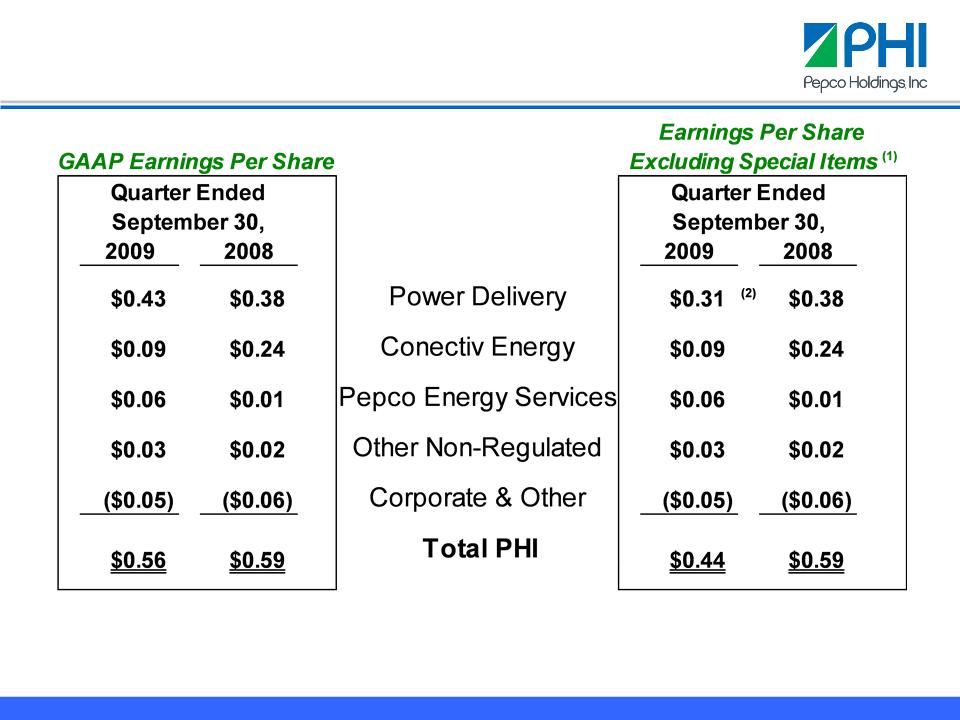
(1) Management
believes the special items are not representative of the Company’s ongoing
business operations.
(2) Excludes
gain from the Mirant bankruptcy settlement $0.07 and MD Income Tax Benefit
$0.05.
Third
Quarter 2009 Financial Performance
38
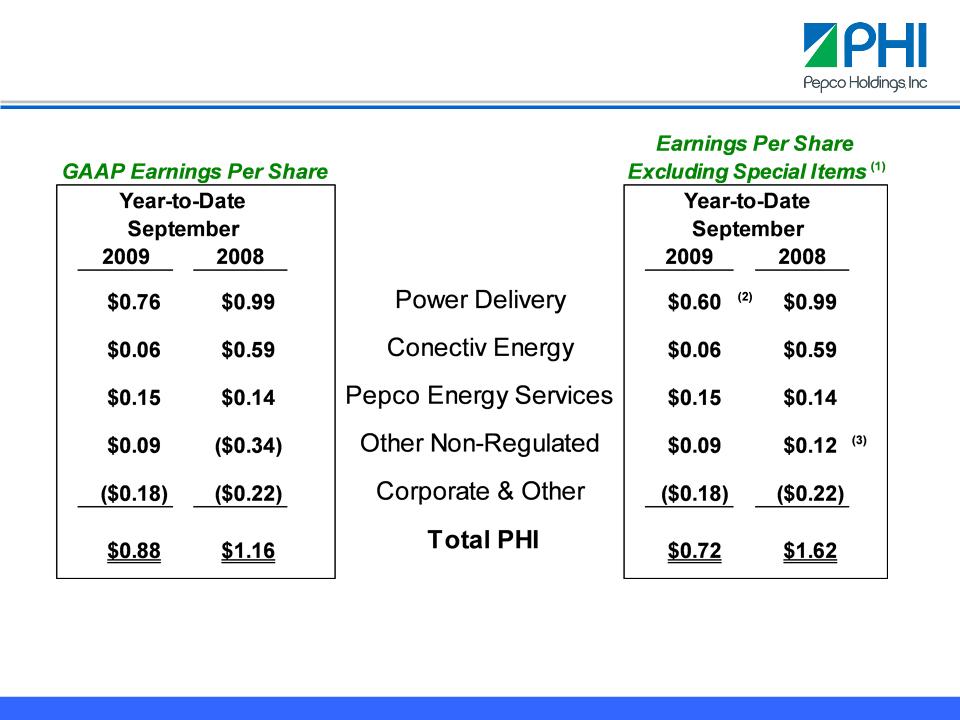
Year-to-Date
2009 Financial Performance
(1) Management
believes the special items are not representative of the Company’s ongoing
business operations.
(2) Excludes
gains from the Mirant bankruptcy settlement $0.11 and MD Income Tax Benefit
$0.05.
(3) Excludes
the adjustment to the equity value of the cross-border energy leases $0.43 and
the interest accrued on
the related income tax obligations of $0.03.
the related income tax obligations of $0.03.
39