Attached files
Table of Contents
UNITED STATES
SECURITIES AND EXCHANGE COMMISSION
WASHINGTON, D.C. 20549
Form 10-K
| x | Annual Report pursuant to Section 13 or 15(d) of the Securities Exchange Act of 1934 |
For the fiscal year ended August 31, 2009
| ¨ | Transition Report pursuant to Section 13 or 15(d) of the Securities Exchange Act of 1934 |
For the transition period from to
Commission File Number: 1-11869
FACTSET RESEARCH SYSTEMS INC.
(Exact name of registrant as specified in its charter)

| Delaware | 13-3362547 | |
| (State or other jurisdiction of incorporation or organization) |
(I.R.S. Employer Identification No.) |
601 Merritt 7 Norwalk, Connecticut 06851
(Address of principal executive office, including zip code)
Registrant’s telephone number, including area code: (203) 810-1000
Securities registered pursuant to Section 12(b) of the Act: Common Stock, par value $0.01 per share
Name of each exchange on which registered: New York Stock Exchange and the NASDAQ Stock Market LLC
Securities registered pursuant to Section 12(g) of the Act: None
Indicate by check mark if the registrant is a well-known seasoned issuer, as defined in Rule 405 of the Securities Act. Yes x No ¨
Indicate by check mark if the registrant is not required to file reports pursuant to Section 13 or Section 15(d) of the Act. Yes ¨ No x
Indicate by check mark whether the registrant (1) has filed all reports required to be filed by Section 13 or 15(d) of the Securities Exchange Act of 1934 during the preceding 12 months (or for such shorter period that the registrant was required to file such reports), and (2) has been subject to such filing requirements for the past 90 days. Yes x No ¨
Indicate by check mark whether the registrant has submitted electronically and posted on its corporate Web site, if any, every Interactive Data File required to be submitted and posted pursuant to Rule 405 of Regulation S-T (§ 232.405 of this chapter) during the preceding 12 months (or for such shorter period that the registrant was required to submit and post such files). Yes ¨ No ¨
Indicate by check mark if disclosure of delinquent filers pursuant to Item 405 of Regulation S-K is not contained herein, and will not be contained, to the best of registrant’s knowledge, in definitive proxy or information statements incorporated by reference in Part III of this Form 10-K or any amendment to this Form 10-K. x
Indicate by check mark whether the registrant is a large accelerated filer, an accelerated filer, a non-accelerated filer or a smaller reporting company. See definition of “large accelerated filer,” “accelerated filer” and “smaller reporting company” in Rule 12b-2 of the Exchange Act.
| Large accelerated filer |
x | Accelerated filer | ¨ | ||||
| Non-Accelerated filer | ¨ (Do not check if a smaller reporting company) | Smaller Reporting Company | ¨ | ||||
Table of Contents
Indicate by check mark whether the registrant is a shell company (as defined in Exchange Act Rule 12b-2). Yes ¨ No x
The aggregate market value of the registrant’s common stock held by non-affiliates of the registrant based upon the closing price of a share of the registrant’s common stock on February 27, 2009, the last business day of the registrant’s most recently completed second fiscal quarter, as reported by the New York Stock Exchange on that date, was $1,643,968,273.
The number of shares outstanding of the registrant’s common stock, as of October 19, 2009, was 47,303,714.
DOCUMENTS INCORPORATED BY REFERENCE
Portions of the registrant’s definitive Proxy Statement dated October 30, 2009, for the Fiscal 2009 Annual Meeting of Stockholders to be held on December 15, 2009, are incorporated by reference into Part III of this Annual Report on Form 10-K where indicated.
Table of Contents
FACTSET RESEARCH SYSTEMS INC.
FORM 10-K
For The Fiscal Year Ended August 31, 2009
3
Table of Contents
Part I
| ITEM 1. | BUSINESS |
Overview
FactSet Research Systems Inc. (the “Company” or “FactSet”) is a leading provider of integrated global financial and economic information, including fundamental financial data on tens of thousands of companies worldwide. FactSet offers access to financial data and analytics to thousands of investment professionals around the world. Combining hundreds of databases into its own dedicated online service, FactSet provides the tools to download, combine, and manipulate financial data for investment analysis. FactSet applications support and make more efficient workflows for buy and sell-side professionals by combining distinctive technology, content, and unmatched service to improve decisions in every part of the investment process. These professionals include portfolio managers, research and performance analysts, risk managers, marketing professionals, sell-side equity research professionals, investment bankers and fixed income professionals. FactSet applications provide users access to company analysis, multicompany comparisons, industry analysis, company screening, portfolio analysis, predictive risk measurements, alphatesting, portfolio optimization and simulation, real-time news and quotes and tools to value and analyze fixed income securities and portfolios. The Company generates 82% of its revenues from investment management clients, while the remaining revenues are primarily derived from investment banking clients.
Focus
FactSet’s business model places a premium on client service. This service ethic combined with its unique blend of technology, content and applications has allowed the Company to achieve record results in many of its key growth metrics. With FactSet, a user is able to gain powerful analytics tailored to their workflow, the broadest scope of data available and access to industry-leading client service.
FactSet focused on the following areas during fiscal 2009:
Investment in Proprietary Content Collection
The Company combines hundreds of commercial databases, including content regarding tens of thousands of companies and securities from major markets across the globe, from industry-leading suppliers and clients’ own proprietary data into a single powerful online platform of information and analytics, making FactSet a one-stop source for financial information. Clients have simultaneous access to content from an array of sources, which they can combine and utilize in FactSet applications. FactSet is also fully integrated with Microsoft Office applications such as Excel®, Word® and PowerPoint® and allows for the creation of extensive custom reports.
Increasingly, FactSet clients have encouraged the Company to expand its core competency. During fiscal 2009, FactSet continued to increase its proprietary content collection efforts in order to meet the needs of its clients. Approximately 45% of FactSet employees are involved in content collection, which includes the build-out of the FactSet Fundamentals operation. All of the Company’s proprietary data sets, across the entire spectrum of content, have been fully integrated into the new FactSet application. With FactSet content, the Company leverages years of experience managing financial data to provide high-quality, global databases for key content categories as well as providing users with the scope and coverage they need for in-depth analysis. FactSet users can easily combine content with any database within FactSet, plus its own proprietary data, in custom charts, graphs and spreadsheet reports.
FactSet Fundamentals – the FactSet Fundamentals database is a preeminent global financial database with coverage of over 50,000 companies. Clients are able to access current, comprehensive and comparative information on securities worldwide with FactSet Fundamentals. The comprehensive coverage available on FactSet Fundamentals includes more than 50,000 companies from over 70 countries, 20 years of historical data and up to 1,600 data elements on each company record. Comprised of annual, interim and quarterly data, detailed historical financial statement content, per share data, calculated ratios, pricing and textual information, FactSet Fundamentals provides FactSet users the information needed for a global investment perspective. Fundamentals is one of three core data sets (along with security prices and estimates) that all major providers require. FactSet now owns all three core content sets, on a global basis.
FactSet Estimates and Research Connect – FactSet has continued to expand its proprietary content through FactSet Estimates and FactSet Research Connect, its repository of sell-side research reports. FactSet Estimates is the Company’s preeminent global broker estimates database that provides its users with insight into an industry where consistency and transparency are at a premium. The FactSet Estimates database covers approximately 24,500 companies globally with 600 contributors providing comprehensive consensus-level estimates and statistics with daily updates and history. FactSet Research Connect makes available hundreds of full text research reports from an estimated 600 contributors. These firms include not only the largest investment banks, but also the leading regional and independent research providers. Continuous updates of premium global estimates, actual data and research reports from leading investment banks and research firms give clients real-time access to the most recent estimates data available.
4
Table of Contents
Proprietary Content Offering Expansion – during fiscal 2009 FactSet successfully launched the following proprietary contents sets, all of which are integrated into the new FactSet workstation:
| • | Debt Capital Structure – a database that provides a standardized breakout of a public or private company’s bank loan and/or corporate bond financing activity at a specific financial reporting point-in-time. |
| • | Global Private Equity & Venture Capital – a complete survey of any substantial Private Equity and Venture Capital firm, including portfolio companies, transactions, and partners. |
| • | FactSet People – a database comprised of more than 500,000 people, including executives of global public and private companies. |
| • | FactSet Market Aggregates – a data set that combines FactSet Fundamentals, FactSet Estimates and FactSet Pricing content to derive key ratios and per share values for global equity market indexes and commercial benchmark vendors, allowing for complex analysis of a company versus a basket of securities. |
FactSet now offers clients a product offering powered by its own proprietary content which can be integrated into the many FactSet applications.
Product Development
Investment in products and applications continued to be a focus for FactSet during fiscal 2009. The Company released numerous enhancements to existing applications and expanded into several new areas as well.
| • | The New FactSet – the release of the Company’s newest financial software platform. The new FactSet consolidates data and analytics, previously spread across multiple applications, onto one comprehensive, intuitive interface. The new FactSet is faster, more intuitive, and easier to customize. New features include the ability to share workspaces with colleagues for improved collaboration and type ahead technology that helps users find securities more quickly. Visually, the platform has been redesigned from top to bottom with a sleek, modern look. An upgrade to the new FactSet will provide users with improved features and functionality within virtually every report and chart on FactSet. |
| • | Real-time News and Quotes – the latest version of the Company’s real-time news and quotes application was released in fiscal 2009 and provides information from more than 140 exchanges and 100 news sources. All new clients receive news and quotes as part of the standard workstation feature set, making the basic FactSet service even more valuable. Usage of the global news and quotes application continues to be strong. Its deployment is expanding with user growth of 27% since the end of fiscal 2008. Users increased every month during fiscal 2009. The application has emerged as a leading driver of new client sales. News and quotes can streamline client daily workflows while optimizing client financial information budgets. Unique within the industry, FactSet’s news and quotes offers the ability to access real-time information integrated with in-depth historical analysis tools on the same technology platform. The combined FactSet desktop also provides clients the ability to share client portfolio holdings automatically. Client portfolios may be made available for detailed study in the portfolio analysis application as well as real-time monitoring in news and quotes including intraday contribution to return. Since real-time offering is relied upon on a daily basis, FactSet believes this statistic indicates that the overall engagement level from existing users is increasing. The fact that real-time users increased during a shrinking environment also leads FactSet to believe the market place recognizes a compelling value proposition of its real-time offering. |
| • | FactSet Wireless Plus 4.2 – released in July 2009 and is now available to clients. FactSet Wireless Plus synchs with users’ real-time news and quote feeds from the FactSet workstation and integrates seamlessly with the new FactSet. FactSet’s wireless capabilities were enhanced to give users access to market, company and portfolio information through Blackberries. FactSet Wireless Plus 4.2 now delivers news, quotes, and customized global market and company intelligence in real-time to users’ handheld devices. |
| • | FactSet Fundamentals Auditing – launched in fiscal 2009. This feature empowers the users to verify the financial data that was used in a given model, and ultimately to verify the data by clicking through to the underlying source document. |
| • | Integration of the DealMaven suite of efficiency tools into the FactSet Microsoft office solution. |
Portfolio Analysis Application Enhancement
FactSet continues to enhance its portfolio analysis application to enable users to analyze fixed income portfolios. Portfolio Analysis and the Company’s suite of quantitative applications continue to make FactSet a market leader for its investment management clients. This suite is comprehensive and includes the applications for portfolio attribution, risk management and quantitative analysis. Portfolio Analysis continued to be the cornerstone of the offering to investment management clients and represents the largest revenue contributing component of the suite. As of August 31, 2009, there were over 647 clients representing approximately 5,640 users who subscribed to this service.
5
Table of Contents
One of the key features of the suite’s central application, Portfolio Analysis, is an attribution analysis report that enables portfolio managers to dissect and explain the performance of a portfolio through time. For many years, FactSet’s primary focus has been equity portfolios – those that are comprised of stock holdings of publicly traded companies. FactSet’s desire to enhance the attribution module to cover virtually all asset classes, including corporate and sovereign debt and sophisticated derivative securities such as mortgage-backed securities and credit default swaps was a major factor in acquiring Derivative Solutions in August 2005. The acquisition has enabled the Company to deliver an enhanced multi-asset class attribution module which creates new markets for its products and a potentially strong competitive advantage in the industry. Fixed income portfolio analysis provides reports and charts that help clients study the performance, composition and characteristics of a fixed income portfolio on an absolute basis or relative to a benchmark. This product is built into the same application foundation as FactSet’s industry-leading equity portfolio analytics capabilities. All the robust reporting and charting features available for equities are also available for fixed income. FactSet has teams of business analysts and software engineers in product development dedicated to the financial information needs of key client user classes, such as portfolio managers, research analysts, and investment bankers. This focus on the information and tasks associated with each user type has translated into the ability to become a critical part of the work day for over tens of thousands of the world’s top financial professionals.
FactSet’s Portfolio Analytics suite was also enhanced through further integration of MSCI Barra’s products, the release of an application to conduct portfolio simulation, new enhancements to its portfolio publishing tools and the release of portfolio dashboard monitoring tools.
Improve the Quality of the FactSet Service
FactSet’s service-oriented culture is a reason why many of the world’s top financial firms deploy its services. The Company offers and delivers on a premium suite of applications and fully integrated content. Its service offerings include twenty-four hour access to well-trained, professional, and motivated FactSet employees. This includes hundreds of employees dedicated to front-line support – answering phone calls, building spreadsheet models and visiting clients, as well as its product development and support teams. Acting as an extension of its clients’ staff is a core value that has allowed FactSet to prosper over the years.
Recruit, develop and retain a talented employee workforce
FactSet’s employee base is comprised of talented people from diverse backgrounds. As of August 31, 2009, the Company employed 2,962 employees, up 53% from a year ago. Of these employees, 1,335 were located in the U.S., 553 in Europe and the remaining 1,074 in Asia. The increase in headcount was driven by the expansion of FactSet’s proprietary content operation including the FactSet Fundamentals collection team. Approximately 45% of the Company’s employees are involved with content collection, 25% conduct sales and consulting services, another 25% are involved in product development, software and systems engineering and the remaining 5% of employees provide administrative support.
FactSet’s endeavors to maintain competitive compensation, benefits, equity participation and work environment policies in order to attract and retain qualified personnel. None of its employees are represented by a labor union. FactSet has not experienced any work stoppages and believes its employee relations are good. In addition, FactSet has been listed as one of Forbes’ “200 Best Small Companies” for 11 consecutive years. FactSet Europe was also named one of UK’s 50 best places to work in fiscal 2009.
FactSet continued to build a talent development team by adding a number of employees to work on its Leadership and Management Development programs during fiscal 2009. The Company has created a leadership development curriculum and has rolled out their first two training courses to several hundred FactSet managers. Feedback from employees has been overwhelmingly positive and the Company looks forward to filling out the curriculum over the next several years. FactSet’s ultimate goal is to have the program provide efficient, relevant, and motivational insights for each stage of an employee’s career – from the individual contributor, who must learn how to manage time and set goals, to the senior manager who must learn how to delegate and think strategically.
Client Support
FactSet differentiates itself from other providers in the care and attention provided to each FactSet user. The Company’s top priority is to ensure that the user always has the most accurate data available and the support it needs to use FactSet most effectively. Whether it is a quick question or step-by-step guidance through a complex task, FactSet consultants will help the client find answers and maximize the value of FactSet. In addition to unlimited access to the global support desk, every FactSet client is assigned a consultant who becomes familiar with the user’s needs and processes. This knowledge enables the consultant to suggest and build innovative, personal solutions. Consultants train users, assist on projects and answer any questions the client may have. Clients routinely report that FactSet support is the most pleasant and thorough they have experienced.
6
Table of Contents
Solutions for Investment Management Professionals
FactSet addresses the challenges unique to investment managers in one integrated platform. With FactSet, a user gains a sophisticated solution customized with the exact data and analytics they need to support their firm’s workflow while reducing training, technology, content, and deployment costs. FactSet is tightly integrated to make research efforts seamless. The comprehensive FactSet platform enables investment managers to manipulate data to an unprecedented degree and to present data in an infinite variety of formats, including customized reports and charts. With FactSet, clients around the globe are able to meet virtually all of their research needs with just a few mouse clicks. The following are some of the key solutions offered to the buy-side professionals through the FactSet platform:
| • | Analyze companies, benchmarks, debt instruments, and economic series |
| • | Perform research with real-time data |
| • | Study portfolio performance for equities and fixed income securities |
| • | Build quant models and calculate risk |
| • | Integrate the client’s own data, such as portfolio holdings and research notes |
| • | Create sophisticated reports and presentations |
| • | View event transcripts and corporate event calendars |
Solutions for Investment Banking Professionals
FactSet enables investment banking professionals to gain in-depth company and industry insight with its integrated data and powerful analytical solutions designed specifically for a banker’s workflow. From the beginning of research strategy to the end of the pitch, an investment banking professional will have access to the tools and information they need to identify new opportunities and track the companies and industries that are important to them and their clients. The comprehensive FactSet platform enables investment bankers to manipulate data and to present data in a multitude of formats, including customized reports and charts. With FactSet, clients around the globe are able to meet virtually all of their research needs. The following are some of the key solutions offered sell-side professionals through the FactSet platform:
| • | Track real-time global market performance and the latest headlines |
| • | Research public and private companies on one platform |
| • | Audit global financials to their underlying SEC filings and annual reports |
| • | Manage key relationships and track the people that drive each industry |
| • | Search prospectuses, SEC filings and M&A documents |
| • | Build powerful financial models and presentations |
| • | Access key reports via your wireless handheld device |
Third-Party Data Content
The Company aggregates third-party content from more than 85 data suppliers, 100 news sources and over 140 exchanges. FactSet is the only source that integrates content from premier providers such as Thomson Reuters Inc. (“Thomson”), Standard & Poor’s Financial Services LLC (a subsidiary of The McGraw-Hill Companies, Inc.), FTSE, IDC (Interactive Data Corporation), Dow Jones & Company Inc., Northfield Information Services, Inc., MSCI Barra, APT, Global Insight Inc., Morningstar, Inc., Russell Investments and SIX Telekurs Ltd. FactSet seeks to maintain contractual relationships with a minimum of two content providers for each type of financial data, when possible. Third-party content contracts have varying lengths and often can be terminated on one year’s notice at predefined dates. Third-party content fees are either billed directly to FactSet or to its clients. Content fees billed to the Company may be on a fixed or royalty (per client) basis.
FactSet continues to invest capital to acquire and build proprietary content. Since 2001, the Company has acquired seven content businesses, Thomson Fundamentals (global fundamentals data), LionShares (global equity ownership data), Mergerstat (M&A data), CallStreet (events and transcripts), JCF (earnings and other estimates), TrueCourse (takeover defense intelligence), and Global Filings (equity and fixed income prospectus data). These content sets have been fully integrated into the Company’s product offerings, while at the same time FactSet has continued to invest in the development of third-party data feeds across all content areas.
Client Relationships
As of August 31, 2009, FactSet services over 37,300 users spread across 2,045 clients in 52 countries worldwide. Approximately 68% of fiscal 2009 revenues are from its client base in the U.S., 25% in Europe and the remaining 7% in Asia Pacific. A significant part of the Company’s strategy to maintain long-term client relationships involves both consulting
7
Table of Contents
services and client training. Clients are visited by company personnel for hands on training and service. The Company’s help desk operates around the clock and sales and consulting personnel regularly visit clients to enhance support and the value of FactSet products. The Company strongly encourages its clients to fully utilize its consulting services and online tools for training. FactSet’s consulting and training programs are designed to give clients a comprehensive understanding of the service at no additional charge.
Competition
FactSet competes in the global financial information services industry, which includes both large and well-capitalized companies, as well as smaller, niche firms. International and U.S. competitors include market data suppliers, news and information providers and many of the content providers that supply the Company with financial information included in the FactSet workstation. Competitors and competitive products include online database suppliers and integrators and their applications, such as Thomson, Bloomberg L.P., Standard & Poor’s Financial Services LLC including its Capital IQ product line (a subsidiary of The McGraw-Hill Companies, Inc.), RiskMetrics Group Inc., Dealogic PLC, Bond Edge (owned by Interactive Data Corporation), Yield Book (owned by Citigroup), Polypaths LLC and Wilshire Associates Incorporated. Many of these firms offer products or services which are similar to those sold by the Company.
Recent Market Trends
Since the fall of 2008, dislocation and decreasing confidence in the credit markets have driven global equity indices into decline with increased volatility. The impact has had an impact on the solvency, size and buying power of some of FactSet’s clients and firms face increasing pressure from regulators and investors to provide operational transparency. Despite this challenging climate, FactSet consistently grew quarterly revenues in fiscal 2009 and the Company anticipates continued volatility in the financial markets and turmoil in the credit markets. FactSet believes that these difficult market conditions increase the value of FactSet’s ability to consolidate services for clients, including deploying real-time news and quotes, and may help advance the sales of proprietary content.
Data Centers
FactSet’s business is dependent on its ability to process rapidly and efficiently substantial volumes of data and transactions on its computer-based networks and systems. The Company’s global technology infrastructure supports its operations and is designed to facilitate the reliable and efficient processing and delivery of data and analytics to its clients. FactSet’s data centers contain multiple layers of redundancy to enhance system performance, including maintaining, processing and storing data at multiple data centers. User connections are load balanced between its data centers and, in the event of a site failure, equipment problem or regional disaster, the remaining centers have the capacity to handle the additional load. FactSet continues to be focused on maintaining a global technical infrastructure that allows the Company to support its growing businesses, and provide data and analytics using various delivery methods designed to best meet the needs of its clients worldwide.
The Company deploys 17 Hewlett Packard Integrity mainframe machines in each of its data centers. FactSet has also established a vast private wide area network to provide clients access to the Company’s data centers. The Company’s wide area network provides a high-speed direct link between the client’s local network and the data content and powerful applications found on the Company’s mainframes.
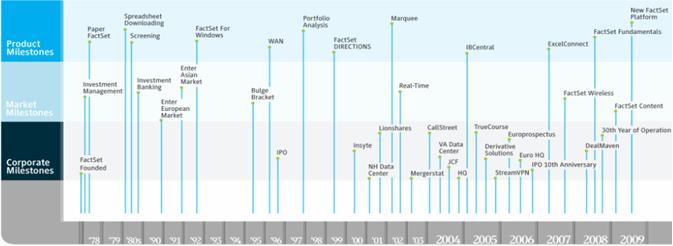
Corporate History
The following chart outlines FactSet’s growth within the financial industry over the past 31 years.
8
Table of Contents
Intellectual Property and other Proprietary Rights
FactSet’s success depends significantly upon its proprietary technology. FactSet has registered trademarks and copyrights for many of its products and services and will continue to evaluate the registration of additional trademarks and copyrights as appropriate. FactSet generally enters into confidentiality agreements with its employees, customers, resellers, vendors and others. The Company seeks to protect its software, documentation and other written materials under trade secret and copyright laws. While FactSet does not believe it is dependent on any one of its intellectual property rights, the Company does rely on the combination of intellectual property rights and other measures to protect its proprietary rights. Despite these efforts, existing intellectual property laws may afford only limited protection.
Financial Information on Geographic Areas
For financial information, including revenues and operating income related to FactSet’s operations in the U.S. and other geographic areas, see Note 15 in the Notes to the Company’s Consolidated Financial Statements included in Item 8 below.
Government Regulation
The Company’s wholly owned subsidiary, FactSet Data Systems, Inc., is a member of the Financial Industry Regulatory Authority, Inc. (“FINRA”) and is a registered broker-dealer under Section 15 of the Securities and Exchange Act of 1934. FactSet Data Systems, Inc., as a registered broker-dealer, is subject to Rule 15c3-1 under the Securities and Exchange Act of 1934, which requires that the Company maintain minimum net capital requirements. The Company claims exemption under Rule 15c3-3(k)(2)(ii). In addition, the Company is subject to reporting requirements, disclosure obligations and other recordkeeping requirements per the Securities and Exchange Commission (“SEC”).
Certification
The Company’s Chief Executive Officer timely submitted his certification on January 12, 2009 to the New York Stock Exchange (“NYSE”) that he was not aware of any violation by the Company of any NYSE corporate governance listing standards as of that date.
Corporate Information, including Internet Address
FactSet was founded as a Delaware corporation in 1978, and its headquarters are in Norwalk, Connecticut. The mailing address of the Company’s headquarters is 601 Merritt 7, Norwalk, Connecticut 06851, and its telephone number at that location is (203) 810-1000. The Company’s website address is www.factset.com.
Available Information
Through a link on the Investor Relations section of its website, the Company makes available the following filings as soon as reasonably practicable after they are electronically filed with, or furnished to, the SEC: the Company’s Annual Report on Form 10-K, Quarterly Reports on Form 10-Q, Current Reports on Form 8-K, and any amendments to those reports filed or furnished pursuant to Section 13(a) or 15(d) of the Securities Exchange Act of 1934, as amended. All such filings are available free of charge. In addition, the Company’s Code of Ethical Conduct for Financial Managers and Code of Business Conduct and Ethics are posted in the Investor Relations section of the Company’s website and the same information is available in print to any stockholder who submits a written request to the Company’s Investor Relations department at its corporate headquarters. Any amendments to or waivers of such code required to be publicly disclosed by the applicable exchange rules or the SEC will be posted on the Company’s website. The charters of each of the committees of the Company’s Board of Directors are available on the Investor Relations section of the Company’s website and the same information is available in print free of charge to any stockholder who submits a written request to the Company’s Investor Relations department at its corporate headquarters.
Executive Officers of the Registrant
The following table shows the Company’s executive officers as of August 31, 2009:
| Name of Officer |
Age | Office Held with the Company |
Officer Since | |||
| Philip A. Hadley |
47 | Chairman of the Board of Directors, Chief Executive Officer | 2000 | |||
| Michael F. DiChristina |
47 | Former President and Chief Operating Officer | 2000 | |||
| Peter G. Walsh |
44 | Executive Vice President, Chief Financial Officer and Treasurer | 2005 | |||
| Michael D. Frankenfield |
44 | Executive Vice President, Director of Global Sales | 2001 | |||
| Kieran M. Kennedy |
44 | Senior Vice President, Director of Investment Banking and Brokerage Services | 2002 |
Philip A. Hadley, Chairman of the Board of Directors, Chief Executive Officer and Director. Mr. Hadley was named Chairman and Chief Executive Officer of FactSet on September 5, 2000. Mr. Hadley joined FactSet in 1985 as a Consultant. From 1986 to 1989, Mr. Hadley was the Company’s Vice President, Sales. From 1989 to 2000, Mr. Hadley was Senior Vice President and Director of Sales and Marketing. Prior to joining the Company, Mr. Hadley was employed by Cargill Corporation. He currently serves as a member of the board of advisors of Kum & Go. Mr. Hadley received a B.B.A. in Accounting from the University of Iowa and has earned the right to use the Chartered Financial Analyst designation and is a member of the CFA Institute.
9
Table of Contents
* Michael F. DiChristina, Former President and Chief Operating Officer. Mr. DiChristina joined FactSet in 1986 as a Software Engineer and held the position of Director of Software Engineering from 1990 to 1999. In 2000, Mr. DiChristina assumed the role of President and Chief Operating Officer, positions he held until stepping down on October 1, 2009. Prior to joining FactSet, Mr. DiChristina was a Software Engineer at Morgan Stanley & Co. Mr. DiChristina received a B.S. in Electrical Engineering from Massachusetts Institute of Technology.
Peter G. Walsh, Executive Vice President, Chief Financial Officer and Treasurer. Mr. Walsh joined the Company in 1996 as Vice President, Planning and Control within the Company’s Finance group. Mr. Walsh held the position of Vice President, Director of Finance from 1999 until 2001. From late 2001 to February 2005, Mr. Walsh occupied the position of Vice President, Regional Sales Manager of the U.S. Southeast Region. On March 1, 2005 he assumed the position of Chief Financial Officer and Treasurer. On October 1, 2009, Mr. Walsh was promoted to his current position as the Company’s Chief Operating Officer. Prior to joining FactSet, Mr. Walsh held several positions at Arthur Anderson & Co. Mr. Walsh received a B.S. in Accounting from Fairfield University. He is a CPA licensed in the state of New York, has earned the right to use the Chartered Financial Analyst designation and is a member of the CFA Institute.
Michael D. Frankenfield, Executive Vice President and Director of Global Sales. Mr. Frankenfield joined the Company in 1989 within the Consulting Services Group. From 1990 to 1994, Mr. Frankenfield held the position of Vice President, Sales. From 1995 to 2000 Mr. Frankenfield was Director of Investment Banking Sales with the Company. From 2000 until 2005, Mr. Frankenfield was Director of Sales and Marketing and from September 2005 until August 2009, he was the Director of Investment Management Services. In August 2009, he was promoted to his current position as Director of Global Sales. Mr. Frankenfield received a B.A. in Economics and International Relations from the University of Pennsylvania and has earned the right to use the Chartered Financial Analyst designation and is a member of the CFA Institute.
Kieran M. Kennedy, Senior Vice President and Director of Investment Banking and Brokerage Services. Mr. Kennedy joined the Company in 1990 within the Consulting Services Group. From 1993 to 1997, Mr. Kennedy held the position of Sales and Consulting Manager for the West Coast. Mr. Kennedy was Director of Consulting from 1997 until he assumed his current position as Director of Investment Banking and Brokerage Services in 2002. Prior to joining FactSet, Mr. Kennedy held a Currency Trading position at Goldman Sachs & Co. Mr. Kennedy received a B.A. in Economics from Syracuse University.
| * | Effective October 1, 2009, Mr. DiChristina stepped down from his position as President and Chief Operating Officer of FactSet. Mr. DiChristina, who has been with FactSet since 1986 and had been in his current role since 1999, will continue to serve on the Company’s Board of Directors. Mr. Walsh, FactSet’s Chief Financial Officer since 2005, was promoted to Chief Operating Officer and Maurizio Nicolelli, the Company’s Comptroller was appointed to Senior Vice President, Director of Finance and Principal Financial Officer, effective October 1, 2009. Mr. Nicolelli joined FactSet in 1996 as the Senior Accountant and held the position of Chief Accountant from 1999 to 2001. Since 2002, he has been a Vice President and Comptroller of the Company. Prior to joining FactSet, he was employed at PricewaterhouseCoopers LLP. He holds a B.S. degree in Political Science from Syracuse University and an M.B.A. degree in Accounting from St. John’s University. Mr. Nicolelli is a CPA licensed in the state of New York. |
Additional Information
Additional information with respect to the Company’s business is included in the following pages and is incorporated herein by reference:
10
Table of Contents
| ITEM 1A. | RISK FACTORS |
Set forth below and elsewhere in this report and in other documents FactSet files with the SEC are risks and uncertainties that could cause actual results to differ materially from those expressed by the forward-looking statements contained in this report. Investors should carefully consider the risks described below before making an investment decision. In assessing these risks, investors should also refer to the other information contained or incorporated by reference in this Annual Report on Form 10-K filed with the SEC, including the Company’s consolidated financial statements and related notes thereto.
FactSet’s operating results are subject to quarterly and annual fluctuations as a result of numerous factors. As a consequence, operating results for a particular future period are difficult to predict, and, therefore, prior results are not necessarily indicative of results to be expected in future periods. Any of the following factors, or any other factors discussed elsewhere herein, could have a material adverse effect on the Company’s business, results of operations, and financial condition that could adversely affect its stock price.
Risk factors which could cause future financial performance to differ materially from the expectations as expressed in any of FactSet’s forward-looking statements made by or on the Company’s behalf include, without limitation:
A prolonged decline in equity returns impacting the buying power of FactSet’s investment management clients
Since September 1, 2008, major equity indices (e.g., Dow Jones Industrials, Russell 1000, MSCI EAFE, S&P 500 and NASDAQ Composite) have experienced declines greater than 15% coupled with increased levels of volatility. A prolonged decline in the equity markets could impact the size and buying power of many of FactSet’s clients.
FactSet derives 82% of its revenues from investment management clients. The prosperity of these clients is tied to equity assets under management (“AUM”). An equity market decline not only depresses AUM but could cause a significant increase in redemption requests to move money out of equities and into other asset classes. Moreover, extended declines in the equity markets may reduce new fund or client creation resulting in lower demand for services from investment managers.
While increased use of FactSet services among hedge funds is not a significant driver of recent revenue growth, the Company does have more hedge fund clients today than three years ago. A decline in the equity markets could increase the normal rate of hedge fund closures and increase asset redemption rates in the near term. Many hedge funds rely on performance fees and utilize leverage. In addition, the rate of closure related to small hedge funds may increase if they were relying on performance fees to cover operating costs.
Historically, the correlation between the results of FactSet’s operations and the performance of the global equity markets has not been one to one. Today, the Company believes that its market opportunity may be 10 times its current size even if the global equity markets, which FactSet services, shrink by 15%. Difficult market conditions may increase the value of FactSet’s ability to consolidate services for clients, including deploying real-time news and quotes, and may help advance the sales of proprietary content.
Continued turmoil, consolidation, and business failures in the global investment banking industry may cause us to lose additional clients and users
The global investment banking industry has been experiencing turmoil, consolidation and business failures over the past two years. The turmoil, consolidation and business failures have resulted and are expected to continue to result, in a reduction in the number of users and prospective clients from the investment banking sector. FactSet’s sell-side clients account for approximately 18% of its revenues. A significant portion of these revenues relate to services deployed by large, bulge bracket banks. The credit crisis that began in August 2007 continues to impact many of the large banking clients due to the amount of leverage deployed in past operations. Clients such as Bear Stearns, Lehman Brothers, Merrill Lynch and Wachovia were purchased by other firms as their viability as stand-alone entities came into question. More of the Company’s clients could encounter similar problems. The recent lack of confidence in the global banking system caused declines in merger and acquisitions funded by debt. Additional turmoil, consolidation and business failures in the global investment banking sector could adversely affect FactSet’s financial results and future growth.
FactSet services equity research and M&A departments. These are low risk businesses that do not deploy leverage and will likely continue to operate far into the future and should represent a larger percentage of the overall revenues of its clients. Regardless, the size of banks in general is shrinking as they deleverage their balance sheets and adjust their expense bases to future revenue opportunities. The Company’s revenues may decline if banks including those involved in recent merger activity significantly reduce headcount in the areas of corporate M&A and equity research to compensate for the issues created by other departments.
11
Table of Contents
A global market crisis and related economic recession may affect FactSet’s revenues and liquidity
Current global economic and financial market conditions, and the potential for a significant and prolonged global economic recession, could adversely affect FactSet’s business, results of operations, financial condition and liquidity. These conditions also could materially impact clients, including large accounts, causing them to go out of business entirely; defer, reduce, or not increase the volume of the subscriptions they purchase from FactSet in the future; or terminate existing relationships. Changes of this type could significantly affect FactSet’s business and liquidity or could have a material adverse effect on its results of operations and financial condition. If FactSet is unable to successfully anticipate changing economic and financial markets conditions, the Company may be unable to effectively plan for and respond to those changes, and its business could be adversely affected. In addition, the current global economic conditions could reduce the overall demand for integrated financial information as global companies consolidate purchasing, downsize departmental budgets and reduce company-wide discretionary spending.
Increased competition in FactSet’s industry that may cause price reductions or loss of market share
FactSet continues to experience intense competition across all markets for its products. Its competitors range in size from multi-billion dollar companies to small, single-product businesses that are highly specialized. While the Company believes the breadth and depth of its suite of products and applications offer benefits to its clients that are a competitive advantage, its competitors are likely to offer price incentives to acquire new business. These competitive pricing pressures may result in decreased sales volumes and price reductions, resulting in lower revenues. Weak economic conditions can also result in clients’ seeking to utilize lower-cost information that is available from alternative sources.
The impact of cost-cutting pressures across the industries FactSet serves could lower demand for its services. In fiscal 2009, FactSet saw clients intensify their focus on containing or reducing costs as a result of the more challenging market conditions. Clients within the financial services industry that strive to reduce their operating costs may seek to reduce their spending on financial market data and related services. If clients elect to reduce their spending with FactSet, the Company’s results of operations could be materially adversely affected. Alternatively, clients may use other strategies to reduce their overall spending on financial market data services by consolidating their spending with fewer vendors, by selecting vendors with lower-cost offerings or by self-sourcing their need for financial market data. If clients elect to consolidate their spending on financial market data services with other vendors and not FactSet, the Company’s results of operations could be materially adversely affected.
FactSet must continue to introduce new products and product enhancements to maintain its leading technological position
The market for the Company’s products is characterized by rapid technological change, changes in client demands and evolving industry standards. New products based on new technologies or new industry standards can render existing products obsolete and unmarketable. As a result, the Company’s future success will continue to depend upon its ability to develop new products and product enhancements that address the future needs of its target markets and to respond to their changing standards and practices. FactSet may not be successful in developing, introducing, marketing and licensing the Company’s new products and product enhancements on a timely and cost effective basis, or at all, and the Company’s new products and product enhancements may not adequately meet the requirements of the marketplace or achieve market acceptance. In addition, clients may delay purchases in anticipation of new products or product enhancements.
FactSet must ensure the protection and privacy of client data
Many of FactSet’s products and services, as well as its internal systems and processes, involve the storage and transmission of proprietary information and sensitive or confidential data, including client portfolios. FactSet relies on a complex network of internal controls to protect the privacy of client data. If FactSet fails to maintain the adequacy of its internal controls, including any failure to implement required new or improved controls, or if FactSet experiences difficulties in their implementation, misappropriation of client data by an employee or an external third party could occur, which could damage the Company’s reputation and ultimately its business. Breaches of the Company’s security measures could expose FactSet, its customers or the individuals affected to a risk of loss or misuse of this information, potentially resulting in litigation and liability for the Company, as well as the loss of existing or potential customers and damage to the company’s brand and reputation.
A prolonged or recurring outage at one of FactSet’s data centers could result in reduced service and the loss of clients
FactSet’s clients rely on the Company for the delivery of time-sensitive, up-to-date data. FactSet’s business is dependent on its ability to rapidly and efficiently process substantial volumes of data and transactions on its computer-based networks and systems. The Company’s computer operations and those of its suppliers and clients are vulnerable to interruption by fire, natural disaster, power loss, telecommunications failures, terrorist attacks, acts of war, internet failures, computer viruses and other events beyond the Company’s reasonable control. FactSet maintains back-up facilities for each of its major data centers to seek to minimize the risk that any such event will disrupt operations. In addition, FactSet maintains insurance for some such events. However, the insurance FactSet carries is likely not to be sufficient to compensate the Company fully for losses
12
Table of Contents
or damages that may occur as a result of such material events. In addition, a loss of the Company’s services may induce its clients to seek alternative data suppliers. Any such losses or damages incurred by FactSet could have a material adverse effect on its business. Although the Company seeks to minimize these risks through security measures, controls and back-up data centers, there can be no assurance that such efforts will be successful or effective.
Malicious, ignorant or illegal employee acts regarding insider information
If FactSet fails to maintain the adequacy of its internal controls, including any failure to implement required new or improved controls surrounding insider information, or if FactSet experiences difficulties in their implementation, misappropriation of insider information by an employee, which could damage the Company’s reputation and ultimately its business. Breaches of the Company’s insider information could expose FactSet, its customers or the individuals affected to a risk of loss or misuse of this information, potentially resulting in litigation and liability for the Company, as well as the loss of existing or potential clients and damage to the Company’s brand and reputation.
Man-made problems such as computer viruses or terrorism may disrupt FactSet’s operations
Despite FactSet’s implementation of network security measures, its servers are vulnerable to computer viruses, break-ins, and similar disruptions from unauthorized tampering with the Company’s computer systems. Any such event could have a material adverse effect on FactSet’s business, operating results and financial condition. Efforts to limit the ability of malicious third parties to disrupt the operations of the Internet or undermine the Company’s own security efforts may meet with resistance. In addition, the continued threat of terrorism and heightened security and military action in response to this threat, or any future acts of terrorism, may cause further disruptions to the economies of the U.S. and other countries and create further uncertainties or otherwise materially harm FactSet’s business, operating results and financial condition. Likewise, events such as widespread blackouts could have similar negative impacts. To the extent that such disruptions or uncertainties result in delays or cancellations by clients, FactSet’s business, operating results and financial condition could be materially and adversely affected.
FactSet’s ability to integrate and market FactSet Fundamentals as a high quality asset and win new clients
FactSet Fundamentals is projected to be accretive to earnings per share in fiscal 2010. In order to ensure accuracy of these estimates, FactSet must build on a content collection operation to populate the FactSet Fundamentals database. This complex process involves hiring, training and retaining hundreds of employees and successfully deploying collection software and processes. In addition, FactSet must be able to market and sell FactSet Fundamentals to new and existing clients.
FactSet’s ability to integrate newly acquired companies
FactSet has made and expects to continue to make acquisitions from time to time. Acquisitions present significant challenges and risks relating to the integration of the business into FactSet’s operations, and there can be no assurances that FactSet will manage acquisitions successfully. The related risks include the Company failing to achieve strategic objectives and anticipated revenue improvements as well as the failure to retain key personnel of the acquired business and the assumption of liabilities related to litigation or other legal proceedings involving the acquired business.
Under generally accepted accounting principles, FactSet reviews its amortizable intangible assets for impairment when events or changes in circumstances indicate the carrying value may not be recoverable. Goodwill is required to be tested for impairment at least annually. Factors that may be considered a change in circumstances indicating that the carrying value of its goodwill or amortizable intangible assets may not be recoverable include a decline in stock price, market capitalization, future cash flows and slower growth rates in its industry. FactSet may be required to record a charge to earnings in its financial statements during the period in which any impairment of its goodwill or amortizable intangible assets is determined resulting in an impact on its results of operations.
The negotiation of contract terms supporting new and existing databases or products
As a leading provider of global financial and economic information, FactSet relies on its ability to combine hundreds of commercial databases into its own dedicated online service. FactSet’s business employs a wide variety of data from a substantial number of data suppliers around the world. Certain FactSet databases rely on a limited number of suppliers, although FactSet makes every effort to assure that alternative sources are available. The failure of its suppliers to deliver accurate data and in a timely manner could adversely affect the Company’s business.
Exposure to fluctuations in currency exchange rates that could negatively impact financial results and cash flows
The Company faces exposure to adverse movements in foreign currency exchange rates because 55% of FactSet’s employees and over 36% of its leased office space are located outside the U.S. These exposures may change over time as business practices evolve, and they could have a material adverse impact on the Company’s financial results and cash flows. The Company’s primary exposures relate to non-U.S. dollar denominated revenues and expenses in Europe, Japan and India. This exposure has increased during fiscal 2009 as compared to the year ago period primarily because the percentage of FactSet revenues invoiced and paid in non-U.S. dollars has decreased. A decrease in the value of the U.S. dollar increases operating expenses. From time to time, FactSet enters into foreign exchange forward contracts to reduce the short-term impact of foreign currency fluctuations. FactSet’s attempt to hedge against these risks may not be successful, resulting in an adverse impact on the Company’s results of operations.
13
Table of Contents
Third parties may claim FactSet infringes upon their intellectual property rights
FactSet may receive notice from others claiming that the Company has infringed upon their intellectual property rights. Responding to these claims may require the Company to enter into royalty and licensing agreements on less favorable terms, enter into settlements, require FactSet to stop selling or to redesign affected products, or to pay damages or to satisfy indemnification commitments with the Company’s clients including contractual provisions under various license arrangements. If FactSet is required to enter into such agreements or take such actions, its operating margins may decline as a result. FactSet has made and expects to continue making significant expenditures to acquire the use of technology and intellectual property rights as part of its strategy to manage this risk.
FactSet defends its intellectual property rights and combats unlicensed copying and use of software and intellectual property rights through a variety of techniques. Preventing unauthorized use or infringement of its rights is difficult. While these activities adversely affect U.S. revenues, the impact on revenues from outside the U.S. could be more significant, particularly in countries where laws are less protective of intellectual property rights.
Unauthorized parties may attempt to copy aspects of FactSet’s products or to obtain and use information that the Company regards as proprietary
FactSet’s success depends significantly upon its proprietary technology. FactSet has registered trademarks and copyrights for many of its products and services and will continue to evaluate the registration of additional trademarks and copyrights as appropriate. FactSet generally enters into confidentiality agreements with its employees, customers, resellers, vendors and others. The Company seeks to protect its software, documentation and other written materials under trade secret and copyright laws. While FactSet does not believe it is dependent on any one of its intellectual property rights, the Company does rely on the combination of intellectual property rights and other measures to protect its proprietary rights. Despite these efforts, existing intellectual property laws may afford only limited protection. In addition, it may be possible for unauthorized third parties to copy certain portions of FactSet content or to reverse engineer or otherwise obtain and use its proprietary information. In addition, FactSet cannot be certain that others will not develop or acquire substantially equivalent or superseding proprietary technology, or that equivalent or better products will not be marketed in competition with its services, thereby substantially reducing the value of its proprietary rights. Despite the Company’s efforts to protect its proprietary rights, unauthorized parties may attempt to copy aspects of its products or to obtain and use information that FactSet regards as proprietary. In addition, the laws of some foreign countries do not protect proprietary rights to as great an extent as do the laws in the U.S. Litigation may be necessary to protect the Company’s proprietary technology which may be time-consuming and expensive, with no assurance of success.
Volatility in general economic conditions
Future results could be materially adversely affected by a variety of uncontrollable and changing factors, including, among others, foreign currency exchange rates; interest rate increases; inflationary pressures or volatile energy prices; political or social unrest; terrorist attacks; economic instability or natural disasters in a specific country or region; environmental and trade protection measures; political considerations that affect data and service providers and government spending patterns; health or similar issues, such as pandemic or epidemic (including the H1N1 virus outbreak); difficulties in staffing and managing international operations; and adverse tax consequences, including imposition of withholding or other taxes on payments by subsidiaries. FactSet believes that demand for its solutions could be disproportionately affected by fluctuations, disruptions, instability or downturns in the economy, which may cause clients and potential clients to exit the industry or delay, cancel or reduce any planned expenditures. Any or all of these factors could have a material adverse impact on the Company’s revenues, expenses and financial condition.
FactSet must hire and retain key qualified personnel
FactSet’s business is based on successfully attracting and retaining talented employees. Competition for technical personnel in the industry in which the Company competes is strong. The Company is limited in its ability to recruit internationally by restrictive domestic immigration laws. If the Company is less successful in its recruiting efforts, or if it is unable to retain key employees, its ability to develop and deliver successful products and services may be adversely affected. FactSet needs technical resources such as product development engineers to develop new products and enhance existing products. The Company relies upon sales personnel to sell its products and services and maintain healthy business relationships.
Resolution of ongoing and other probable audits by tax authorities
FactSet is subject to income taxes in both the U.S. and numerous foreign jurisdictions. Significant judgment is required in determining its worldwide provision for income taxes. In the ordinary course of its business, there are many transactions and calculations where the ultimate tax determination is uncertain. The Company’s provision for income taxes, tax liability or effective tax rates in the future could be adversely affected by numerous factors including, but not limited to, income before
14
Table of Contents
taxes being lower than anticipated in countries with lower statutory tax rates and higher than anticipated in countries with higher statutory tax rates, changes in the valuation of deferred tax assets and liabilities and changes in tax laws, regulations, accounting principles or interpretations thereof. FactSet is subject to the continuous examination of its income tax returns by the Internal Revenue Service and other tax authorities. Although FactSet believes its tax estimates are reasonable, the final determination of tax audits and any related litigation could be materially different than that which is reflected in historical income tax provisions and accruals. There can be no assurance that the outcomes from these continuous examinations will not have an adverse effect on its provision for income taxes and tax liability. Based on the results of an audit or litigation, a material effect on its income tax provision, net income, or cash flows in the period or periods for which that determination is made could result.
Adverse resolution of litigation or governmental investigations may harm FactSet’s operating results
FactSet is party to lawsuits in the normal course of its business. Litigation can be expensive, lengthy, and disruptive to normal business operations. Moreover, the results of complex legal proceedings are difficult to predict. Unfavorable resolution of lawsuits or governmental investigations could have a material adverse effect on the Company’s business, operating results or financial condition. For additional information regarding certain matters in which FactSet is involved, see Item 3, Legal Proceedings, contained in Part I of this report.
Changes in accounting may affect FactSet’s reported earnings and operating income
Generally accepted accounting principles and accompanying accounting pronouncements, implementation guidelines and interpretations for many aspects of its business are highly complex and involve subjective judgments. Changes in accounting rules, their interpretation, or changes in the Company’s products or business could significantly change its reported earnings and operating income and could add significant volatility to those measures, without a comparable underlying change in cash flows from operations.
In connection with the preparation of the Consolidated Financial Statements, FactSet uses certain estimates and assumptions, which are based on historical experience and management’s knowledge of current events and actions that FactSet may undertake in the future. Significant estimates have been made in areas that include income and other taxes, useful lives of fixed assets and intangibles, accrued liabilities, accrued compensation, stock-based compensation, receivable reserves, contingent liabilities and allocation of purchase price to assets and liabilities acquired. In addition, FactSet makes certain estimates under Statement of Financial Accounting Standards (“SFAS”) 5, Accounting for Contingencies, including decisions related to legal proceedings and reserves. While management believes that these estimates and assumptions are reasonable under the circumstances, by definition they involve the use of judgment and the exercise of discretion, and therefore actual results may differ.
Internal controls may be ineffective
Effective internal controls are necessary to provide reasonable assurance with respect to its financial reports and to effectively prevent fraud. Pursuant to the Sarbanes-Oxley Act of 2002, FactSet is required to furnish a report by management on internal control over financial reporting, including management’s assessment of the effectiveness of such control. Internal control over financial reporting may not prevent or detect misstatements because of its inherent limitations, including the possibility of human error, the circumvention or overriding of controls or fraud. Therefore, even effective internal controls can provide only reasonable assurance with respect to the preparation and fair presentation of financial statements. In addition, projections of any evaluation of effectiveness of internal control over financial reporting to future periods are subject to the risk that the control may become inadequate because of changes in conditions, or that the degree of compliance with the policies or procedures may deteriorate. If FactSet fails to maintain the adequacy of its internal controls, including any failure to implement required new or improved controls, or if FactSet experiences difficulties in its implementation, its business and operating results could be adversely impacted.
15
Table of Contents
| ITEM 1B. | UNRESOLVED STAFF COMMENTS |
None.
| ITEM 2. | PROPERTIES |
At August 31, 2009, the Company leases approximately 169,000 square feet of office space at its headquarters in Norwalk, Connecticut. In addition, FactSet leases office space in the U.S. in New York, New York; Boston, Massachusetts; Chicago, Illinois; Manchester, New Hampshire; Reston, Virginia; Austin, Texas; San Mateo and Santa Monica, California; Newark, New Jersey; and Tuscaloosa, Alabama. Outside the U.S., the Company’s operations are conducted in leased office space in London, England; Paris and Avon, France; Amsterdam, the Netherlands; Frankfurt, Germany; Milan, Italy; Tokyo, Japan; Hong Kong; Hyderabad and Mumbai, India; Sydney, Australia; and Metro Manila, the Philippines. The leases expire on various dates through March 2021. Total minimum rental payments associated with the leases are recorded as rent (a component of selling, general and administrative expenses) on a straight-line basis over the periods of the respective non-cancelable lease terms. The Company believes that its facilities are adequate for its current needs and that additional facilities are available for lease to meet any future needs.
During fiscal 2009, the Company entered into new lease agreements in the ordinary course of business to support operations in New York, Hong Kong, Hyderabad and Manila. The new office space expanded existing locations by 83,000 square feet and increased total leased office space by 16%. The additional office space is necessary to support the Company’s employee base that grew at 53% over the last twelve months. The new space in Hyderabad and Manila was driven by the growth of the FactSet proprietary content collection operation.
At August 31, 2009, the Company’s lease commitments for office space provide for the following future minimum rental payments under non-cancelable operating leases with remaining terms in excess of one year (in thousands):
| Years Ended August 31, |
Minimum Lease Payments | ||
| 2010 |
$ | 20,778 | |
| 2011 |
21,061 | ||
| 2012 |
19,527 | ||
| 2013 |
18,611 | ||
| 2014 |
14,856 | ||
| Thereafter |
57,669 | ||
| Total |
$ | 152,502 | |
| ITEM 3. | LEGAL PROCEEDINGS |
FactSet is subject to legal proceedings, claims and litigation arising in the ordinary course of business. Although FactSet’s management currently believes that resolving claims against the Company, individually or in the aggregate, will not have a material adverse impact on its consolidated financial position, its results of operations or its cash flows, these matters are subject to inherent uncertainties and management’s view of these matters may change in the future.
| ITEM 4. | SUBMISSION OF MATTERS TO A VOTE OF SECURITY HOLDERS |
None.
16
Table of Contents
Part II
| ITEM 5. | MARKET FOR REGISTRANT’S COMMON EQUITY, RELATED STOCKHOLDER MATTERS AND ISSUER PURCHASES OF EQUITY SECURITIES |
(a) Market Information
FactSet common stock is listed on the New York Stock Exchange and the NASDAQ Stock Market under the symbol “FDS.” The following table sets forth the range of high and low per share sales prices as reported for each fiscal period indicated and reflects all stock splits effected for the Company’s common stock as reported by the New York Stock Exchange:
| FIRST | SECOND | THIRD | FOURTH | |||||||||
| 2009 |
||||||||||||
| High |
$ | 65.00 | $ | 48.75 | $ | 56.52 | $ | 57.34 | ||||
| Low |
$ | 31.15 | $ | 33.51 | $ | 35.56 | $ | 47.36 | ||||
| 2008 |
||||||||||||
| High |
$ | 73.99 | $ | 66.88 | $ | 65.20 | $ | 67.96 | ||||
| Low |
$ | 55.92 | $ | 50.00 | $ | 43.04 | $ | 52.75 | ||||
(b) Holders
As of October 19, 2009, there were approximately 59,815 holders of record of FactSet common stock. However, because many of FactSet’s shares of common stock are held by brokers and other institutions on behalf of stockholders, FactSet is unable to estimate the total number of stockholders represented by these record holders. The closing price of FactSet’s common stock on October 19, 2009 was $66.44 per share as reported by the New York Stock Exchange.
(c) Dividends
In fiscal 2009, the Company’s Board of Directors declared the following dividends:
| Declaration Date |
Dividends Per Share of Common Stock |
Type | Record Date | Total Amount (in thousands) |
Payment Date | |||||||
| November 17, 2008 |
$ | 0.18 | Regular (cash) | November 28, 2008 | $ | 8,480 | December 16, 2008 | |||||
| February 4, 2009 |
$ | 0.18 | Regular (cash) | February 27, 2009 | $ | 8,447 | March 17, 2009 | |||||
| May 12, 2009 (1) |
$ | 0.20 | Regular (cash) | May 29, 2009 | $ | 9,430 | June 16, 2009 | |||||
| August 13, 2009 |
$ | 0.20 | Regular (cash) | August 31, 2009 | $ | 9,348 | September 15, 2009 | |||||
| Total |
$ | 0.76 | ||||||||||
| (1) | On May 12, 2009, the Company’s Board of Directors approved an 11% increase in the regular quarterly dividend, beginning with the Company’s dividend payment in June 2009 of $0.20 per share, or $0.80 per share per annum. The cash dividend of $9.4 million was paid on June 16, 2009, to common stockholders of record as of May 29, 2009. |
All of the above cash dividends have been paid from existing cash resources. Future dividend payments will depend on the Company’s earnings, capital requirements, financial condition and other factors considered relevant by the Company and is subject to final determination by the Company’s Board of Directors.
(d) Purchases of Equity Securities by the Issuer
The following table provides a month-to-month summary of the share repurchase activity under the current stock repurchase program during the three months ended August 31, 2009:
| Period |
Total number of shares purchased |
Average price paid per share |
Total number of shares purchased as part of publicly announced plans or programs |
Maximum number of shares (or approximate dollar value) of shares that may yet be purchased under the plans or programs (in thousands) (1) | ||||||
| June 2009 |
— | — | — | $ | 134,421 | |||||
| July 2009 |
144,000 | $ | 54.79 | 144,000 | $ | 126,531 | ||||
| August 2009 |
450,600 | $ | 55.17 | 450,600 | $ | 101,669 | ||||
| 594,600 | $ | 55.08 | 594,600 | $ | 101,669 | |||||
| (1) | On March 16, 2009, the Company’s Board of Directors approved a $100 million expansion to the existing share repurchase program. Repurchases will be made from time to time in the open market and privately negotiated transactions, subject to market conditions. No minimum number of shares to be repurchased has been fixed. There is no timeframe to complete the repurchase program and it is expected that share repurchases will be paid using existing and future cash generated by operations. |
17
Table of Contents
Securities Authorized for Issuance under Equity Compensation Plans
Information regarding securities authorized for issuance under equity compensation plans is incorporated by reference from the Company’s Proxy Statement to be filed for its Fiscal 2009 Annual Meeting of Stockholders.
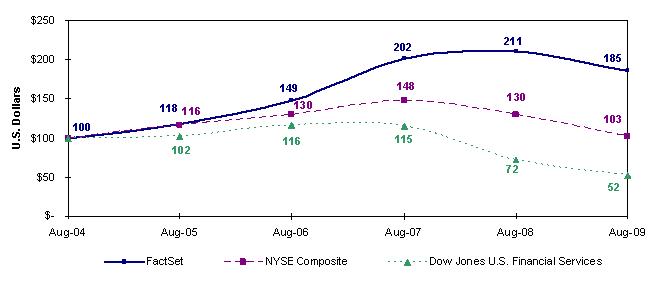
(e) Five-year financial performance graph
The annual changes for the five-year period shown in the graph on this page are based on the assumption that $100 had been invested in FactSet common stock, the NYSE Composite Index and the Dow Jones U.S. Financial Services Index on August 31, 2004, and that all quarterly dividends were reinvested at the average of the closing stock prices at the beginning and end of the quarter. The total cumulative dollar returns shown on the graph represent the value that such investments would have had on August 31, 2009.
| For the Years Ended August 31, | ||||||||||||||||||
| 2009 | 2008 | 2007 | 2006 | 2005 | 2004 | |||||||||||||
| FactSet Research Systems Inc. |
$ | 185 | $ | 211 | $ | 202 | $ | 149 | $ | 118 | $ | 100 | ||||||
| NYSE Composite Index |
$ | 103 | $ | 130 | $ | 148 | $ | 130 | $ | 116 | $ | 100 | ||||||
| Dow Jones U.S. Financial Services Index |
$ | 52 | $ | 72 | $ | 115 | $ | 116 | $ | 102 | $ | 100 | ||||||
| (1) | The Stock Performance Graph is not “soliciting material,” is not deemed filed with the SEC and is not deemed to be incorporated by reference by any general statement incorporating by reference this Annual Report on Form 10-K into any filing of the Company under the Securities Act of 1933, or any filing under the Securities Exchange Act of 1934, except to the extent that FactSet specifically requests that the information be treated as soliciting material or specifically incorporate this information by reference into any such filing, and will not otherwise be deemed incorporated by reference into any other filing under the Securities Act or the Securities Exchange Act, except to the extent that FactSet specifically incorporates it by reference. |
| (2) | The stock price performance shown on the graphs is not necessarily indicative of future price performance. The Company is not responsible for any errors or omissions in such information. |
18
Table of Contents
| ITEM 6. | SELECTED FINANCIAL DATA |
The following selected financial data has been derived from FactSet’s consolidated financial statements. This financial data should be read in conjunction with Item 7, Management’s Discussion and Analysis of Financial Condition and Results of Operations and Item 8, Financial Statements and Supplementary Data, of this Annual Report on Form 10-K.
Consolidated Statements of Income Data
(in thousands, except per share data)
| Years Ended August 31, | ||||||||||||||||||||
| 2009 | 2008 | 2007 | 2006 | 2005 | ||||||||||||||||
| Revenues |
$ | 622,023 | $ | 575,519 | $ | 475,801 | $ | 387,350 | $ | 312,644 | ||||||||||
| Operating income |
211,030 | (1) | 183,887 | (3) | 155,091 | (5) | 121,288 | (7) | 109,021 | |||||||||||
| Other income |
1,092 | 5,160 | 7,785 | 4,744 | 1,142 | |||||||||||||||
| Provision for income taxes |
67,172 | 64,030 | 53,309 | 43,116 | 38,398 | |||||||||||||||
| Net income |
144,950 | (2) | 125,017 | (4) | 109,567 | (6) | 82,916 | (8) | 71,765 | (9) | ||||||||||
| Diluted earnings per common share |
$ | 2.97 | (2) | $ | 2.50 | (4) | $ | 2.14 | (6) | $ | 1.64 | (8) | $ | 1.43 | (9) | |||||
| Weighted average common shares (diluted) |
48,789 | 50,080 | 51,284 | 50,592 | 50,160 | |||||||||||||||
| Cash dividends declared per common share |
$ | 0.76 | $ | 0.60 | $ | 0.36 | $ | 0.22 | $ | 0.20 | ||||||||||
| Consolidated Balance Sheet Data |
| |||||||||||||||||||
| (in thousands) | ||||||||||||||||||||
| As of August 31, | ||||||||||||||||||||
| 2009 | 2008 | 2007 | 2006 | 2005 | ||||||||||||||||
| Cash, cash equivalents and investments |
$ | 216,320 | $ | 143,018 | $ | 186,222 | $ | 143,190 | $ | 76,023 | ||||||||||
| Accounts receivable, net of reserves |
62,854 | 74,859 | 59,579 | 59,190 | 54,029 | |||||||||||||||
| Goodwill and intangible assets, net |
227,705 | 246,113 | 182,976 | 184,428 | 152,453 | |||||||||||||||
| Total assets |
633,137 | 587,274 | 523,750 | 457,228 | 347,529 | |||||||||||||||
| Non-current liabilities |
32,945 | 29,177 | 23,789 | 19,239 | 15,736 | |||||||||||||||
| Total stockholders’ equity |
$ | 500,829 | $ | 465,471 | $ | 409,311 | $ | 358,688 | $ | 268,108 | ||||||||||
| (1) | Total pre-tax stock-based compensation was $13.6 million in fiscal 2009. |
| (2) | Includes $9.1 million (after-tax) of stock-based compensation and income tax benefits of $4.0 million primarily from the reenactment of the U.S. Federal Research and Development (“R&D”) tax credit in October 2008, finalizing prior year tax returns, adjusting certain reserves to reflect the lapse of statute of limitations and a benefit from repatriating foreign earnings to the U.S. |
| (3) | Total pre-tax stock-based compensation was $13.7 million in fiscal 2008 that includes a pre-tax charge of $2.4 million related to an increase in the number of performance-based stock options that vested in August 2008. |
| (4) | Includes $9.0 million (after-tax) of stock-based compensation. |
| (5) | Includes pre-tax stock-based compensation of $9.1 million. |
| (6) | Includes $6.0 million (after-tax) of stock-based compensation and income tax benefits of $4.1 million primarily from the reenactment of the U.S. Federal R&D tax credit in December 2006 , a Section 199 tax deduction, and a benefit from the repatriation of foreign earnings to the U.S. |
| (7) | Includes $8.4 million of stock-based compensation and $2.7 million of incremental expenses due to a significant short-term increase in occupancy costs from a redundancy of leased office space in London. |
| (8) | Includes $6.0 million (after-tax) of stock-based compensation, $1.9 million (after-tax) of incremental expenses due to a significant short-term increase in occupancy costs from a redundancy of leased office space in London, a gain of $0.9 million (after-tax) from the sale of Company-owned real estate during the first quarter of fiscal 2006 and an income tax benefit of $2.9 million primarily from the closure of previously filed tax returns. |
| (9) | Includes an income tax benefit of $1.9 million from the closure of previously filed tax returns and changes in estimates. |
19
Table of Contents
| ITEM 7. | MANAGEMENT’S DISCUSSION AND ANALYSIS OF FINANCIAL CONDITION AND RESULTS OF OPERATIONS |
Management’s Discussion and Analysis of Financial Condition and Results of Operations (“MD&A”) is designed to provide a reader of our financial statements with a narrative from the perspective of our management on our financial condition, results of operations, liquidity and certain other factors that may affect our future results. Our MD&A is presented in the following sections:
| • | Executive Overview |
| • | Results of Operations |
| • | Foreign Currency |
| • | Liquidity |
| • | Capital Resources |
| • | Off-Balance Sheet Arrangements |
| • | Contractual Obligations |
| • | Share Repurchase Program |
| • | Dividends |
| • | Critical Accounting Estimates |
| • | New Accounting Pronouncements |
| • | Recent Market Trends |
| • | Forward-Looking Factors |
We believe MD&A should be read in conjunction with the Consolidated Financial Statements and related Notes included in Item 8, Financial Statements and Supplementary Data, of this Annual Report on Form 10-K.
Executive Overview
FactSet is a leading provider of global financial and economic information, including fundamental financial data on tens of thousands of companies worldwide. Our applications support and make more efficient workflows for buy and sell-side professionals. These professionals include portfolio managers, research and performance analysts, risk managers, marketing professionals, sell-side equity research professionals, investment bankers and fixed income professionals. Our applications provide users access to company analysis, multicompany comparisons, industry analysis, company screening, portfolio analysis, predictive risk measurements, alphatesting, portfolio optimization and simulation, real-time news and quotes and tools to value and analyze fixed income securities and portfolios.
We combine hundreds of data sets, including content regarding tens of thousands of companies and securities from major markets all over the globe, into a single online platform of information and analytics. Clients have simultaneous access to content from an array of sources, which they can combine and utilize in nearly all of our applications. We are also fully integrated with Microsoft Office applications such as Excel®, Word® and PowerPoint®. This integration allows our users to create extensive custom reports. Our revenues are primarily derived from month-to-month subscriptions to services, databases and financial applications. We generate 82% of our revenues from our investment management clients, while the remaining revenues are primarily from investment banking clients.
Highlights in support of our strategic objectives in fiscal 2009 include:
Investment in Proprietary Content
During fiscal 2009, we continued to increase our proprietary content collection efforts in order to meet the needs of our clients. All of our proprietary data sets, across the entire spectrum of content, have been fully integrated into the new FactSet application. With FactSet content, we leverage years of experience managing financial data to provide high-quality, global databases for key content categories as well as providing users with the scope and coverage they need for in-depth analysis.
FactSet Fundamentals
| • | FactSet Fundamentals database is a preeminent global financial database with coverage of over 50,000 companies and history back to 1980 and is now integrated across all of our applications. |
20
Table of Contents
| • | This database extends our competitive advantage of providing clients a choice of premium content sets over the FactSet system and expands the selection of fundamental providers for clients. |
| • | Our acquisition of a copy of the Thomson Fundamentals database was completed in the fourth quarter of fiscal 2008. Our investment diluted earnings per share by $0.09 in fiscal 2009. More importantly, FactSet Fundamentals is now breakeven on a run-rate basis. |
| • | Revenues from FactSet Fundamentals were $4.6 million in fiscal 2009. |
| • | Annual third-party royalty payments were reduced by $7.7 million in fiscal 2009 due to the deployment of our own proprietary content over the FactSet platform. |
| • | The build-out of our content collection operations continue ahead of schedule. We opened FactSet Hyderabad in January 2009 as our major data collection center. As of August 31, 2009, there are approximately 900 employees in Hyderabad, many of whom collect fundamental data. |
| • | We also opened FactSet Manila in July 2009, which will be a secondary collection center, focusing on harvesting data from non-English sources. |
FactSet Estimates and FactSet Research Connect
| • | We have continued to expand our proprietary content through FactSet Estimates and FactSet Research Connect, our repository of sell-side research reports. FactSet Estimates is our preeminent global broker estimates database that provides our users with insight into an industry where consistency and transparency are at a premium. |
| • | FactSet Estimates covers approximately 24,500 companies globally with 600 contributors providing comprehensive consensus-level estimates and statistics with daily updates and history. |
| • | FactSet Research Connect makes available hundreds of full text research reports from an estimated 600 contributors. These firms include not only the largest investment banks but also the leading regional and independent research providers. |
| • | Continuous updates of premium global estimates, actual data and research reports from leading investment banks and research firms give clients real-time access to the most recent estimate data available. |
Other Proprietary Content
We successfully launched the following proprietary contents sets, all of which are integrated into the new FactSet workstation:
| • | Debt Capital Structure – a proprietary content database that provides a standardized breakout of a public or private company’s bank loan and/or corporate bond financing activity at a specific financial reporting point-in-time. |
| • | Global Private Equity & Venture Capital – a complete survey of any substantial Private Equity and Venture Capital firms, including portfolio companies, transactions, and partners. |
| • | FactSet People – a database comprised of more than 500,000 people, including executives of global public and private companies. |
| • | FactSet Market Aggregates – a data set that combines FactSet Fundamentals, FactSet Estimates and FactSet Pricing content to derive key ratios and per share values for global equity market indexes and commercial benchmark vendors, allowing for complex analysis of a company versus a basket of securities. |
Products
| • | On September 14, 2009, we announced the release of our newest financial software platform. The new FactSet consolidates data and analytics, previously spread across multiple applications, onto one comprehensive, intuitive interface. The new FactSet is faster, more intuitive, and easier to customize. New features include the ability to share workspaces with colleagues for improved collaboration and type ahead technology that helps users find securities more quickly. Visually, the platform has been redesigned from top to bottom with a sleek, modern look. An upgrade to the new FactSet will provide users with improved features and functionality within virtually every report and chart on FactSet. |
| • | We introduced the latest version of our real-time news and quotes application. Usage of our global news and quotes application continues to be strong. Its deployment is expanding with user growth of 27% since the beginning of the year. Users increased during every month during fiscal 2009. Since our real-time offering is relied upon on a daily basis, we believe this statistic indicates that overall engagement level from existing users is increasing. The fact that real-time users increased during a shrinking environment also leads us to believe the market place recognizes a compelling value proposition of our real-time offering. |
| • | FactSet Wireless Plus 4.2 was released in July 2009 and is now available to clients. FactSet Wireless Plus now synchs with your real-time news and quote feeds from the FactSet workstation and integrates seamlessly with the new FactSet. |
| • | In January 2009, a new version of ExcelConnect was introduced to clients with enhancements to the existing functionality of ExcelConnect. |
21
Table of Contents
| • | FactSet Fundamentals Auditing was launched in fiscal 2009. This feature empowers users to verify the financial data that was used in a given model, and ultimately to verify the data by clicking through to the underlying source document. |
| • | The DealMaven suite of efficiency tools was integrated into the FactSet Microsoft office solution in fiscal 2009. |
| • | We made significant investments in and enhancement to our Portfolio Analytics suite of products, particularly in the areas of fixed income portfolio analysis and risk. Portfolio Analysis and our suite of quantitative applications continue to make us a market leader for our investment management clients. Portfolio Analysis 2.0 was deployed by 647 clients and 5,640 users as of August 31, 2009. |
Employee Growth
| • | We employed 2,962 employees as of August 31, 2009, an increase of 53% over the past twelve months. |
| • | Approximately 45% of our employees are involved with content collection, 25% conduct sales and consulting services, another 25% are involved in product development, software and systems engineering and the remaining 5% of employees provide administrative support. |
U.S. Operations
| • | U.S. revenues increased 6% to $423.9 million in fiscal 2009. |
| • | Revenues from U.S. operations accounted for 68% and 69% of our consolidated revenues for fiscal 2009 and 2008. |
| • | Current office space expanded in four different locations throughout the U.S., including new office space in New York and Boston, which allowed us to consolidate the Boston office locations into one during the second half of fiscal 2009. |
| • | Employee count in the U.S. grew 6% during fiscal 2009 and represented 45% of all employees at August 31, 2009. |
International Operations
| • | Increased international revenues 12% to $198.1 million in fiscal 2009. The impact from foreign currency reduced international revenues by $0.2 million year over year. |
| • | Revenues from international operations accounted for 32% and 31% of our consolidated revenues for fiscal 2009 and 2008. |
| • | We entered into new lease agreements to support operations in Hyderabad, India, Metro Manila, the Philippines and Hong Kong. The new office space expanded existing international locations by 72,000 square feet. The new space in Hyderabad and Manila was for the expansion of our proprietary content operations including the FactSet Fundamentals collection team. |
| • | Employee count overseas grew significantly due to the FactSet content collection operations in India and the Philippines. Headcount increased by 958 since September 1, 2008 to 1,627 international employees as of August 31, 2009, representing 55% of all employees company-wide. |
Significant Capital Expenditures
| • | $11.1 million or 52% of capital expenditures in fiscal 2009 was for computer equipment, including the purchase of additional Hewlett Packard Integrity mainframes to increase the processing speed of our data centers. |
| • | $10.3 million or 48% of capital expenditures in fiscal 2009 was for the build-out of new space in our New York, Boston, Norwalk, Hyderabad and Manila office locations as well as additional furnishing of our London and Norwalk offices. |
Achieved Records in Several Key Metrics
| • | Annual subscription value (“ASV”) was $619 million at August 31, 2009. |
| • | Revenues grew 8% to $622 million. |
| • | Diluted earnings per share rose 19% to $2.97. |
| • | Free cash flow for fiscal 2009 was $184 million, up 71% over the prior year. |
| • | Cash and investments increased to $216 million at August 31, 2009, up 51% from the prior year. |
| • | Accounts receivable decreased 16% over the last 12 months. |
Other Highlights
| • | Client count was 2,045 at August 31, 2009. |
| • | At August 31, 2009, there were 37,300 professionals using FactSet. |
| • | For the 13th consecutive year, FactSet ranked on the Forbes’ “200 Best Small Companies.” |
| • | FactSet Europe was named one of UK’s 50 best places to work. |
Returning Value to Stockholders
| • | Increased our quarterly dividend 11% from $0.18 to $0.20 per share in May 2009. |
| • | Expanded our existing share repurchase program by an additional $100 million in March 2009. |
22
Table of Contents
Reduction to Annual Expense Base
| • | Our annual expense base was reduced by $34 million during fiscal 2009. |
| • | Drivers of the decrease in our expense base were streamlining our operations and favorable currency rates. In the summer of 2008, we embarked on an initiative to identify operational efficiencies. More than 40 ideas were implemented resulting in a reduction in our annual expense base of $18 million per year. The savings were captured without impacting the quality of our products and services as we continue to invest in our people, projects, and technology that we hope will fuel our future growth. |
| • | The strengthening of the U.S. dollar particularly against the British Pound Sterling and Euro reduced our international expense base by $16 million on an annualized basis. This reduction improved our profitability, since 97% of the Company’s revenues are billed in U.S. dollars. |
Results of Operations
For an understanding of the significant factors that influenced our performance during the past three fiscal years, the following discussion should be read in conjunction with the Consolidated Financial Statements and the Notes to Consolidated Financial Statements presented in this Annual Report.
| (in thousands, except per share data) Years Ended August 31, |
2009 | 2008 | Change | 2008 | 2007 | Change | ||||||||||||
| Revenues |
$ | 622,023 | $ | 575,519 | 8.1 | % | $ | 575,519 | $ | 475,801 | 21.0 | % | ||||||
| Cost of services |
209,364 | 191,239 | 9.5 | % | 191,239 | 152,797 | 25.2 | % | ||||||||||
| Selling, general and administrative |
201,629 | 200,393 | 0.6 | % | 200,393 | 167,913 | 19.3 | % | ||||||||||
| Operating income |
211,030 | 183,887 | 14.8 | % | 183,887 | 155,091 | 18.6 | % | ||||||||||
| Net income |
144,950 | 125,017 | 15.9 | % | 125,017 | 109,567 | 14.1 | % | ||||||||||
| Diluted earnings per common share |
$ | 2.97 | $ | 2.50 | 18.8 | % | $ | 2.50 | $ | 2.14 | 16.8 | % | ||||||
| Diluted weighted average common shares |
48,789 | 50,080 | 50,080 | 51,284 | ||||||||||||||
Revenues
Fiscal 2009 compared to Fiscal 2008
Revenues in fiscal 2009 advanced 8% to $622.0 million from $575.5 million for the same period a year ago and included $4.6 million from FactSet Fundamentals. Revenue growth of 8% in fiscal 2009 was driven by expanded deployment of our proprietary data across all geographies including incremental subscriptions to FactSet Fundamentals and Estimates, our real-time news and quotes capabilities included in the FactSet workstation, clients continuing to license our advanced applications such as Portfolio Analysis (“PA”) and our ability to consolidate multiple services into one through the FactSet platform enabling our clients to recognize efficiencies in many instances. Our investment management client base continues to experience strong growth across all geographies and represented 82% of our total revenues in fiscal 2009 compared to 79% of total revenues in fiscal 2008.
Sales of proprietary content continue to be a growing source of revenue. Both new and existing clients continue to deploy FactSet Fundamentals. In addition, our investment to expand coverage globally and add textual research from sell-side firms has led to growth in the demand for FactSet Estimates. Real-time news and quotes is a product that services the needs of a global investor and continues to be a source of revenue growth for us. Deployment of real-time news and quotes has been strong over the past four fiscal quarters, with a 27% increase in user count year over year. Our clients continue to license our advanced portfolio applications. PA 2.0 clients rose by 10 in fiscal 2009 with approximately 647 clients consisting of 5,640 users subscribed to PA as of August 31, 2009. In addition, the ability for our end users to access more than 85 premium third-party content providers and integrate their own data for use in FactSet applications continues to be a reason for revenue growth. We continue to appeal to larger institutions because of our ability to service many different user groups and our ability to deliver intensive computing power and analytics to end users.
Revenue growth from sell-side clients was negative in fiscal 2009. During the past 18 months, several of our largest banking clients ceased operations, and employment contracted across most of the sell-side, resulting in a 15% decrease in our sell-side user count since September 1, 2008. Revenues from our investment banking clients expressed as a percentage of total revenues decreased to 18% in fiscal 2009 as compared to 21% in fiscal 2008. However, during the fourth quarter of fiscal 2009 we saw growth in the sell-side user count and, as with the buy-side, recent market rallies are beginning to change the overall business environment, resulting improved capital market transactions and a corresponding decline in our clients’ willingness to trim deployment of financial information systems.
23
Table of Contents
Fiscal 2008 compared to Fiscal 2007
Revenues in fiscal 2008 increased 21% to $575.5 million from $475.8 million in fiscal 2007. The impact from foreign currency reduced international revenues by $2.9 million year over year. The sale of additional services to existing investment management professionals was the primary catalyst of our revenue growth. Our investment management client base experienced strong growth across all geographies and represented approximately 79% of our total ASV as of August 31, 2008. The deepening engagement of existing FactSet users in our investment management business and the ability to consolidate multiple services into one through the FactSet platform resulted in revenue growth in fiscal 2008. Real-time news and quotes, our suite of Portfolio Analysis services, IBCentral and our risk and quantitative services continued to expand across all geographies. Incremental content for non-U.S. investors helped increase demand for our services outside the U.S.
Revenues by Geographic Region
| (in thousands) Years Ended August 31, |
2009 | 2008 | 2007 | |||||||||
| U.S. |
$ | 423,926 | $ | 398,317 | $ | 335,304 | ||||||
| % of revenues |
68.2 | % | 69.2 | % | 70.5 | % | ||||||
| Europe |
$ | 156,610 | $ | 141,062 | $ | 114,335 | ||||||
| Asia Pacific |
41,487 | 36,140 | 26,162 | |||||||||
| International |
$ | 198,097 | $ | 177,202 | $ | 140,497 | ||||||
| % of revenues |
31.8 | % | 30.8 | % | 29.5 | % | ||||||
| Consolidated |
$ | 622,023 | $ | 575,519 | $ | 475,801 | ||||||
Revenues from our U.S. business increased 6% to $423.9 million in fiscal 2009 compared to $398.3 million in the same period a year ago. Revenues from our U.S. business increased 19% in fiscal 2008, up from $335.3 million in fiscal 2007.
International revenues in fiscal 2009 were $198.1 million, an increase of 12% from $177.2 million in the prior year period. The impact from foreign currency reduced international revenues by $0.2 million year over year. European revenues advanced 11% to $156.6 million, largely related to offering a broader selection of global content and the continued deployment of our portfolio analysis, risk and quantitative applications. Asia Pacific revenues grew to $41.5 million, up 15% from the same period a year ago. Revenues from international operations accounted for 32% of our consolidated revenues for fiscal 2009 and 31% in fiscal 2008. Our growth rates in Europe and Asia Pacific reflect our ability to sell additional services to existing clients and a reallocation of sell-side investment professionals to major non-U.S. money centers, especially in Asia. International revenues increased 26% in fiscal 2008, up from $140.5 million in fiscal 2007. The impact from foreign currency increased international revenues by $2.9 million in fiscal 2008. European revenues advanced 23% to $141.1 million and Asia Pacific revenues grew to $36.1 million, up 38% from the same period a year ago.
Annual Subscription Value - ASV at a given point in time represents the forward-looking revenues for the next twelve months from all subscription services being supplied to our clients. With proper notice to us, our clients are generally able to add to, delete portions of, or terminate service at any time. At August 31, 2009, ASV was $619 million, up $4 million or 1% from the prior year total of $615 million. Of this total, 82% of ASV derives from buy-side clients and the remainder from the sell-side firms who perform M&A advisory work and equity research. ASV from international operations increased from $195 million at August 31, 2008 to $200 million at August 31, 2009, representing 32% of the Company-wide total. ASV growth in fiscal 2009 was generated from our ability to license our proprietary content and an improved performance in both the U.S. and international investment management client base, which demonstrates our ability to deepen the engagement of existing FactSet users. Demand for PA and real-time news and quotes continued to be positive. PA 2.0 client count grew to 647 over the last 12 months while real-time news and quotes experienced a 27% increase in user count year over year. Success with these applications partially offset the reduction of our ASV due to a difficult operating environment for investment banks. An already difficult selling environment was amplified by weakening equity markets in fiscal 2009. In the last calendar quarter of 2008, sell-side firms scaled back expenditures, emphasizing savings over spending. Cost cuts were significant due to the decline in asset values and the majority of our clients implemented expense reductions. These actions reduced our user growth in fiscal 2009 as compared to fiscal 2008. The performance of portfolio analytics, including FactSet Fundamentals and Estimates, enhanced our ASV growth.
ASV at the end of fiscal 2008 was up $98 million or 19% from the prior year total of $517 million. Excluding currency and ASV acquired from the acquisitions of DealMaven and Thomson Fundamentals, ASV increased $93 million in fiscal 2008 due to our ability to license our proprietary content, including events and transcripts, deal data and ownership data, net addition of new clients, growth in our PA suite of products, incremental subscriptions to our services by existing clients and increased users and the deployment of solutions to service the global needs of large institutions.
24
Table of Contents
Users and Clients - At August 31, 2009, professionals using FactSet decreased to 37,300, down 2,800 users from the beginning of the year. Client count was 2,045 as of August 31, 2009, a net decrease of 40 clients during fiscal 2009. At August 31, 2009, the average ASV per client was $302,000, up from $295,000 at August 31, 2008 and $265,000 at August 31, 2007. Sell-side firms continue to scale back on headcount. The headcount reduction over the past 12 months was almost entirely sell-side driven and is the effect of several large mergers and industry-wide employee reductions. The lack of available credit throughout most of the fiscal year adversely impacted the number of M&A transactions and the profitability of sell-side banks.
At August 31, 2008, client count was 2,085, a net increase of 132 clients or 7% over the prior 12 months. The combination of advanced FactSet applications including real-time news and quotes with a vast array of data supported by FactSet client service contributed to our user growth in fiscal 2008. While the overall franchise value of large investment banks declined significantly in fiscal 2008, our investment banking user base grew 16% during fiscal 2008.
At August 31, 2009, annual client retention was greater than 95% of ASV, consistent with the same period a year ago. On a client basis our annual retention rate was 87% of clients at August 31, 2009, a decrease from 92% a year ago. This decline is a result of client losses relating primarily to small firms rather than larger institutions. As of August 31, 2009, our largest individual client accounted for less than 2% of total ASV and ASV from the ten largest clients did not surpass 16% of total client subscriptions, down from 17% as of August 31, 2008.
Operating Expenses
| (in thousands) Years Ended August 31, |
2009 | 2008 | 2007 | |||||||||
| Cost of services |
$ | 209,364 | $ | 191,239 | $ | 152,797 | ||||||
| Selling, general and administrative |
201,629 | 200,393 | 167,913 | |||||||||
| Total operating expenses |
$ | 410,993 | $ | 391,632 | $ | 320,710 | ||||||
| Operating income |
$ | 211,030 | $ | 183,887 | $ | 155,091 | ||||||
| Operating Margin |
33.9 | % | 32.0 | % | 32.6 | % | ||||||
Cost of Services
Fiscal 2009 compared to Fiscal 2008
Cost of services advanced 9% to $209.4 million in fiscal 2009 from $191.2 million in fiscal 2008. Cost of services expressed as a percentage of revenues increased 45 basis points to 33.7% during fiscal 2009 from 33.2% a year ago. The increase was driven by higher employee compensation, computer related expenses and computer depreciation partially offset by a reduction in data costs and favorable currency rates.
Employee compensation, expressed as a percentage of revenues, increased 20 basis points during fiscal 2009 due to expanding the number of employees, primarily for our investment in FactSet Fundamentals which was not in operation before August 2008. The first quarter of fiscal 2009 marked the first full quarter of operations for FactSet Fundamentals. Employee count as of August 31, 2009 was 2,962, up 53% over the prior year and was driven by the expansion of FactSet’s proprietary content operation including the FactSet Fundamentals collection team. We discontinued a business process outsourcing (“BPO”) relationship in May 2009. Computer related expenses, including computer maintenance costs, rose 30 basis points in fiscal 2009 as compared to the same period a year ago primarily due to last year’s transition to Hewlett Packard Integrity mainframe machines in our data centers. Computer maintenance contracts on the new mainframe machines commenced one year after deployment, as each were covered under warranty during fiscal 2008. Computer depreciation increased 20 basis points in fiscal 2009 as compared to the same period in fiscal 2008 because no mainframe machines became fully depreciated during in fiscal 2009.
A reduction in data costs partially offset the overall increase to cost of services in fiscal 2009. Data costs, as a percentage of revenues, decreased 20 basis points in fiscal 2009 compared to the same period a year ago. Lower data costs were the result of ending a BPO relationship in May 2009 and a reduction in variable fees payable to data vendors based on deployment of their content over the FactSet platform. In addition, favorable currency rates partially offset the 45 basis point increase in fiscal 2009 as compared to fiscal 2008 as the U.S. dollar strengthened during fiscal 2009, especially against the Euro and British Pound Sterling, reducing our overall expense base.
Fiscal 2008 compared to Fiscal 2007
Cost of services increased 25% in fiscal 2008 from $152.8 million in fiscal 2007. The main drivers of the fiscal 2008 growth of 110 basis points were increases in employee compensation and additional data costs partially offset by lower amortization of intangible assets and computer related expenses and depreciation.
25
Table of Contents
Employee compensation, expressed as a percentage of revenues, advanced 160 basis points during fiscal 2008 compared to fiscal 2007. Employee additions as well as normal merit increases primarily accounted for the increase in employee compensation. Employee count was up 17% in fiscal 2008 over the prior year. Data costs, as a percentage of revenues, rose by 65 basis points in fiscal 2008 as compared to fiscal 2007, driven by variable fees payable to data vendors from additional content subscriptions and higher levels of proprietary data content collection.
A reduction in computer related expenses and amortization of intangible assets partially offset the overall increase to cost of services in fiscal 2008. Computer maintenance and depreciation decreased 75 basis points as a percentage of revenues in fiscal 2008 compared to the prior year. The decrease in computer maintenance is a result of replacing the older existing Hewlett Packard Alpha mainframe machines with new Hewlett Packard Integrity mainframe machines in fiscal 2008. Intangible asset amortization expense expressed as a percentage of revenues declined 30 basis points in fiscal 2008 compared to the same period in fiscal 2007 due to the full amortization of certain intangible assets from previous acquisitions compared to previous years.
Selling, General and Administrative
Fiscal 2009 compared to Fiscal 2008
Selling, general, and administrative (“SG&A”) expenses advanced 1% to $201.6 million in fiscal 2009 from $200.4 million in fiscal 2008. However, SG&A expenses expressed as a percentage of revenues declined to 32.4% in fiscal 2009 compared to 34.8% a year ago. The decrease of 240 basis points in SG&A was driven by lower employee compensation and travel and entertainment (“T&E”) costs partially offset by an increase in occupancy costs.
Employee compensation expressed as a percentage of revenues decreased 135 basis points during fiscal 2009 compared to the same period a year ago due to favorable currency rates and reduced headcount growth in the U.S. and Europe. The U.S. dollar strengthened during fiscal 2009, reducing our international employee compensation base. The decrease in T&E costs expressed as a percentage of revenues of 145 basis points in fiscal 2009 as compared to fiscal 2008 was primarily due to three factors: a decrease in the cost per trip, a prudent approach to interoffice travel and the occurrence of our engineering conference only in the prior year.
A reduction in employee compensation and T&E was partially offset by an increase in occupancy costs year over year. Occupancy costs, including rent and depreciation of furniture and fixtures, expressed as a percentage of revenues increased 45 basis points in fiscal 2009 compared to fiscal 2008 due to recent office expansions in Boston, New York, Norwalk, Hyderabad, Tokyo and Manila.
Fiscal 2008 compared to Fiscal 2007
SG&A expenses advanced 19% to $200.4 million in fiscal 2008 from $167.9 million in fiscal 2007. SG&A expenses expressed as a percentage of revenues declined to 34.8% in fiscal 2008 compared to 35.3% a fiscal 2007. The decrease of 50 basis points in SG&A was driven by lower employee compensation and occupancy costs partially offset by an increase in stock-based compensation.
Employee compensation expressed as a percentage of revenues decreased 50 basis points in fiscal 2008 compared to the prior year period due to the ability to leverage SG&A staff through our enhanced internal information systems which allowed us to keep our SG&A headcount growth consistent with last year while growing our revenue base. Occupancy costs, as a percentage of revenues decreased 25 basis points during fiscal 2008 as compared to the year ago period as the result of leveraging our existing space and was temporary based on the timing of acquiring new space to support a growing employee base.
Partially offsetting the overall decrease to SG&A as a percentage of revenues was an increase in stock-based compensation to reflect the $1.8 million incremental charge to SG&A from performance-based stock options. During the second quarter of fiscal 2008, we estimated that it was probable we would achieve ASV and diluted earnings per share growth of at least 20% on a compounded annual basis for the two years ended August 31, 2008. This reflected a higher performance level than previously estimated and accordingly increased the number of options that vest at the end of fiscal 2008 and the stock-based compensation to record.
Operating Income and Operating Margin
Fiscal 2009 compared to Fiscal 2008
Operating income increased 15% to $211.0 million in fiscal 2009 from $183.9 million in fiscal 2008. Our operating margin during fiscal 2009 was 33.9%, up 190 basis points from 32.0% a year ago primarily due to favorable currency rates, cost saving initiatives and incremental stock-based compensation in the prior year. Since 97% of our ASV is billed in U.S. dollars, the strengthening of the U.S. dollar year over year improved our operating margin 220 basis points. Foreign currency reduced
26
Table of Contents
our operating expenses by $13.8 million and increased operating income by $13.6 million during fiscal 2009. While both the Euro and British Pound Sterling have gained significantly on the U.S. dollar since May 2009, the impact on our expense base will not be immediate. Our currency risk is hedged 90% through the end of the first quarter of fiscal 2010 and 45% through the second quarter of fiscal 2010. Cost saving initiatives covered a range of operational areas, including implementing more cost effective means to connect clients to our data centers, data cost reductions from renegotiating terms with vendors, review of usage data for royalty-based payments, implementing an approval process to encourage a more judicious approach to interoffice travel, reducing the number of ex-patriot assignments, improving our marketing spend efficiency and using the capabilities of a laptop to eliminate the need to purchase a phone for every employee. Included in fiscal 2008 was a pre-tax charge of $2.4 million related to an increase in the estimate of the number of performance-based stock options that vested in August 2008. The change in the estimate increased operating expenses by $2.4 million in the year ago period and decreased operating margins by 40 basis points.
Partially offsetting the benefit from favorable currency rates, cost saving initiatives and incremental stock-based compensation in the prior year was a full year of FactSet Fundamentals. FactSet Fundamentals expenses in fiscal 2009 were primarily compensation from new employee growth to support the fundamental collection operation and the amortization of acquired intangible assets and prepaid daily database updates. Operating income declined $7.5 million from FactSet Fundamentals, which reduced the fiscal 2009 operating margin by 120 basis points.
Fiscal 2008 compared to Fiscal 2007
In fiscal 2008, operating income was up 19% from $155.1 million in fiscal 2007. Our operating margin decreased 60 basis points in fiscal 2008 as compared to fiscal 2007 due to increased employee compensation and data costs partially offset by lower computer maintenance and amortization of intangible assets. Fiscal 2008 included a pre-tax charge of $2.4 million related to an increase in the estimate of the number of performance-based stock options that vested in August 2008 and one month of FactSet Fundamentals which decreased operating income by $1.1 million. FactSet Fundamentals expenses in fiscal 2008 were primarily amortization of acquired intangible assets and prepaid daily database updates.
Operating Income by Segment
| (in thousands) Years Ended August 31, |
2009 | 2008 | 2007 | ||||||
| U.S. |
$ | 142,893 | $ | 123,971 | $ | 100,916 | |||
| Europe |
47,601 | 38,104 | 38,501 | ||||||
| Asia Pacific |
20,536 | 21,812 | 15,674 | ||||||
| Consolidated |
$ | 211,030 | $ | 183,887 | $ | 155,091 | |||
Each segment records compensation, including stock-based compensation, amortization of intangible assets, depreciation of furniture and fixtures, amortization of leasehold improvements, communication costs, professional fees, rent expense, travel, marketing, office and other direct expenses related to its employees. Expenditures associated with our data centers, product development and corporate headquarters charges are recorded by the U.S. segment and are not allocated to the European and Asia Pacific segments.
Fiscal 2009 compared to Fiscal 2008
Operating income from our U.S. segment increased 15% to $142.9 million during fiscal 2009 compared to $124.0 million in the same period a year ago primarily due to a 6% increase in revenues, lower U.S. variable data fees, a decline in T&E costs and a reduction in SG&A employee compensation partially offset by higher computer related expenses. Lower data costs were caused by a reduction in variable fees charged by data vendors based on deployment of their content over the FactSet platform. SG&A employee compensation, expressed as a percentage of U.S. revenues, decreased during fiscal 2009 compared to the same period a year ago due to reduced headcount growth in the U.S. The decrease in T&E costs was primarily due to a prudent approach to interoffice travel and the occurrence of our engineering conference only in the prior year. As mentioned above, expenditures associated with our data centers including computer related expenses are recorded by the U.S. segment and are not allocated to the European and Asia Pacific segments. The increase in computer related expenses relates to last year’s transition to Hewlett Packard Integrity mainframe machines in our data centers. Computer maintenance expenses rose because maintenance commences one year after a mainframe is deployed due to the expiration of the warranty. Computer depreciation also increased because no mainframe machines became fully depreciated during the year.
European operating income increased 25% to $47.6 million during fiscal 2009 compared to $38.1 million in the same period a year ago primarily due to an 11% increase in revenues and a decrease in T&E costs. European revenues advanced 11% to $156.6 million, largely related to offering a broader selection of global content and the continued deployment of our portfolio analysis, risk and quantitative applications. The decrease in T&E costs for the European segment was primarily due to a prudent approach to our interoffice travel and a decrease in the cost per trip.
27
Table of Contents
Asia Pacific operating income decreased 6% to $20.5 million during fiscal 2009 compared to $21.8 million in the same period a year ago primarily due to a full year of operations for FactSet Fundamentals and increased rent expense for office expansion in Japan, India and the Philippines partially offset by a 15% increase in revenues.
Fiscal 2008 compared to Fiscal 2007
Operating income from our U.S. segment increased 23% to $124.0 million during fiscal 2008 compared to $100.9 million in fiscal 2007 primarily due to a 19% increase in revenues and lower computer maintenance and amortization of intangible assets. European operating income decreased 1% to $38.1 million during fiscal 2008 compared to $38.5 million in fiscal 2007 primarily due to higher employee compensation and data costs partially offset by a 23% increase in revenues. Asia Pacific operating income increased 39% to $21.8 million during fiscal 2008 compared to $15.7 million in fiscal 2007 primarily due to a 38% increase in revenues.
Other Income, Income Taxes, Net Income and Earnings per Share
| (in thousands, except per share data) Years Ended August 31, |
2009 | 2008 | 2007 | |||||||||
| Other income |
$ | 1,092 | $ | 5,160 | $ | 7,785 | ||||||
| Provision for income taxes |
$ | 67,172 | $ | 64,030 | $ | 53,309 | ||||||
| Net income |
$ | 144,950 | $ | 125,017 | $ | 109,567 | ||||||
| Diluted earnings per common share |
$ | 2.97 | $ | 2.50 | $ | 2.14 | ||||||
| Effective Tax Rate |
31.7 | % | 33.9 | % | 32.7 | % | ||||||
Other Income
Fiscal 2009 compared to Fiscal 2008
Other income declined 79% to $1.1 million in fiscal 2009 as compared to the same period a year ago. The decline in other income was a result of the Federal Reserve lowering U.S. interest rates by 220 basis points over the last twelve months, which lowered returns on our investments in U.S. treasuries and U.S. government agency securities. At no time during fiscal 2009 did a component of our investment portfolio experience a decline in value due to a ratings change, default or increase in counterparty credit risk.
Fiscal 2008 compared to Fiscal 2007
Other income decreased 34% to $5.2 million in fiscal 2008 as compared to fiscal 2007. The decline in other income was a result of the Federal Reserve lowering U.S. interest rates by 350 basis points in fiscal 2008 and our reallocation of investments to U.S. treasuries and U.S. government agency securities. At no time during fiscal 2008 did a component of our investment portfolio experience a decline in value due to a ratings change, default or increase in counterparty credit risk.
Income Taxes
Fiscal 2009 compared to Fiscal 2008
In fiscal 2009, the provision for income taxes increased 5% to $67.2 million as compared to the same period a year ago. Our effective tax rate for fiscal 2009 was 31.7% compared to 33.9% for the prior year. The components of the effective tax rate are 33.6% for the full fiscal 2009 year partially offset by income tax benefits of 1.9%. Our effective tax rate for fiscal 2009 decreased 220 basis points as compared to fiscal 2008 due to $4.0 million of income tax benefits recognized in fiscal 2009 from the reenactment of the U.S. Federal R&D tax credit in October 2008, retroactive to January 1, 2008, finalizing our prior year tax returns, a tax credit for repatriating foreign earnings to the U.S. and adjusting certain reserves to reflect the lapse of statute of limitations.
Fiscal 2008 compared to Fiscal 2007
The provision for income taxes advanced 20% in fiscal 2008 from $53.3 million in fiscal 2007. Our effective tax rate for fiscal 2008 was 33.9% compared to 32.7% for the prior year. Our effective tax rate for fiscal 2008 increased 120 basis points as compared to fiscal 2007 primarily from the expiration of the U.S. Federal R&D tax credit on December 31, 2007 which caused our effective tax rate to increase 190 basis points in fiscal 2008.
Net Income and Earnings per Share
Fiscal 2009 compared to Fiscal 2008
Net income rose 16% to $144.9 million and diluted earnings per common share increased 19% to $2.97 in fiscal 2009 compared to the year ago period. Included in fiscal 2009 was a $0.03 per share benefit from the reenactment of the U.S. Federal R&D credit in October 2008, a $0.06 per share benefit related to finalizing prior years’ tax returns and repatriating foreign earnings to the U.S. and a $0.03 per share benefit from incremental stock-based compensation in the prior year
28
Table of Contents
related to performance-based options partially offset by a $0.09 per share reduction in diluted earnings per share from FactSet Fundamentals. FactSet Fundamentals expenses in fiscal 2009 were primarily compensation from new employee growth to support the fundamental collection operation and the amortization of acquired intangible assets and prepaid daily database updates.
Fiscal 2008 compared to Fiscal 2007
Net income rose 14% to $125.0 million and diluted earnings per common share increased 17% to $2.50 in fiscal 2008 compared to the year ago period. Included in net income for fiscal 2008 was a pre-tax charge of $2.4 million related to an increase in the number of performance-based stock options that vested in August 2008 and the impact of FactSet Fundamentals which reduced operating income by $1.1 million in fiscal 2008. The inclusion of these expenses decreased net income by $3.5 million or 3% year over year.
Foreign Currency
Certain wholly owned subsidiaries within the European and Asia Pacific segments operate under a functional currency different from the U.S. dollar. The financial statements of these foreign subsidiaries are translated into U.S. dollars using period-end rates of exchange for assets and liabilities and average rates for the period for revenues and expenses. Translation gains (losses) that arise from translating assets, liabilities, revenues and expenses of foreign operations are recorded in accumulated other comprehensive income as a component of stockholders’ equity. Transaction gains (losses) that arise from the effect of exchange rate changes on transactions denominated in currencies other than the functional currency are included in determining net income for the period in which exchange rates change.
As depicted in the chart below, our non-U.S. dollar denominated revenues expected to be recognized over the next twelve months are estimated to be $18 million while our non-U.S. dollar denominated expenses are $119 million, which translates into a net foreign currency exposure of $101 million per year.
| Annualized Foreign Currency Exposure | ||||||||||
| (In thousands) |
Revenues | Expenses | Net Exposure | |||||||
| Euro |
$ | 2,331 | $ | 37,417 | $ | (35,086 | ) | |||
| British Pound Sterling |
3,282 | 50,704 | (47,422 | ) | ||||||
| Japanese Yen |
12,599 | 9,378 | 3,221 | |||||||
| Other |
— | 21,721 | (21,721 | ) | ||||||
| Total |
$ | 18,212 | $ | 119,220 | $ | (101,008 | ) | |||
Our primary foreign currency exchange exposures are related to our operating expense base in countries outside the U.S., where 55% of our employees are located. During the last twelve months, the U.S. dollar strengthened, particularly against the British Pound Sterling and Euro. Foreign currency movements had the following effects in fiscal 2009 when holding currencies constant from fiscal 2008:
| • | Decreased revenues by $0.2 million. |
| • | Decreased operating expenses by $13.8 million. |
| • | Increased operating income by $13.6 million and operating margins by 220 basis points. |
| • | Increased diluted earnings per share by $0.18. |
To reduce short-term variability in operating expenses denominated in British Pound Sterling and Euro from foreign currency fluctuations, we entered into foreign currency forward contracts with maturities up to twelve months during fiscal 2009. These hedging programs are not designed to provide foreign currency protection over longer time horizons. During fiscal 2009, we entered into foreign currency forward contracts to hedge approximately 90% of our net foreign currency exposure through the end of the first quarter of fiscal 2010 and 45% of our net exposure in the second quarter of fiscal 2010. In designing a specific hedging approach, we considered several factors, including offsetting exposures, significance of exposures, forecasting risk and potential ineffectiveness of the hedge. The gains and losses on foreign currency forward contracts mitigate the variability in operating expenses associated with currency movements.
At August 31, 2009, the aggregated notional amount of all foreign currency forward contracts outstanding was $26.2 million. These transactions are designated as cash flow hedges. The effective portion of the derivative’s gain or loss on the forward contract is initially reported as a component of accumulated other comprehensive (loss) income and then reclassified into operating income when the hedged exposure affects operating income (when net expenses are recorded).
29
Table of Contents
The following is a summary of all hedging positions held as of August 31, 2009 (in thousands):
| Q1’2010 | Q2’2010 | |||||||
| Euro |
||||||||
| Notional amount |
€ | 5,480,000 | € | 2,400,000 | ||||
| % of Net foreign currency exposure hedged |
90 | % | 45 | % | ||||
| Average forward contract rate |
1.368 | 1.400 | ||||||
| British Pound Sterling |
||||||||
| Notional amount |
£ | 6,850,000 | £ | 3,000,000 | ||||
| % of Net foreign currency exposure hedged |
90 | % | 45 | % | ||||
| Average forward contract rate |
1.543 | 1.595 | ||||||
A loss on derivatives for the twelve months ended August 31, 2009 of $5.2 million was recorded into operating income in our Consolidated Statements of Income compared to a gain of $0.3 million in the same period a year ago. The fair value of all derivative instruments recorded in our Consolidated Statement of Financial Condition at August 31, 2009 was $1.1 million in other current assets compared to $0.2 million in accounts payable and accrued expenses at August 31, 2008. Included in accumulated other comprehensive income (loss) was $0.9 million (net of tax) at August 31, 2009 compared to ($0.2) million (net of tax) at August 31, 2008.
Liquidity
The table below, for the periods indicated, provides selected cash flow information (in thousands):
| Years Ended August 31, |
2009 | 2008 | 2007 | |||||||||
| Net cash provided by operating activities |
$ | 207,770 | $ | 143,124 | $ | 155,908 | ||||||
| Capital expenditures (1) |
(24,040 | ) | (35,780 | ) | (39,251 | ) | ||||||
| Free cash flow (2) |
$ | 183,730 | $ | 107,344 | $ | 116,657 | ||||||
| Net cash provided by (used in) investing activities |
$ | 1,220 | $ | (119,268 | ) | $ | (39,993 | ) | ||||
| Net cash used in financing activities |
$ | (110,419 | ) | $ | (73,583 | ) | $ | (74,206 | ) | |||
| Cash and cash equivalents |
$ | 216,320 | $ | 117,986 | $ | 168,834 | ||||||
| (1) | Included in net cash used in investing activities during each fiscal year reported above. |
| (2) | We define free cash flow as cash provided by operating activities, which includes the cash cost for taxes and changes in working capital, less capital expenditures. The presentation of free cash flow is not intended to be considered in isolation or as a substitute for the financial information prepared and presented in accordance with generally accepted accounting principles (“GAAP”). The GAAP financial measure, cash flows provided by operating activities, has been adjusted to report non-GAAP free cash flow that includes the cash cost for taxes and changes in working capital, less capital expenditures. We use this financial measure, both in presenting our results to stockholders and the investment community, and in our internal evaluation and management of the business. Management believes that this financial measure and the information we provide are useful to investors because they permit investors to view our performance using the same tools that management uses to gauge progress in achieving our goals. We believe this measure is also useful to investors because it is an indication of cash flow that may be available to fund further investments in future growth initiatives. |
Fiscal 2009 compared to Fiscal 2008
Cash and cash equivalents aggregated to $216.3 million or 34% of our total assets at August 31, 2009, compared with $118.0 million or 20% of our total assets at August 31, 2008. All of our operating and capital expenditure requirements were financed entirely from cash generated from our operations. Our cash and cash equivalents increased $98.3 million in fiscal 2009 as a result of cash provided by operations of $207.8 million, $25.3 million of proceeds from the sale of investments and $23.8 million from the exercise of employee stock options partially offset by cash outflows of $103.8 million related to stock repurchases, dividends paid of $34.8 million and capital expenditures of $21.4 million, net of landlord contributions for construction of $2.6 million.
We historically pay variable employee compensation related to the previous fiscal year in the first fiscal quarter. This cash outlay is anticipated to be approximately $32 million in the first quarter of fiscal 2010. We have included the payout in accrued compensation on our balance sheet at August 31, 2009. Variable employee compensation paid in the first quarter of fiscal 2009 was $31.5 million, relating to fiscal 2008.
30
Table of Contents
During fiscal 2009, free cash flow rose 71% to $183.7 million and exceeded net income by 27%. Drivers of free cash flow during fiscal 2009 were increased levels of net income, execution on cost savings initiatives, positive working capital changes, favorable currency rates and a reduction in capital expenditures. The improvement in working capital was primarily from a $12 million or 16% decrease in accounts receivable. Over the last 12 months, our accounts receivable balance decreased 16%, while revenues grew 8%. At August 31, 2009 our days sales outstanding (“DSO”) was 37 days as compared to 44 days at August 31, 2008.
Net cash provided by investing activities improved by $120.5 million in fiscal 2009 as compared to fiscal 2008 due to the acquisitions of Thomson Fundamentals and DealMaven in fiscal 2008 and lower capital expenditures. There were no business acquisitions during fiscal 2009.
Net cash used in financing activities advanced 50% in fiscal 2009 as compared to fiscal 2008 primarily due to incremental share repurchases and an increase in the dividends paid per share. During fiscal 2009, we repurchased 2.2 million shares for $103.3 million under the program. On May 12, 2009, our Board of Directors approved an 11% increase in the regular quarterly dividend from $0.18 per share to $0.20 per share, or $0.80 per share per annum, beginning with our dividend payment in June 2009.
Fiscal 2008 compared to Fiscal 2007
Cash and cash equivalents aggregated to $118.0 million or 20% of our total assets at August 31, 2008, compared with $168.8 million or 32% of our total assets at August 31, 2007. All our operating and capital expense requirements were financed entirely from cash generated from our operations. Our cash and cash equivalents decreased $50.8 million since August 31, 2007 as a result of cash outflows of $77.9 million related to stock repurchases, $29.0 million from the payment of variable employee compensation, $75.9 million from the acquisitions of Thomson Fundamentals and DealMaven, dividends paid of $25.8 million and capital expenditures, net of landlord contributions of $34.8 million, partially offset from cash provided by operations of $143.1 million and $30.1 million from the exercise of employee stock options.
Free cash flow was $107.3 million in fiscal 2008. Drivers of free cash flow during fiscal 2008 were net income of $125.0 million and non-cash expenses of $29.8 million partially offset by capital expenditures of $34.8 million and a decrease in working capital of $12.7 million. The decrease in cash flows from working capital changes was primarily caused by an increase in accounts receivable.
Cash provided by operating activities during fiscal 2008 decreased $12.8 million or 8% since fiscal 2007 as a result of the prepayment of daily database updates to Thomson in the fourth quarter of fiscal 2008. On July 24, 2008, we entered into a transition services agreement (“TSA”) with Thomson whereby Thomson provides services for 18 months from July 24, 2008, including daily updates to our fundamentals database. The cost of the TSA was approximately $9 million, of which $8.25 million was consideration for the daily database updates expensed ratably over the 18-month period.
Net cash used in investing activities increased $79.3 million in fiscal 2008 as compared to fiscal 2007 due to the acquisitions of Thomson Fundamentals and DealMaven partially offset by a decrease in capital expenditures. There were no business acquisitions during fiscal 2007.
Net cash used in financing activities during fiscal 2008 was consistent with fiscal 2007.
Capital Resources
Capital Expenditures
Capital expenditures were $21.4 million, net of landlord contributions for construction of $2.6 million for fiscal 2009, down from $34.8 million in the same period a year ago. Approximately $11.1 million or 52% of capital expenditures was for computer equipment, including the purchase of additional Hewlett Packard Integrity mainframes to increase the processing speed of our data centers. The remaining 48% or $10.3 million of capital expenditures, net of landlord contributions for construction, was for the build-out of new space in our New York, Boston, Norwalk, Hyderabad and Manila office locations as well as additional furnishing of our London and Norwalk offices. Capital spending levels decreased compared to the prior year due to improvements in hardware utilization and landlord contributions received to fund the build-out of new office space in New York, Boston, Norwalk and Manila.
Capital expenditures during fiscal 2008 totaled $34.8 million, net of landlord contributions for construction of $1.0 million, a decrease of $1.6 million or 4% compared to fiscal 2007. Expenditures for computer equipment were $24.3 million and the remainder covered office space expansion. Significant capital expenditures included adding Hewlett Packard Integrity mainframe machines to our data centers and building out new office space in our Paris, Amsterdam, Chicago and Norwalk locations. As a result, our system capacity expanded by 20%. The cost per Integrity mainframe is 35% less than an Alpha mainframe and the power consumption has been reduced in half. The additional purchases in fiscal 2008 completed our transition to Hewlett Packard Integrity mainframes in our data centers well ahead of schedule.
31
Table of Contents
Capital Needs
We currently have no outstanding indebtedness, other than the letters of credit issued in the ordinary course of business, as discussed below.
In March 2008, we renewed our three-year credit facility with JPMorgan Chase Bank. The credit facility is available in an aggregate principal amount of up to $12.5 million for working capital and general corporate purposes, maturing on March 31, 2011. Approximately $3.4 million of the credit facility has been utilized for standby letters of credit issued during the ordinary course of business as of August 31, 2009. We are obligated to pay a commitment fee on the unused portion of the facility at a weighted average annual rate of 0.125%. The facility also contains covenants that, among other things, require us to maintain minimum levels of consolidated net worth and certain leverage and fixed charge ratios.
As of August 31, 2009 and 2008, we maintained a zero debt balance and were in compliance with all associated covenants.
Off-Balance Sheet Arrangements
We do not have any off-balance sheet arrangements as defined in Item 303(a)(4)(ii) of SEC Regulation S-K as of August 31, 2009, 2008 or 2007.
Contractual Obligations
Fluctuations in our operating results, the degree of success of our accounts receivable collection efforts, the timing of tax and other payments as well as necessary capital expenditures to support growth of our operations will impact our liquidity and cash flows in future periods. The effect of our contractual obligations on our liquidity and capital resources in future periods should be considered in conjunction with the factors mentioned here.
The following table summarizes our significant contractual obligations as of August 31, 2009 and the corresponding effect that these obligations will have on our liquidity and cash flows in future periods (in thousands):
| Payments due by period | |||||||||||||||
| 2010 | 2011-2012 | 2013-2014 | 2015 and thereafter | Total | |||||||||||
| Note payable |
$ | — | $ | — | $ | — | $ | — | $ | — | |||||
| Operating leases (1) |
20,778 | 40,588 | 33,467 | 57,669 | 152,502 | ||||||||||
| Purchase obligations (2) |
39,694 | 2,399 | — | — | 42,093 | ||||||||||
| Deferred rent and other non-current liabilities |
22,714 | — | — | — | 22,714 | ||||||||||
| Total by period |
$ | 83,186 | $ | 42,987 | $ | 33,467 | $ | 57,669 | $ | 217,309 | |||||
| Non-current taxes payable and deferred taxes (3) |
10,231 | ||||||||||||||
| Total contractual obligations |
$ | 227,540 | |||||||||||||
| (1) | At August 31, 2009, we leased office space in the U.S. in New York, New York; Boston, Massachusetts; Chicago, Illinois; Manchester, New Hampshire; Reston, Virginia; Austin, Texas; San Mateo and Santa Monica, California; Newark, New Jersey; and Tuscaloosa, Alabama. Outside the U.S. our operations are conducted in leased office space in London, England; Paris and Avon, France; Amsterdam, the Netherlands; Frankfurt, Germany; Milan, Italy; Tokyo, Japan; Hong Kong; Hyderabad and Mumbai, India; Sydney, Australia; and Metro Manila, the Philippines. The leases expire on various dates through March 2021. Operating lease amounts include future minimum lease payments under all our non-cancelable operating leases with an initial term in excess of one year. |
| (2) | Purchase obligations represent payment due in future periods in respect of commitments to our various data vendors as well as commitments to purchase goods and services such as telecommunication and computer maintenance services. |
| (3) | Non-current income taxes payable of $6.4 million and non-current deferred tax liabilities of $3.8 million have been included only in the total column in the preceding table due to uncertainty regarding the timing of future payments. Non-current income taxes payable includes uncertain tax positions (see Note 14 to the Consolidated Financial Statements) partially offset by payments and certain other items. |
Purchase orders do not necessarily reflect a binding commitment but are merely indicative of authorizations and intention to conclude purchases in the future. For the purpose of this tabular disclosure, purchase obligations for goods and services are defined as agreements that are enforceable and legally binding on us and that specify all significant terms, including: fixed or minimum quantities to be purchased; fixed, minimum or variable price provisions; and the approximate timing of the transaction. It is expected that all the contractual obligations noted in the table will be funded from existing cash and cash flows from operations.
32
Table of Contents
Expected timing pertaining to the contractual obligations included in the table above has been estimated based on information currently available. The amounts paid and timing of those payments may differ based on when the goods and services provided by our vendors to whom we are contractually obligated are actually received as well as due to changes to agreed upon amounts for any of our obligations.
Share Repurchase Program
On March 16, 2009, our Board of Directors approved an expansion of the existing share repurchase program by an additional $100 million. During fiscal 2009, we repurchased 2.2 million shares for $103.3 million under the program. Including the expansion, $102 million remains authorized for future share repurchases as of August 31, 2009. Repurchases will be made from time to time in the open market and privately negotiated transactions, subject to market conditions. No minimum number of shares to be repurchased has been fixed. There is no timeframe to complete the repurchase program and it is expected that share repurchases will be paid using existing and future cash generated by operations.
We expect that for the next year, our operating expenses will continue to constitute a significant use of cash flow. In addition, we may use cash to fund other acquisitions, repurchase additional common stock, or invest in other businesses when opportunities arise. Based upon the predominance of our revenues from recurring sources and current expectations, we believe that our cash and cash equivalents, cash generated from operations and availability under our credit facility will be sufficient to satisfy our working capital needs, capital expenditures, dividend payments, stock repurchases and financing activities for the next year.
On January 25, 2008, our Board of Directors approved an expansion of the existing share repurchase program by an additional $125 million. At that time, we completed the $100 million expansion to the existing share repurchase program authorized by the Board on March 19, 2007. Repurchases will be made from time to time in the open market and privately negotiated transactions, subject to market conditions. No minimum number of shares to be repurchased has been fixed. There is no timeframe to complete the repurchase program and it is expected that share repurchases will be paid using existing and future cash generated by operations. During fiscal 2008, we repurchased 1.3 million shares for $77 million under the program. At August 31, 2008, $105 million remained authorized for future share repurchases.
Dividends
On May 12, 2009, our Board of Directors approved an 11% increase in the regular quarterly dividend, beginning with our dividend payment in June 2009 of $0.20 per share, or $0.80 per share per annum. The cash dividend of $9.4 million was paid on June 16, 2009, to common stockholders of record on May 29, 2009. On August 13, 2009, a regular quarterly dividend of $0.20 per share was announced. The cash dividend was paid on September 15, 2009, to common stockholders of record on August 31, 2009. Future cash dividends will be paid using our existing and future cash generated by operations.
Critical Accounting Estimates
We consider an accounting estimate to be critical if: (i) the accounting estimate requires us to make assumptions about matters that were highly uncertain at the time the accounting estimate was made, and (ii) changes in the estimate that are reasonably likely to occur from period to period, or use of different estimates that we reasonably could have used in the current period, would have a material impact on our financial condition or results of operations. Management has discussed the development and selection of these critical accounting estimates with the Audit Committee of our Board of Directors. In addition, there are other items within our financial statements that require estimation, but are not deemed critical as defined above. Changes in estimates used in these and other items could have a material impact on our financial statements.
Receivable Reserves
Our client base has generally been of a high quality and, as such, we have not historically experienced a high level of credit-related write-offs. Aged client receivables are analyzed each month and our collection efforts are directed accordingly. We review recent history of client receivable write-offs, analyze trends in aged client receivables and general market conditions to estimate our accounts receivable reserve. In accordance with this policy, our receivable reserve was $1.7 million as of August 31, 2009 and 2008, respectively. Actual cancellations and billing adjustments could differ from those estimated amounts and could have an impact on the financial statements of higher or lower expense. A 10% change in actual cancellations and billing adjustments during fiscal 2009 and 2008 would have affected our receivable reserves by approximately $0.1 million in both years.
33
Table of Contents
Valuation of Goodwill
We evaluate goodwill at the reporting unit level for impairment annually and whenever events or changes in circumstances indicate the carrying value of the goodwill may not be recoverable. We complete our impairment evaluation by performing internal valuation analyses and consider other publicly available market information. We determined that there were three reporting units during fiscal years 2009, 2008 and 2007, which are consistent with the operating segments reported because there is no discrete financial information available for the subsidiaries within each operating segment. Our reporting units evaluated for potential impairment during fiscal years 2009, 2008 and 2007 were U.S., Europe and Asia Pacific, which reflects the level of internal reporting we use to manage our business and operations. We performed our annual goodwill impairment test during the fourth quarter of each of fiscal years 2009, 2008 and 2007 and determined that there had been no impairment. The carrying value of goodwill as of August 31, 2009, was $181.4 million.
We determine fair value using the discounted cash flows model. This analysis contains uncertainties because it requires management to make assumptions and to apply judgment to estimate industry economic factors including market conditions, legal and technological factors and the profitability of future business strategies. It is our policy to conduct impairment testing based on our current business strategy in light of present industry and economic conditions, as well as future expectations.
We have not made any material changes in our impairment loss assessment methodology during the past three fiscal years. We do not believe there is a reasonable likelihood that there will be a material change in the future estimates or assumptions we use to test for goodwill impairment losses. However, if actual results are not consistent with our estimates and assumptions, we may be exposed to an impairment charge that could be material. Future events could cause us to conclude that indicators of impairment do exist and that goodwill associated with our previous acquisitions is impaired, which could result in an impairment loss in our Consolidated Statements of Income and a write-down of the related asset.
Depreciable Lives of Property, Equipment and Leasehold Improvements
The net book value of our property, equipment and leasehold improvements at August 31, 2009 was $88.4 million, representing 14% of our consolidated total assets. Depreciation expense for the year ended August 31, 2009 was $26.1 million, or 6% of total operating expenses. Management’s judgment is required in the determination of the estimated depreciable lives that are used to calculate the annual depreciation expense and accumulated depreciation.
Property, equipment and leasehold improvements are recorded at cost and depreciated over the assets’ estimated useful lives on a straight-line basis for financial reporting purposes. The estimated useful life represents the projected period of time that the asset will be productively employed by us and is determined by management based on many factors, including historical experience with similar assets, technological life cycles and scheduled enhancements and upgrades. A residual value is estimated at the time of asset acquisition and evaluated on a continual basis and as circumstances warrant. The determination of a residual value is the anticipated fair market value of the acquired asset at the date of disposal or sale based on available market conditions. Circumstances and events relating to these assets, such as system upgrades, are monitored to ensure that changes in asset lives, residual values and impairments (see “Long-lived Assets” below) are identified and prospective depreciation expense is adjusted (or an impairment charge recorded) accordingly.
Long-lived Assets
Long-lived assets, comprised of property, equipment, leasehold improvements and identifiable intangible assets, are evaluated for impairment whenever events or changes in circumstances indicate that the carrying value may not be recoverable. Factors that may cause an impairment review include significant changes in technology that make current computer-related assets that we use in our operations obsolete or less useful and significant changes in the way we use these assets in our operations. When evaluating long-lived assets for potential impairment, we first compare the carrying value of the asset to the asset’s estimated future cash flows (undiscounted and without interest charges). If the estimated future cash flows are less than the carrying value of the asset, we calculate an impairment loss. The impairment loss calculation compares the carrying value of the asset to the asset’s estimated fair value, which may be based on estimated future cash flows (discounted and with interest charges). We recognize an impairment loss if the amount of the asset’s carrying value exceeds the asset’s estimated fair value. If we recognize an impairment loss, the adjusted carrying amount of the asset becomes its new cost basis. The new cost basis will be depreciated (amortized) over the remaining useful life of that asset. Using the impairment evaluation methodology described herein, there have been no long-lived asset impairment charges for each of the last three years. The carrying value of long-lived assets as of August 31, 2009, was $134.7 million.
Our impairment loss calculations contain uncertainties because they require management to make assumptions and to apply judgment to estimate future cash flows and asset fair values, including forecasting useful lives of the assets and selecting the discount rate that reflects the risk inherent in future cash flows. We have not made any material changes in our impairment
34
Table of Contents
loss assessment methodology during the past three fiscal years. We do not believe there is a reasonable likelihood that there will be a material change in the estimates or assumptions we use to calculate long-lived asset impairment losses. However, if actual results are not consistent with our estimates and assumptions used in estimating future cash flows and asset fair values, we may be exposed to losses that could be material.
Estimated Tax Provision and Tax Contingencies
We are subject to income taxes in the U.S. and numerous foreign jurisdictions. Our tax provision is an estimate based on our understanding of laws in Federal, state and foreign tax jurisdictions. These laws can be complicated and are difficult to apply to any business including ours. The tax laws also require us to allocate our taxable income to many jurisdictions based on subjective allocation methodologies and information collection processes. Our effective tax rates differ from the statutory rate primarily due to the impact of state taxes, foreign operations, R&D and other tax credits, tax audit settlements, incentive-stock options and Section 199 deductions. Our effective tax rate was 31.7%, 33.9%, and 32.7% in fiscal 2009, 2008, and 2007, respectively.
Effective at the beginning of the first quarter of 2008, we adopted FIN 48, Accounting for Uncertainty in Income Taxes, an Interpretation of FASB Statement 109, which provides a comprehensive model for the recognition, measurement and disclosure in financial statements of uncertain income tax positions that a company has taken or expects to take on a tax return. Under FIN 48, we can recognize the benefit of an income tax position only if it is “more-likely-than-not” that the tax position will be sustained upon tax examination, based solely on the technical merits of the tax position as of the reporting date. Otherwise, no benefit can be recognized. The tax benefits recognized are measured based on the largest benefit that has a greater than 50% likelihood of being realized upon ultimate settlement. We will classify the liability for unrecognized tax benefits as current to the extent that we anticipate payment (or receipt) of cash within one year. Additionally, we accrue interest and related penalties, if applicable, on all tax exposures for which reserves have been established consistent with jurisdictional tax laws. Interest and penalties are classified as income tax expense in the financial statements. At adoption, companies must adjust their financial statements to reflect only those tax positions that are more-likely-than-not to be sustained as of the adoption date. Any necessary adjustment is recorded directly to opening retained earnings in the period of adoption and reported as a change in accounting principle. As a result of the adoption of FIN 48, we reduced current taxes payable by $0.2 million and increased non-current deferred tax assets by $1.1 million. The adoption of FIN 48 was accounted for as a cumulative effect of a change in accounting principle and accordingly, increased retained earnings by $1.3 million. See Note 14 to the Consolidated Financial Statements for additional information.
As of August 31, 2009, we have gross unrecognized tax benefits totaling $6.4 million, including $1.0 of accrued interest, recorded as non-current taxes payable in the Statement of Financial Condition. Unrecognized tax benefits represent tax positions taken on tax returns but not yet recognized in the consolidated financial statements. If recognized, essentially all of the unrecognized tax benefits and related interest would be recorded as a benefit to tax expense on the consolidated statement of income. Audits by five tax authorities are currently ongoing. Significant judgment is required in evaluating our uncertain tax positions and determining our provision for income taxes. Although we believe our reserves are reasonable, no assurance can be given that the final tax outcome of these matters will not be different from that which is reflected in our historical income tax provisions and accruals. We adjust these reserves in light of changing facts and circumstances, such as the closing of a tax audit or the refinement of an estimate. To the extent that the final tax outcome of these matters is different than the amounts recorded, such differences will affect the provision for income taxes in the period in which such determination is made. The provision for income taxes includes the effect of reserve provisions and changes to reserves that are considered appropriate, as well as the related net interest.
Significant judgment is also required in determining any valuation allowance recorded against deferred tax assets. In assessing the need for a valuation allowance, we consider all available evidence, including past operating results, estimates of future taxable income, and the feasibility of tax planning strategies. In the event that we change our determination as to the amount of deferred tax assets that can be realized, we will adjust our valuation allowance with a corresponding effect to the provision for income taxes in the period in which such determination is made.
Our provision for income taxes is subject to volatility and could be adversely impacted by lower earnings than anticipated in countries that have lower tax rates and higher earnings than anticipated in countries that have higher tax rates; by changes in the valuation of our deferred tax assets and liabilities; by expiration of or lapses in the R&D tax credit laws; by transfer pricing adjustments including the post-acquisition integration of purchased intangible assets from certain acquisitions; by tax effects of nondeductible compensation; by tax costs related to intercompany realignments; or by changes in tax laws, regulations, or accounting principles, including accounting for uncertain tax positions or interpretations of them. Significant judgment is required to determine the recognition and measurement attribute prescribed in FIN 48. In addition, FIN 48 applies to all income tax positions, including the potential recovery of previously paid taxes, which if settled unfavorably could adversely affect our provision for income taxes or additional paid-in capital. Further, as a result of certain ongoing
35
Table of Contents
employment and capital investment actions and commitments, our income in certain countries is subject to reduced tax rates and in some cases is wholly exempt from tax. Our failure to meet these commitments could adversely affect our provision for income taxes. In addition, we are subject to the continuous examination of our income tax returns by the Internal Revenue Service and other tax authorities. We regularly assess the likelihood of adverse outcomes resulting from these examinations to determine the adequacy of our provision for income taxes. There can be no assurance that the outcomes from these continuous examinations will not have an adverse impact on our operating results and financial condition.
Accrued Compensation
In conformity with generally accepted accounting principles, we make significant estimates in determining our accrued compensation. Approximately 20% of our employee incentive compensation programs are discretionary. We conduct a final review of Company and departmental individual performance each year end to determine the amount of discretionary employee compensation. We also review compensation throughout the year to determine how overall performance tracks against management’s expectations. Management takes these and other factors, including historical performance, into account in reviewing accrued compensation estimates quarterly and adjusting accrual rates as appropriate. The amount of the variable employee compensation recorded within accrued compensation as of August 31, 2009 was $32.0 million.
Investment Impairments
We maintain a portfolio of investments that is managed to preserve principal. Pursuant to our investment guidelines established, our investments attempt to achieve high levels of credit quality, liquidity and diversification. The weighted average duration of our portfolios is managed not to exceed two years. Eligible investments include obligations issued by the U.S. Treasury and other governmental agencies, money market securities and highly rated commercial paper to be held in the custody of major financial institutions. Investments such as puts, calls, strips, straddles, short sales, options, futures, commodities, precious metals or investments on margin are not permitted under our investment guidelines. All investments are denominated in U.S. dollars. We did not hold any investments as of August 31, 2009.
We recognize an impairment charge when a decline in the fair value of our investments below the cost basis is judged to be other-than-temporary. We consider various factors in determining whether to recognize an impairment charge, including the length of time and extent to which the fair value has been less than our cost basis, the financial condition and near-term prospects of the investee, and our intent and ability to hold the investment for a period of time sufficient to allow for any anticipated recovery in market value. Our ongoing consideration of these factors could result in additional impairment charges in the future, which could adversely affect our net income. There were no impairment charges on our investments during fiscal 2009, 2008, or 2007. Our cash and investment portfolio did not experience any significant realized or unrealized losses as a result of counterparty credit risk or ratings change during fiscal 2009, 2008 or 2007.
Stock-Based Compensation
We have an employee stock-based compensation plan, which includes share-based payment awards to employees, a non-employee director’s plan and an employee stock purchase plan. See Note 12 and Note 13 to our Notes to Consolidated Financial Statements, included in Item 8, Financial Statements and Supplementary Data, of this Annual Report on Form 10-K, for a complete discussion of our stock-based compensation programs.
We account for stock-based compensation under the provisions of SFAS 123(R), Share-Based Payment. SFAS 123(R) requires the measurement and recognition of compensation expense for all share-based payment awards made to employees and directors including employee stock options and employee stock purchases related to the employee stock purchase plan based on estimated fair values of the share awards that are scheduled to vest during the period.
The following table summarizes stock-based compensation expense under SFAS 123(R) for the twelve months ended August 31, 2009, 2008 and 2007 (in thousands):
| 2009 | 2008 | 2007 | ||||||||||
| Stock-based compensation |
$ | 13,623 | $ | 13,651 | $ | 9,123 | ||||||
| Tax impact of stock-based compensation |
(4,550 | ) | (4,682 | ) | (3,129 | ) | ||||||
| Stock-based compensation, net of tax |
$ | 9,073 | $ | 8,969 | $ | 5,994 | ||||||
| Net income, including stock-based compensation |
$ | 144,950 | $ | 125,017 | $ | 109,567 | ||||||
| Diluted earnings per common share, as reported |
$ | 2.97 | $ | 2.50 | $ | 2.14 | ||||||
| Impact on diluted earnings per common share |
$ | (0.19 | ) | $ | (0.18 | ) | $ | (0.12 | ) | |||
Stock-based compensation recognized in the Consolidated Statements of Income during fiscal 2009, 2008 and 2007 has been reduced for estimated forfeitures. SFAS 123(R) requires forfeitures to be estimated at the time of grant and revised, if necessary, in subsequent periods if actual forfeitures differ from those estimates. Forfeitures were estimated based primarily on historical experience.
36
Table of Contents
We determine the fair value of our stock option awards at the date of grant using a lattice-binomial model. We review our assumptions to determine the fair value of stock-based compensation awards. Option-pricing models require management to make assumptions and to apply judgment to determine the fair value of our awards. These assumptions and judgments include estimating the future volatility of our stock price, expected dividend yield, future option forfeitures and future employee stock option exercise behaviors. Changes in these assumptions can materially affect the fair value estimate.
Performance-based Stock Options
Performance-based stock options require management to make assumptions regarding the likelihood of achieving our performance targets. The number of performance-based options that vest will be predicated on us achieving performance levels for both organic ASV and diluted earnings per share during the two fiscal years subsequent to the grant date. Dependent on the financial performance levels attained by us during the two subsequent fiscal years, 0%, 20%, 60% or 100% of the performance-based stock options will vest to the grantees of those stock options. There is no current guarantee however that such options will vest in whole or in part.
August 2006 Performance-based Option Grant Review
In August 2006, we granted 924,989 performance-based employee stock options. During the second quarter of fiscal 2008, we estimated that it was probable we would achieve organic ASV and diluted earnings per share growth of at least 20% on a compounded annual basis for the two years ended August 31, 2008. This reflected a higher performance level than previously estimated and accordingly increased the number of options that was estimated to vest at the end of fiscal 2008. The change in estimate required us to record a pre-tax charge of $2.4 million in the second quarter of fiscal 2008 and resulted in stock-based compensation expense of $3.1 million to be recognized over the next three years as of August 31, 2008. We achieved organic ASV and diluted earnings per share growth of at least 20% on a compounded annual basis for the two years ended August 31, 2008 and as such, 60% of the initial 924,989 performance-based employee stock options granted will vest and the remainder were recorded as forfeitures.
August 2007 Performance-based Option Grant Review
In August 2007, we granted 896,194 performance-based employee stock options. None of these performance-based stock options granted will vest because we did not achieve certain performance levels for both organic ASV and diluted earnings per share during the two fiscal years ended August 31, 2009. These performance-based options were recorded as forfeitures in August 2009.
August 2008 Performance-based Option Grant Review
In August 2008, we granted 1,058,981 performance-based employee stock options. The number of performance-based options that vest is based on us achieving performance levels for both organic ASV and diluted earnings per share during the two fiscal years ended August 31, 2010. At August 31, 2009, we estimated that none of the performance-based stock options will vest. This results in zero unamortized stock-based compensation expense as of August 31, 2009. Our estimate considers the current difficult economic conditions and the potential adverse impact on many of our clients from the dislocation in the global equity and credit markets. A change in the actual financial performance levels achieved by us could result in the following changes to our current estimate of the vesting percentage and related expense (in thousands):
| Vesting Percentage |
Total Unamortized Stock-based Compensation Expense at August 31, 2009 |
One-time Adjustment* |
Average Remaining Quarterly Expense to be Recognized | |||||||
| 0 | % | $ | — | $ | — | $ | — | |||
| 20 | % | $ | 2,410 | $ | 1,103 | $ | 150 | |||
| 60 | % | $ | 7,230 | $ | 3,309 | $ | 450 | |||
| 100 | % | $ | 12,050 | $ | 5,515 | $ | 750 | |||
| * | Amounts represent the one-time cumulative adjustment to be recorded if there had been a change in the vesting percentage as of August 31, 2009. The one-time cumulative adjustment increments each quarter by the amount stated in the average remaining quarterly expense to be recognized column. |
New Accounting Pronouncements
See Note 2 to the consolidated financial statements for a full description of recent accounting pronouncements, including the expected dates of adoption, which we include here by reference.
37
Table of Contents
Recent Market Trends
In the ordinary course of business, we are exposed to financial risks involving equity, foreign currency and interest rate fluctuations. Since September 1, 2008, major equity indices (e.g., Dow Jones Industrials, Russell 1000, MSCI EAFE, S&P 500 and NASDAQ Composite) have experienced declines greater than 15% coupled with increased levels of volatility. A prolonged decline in the equity markets could impact the size and buying power of many of our clients.
We derive 82% of our revenues from investment management clients. The prosperity of these clients is tied to equity assets under management. An equity market decline not only depresses assets under management but could cause a significant increase in redemption requests to move money out of equities and into other asset classes. Moreover, extended declines in the equity markets may reduce new fund or client creation resulting in lower demand for services from investment managers.
While increased use of our services among hedge funds is not a significant driver of our recent revenue growth, we do have more hedge fund clients today than three years ago. The decline in the equity markets could increase the normal rate of hedge fund closures and increase asset redemption rates in the near term. Many hedge funds rely on performance fees and utilize leverage. In addition, the rate of closure related to small hedge funds may increase if they were relying on performance fees to cover operating costs.
Our sell-side clients account for approximately 18% of our revenues. A significant portion of these revenues relate to services deployed by large, bulge bracket banks. The credit crisis that began in August 2007 continues to impact many of the large banking clients due to the amount of leverage deployed in past operations. Clients such as Bear Stearns, Lehman Brothers, Merrill Lynch and Wachovia were purchased by other firms as their viability as stand-alone entities came into question. More of our clients could encounter similar problems. The recent lack of confidence in the global banking system caused declines in merger and acquisitions funded by debt. Additional turmoil, consolidation and business failures in the global investment banking sector could adversely affect FactSet’s financial results and future growth.
We service equity research and M&A departments. These are low risk businesses that do not deploy leverage and will likely continue to operate far into the future and should represent a larger percentage of the overall revenues of our clients. Regardless, the size of banks in general is shrinking as they deleverage their balance sheets and adjust their expense bases to future revenue opportunities. Our revenues may decline if banks including those involved in recent merger activity significantly reduce headcount in the areas of corporate M&A and equity research to compensate for the issues created by other departments.
Historically, the correlation between the results of our operations and the performance of the global equity markets has not been one to one. Today, we believe that our market opportunity may be 10 times our current size even if the global equity markets, which we service, shrink by 15%. Difficult market conditions may increase the value of our ability to consolidate services for clients, including deploying real-time news and quotes, and may help advance the sales of proprietary content.
Forward-Looking Factors
Forward-Looking Statements
In addition to current and historical information, this Annual Report on Form 10-K, including Management’s Discussion and Analysis of Financial Condition and Results of Operations, contains forward-looking statements regarding future events and our future results that are based on management’s current expectations, estimates, forecast and projections about the industries in which we operate and the beliefs and assumptions of our management. All statements, other than statements of historical facts, are statements that could be deemed forward-looking statements. These include statements about our strategy for growth, product development, market position, subscriptions and expected expenditures and financial results. Forward-looking statements may be identified by words like “expects,” “anticipates,” “plans,” “intends,” “projects,” “should,” “indicates,” “continues,” “ASV,” “believes,” “estimates,” “may” and similar expressions. In addition, any statements that refer to projections of our future financial performance, our anticipated growth, trends in our business and other characterizations of future events or circumstances are forward-looking statements. Readers are cautioned that these forward-looking statements are only predictions and not guarantees of future performance and involve a number of risks, uncertainties and assumptions. Therefore, actual results may differ materially from what is expressed or forecasted in such forward-looking statements. We will publicly update forward-looking statements as a result of new information or future events in accordance with applicable Securities and Exchange Commission regulations.
We intend that all forward-looking statements we make will be subject to safe harbor protection of the federal securities laws as found in Section 27A of the Securities Act of 1933 and Section 21E of the Securities Exchange Act of 1934.
38
Table of Contents
These statements involve certain known and unknown risks and uncertainties that could cause our actual results to differ materially from those expressed or implied in our forward-looking statements. Such risks and uncertainties include, among others, those listed in Part 1 Item 1A, Risk Factors of this Annual Report on Form 10-K. We do not intend, and undertake no obligation, to update any of our forward-looking statements after the date of this Report to reflect actual results or future events or circumstances.
Dividend Payment
On August 13, 2009, a regular quarterly dividend of $0.20 per share was announced. The cash dividend was paid on September 15, 2009, to common stockholders of record on August 31, 2009. Future cash dividends will be paid using our existing and future cash generated by operations.
Business Outlook
The following forward-looking statements reflect our expectations as of September 22, 2009. Given the number of risk factors, uncertainties and assumptions discussed below, actual results may differ materially. We do not intend to update our forward-looking statements until our next quarterly results announcement, other than in publicly available statements.
First Quarter Fiscal 2010 Expectations
| • | Revenues are expected to range between $152 million and $157 million. The fourth quarter of fiscal 2009 included $0.8 million in non-subscription revenues from workstations sold to summer interns. |
| • | Diluted earnings per share is expected to range between $0.73 and $0.75. |
Full Year Fiscal 2010
| • | Capital expenditures, net of landlord contributions is expected to range between $20 million and $26 million. |
39
Table of Contents
| ITEM 7A. | QUANTITATIVE AND QUALITATIVE DISCLOSURES ABOUT MARKET RISK |
Our financial position is exposed to a variety of risks including foreign currency exchange risk, interest rate risk and equity price risk.
Foreign Currency Exchange Risk
Certain wholly owned subsidiaries within the European and Asia Pacific segments operate under a functional currency different from the U.S. dollar. The financial statements of these foreign subsidiaries are translated into U.S. dollars using period-end rates of exchange for assets and liabilities and average rates for the period for revenues and expenses. Translation gains (losses) that arise from translating assets, liabilities, revenues and expenses of foreign operations are recorded in accumulated other comprehensive income as a component of stockholders’ equity. Transaction gains (losses) that arise from the effect of exchange rate changes on transactions denominated in currencies other than the functional currency are included in determining net income for the period in which exchange rates change.
Our non-U.S. dollar denominated revenues expected to be recognized over the next twelve months are estimated to be $18 million while our non-U.S. dollar denominated expenses are $119 million, which translates into a net foreign currency exposure of $101 million per year. To the extent that our international activities recorded in local currencies increase in the future, our exposure to fluctuations in currency exchange rates will correspondingly increase. To limit our exposure related to the effects of foreign exchange rate fluctuations, we may continue to utilize foreign currency forward contracts. See Note 5 to the Consolidated Financial Statements for additional analysis of our foreign currency exchange rate risk.
Interest Rate Risk
The fair market value of our cash and investment portfolio at August 31, 2009 was $216 million. Our cash and investments portfolio is invested in U.S. treasury money market funds and U.S. government agency securities. It is anticipated that the fair market value of our portfolio will continue to be immaterially affected by fluctuations in interest rates. Preservation of principal is the primary goal of our investment policy. Pursuant to our established investment guidelines, we try to achieve high levels of credit quality, liquidity and diversification. Our investment policy dictates that the weighted average duration of short-term investments may not exceed two years. Our investment guidelines do not permit us to invest in puts, calls, strips, short sales, straddles, options, commodities, precious metals, futures or investments on margin. Because we have a restrictive investment policy, our financial exposure to fluctuations in interest rates is expected to remain low. We do not believe that the value or liquidity of our cash and investments have been significantly impacted by the recent credit crisis.
Equity Price Risk
We are exposed to various economic and financial risks associated with equity and foreign currency markets as well as risks related to interest rate fluctuations during the normal course of business. The major equity indices (for example Dow Jones Industrials, Russell 1000, NASDAQ Composite, MSCI EAFE, and S&P 500) have experienced significant volatility during the past five years. Since September 1, 2008, the major equity indices have declined by more than 15% with increased levels of volatility. The demand for our solutions could be disproportionately affected by the recent downturns in the global equity and credit markets, which may cause clients and potential clients to exit the industry or delay, cancel or reduce any planned expenditures for integrated financial information and analytical applications software to support the global investment community. Continued volatility in general economic and market conditions is still possible in the near future. A continued decline in the worldwide markets could adversely impact a significant number of our clients (primarily investment management firms and investment banks) and increase the likelihood of personnel and spending reductions among our existing and potential clients. In addition, we monitor our clients’ credit worthiness and we believe that our current group of clients are credit worthy and represent no abnormal business risk.
40
Table of Contents
| ITEM 8. | FINANCIAL STATEMENTS AND SUPPLEMENTARY DATA |
Index to Consolidated Financial Statements
| Page(s) | ||
| Consolidated Financial Statements: |
||
| Management’s Statement of Responsibility for Financial Statements |
42 | |
| Management’s Report on Internal Control over Financial Reporting |
42 | |
| 43 | ||
| Consolidated Statements of Income for the years ended August 31, 2009, 2008 and 2007 |
44 | |
| Consolidated Statements of Financial Condition at August 31, 2009 and 2008 |
45-46 | |
| Consolidated Statements of Cash Flows for the years ended August 31, 2009, 2008 and 2007 |
47 | |
| 48 | ||
| 49 | ||
| Financial Statement Schedule: |
||
| 78 | ||
41
Table of Contents
Management’s Statement of Responsibility for Financial Statements
FactSet’s consolidated financial statements are prepared by management, which is responsible for their fairness, integrity and objectivity. The accompanying financial statements have been prepared in conformity with accounting principles generally accepted in the U.S. applied on a consistent basis and include amounts that are estimates and judgments. All historical financial information in this Annual Report on Form 10-K is consistent with the accompanying financial statements.
FactSet maintains accounting systems, including internal accounting controls, designed to provide reasonable assurance of the reliability of financial records and the protection of assets. The concept of reasonable assurance is based on recognition that the cost of a system should not exceed the related benefits. The effectiveness of those systems depends primarily upon the careful selection of financial and other managers, clear delegation of authority and assignment of accountability, inculcation of high business ethics and conflict-of-interest standards, policies and procedures for coordinating the management of corporate resources, and the leadership and commitment of top management. In compliance with Section 404 of the Sarbanes-Oxley Act of 2002, FactSet assessed its internal control over financial reporting and issued a report (see below).
PricewaterhouseCoopers LLP, an independent registered public accounting firm, has completed an integrated audit of FactSet’s fiscal 2009, 2008 and 2007 consolidated financial statements and of its internal control over financial reporting as of August 31, 2009 in accordance with the standards of the Public Company Accounting Oversight Board (United States) as stated in their report appearing on page 43.
The Audit Committee of the Board of Directors, which consists solely of independent non-employee directors, is responsible for overseeing the functioning of the accounting system and related controls and the preparation of annual financial statements. The Audit Committee periodically meets with management and the independent accountants to review and evaluate their accounting, auditing and financial reporting activities and responsibilities, including management’s assessment of internal control over financial reporting. The independent registered public accounting firm has full and free access to the Audit Committee and met with the committee, with and without management present.
Management’s Report on Internal Control Over Financial Reporting
Management is responsible for establishing and maintaining adequate internal control over financial reporting as defined in Rules 13a-15(f) and 15d-15(f) under the Exchange Act. Under the supervision and with the participation of the Company’s management, including its principal executive officer and principal financial officer, the Company conducted an evaluation of the effectiveness of its internal control over financial reporting based on criteria established in the framework in Internal Control—Integrated Framework issued by the Committee of Sponsoring Organizations of the Treadway Commission. Based on this evaluation, the Company’s management concluded that its internal control over financial reporting was effective as of August 31, 2009. PricewaterhouseCoopers LLP, an independent registered public accounting firm, has audited the effectiveness of FactSet’s internal control over financial reporting and has issued a report on the Company’s internal control over financial reporting, which is included in their report on the following page.
Because of its inherent limitations, internal control over financial reporting may not prevent or detect misstatements. Also, projections of any evaluation of effectiveness to future periods are subject to the risk that controls may become inadequate because of changes in conditions, or that the degree of compliance with the policies or procedures may deteriorate.
| /s/ PHILIP A. HADLEY | /s/ MAURIZIO NICOLELLI | |||
| Philip A. Hadley | Maurizio Nicolelli | |||
| Chairman of the Board of Directors and Chief Executive Officer | Senior Vice President and Director of Finance | |||
| (Principal Executive Officer) | (Principal Financial Officer) | |||
| October 30, 2009 | October 30, 2009 |
42
Table of Contents
Report of Independent Registered Public Accounting Firm
To the Board of Directors and Stockholders of FactSet Research Systems Inc.
In our opinion, the consolidated financial statements listed in the accompanying index present fairly, in all material respects, the financial position of FactSet Research Systems Inc. and its subsidiaries at August 31, 2009 and 2008, and the results of their operations and their cash flows for each of the three years in the period ended August 31, 2009 in conformity with accounting principles generally accepted in the United States of America. In addition, in our opinion, the financial statement schedule listed in the accompanying index presents fairly, in all material respects, the information set forth therein when read in conjunction with the related consolidated financial statements. Also in our opinion, the Company maintained, in all material respects, effective internal control over financial reporting as of August 31, 2009, based on criteria established in Internal Control - Integrated Framework issued by the Committee of Sponsoring Organizations of the Treadway Commission (COSO). The Company’s management is responsible for these financial statements and financial statement schedule, for maintaining effective internal control over financial reporting and for its assessment of the effectiveness of internal control over financial reporting, included in the accompanying Management’s Report on Internal Control Over Financial Reporting. Our responsibility is to express opinions on these financial statements, on the financial statement schedule, and on the Company’s internal control over financial reporting based on our integrated audits. We conducted our audits in accordance with the standards of the Public Company Accounting Oversight Board (United States). Those standards require that we plan and perform the audits to obtain reasonable assurance about whether the financial statements are free of material misstatement and whether effective internal control over financial reporting was maintained in all material respects. Our audits of the financial statements included examining, on a test basis, evidence supporting the amounts and disclosures in the financial statements, assessing the accounting principles used and significant estimates made by management, and evaluating the overall financial statement presentation. Our audit of internal control over financial reporting included obtaining an understanding of internal control over financial reporting, assessing the risk that a material weakness exists, and testing and evaluating the design and operating effectiveness of internal control based on the assessed risk. Our audits also included performing such other procedures as we considered necessary in the circumstances. We believe that our audits provide a reasonable basis for our opinions.
As discussed in Notes 2 and 14, the Company adopted the provisions of Financial Accounting Standards Board Interpretation No. 48, Accounting for Uncertainty in Income Taxes on September 1, 2007.
A company’s internal control over financial reporting is a process designed to provide reasonable assurance regarding the reliability of financial reporting and the preparation of financial statements for external purposes in accordance with generally accepted accounting principles. A company’s internal control over financial reporting includes those policies and procedures that (i) pertain to the maintenance of records that, in reasonable detail, accurately and fairly reflect the transactions and dispositions of the assets of the company; (ii) provide reasonable assurance that transactions are recorded as necessary to permit preparation of financial statements in accordance with generally accepted accounting principles, and that receipts and expenditures of the company are being made only in accordance with authorizations of management and directors of the company; and (iii) provide reasonable assurance regarding prevention or timely detection of unauthorized acquisition, use, or disposition of the company’s assets that could have a material effect on the financial statements.
Because of its inherent limitations, internal control over financial reporting may not prevent or detect misstatements. Also, projections of any evaluation of effectiveness to future periods are subject to the risk that controls may become inadequate because of changes in conditions, or that the degree of compliance with the policies or procedures may deteriorate.
| /s/ PRICEWATERHOUSECOOPERS LLP |
| PricewaterhouseCoopers LLP |
| Stamford, Connecticut |
| October 30, 2009 |
43
Table of Contents
Consolidated Statements of Income
(In thousands, except per share data)
| Years Ended August 31, |
2009 | 2008 | 2007 | ||||||
| Revenues |
$ | 622,023 | $ | 575,519 | $ | 475,801 | |||
| Operating expenses |
|||||||||
| Cost of services |
209,364 | 191,239 | 152,797 | ||||||
| Selling, general and administrative |
201,629 | 200,393 | 167,913 | ||||||
| Total operating expenses |
410,993 | 391,632 | 320,710 | ||||||
| Operating income |
211,030 | 183,887 | 155,091 | ||||||
| Other income |
1,092 | 5,160 | 7,785 | ||||||
| Income before income taxes |
212,122 | 189,047 | 162,876 | ||||||
| Provision for income taxes |
67,172 | 64,030 | 53,309 | ||||||
| Net income |
$ | 144,950 | $ | 125,017 | $ | 109,567 | |||
| Basic earnings per common share |
$ | 3.07 | $ | 2.60 | $ | 2.24 | |||
| Diluted earnings per common share |
$ | 2.97 | $ | 2.50 | $ | 2.14 | |||
| Weighted average common shares (Basic) |
47,158 | 48,065 | 48,873 | ||||||
| Weighted average common shares (Diluted) |
48,789 | 50,080 | 51,284 | ||||||
The accompanying notes are an integral part of these consolidated financial statements.
44
Table of Contents
Consolidated Statements of Financial Condition
(In thousands, except share data)
Assets
| At August 31, |
2009 | 2008 | ||||||
| CURRENT ASSETS |
||||||||
| Cash and cash equivalents |
$ | 216,320 | $ | 117,986 | ||||
| Investments |
— | 25,032 | ||||||
| Accounts receivable, net of reserves of $1,712 and $1,681 at August 31, 2009 and 2008, respectively |
62,854 | 74,859 | ||||||
| Prepaid FactSet Fundamentals database updates |
1,787 | 6,377 | ||||||
| Prepaid taxes |
7,415 | 1,090 | ||||||
| Deferred taxes |
4,319 | 3,271 | ||||||
| Other current assets |
6,715 | 5,908 | ||||||
| Total current assets |
299,410 | 234,523 | ||||||
| LONG-TERM ASSETS |
||||||||
| Property, equipment and leasehold improvements, at cost |
161,479 | 142,392 | ||||||
| Less accumulated depreciation and amortization |
(73,100 | ) | (51,279 | ) | ||||
| Property, equipment and leasehold improvements, net |
88,379 | 91,113 | ||||||
| Goodwill |
181,355 | 187,780 | ||||||
| Intangible assets, net |
46,350 | 58,333 | ||||||
| Prepaid FactSet Fundamentals database updates |
— | 2,000 | ||||||
| Deferred taxes |
12,295 | 10,279 | ||||||
| Other assets |
5,348 | 3,246 | ||||||
| TOTAL ASSETS |
$ | 633,137 | $ | 587,274 | ||||
The accompanying notes are an integral part of these consolidated financial statements.
45
Table of Contents
Consolidated Statements of Financial Condition
(In thousands, except share and per share data)
Liabilities and Stockholders’ Equity
| At August 31, |
2009 | 2008 | ||||||
| CURRENT LIABILITIES |
||||||||
| Accounts payable and accrued expenses |
$ | 25,121 | $ | 22,366 | ||||
| Accrued compensation |
41,889 | 38,095 | ||||||
| Deferred fees |
23,005 | 23,531 | ||||||
| Dividends payable |
9,348 | 8,634 | ||||||
| Total current liabilities |
99,363 | 92,626 | ||||||
| Non-Current Liabilities |
||||||||
| Deferred taxes |
3,794 | 5,122 | ||||||
| Taxes payable |
6,437 | 3,905 | ||||||
| Deferred rent and other non-current liabilities |
22,714 | 20,150 | ||||||
| TOTAL LIABILITIES |
$ | 132,308 | $ | 121,803 | ||||
| Commitments and contingencies (See Note 16) |
||||||||
| STOCKHOLDERS’ EQUITY |
||||||||
| Preferred stock, $.01 par value, 10,000,000 shares authorized, none issued |
$ | — | $ | — | ||||
| Common stock, $.01 par value, 100,000,000 shares authorized, 58,071,513 and 57,106,926 shares issued; 46,739,995 and 47,968,758 shares outstanding at August 31, 2009 and 2008, respectively |
581 | 571 | ||||||
| Additional paid-in capital |
248,840 | 206,585 | ||||||
| Treasury stock, at cost 11,331,518 and 9,138,168 shares at August 31, 2009 and 2008, respectively |
(414,995 | ) | (311,248 | ) | ||||
| Retained earnings |
676,626 | 567,381 | ||||||
| Accumulated other comprehensive (loss) income |
(10,223 | ) | 2,182 | |||||
| TOTAL STOCKHOLDERS’ EQUITY |
500,829 | 465,471 | ||||||
| TOTAL LIABILITIES AND STOCKHOLDERS’ EQUITY |
$ | 633,137 | $ | 587,274 | ||||
The accompanying notes are an integral part of these consolidated financial statements.
46
Table of Contents
Consolidated Statements of Cash Flows
(In thousands)
| Years Ended August 31, |
2009 | 2008 | 2007 | |||||||||
| CASH FLOWS FROM OPERATING ACTIVITIES |
||||||||||||
| Net income |
$ | 144,950 | $ | 125,017 | $ | 109,567 | ||||||
| Adjustments to reconcile net income to net cash provided by operating activities |
||||||||||||
| Depreciation and amortization |
34,337 | 30,654 | 28,560 | |||||||||
| Stock-based compensation expense |
13,623 | 13,651 | 9,123 | |||||||||
| Deferred income taxes |
(4,318 | ) | (4,828 | ) | (7,189 | ) | ||||||
| Gain on sale of assets |
(101 | ) | (75 | ) | (62 | ) | ||||||
| Tax benefits from share-based payment arrangements |
(4,374 | ) | (9,572 | ) | (7,393 | ) | ||||||
| Changes in assets and liabilities, net of effects of acquisitions |
||||||||||||
| Accounts receivable, net of reserves |
12,005 | (14,804 | ) | (249 | ) | |||||||
| Accounts payable and accrued expenses |
3,081 | (1,260 | ) | 5,213 | ||||||||
| Accrued compensation |
4,212 | 8,399 | 8,523 | |||||||||
| Deferred fees |
(526 | ) | (2,651 | ) | 1 | |||||||
| Taxes payable, net of prepaid taxes |
1,547 | 7,436 | 3,240 | |||||||||
| Prepaid expenses and other assets |
(3,163 | ) | (3,935 | ) | (417 | ) | ||||||
| Landlord contributions |
2,636 | 1,009 | 2,892 | |||||||||
| Prepaid fundamentals database updates |
5,500 | (8,250 | ) | — | ||||||||
| Other working capital accounts, net |
(1,639 | ) | 2,333 | 4,099 | ||||||||
| Net cash provided by operating activities |
207,770 | 143,124 | 155,908 | |||||||||
| CASH FLOWS FROM INVESTING ACTIVITIES |
||||||||||||
| Acquisition of businesses, net of cash acquired |
— | (75,869 | ) | — | ||||||||
| Proceeds from sales of investments |
25,260 | 44,392 | 17,213 | |||||||||
| Purchases of investments |
— | (52,011 | ) | (17,955 | ) | |||||||
| Purchases of property, equipment and leasehold improvements |
(24,040 | ) | (35,780 | ) | (39,251 | ) | ||||||
| Net cash provided by (used in) investing activities |
1,220 | (119,268 | ) | (39,993 | ) | |||||||
| CASH FLOWS FROM FINANCING ACTIVITIES |
||||||||||||
| Dividend payments |
(34,770 | ) | (25,848 | ) | (14,654 | ) | ||||||
| Repurchase of common stock |
(103,827 | ) | (77,869 | ) | (80,299 | ) | ||||||
| Repayment of note |
— | — | (2,258 | ) | ||||||||
| Proceeds from employee stock plans |
23,804 | 20,562 | 15,612 | |||||||||
| Tax benefits from share-based payment arrangements |
4,374 | 9,572 | 7,393 | |||||||||
| Net cash used in financing activities |
(110,419 | ) | (73,583 | ) | (74,206 | ) | ||||||
| Effect of exchange rate changes on cash and cash equivalents |
(237 | ) | (1,121 | ) | 576 | |||||||
| Net increase (decrease) in cash and cash equivalents |
98,334 | (50,848 | ) | 42,285 | ||||||||
| Cash and cash equivalents at beginning of year |
117,986 | 168,834 | 126,549 | |||||||||
| Cash and cash equivalents at end of year |
$ | 216,320 | $ | 117,986 | $ | 168,834 | ||||||
| Supplemental Disclosure of Cash Flow Information |
||||||||||||
| Cash paid during the year for income taxes |
$ | 64,536 | $ | 54,633 | $ | 48,125 | ||||||
| Supplemental Disclosure of Non-Cash Transactions |
||||||||||||
| Dividends declared, not paid |
$ | 9,348 | $ | 8,634 | $ | 5,802 | ||||||
The accompanying notes are an integral part of these consolidated financial statements.
47
Table of Contents
Consolidated Statements of Changes in Stockholders’ Equity
(In thousands)
| Years Ended August 31, |
2009 | 2008 | 2007 | |||||||||
| COMMON STOCK |
||||||||||||
| Balance, beginning of year |
$ | 571 | $ | 562 | $ | 554 | ||||||
| Common stock issued for employee stock plans (See Note 10 and 11) |
10 | 9 | 8 | |||||||||
| Balance, end of year |
$ | 581 | $ | 571 | $ | 562 | ||||||
| ADDITIONAL PAID-IN CAPITAL |
||||||||||||
| Balance, beginning of year |
$ | 206,585 | $ | 162,561 | $ | 130,033 | ||||||
| Common stock issued for employee stock plans |
24,258 | 20,801 | 16,012 | |||||||||
| Stock-based compensation expense excluding deferred compensation amortization |
13,145 | 13,255 | 8,727 | |||||||||
| Tax benefits from share-based payment arrangements |
4,374 | 9,572 | 7,393 | |||||||||
| Deferred compensation amortization |
478 | 396 | 396 | |||||||||
| Balance, end of year |
$ | 248,840 | $ | 206,585 | $ | 162,561 | ||||||
| TREASURY STOCK |
||||||||||||
| Balance, beginning of year |
$ | (311,248 | ) | $ | (233,372 | ) | $ | (153,073 | ) | |||
| Repurchase of common stock (See Note 10 and 11) |
(103,747 | ) | (77,876 | ) | (80,299 | ) | ||||||
| Balance, end of year |
$ | (414,995 | ) | $ | (311,248 | ) | $ | (233,372 | ) | |||
| RETAINED EARNINGS |
||||||||||||
| Balance, beginning of year |
$ | 567,381 | $ | 469,880 | $ | 377,846 | ||||||
| Cumulative effect of adopting FIN 48 (See Note 14) |
— | 1,290 | — | |||||||||
| Net income |
144,950 | 125,017 | 109,567 | |||||||||
| Dividends |
(35,705 | ) | (28,806 | ) | (17,533 | ) | ||||||
| Balance, end of year |
$ | 676,626 | $ | 567,381 | $ | 469,880 | ||||||
| ACCUMULATED OTHER COMPREHENSIVE (LOSS) INCOME |
||||||||||||
| Balance, beginning of year |
$ | 2,182 | $ | 9,680 | $ | 3,328 | ||||||
| Foreign currency translation adjustments |
(13,390 | ) | (7,317 | ) | 6,349 | |||||||
| Net unrealized (loss) gain on investments, net of tax |
(72 | ) | 25 | 3 | ||||||||
| Net unrealized gain (loss) on cash flow hedges, net of tax |
1,057 | (206 | ) | — | ||||||||
| Balance, end of year |
$ | (10,223 | ) | $ | 2,182 | $ | 9,680 | |||||
| TOTAL STOCKHOLDERS’ EQUITY |
||||||||||||
| Balance, beginning of year |
$ | 465,471 | $ | 409,311 | $ | 358,688 | ||||||
| Cumulative effect of adopting FIN 48 |
— | 1,290 | — | |||||||||
| Net income |
144,950 | 125,017 | 109,567 | |||||||||
| Common stock issued for employee stock plans |
24,268 | 20,810 | 16,020 | |||||||||
| Stock-based compensation expense excluding deferred compensation amortization |
13,145 | 13,255 | 8,727 | |||||||||
| Tax benefits from share-based payment arrangements |
4,374 | 9,572 | 7,393 | |||||||||
| Deferred compensation amortization |
478 | 396 | 396 | |||||||||
| Repurchase of common stock |
(103,747 | ) | (77,876 | ) | (80,299 | ) | ||||||
| Foreign currency translation adjustments |
(13,390 | ) | (7,317 | ) | 6,349 | |||||||
| Net unrealized (loss) gain on investments, net of tax |
(72 | ) | 25 | 3 | ||||||||
| Net unrealized gain (loss) on cash flow hedges, net of tax |
1,057 | (206 | ) | — | ||||||||
| Dividends |
(35,705 | ) | (28,806 | ) | (17,533 | ) | ||||||
| Balance, end of year |
$ | 500,829 | $ | 465,471 | $ | 409,311 | ||||||
The accompanying notes are an integral part of these consolidated financial statements.
48
Table of Contents
Notes to the Consolidated Financial Statements
1. ORGANIZATION AND NATURE OF BUSINESS
FactSet Research Systems Inc. (the “Company” or “FactSet”) is a provider of integrated global financial and economic information, including fundamental financial data on tens of thousands of companies worldwide. FactSet’s applications support workflows for buy and sell-side professionals. These professionals include portfolio managers, research and performance analysts, risk managers, marketing professionals, sell-side equity research professionals, investment bankers and fixed income professionals. The Company’s applications provide users access to company analysis, multicompany comparisons, industry analysis, company screening, portfolio analysis, predictive risk measurements, alphatesting, portfolio optimization and simulation, real-time news and quotes and tools to value and analyze fixed income securities and portfolios.
FactSet combines hundreds of data sets, including content regarding tens of thousands of companies and securities from major markets all over the globe, into a single online platform of information and analytics. Clients have simultaneous access to content from an array of sources, which they can combine and utilize in nearly all of the Company’s applications. FactSet is also fully integrated with Microsoft Office applications such as Excel®, Word® and PowerPoint®. This integration allows its users to create extensive custom reports. The Company’s revenues are primarily derived from month-to-month subscriptions to services, databases and financial applications.
2. SUMMARY OF SIGNIFICANT ACCOUNTING POLICIES
The significant accounting policies of the Company and its subsidiaries are summarized below.
Financial Statement Presentation
The accompanying consolidated financial statements include the accounts of the Company and its wholly owned subsidiaries. All intercompany activity and balances have been eliminated from the consolidated financial statements.
Use of Estimates
The preparation of consolidated financial statements and related disclosures in conformity with accounting principles generally accepted in the U.S. requires management to make estimates and assumptions that affect the reported amounts of assets and liabilities and disclosure of contingent assets and liabilities at the date of the financial statements and the reported amounts of revenues and expenses during the reporting period. Significant estimates have been made in areas that include receivable reserves, valuation of goodwill, useful lives and valuation of fixed and intangible assets, accrued compensation, income and other taxes, stock-based compensation and allocation of purchase price to assets and liabilities acquired. The Company bases its estimates on historical experience and on various other assumptions that are believed to be reasonable, the results of which form the basis for making judgments about the carrying values of assets and liabilities. Actual results could differ from those estimates.
Revenue Recognition
The Company’s revenues are derived from month-to-month subscriptions to services such as workstations (also referred to as users), content and applications. At the option of clients, FactSet services may be paid either in commissions from securities transactions or in cash. To facilitate the payment for services in commissions, the Company’s wholly owned subsidiary, FactSet Data Systems, Inc. (“FDS”), is a member of the Financial Industry Regulatory Authority, Inc. (“FINRA”) and is a registered broker-dealer under Section 15 of the Securities and Exchange Act of 1934. Services paid in commissions are derived from securities transactions introduced and cleared on a fully disclosed basis through a designated clearing broker. A client paying subscription charges on a commission basis directs the clearing broker to credit the commission on the transaction to FDS at the time the client executes a securities transaction. Clients may also direct commissions to unrelated third party brokers and request payment be transmitted to FactSet to pay for its services.
Under the guidance in Staff Accounting Bulletin 104 (“SAB 104”), Revenue Recognition, the Company’s subscriptions represent a single earnings process. Collection of subscription revenues through FDS’s external clearing broker does not represent a separate service or earnings process since FDS is not the principal party to the settlement of the securities transactions for which the clearing broker charges clearing fees. Clearing fees are recorded as a reduction to revenues in the period incurred at the time that a client executes securities transactions through the designated clearing broker. The Company earns the right to recover the clearing fee from its clients at the time the securities transactions are executed, which is the period in which the clearing fees are incurred.
49
Table of Contents
FactSet applies SAB 104 to its business arrangements for revenue recognition. Primarily all clients are invoiced monthly to reflect the actual services provided. Remaining clients are invoiced quarterly, annually or biannually in advance. Subscription revenue is earned each month as the service is rendered to clients on a monthly basis. A provision for billing adjustments and cancellation of services is estimated and accounted for as a reduction of revenue, with a corresponding reduction to accounts receivable. FactSet recognizes revenue when all the following criteria are met:
| • | the client subscribes to FactSet services, |
| • | the FactSet service has been rendered and earned during the month, |
| • | the amount of the subscription is fixed and determinable based on established rates for each product offering, quoted on an annualized basis, and |
| • | collectibility is reasonably assured. |
Cost of Services
Cost of services is composed of cash and stock-based compensation for Company employees within the content collection, consulting, product development, software and systems engineering groups in addition to data costs, amortization of identifiable intangible assets, computer maintenance and depreciation expenses and client-related communication costs.
Selling, General and Administrative
Selling, general and administrative expenses include cash and stock-based compensation for the sales and various other support and administrative departments, travel and entertainment expenses, marketing costs, rent, amortization of leasehold improvements, depreciation of furniture and fixtures, office expenses, professional fees and other expenses.
Earnings per Share
Basic earnings per share (“EPS”) is computed using the weighted average number of common shares outstanding during the period. Diluted net income per share is computed using the weighted average number of common shares and dilutive potential common shares outstanding during the period. Dilutive potential common shares consist of employee stock options and restricted stock. SFAS 128, Earnings per Share, requires that employee equity share options, non-vested shares and similar equity instruments granted by the Company be treated as potential common shares outstanding in computing diluted earnings per share. Diluted shares outstanding include the dilutive effect of in-the-money options which is calculated based on the average share price for each fiscal period using the treasury stock method. Under the treasury stock method, the exercise price paid by the optionee, future stock-based compensation expense that the Company has not yet recognized, and the amount of tax benefits that would be recorded in additional paid-in capital when the award becomes deductible are assumed to be used to repurchase shares.
Fair Value of Financial Instruments
The Company adopted SFAS 157, Fair Value Measurements effective September 1, 2008, which defines fair value as the amount that would be received if an asset was sold or a liability transferred in an orderly transaction between market participants at the measurement date. See Note 3 for further discussion surrounding the fair value of the Company’s financial instruments.
The fair value of certain Company financial instruments, including cash and cash equivalents, accrued compensation, and other current liabilities, approximates the carrying amount because of their short maturities.
Cash and Cash Equivalents
Cash and cash equivalents consist of demand deposits and money market investments with maturities of three months or less at the date of acquisition and are reported at fair value. Cash and cash equivalents are maintained with various financial institutions.
Investments
Investments which have maturities greater than three months from the date of acquisition are classified as available-for-sale securities and are reported at fair value. Fair value of investments is determined from readily available quoted market prices. Unrealized gains and losses on available-for-sale securities are included net of tax in accumulated other comprehensive income in stockholders’ equity. There were no investments recorded on the Company’s consolidated balance sheet as of August 31, 2009.
50
Table of Contents
The Company recognizes an impairment charge when a decline in the fair value of its investments below the cost basis is judged to be other-than-temporary. The Company considers various factors in determining whether to recognize an impairment charge, including the length of time and extent to which the fair value has been less than the Company’s cost basis, the financial condition and near-term prospects of the investee, and the Company’s intent and ability to hold the investment for a period of time sufficient to allow for any anticipated recovery in market value.
Accounts Receivable and Deferred Fees
Amounts that have been earned but not yet paid are reflected on the Consolidated Statements of Financial Condition as accounts receivable, net of reserves. Amounts invoiced in advance or client payments that are in excess of earned subscription revenues are reflected on the Consolidated Statements of Financial Condition as deferred fees. As of August 31, 2009, the amount of accounts receivable that was unbilled totaled $0.5 million, which was billed at the beginning of September 2009.
The Company calculates its receivable reserve through analyzing aged client receivables and reviewing the recent history of client receivable write-offs.
Property, Equipment and Leasehold Improvements
Property, equipment and leasehold improvements are stated at cost, less accumulated depreciation and amortization.
Computers and related equipment are depreciated on a straight-line basis over estimated useful lives of three years or less.
Effective as of the beginning of the fourth quarter of fiscal 2007, the Company elected to change its method of depreciation for furniture and fixtures to straight-line from the double declining balance method. Furniture and fixtures are depreciated over their estimated useful lives between five and seven years. This change did not have a material impact to the Company’s consolidated financial statements. Leasehold improvements are amortized on a straight-line basis over the terms of the related leases or estimated useful lives of the improvements, whichever period is shorter.
The Company performs a test for impairment whenever events or changes in circumstances indicate that the carrying amount of an individual asset or asset group may not be recoverable. Should projected undiscounted future cash flows be less than the carrying amount of the asset or asset group, an impairment charge reducing the carrying amount to fair value is required. Fair value is determined based on the most appropriate valuation technique, including discounted cash flows.
Asset Retirement Obligations
An asset retirement obligation is recognized in the period in which sufficient information exists to determine the fair value of the liability with a corresponding increase to the carrying amount of the related property, plant and equipment which is then depreciated over its useful life. The liability is initially measured at discounted fair value and then accretion expense is recorded in each subsequent period. The Company’s asset retirement obligations are associated with its build-out of office space in London where the Company made significant leasehold improvements and is obligated to remove the leasehold improvements at the end of the lease term. The Company’s asset retirement obligations are not material to its consolidated financial statements.
Goodwill
Goodwill has resulted from the acquisitions of the Insyte, LionShares, Mergerstat, CallStreet, JCF, TrueCourse, DSI, AlphaMetrics, Global Filings, DealMaven and Thomson Fundamentals businesses. Goodwill resulting from the acquisitions of LionShares, Mergerstat, TrueCourse and DSI are income tax-deductible based on the structure of the acquisition. On an ongoing basis, the Company evaluates goodwill at the reporting unit level for indications of potential impairment. Goodwill is tested for impairment based on the present value of discounted cash flows, and, if impaired, written down to fair value based on discounted cash flows. Based on the guidance in SFAS 142, Goodwill and Other Intangible Assets, the Company has determined that there were three reporting units during fiscal years 2009, 2008 and 2007, which are consistent with the operating segments reported under SFAS 131, Disclosures about Segments of an Enterprise and Related Information, because there is no discrete financial information available for the subsidiaries within each operating segment. The Company’s reporting units evaluated for potential impairment during fiscal years 2009, 2008 and 2007 were the U.S., Europe and Asia Pacific, which reflects the level of internal reporting the Company uses to manage its business and operations. The Company performed an annual goodwill impairment test during the fourth quarter of fiscal years 2009, 2008 and 2007 and determined that there had been no impairment.
51
Table of Contents
Intangible Assets
Intangible assets consist of certain acquired content databases, software technology, client relationships, trade names and non-compete agreements resulting from the acquisitions of Insyte (data central application), LionShares (global equity ownership data), Mergerstat (M&A data), CallStreet (events and transcripts), JCF (earnings and other estimates), TrueCourse (takeover defense intelligence), DSI (fixed income), AlphaMetrics (research and performance evaluation networking tool), Global Filings (equity and fixed income prospectuses), DealMaven (investment banking workflow tool) and Thomson Fundamentals (financial data) and depending on the nature of the intangible asset, are amortized on either a straight-line or an accelerated basis using estimated useful lives ranging between two and twenty years. Intangible assets are reviewed for impairment whenever events or changes in circumstances indicate that the carrying amount of such assets may not be recoverable. Determination of recoverability is based on an estimate of undiscounted future cash flows resulting from the use of the asset and its eventual disposition. Measurement of any impairment loss for intangible assets that management expects to hold and use is based on the amount the carrying value exceeds the fair value of the asset. There has been no impairment of intangible assets as of August 31, 2009, 2008 and 2007, respectively.
Internal Use Software
Certain costs related to computer software developed or obtained for internal use are capitalized in accordance with Statement of Position 98-1, Accounting for the Costs of Computer Software Developed or Obtained for Internal Use. The Company capitalizes only those direct costs incurred during the application development and implementation stages for developing, purchasing or otherwise acquiring software solely to meet the Company’s internal needs. Capitalized costs are amortized on a straight-line basis over the estimated useful lives of the underlying software, generally three years or less. During fiscal 2009, 2008 and 2007, the Company capitalized $0.8 million, $0.4 million and $0.5 million, respectively of internal employee compensation costs associated with the application development and implementation stages for developing software for internal use only. In fiscal 2009, 2008 and 2007, FactSet recorded amortization expense related to capitalized software of $0.3 million, $0.3 million and $0.1 million, respectively.
Product Development
The Company capitalizes software development costs related to software to be sold, leased, or otherwise marketed in accordance with SFAS 86, Accounting for the Costs of Computer Software to Be Sold, Leased, or Otherwise Marketed. Capitalized software development costs include purchased materials and services, the salary and benefits for the Company’s development and technical support staff and other costs associated with the enhancements of existing products and services and development of new products and services. Software development costs are expensed as incurred until technological feasibility has been established, at which time such costs are capitalized until the product is available for general release to the public. Once the point of technological feasibility is reached, which is generally the completion of a working prototype that has been certified as having no critical bugs and is a release candidate or has alternative future uses, development costs are capitalized until the product is ready for general release. Capitalized software development costs are amortized over the estimated product useful life, principally three years using the straight-line method. Research and product development costs not subject to SFAS 86 are expensed as incurred. As of August 31, 2009 and 2008, there were no software development costs capitalized in accordance with SFAS 86.
Landlord Contributions to Leasehold Improvements
In conjunction with entering into leases for office space, the Company receives contributions from landlords toward leasehold improvements which are reported in the Deferred Rent and Other Non-Current Liabilities line item of the Company’s Consolidated Statements of Financial Condition. These contributions are amortized as a reduction to rent expense over the non-cancelable lease terms to which they pertain. During fiscal 2009, 2008 and 2007, cash contributions from landlords were $2.6 million, $1.0 million and $2.9 million, respectively.
Accrued Liabilities
Accrued liabilities include estimates relating to employee compensation, operating expenses and tax liabilities. Approximately 20% of the Company’s employee incentive compensation programs are discretionary. FactSet conducts a final review of Company and departmental individual performance each year end to determine the amount of discretionary employee compensation. The Company also reviews compensation throughout the year to determine how overall performance tracks against management’s expectations. Management takes these and other factors, including historical performance, into account in reviewing accrued compensation estimates quarterly and adjusting accrual rates as appropriate. The amount of the variable employee compensation recorded within accrued compensation as of August 31, 2009, was $32.0 million.
52
Table of Contents
Income and Deferred Taxes
Income tax expense is based on taxable income determined in accordance with current enacted laws and tax rates. Deferred income taxes are recorded for the temporary differences between the financial statement and tax bases of assets and liabilities using currently enacted tax rates. Valuation allowances are established against deferred tax assets whenever circumstances indicate that it is more likely than not that such assets will not be realized in future periods.
Effective September 1, 2007, the Company adopted FIN 48, Accounting for Uncertainty in Income Taxes, an Interpretation of FASB Statement 109, which provides a comprehensive model for the recognition, measurement and disclosure in financial statements of uncertain income tax positions that a company has taken or expects to take on a tax return. Under FIN 48, the Company can recognize the benefit of an income tax position only if it is “more-likely-than-not” that the tax position will be sustained upon tax examination, based solely on the technical merits of the tax position as of the reporting date. Otherwise, no benefit can be recognized. The tax benefits recognized are measured based on the largest benefit that has a greater than 50% likelihood of being realized upon ultimate settlement. The Company will classify the liability for unrecognized tax benefits as current to the extent that the Company anticipates payment (or receipt) of cash within one year. Additionally, the Company accrues interest and related penalties, if applicable, on all tax exposures for which reserves have been established consistent with jurisdictional tax laws. Interest and penalties are classified as income tax expense in the financial statements. At adoption, companies must adjust their financial statements to reflect only those tax positions that are more-likely-than-not to be sustained as of the adoption date. Any necessary adjustment is recorded directly to opening retained earnings in the period of adoption and reported as a change in accounting principle. See Note 14 for information relating to the implementation of this interpretation and other required disclosures pertaining to uncertain tax positions.
Comprehensive Income (Loss)
The Company reports comprehensive income (loss) in accordance with SFAS 130, Reporting Comprehensive Income. SFAS 130 establishes standards for the reporting and display of comprehensive income (loss) in a set of financial statements. Comprehensive income (loss) is defined as the change in net assets of a business enterprise during a period from transactions generated from non-owner sources. It includes all changes in equity during a period except those resulting from investments by owners and distributions to owners. See Note 11 for further disclosure of comprehensive income (loss).
Foreign Currency Translation
Certain wholly owned subsidiaries within the Europe and Asia Pacific segments operate under a functional currency different from the U.S. dollar, such as the British Pound Sterling, Euro, Japanese Yen and Indian Rupee. The financial statements of these foreign subsidiaries are translated into U.S. dollars using period-end rates of exchange for assets and liabilities, and average rates for the period for revenues and expenses. Translation gains and losses that arise from translating assets, liabilities, revenues and expenses of foreign operations are recorded in accumulated other comprehensive income as a component of stockholders’ equity. Accumulated foreign currency translation adjustments totaled ($11.1) million and $2.3 million at August 31, 2009 and 2008, respectively.
Derivative Instruments
The Company conducts business outside the U.S. in several currencies including the British Pound Sterling, Euro, Japanese Yen and Indian Rupee. As such, it is exposed to movements in foreign currency exchange rates compared to the U.S. dollar. To hedge the financial exposure related to the effects of foreign exchange rate fluctuations, the Company utilizes derivative instruments (foreign currency forward contracts). The Company does not enter into foreign exchange forward contracts for trading or speculative purposes.
These hedging programs are designed to provide foreign currency protection of up to one year. In designing a specific hedging approach, FactSet considered several factors including offsetting exposures, significance of exposures, forecasting risk and potential effectiveness of the hedge. The gains and losses on foreign currency forward contracts offset the variability in operating expenses associated with currency movements. These transactions are designated and accounted for as cash flow hedges in accordance with SFAS 133, Accounting for Derivative Instruments and Hedging Activities. The effective portion of the derivative’s gain or loss is initially reported as a component of accumulated other comprehensive income and then reclassified into operating income when the hedged exposure affects operating income (when net expenses are recorded).
FactSet has incorporated counterparty risk into the fair value of its derivative assets and its own credit risk into the value of the Company’s derivative liabilities. FactSet calculates credit risk from observable data related to credit default swaps (“CDS”) as quoted by publicly available information. Counterparty risk is represented by CDS spreads related to the senior secured debt of the respective bank with whom FactSet has executed these derivative transactions. Because CDS spread information is not available for FactSet, the Company’s credit risk is determined based on using a simple average of CDS spreads for peer companies as determined by FactSet. See Note 5 for additional disclosure of the use of foreign currency forward contracts by FactSet.
53
Table of Contents
Stock-Based Compensation
SFAS 123(R) requires the measurement and recognition of compensation expense for all share-based payment awards made to employees and directors including employee stock options and employee stock purchases related to the employee stock purchase plan based on estimated fair values. Stock-based compensation expense recognized is based on the value of share awards that are scheduled to vest during the period. The Company uses the straight-line attribution method for all awards with graded vesting features and service conditions only. Under this method, the amount of compensation cost that is recognized on any date is at least equal to the vested portion of the award on that date. For all stock-based awards with performance conditions, the graded vesting attribution method is used by the Company to determine the monthly stock-based compensation expense over the applicable vesting periods.
Stock-based compensation expense recognized is based on the value of share awards that are scheduled to vest during the period. SFAS 123(R) requires forfeitures to be estimated at the time of grant and revised, if necessary, in subsequent periods if actual forfeitures differ from those estimates. SFAS 123(R) requires windfall tax benefits from stock-based compensation cost be classified as cash inflows from financing activities.
Upon adoption of SFAS 123(R), the Company elected an alternative transition method prescribed by Financial Accounting Standards Board (“FASB”) Staff Position (“FSP”) SFAS 123(R)-3. This FSP provided an elective alternative transition method because some entities did not have and were not be able to re-create information about the net excess tax benefits that would have qualified as such had those entities adopted SFAS 123(R) for recognition purposes. That method comprises a computational component that establishes a beginning balance of the additional paid-in capital (“APIC”) pool related to employee compensation and a simplified method to determine the subsequent impact on the APIC pool of employee awards that are fully vested and outstanding upon the adoption of SFAS 123(R).
Performance-based stock options require management to make assumptions regarding the likelihood of achieving Company performance targets on a quarterly and on-going basis. The number of performance-based options that vest will be predicated on the Company achieving certain performance levels. A change in the financial performance levels achieved by FactSet could result in changes to the Company’s current estimate of the vesting percentage and related stock-based compensation.
See Note 13 for additional disclosures relating to stock-based compensation.
Legal Matters
From time to time the Company is involved in litigation and proceedings arising out of the ordinary course of business. Legal costs for services rendered in the course of these proceedings are charged to expense as they are incurred.
Leases
The Company conducts all of its operations in leased facilities which have minimum lease obligations under non-cancelable operating leases. Certain of these leases contain rent escalations based on specified percentages. Most of the leases contain renewal options and require payments for taxes, insurance and maintenance. Rent expense is charged to operations as incurred except for escalating rents, which are charged to operations on a straight-line basis over the life of the lease.
New Accounting Pronouncements
In December 2007, the FASB issued SFAS 141 (revised 2007), Business Combinations and SFAS 160, Noncontrolling Interests in Consolidated Financial Statements—an amendment of ARB No. 51. In April 2009, the FASB issued FSP SFAS 141(R)-1, Accounting for Assets Acquired and Liabilities Assumed in a Business Combination That Arise from Contingencies (“FSP 141(R)-1”). SFAS 141(R) and FSP 141(R)-1 will significantly change current practices regarding business combinations. Among the more significant changes, SFAS 141(R) expands the definition of a business and a business combination; requires the acquirer to recognize the assets acquired, liabilities assumed and noncontrolling interests (including goodwill), measured at fair value at the acquisition date; requires acquisition-related expenses and restructuring costs to be recognized separately from the business combination; requires assets acquired and liabilities assumed from contractual and non-contractual contingencies to be recognized at their acquisition-date fair values with subsequent changes recognized in earnings; and requires in-process research and development to be capitalized at fair value as an indefinite-lived intangible asset. FSP 141(R)-1 amends and clarifies SFAS 141(R) to address application issues on initial recognition and measurement, subsequent measurement and accounting, and disclosure of assets and liabilities arising from contingencies in a business combination. SFAS 160 will change the accounting and reporting for minority interests, reporting them as equity separate from the parent entity’s equity, as well as requiring expanded disclosures. The Company will adopt SFAS 141(R), FSP 141(R)-1 and SFAS 160 in the first quarter of fiscal 2010 and does not expect the adoption of these standards to have a material effect on the Company’s financial position and results of operations.
54
Table of Contents
In March 2008, the FASB issued SFAS 161, Disclosures about Derivative Instruments and Hedging Activities, an amendment of SFAS 133. SFAS 161 requires disclosures of how and why an entity uses derivative instruments, how derivative instruments and related hedged items are accounted for and how derivative instruments and related hedged items affect an entity’s financial position, financial performance, and cash flows. The Company early adopted SFAS 161 in the first quarter of fiscal 2009 and the adoption of this standard did not have an effect on the Company’s financial position and results of operations.
In May 2008, the FASB issued SFAS 162, The Hierarchy of Generally Accepted Accounting Principles. SFAS 162 identifies the sources of accounting principles and the framework for selecting the principles used in the preparation of financial statements of nongovernmental entities that are presented in conformity with U.S. generally accepted accounting principles (“GAAP”). The GAAP hierarchy previously resided in the American Institute of Certified Public Accountants’ statements on auditing standards, which are directed to the auditor rather than the reporting entity. SFAS 162 moves the GAAP hierarchy to the accounting literature, thereby directing it to reporting entities since it is the entity (not its auditor) that is responsible for selecting accounting principles for financial statements that are presented in conformity with GAAP. The Company will adopt SFAS 162 when it becomes effective which is 60 days following the SEC’s approval of the Public Company Accounting Oversight Board amendments to AU Section 411, The Meaning of Present Fairly in Conformity With Generally Accepted Accounting Principles and does not expect the adoption of this standard to have an effect on the Company’s financial position and results of operations.
In May 2008, the FASB issued FSP SFAS 142-3, Determination of the Useful Life of Intangible Assets. The FSP amends the factors that should be considered in developing renewal or extension assumptions used to determine the useful life of a recognized intangible asset under SFAS 142. The FSP is intended to improve the consistency between the useful life of an intangible asset determined under SFAS 142 and the period of expected cash flows used to measure the fair value of the asset under SFAS 141(R) and other U.S. GAAP. The Company will adopt FSP SFAS 142-3 in the first quarter of fiscal 2010 and does not expect the adoption of this standard to have a material effect on the Company’s financial position and results of operations.
In May 2009, the FASB issued SFAS 165, Subsequent Events, which establishes general standards of accounting for and disclosure of events that occur after the balance sheet date but before the financial statements are issued or are available to be issued. It requires the disclosure of the date through which an entity has evaluated subsequent events and the basis for that date. The Statement sets forth the period after the balance sheet date during which management of a reporting entity should evaluate events or transactions that may occur for potential recognition or disclosure in the financial statements; the circumstances under which an entity should recognize events or transactions occurring after the balance sheet date in its financial statements; and the disclosures that an entity should make about events or transactions that occurred after the balance sheet date. SFAS 165 is effective for interim and annual reporting periods ending after June 15, 2009, and shall be applied prospectively. The Company adopted SFAS 165 in the fourth quarter of fiscal 2009 and the adoption of this standard did not have an effect on the Company’s financial position and results of operations. FactSet has performed an evaluation of subsequent events through October 30, 2009, which is the date the financial statements were issued.
In June 2009, the FASB issued SFAS 168, The FASB Accounting Standards Codification™ and the Hierarchy of Generally Accepted Accounting Principles, a replacement of SFAS 162, Hierarchy of Generally Accepted Accounting Principles (“the Codification”). The Codification is the official single source of authoritative U.S. GAAP. All existing accounting standards are superseded. All other accounting guidance not included in the Codification will be considered non-authoritative. The Codification also includes all relevant SEC guidance organized using the same topical structure in separate sections within the Codification. The FASB also decided that the Codification will be effective for interim and annual periods ending after September 15, 2009. Under this guidance, the Company will apply the Codification to their first quarter fiscal 2010 interim financial statements. The Codification is not expected to change GAAP. The principal impact on the Company’s financial statements from the Codification adoption is limited to disclosures as all future references to authoritative accounting literature will be referenced in accordance with the Codification.
3. FAIR VALUE MEASURES
In September 2006, the FASB issued SFAS 157, Fair Value Measurements. SFAS 157 defines fair value, establishes a framework and gives guidance regarding the methods used for measuring fair value and expands disclosures about fair value measurements. In February 2008, the FASB issued FSP SFAS 157-1, Application of FASB Statement No. 157 to FASB Statement No. 13 and Other Accounting Pronouncements That Address Fair Value Measurements for Purposes of Lease Classification or Measurement under Statement 13. FSP SFAS 157-1 amends SFAS 157 to remove certain leasing transactions from its scope. In February 2008, the FASB issued FSP SFAS 157-2, Effective Date of FASB Statement No. 157,
55
Table of Contents
which delayed the effective date of SFAS 157 for all non-financial assets and non-financial liabilities, except for items that are recognized or disclosed at fair value in the financial statements on a recurring basis (at least annually), until the beginning of fiscal 2010. Effective September 1, 2008, the Company adopted the measurement and disclosure requirements related to financial assets and financial liabilities. The adoption of SFAS 157, which primarily affected the valuation of the Company’s derivative contracts, did not have a material impact on the Company’s results of operations or the fair values of its financial assets and liabilities.
In February 2007, the FASB issued SFAS 159, The Fair Value Option for Financial Assets and Financial Liabilities, Including an Amendment of FASB Statement No. 115, which will permit the measurement of many financial instruments and certain other assets and liabilities at fair value on an instrument-by-instrument basis (the fair value option). Effective September 1, 2008, FactSet adopted SFAS 159, but the Company has not elected the fair value option for any eligible financial instruments as of August 31, 2009.
In April 2009, the FASB issued three FSPs in order to provide additional application guidance and enhance disclosures regarding fair value measurements and impairments of securities.
| • | FSP FAS 157-4, Determining Fair Value When the Volume and Level of Activity for the Asset or Liability Have Significantly Decreased and Identifying Transactions That Are Not Orderly, which reaffirms the need to use judgment to ascertain if a formerly active market has become inactive and in determining fair values when markets have become inactive. Based on the guidance, if an entity determines that the level of activity for an asset or liability has significantly decreased and that a transaction is not orderly, further analysis of transactions or quoted prices is needed, and a significant adjustment to the transaction or quoted prices may be necessary to estimate fair value in accordance with SFAS 157. The Company adopted FSP SFAS 157-4 in the fourth quarter of fiscal 2009 and the adoption of this standard did not have a material effect on the Company’s financial position and results of operations. |
| • | FSP FAS 115-2 and SFAS 124-2, Recognition and Presentation of Other-Than-Temporary Impairment. This FSP is intended to bring consistency to the timing of impairment recognition, provide improved disclosures about the credit and noncredit components of impaired debt securities that are not expected to be sold and requires more timely and increased disclosures regarding expected cash flows, credit losses and an aging of securities with unrealized losses. The Company adopted FSP FAS 115-2 and 124-2 in the fourth quarter of fiscal 2009 and the adoption of this standard did not have a material effect on the Company’s financial position and results of operations. |
| • | FSP FAS 107-1 and Accounting Principles Board (“APB”) 28-1, Interim Disclosures about Fair Value of Financial Instruments. This FSP requires quarterly qualitative and quantitative fair value disclosures for all financial instruments not measured on the balance sheet at fair value. The Company adopted FSP SFAS 107-1 and APB 28-1 in the fourth quarter of fiscal 2009 and the adoption of this standard did not have a material effect on the Company’s financial position and results of operations. |
Fair Value
SFAS 157 defines fair value as the price that would be received from selling an asset or paid to transfer a liability (i.e., the “exit price”) in an orderly transaction between market participants at the measurement date. In determining fair value, SFAS 157 permits the use of various valuation methodologies, including market, income and cost approaches. The Company considers the principal or most advantageous market in which it would transact and considers assumptions that market participants would use when pricing the asset or liability.
(a) Fair Value Hierarchy
SFAS 157 establishes a fair value hierarchy that requires an entity to maximize the use of observable inputs and minimize the use of unobservable inputs when measuring fair value. A financial instrument’s categorization within the fair value hierarchy is based upon the lowest level of input that is significant to the fair value measurement. SFAS 157 establishes three levels of inputs that may be used to measure fair value based on the reliability of inputs. FactSet has categorized its cash equivalents and derivatives within the hierarchy as follows:
Level 1
Level 1 applies to assets or liabilities for which there are quoted prices in active markets for identical assets or liabilities. These Level 1 assets and liabilities include FactSet’s investments in institutional money market funds that are classified as cash equivalents. Valuations of these products do not require a significant degree of judgment.
Level 2
Level 2 applies to assets or liabilities for which there are inputs other than quoted prices included within Level 1 that are observable for the asset or liability such as quoted prices for similar assets or liabilities in active markets; quoted prices for identical assets or liabilities in markets with insufficient volume or infrequent transactions (less active markets); or model-derived valuations in which significant inputs are observable or can be derived principally from, or corroborated by, observable market data. The Company’s derivative instruments are classified as Level 2 as they are not actively traded and are valued using pricing models that use observable market inputs.
56
Table of Contents
Level 3
Level 3 applies to assets or liabilities for which there are unobservable inputs to the valuation methodology that are significant to the measurement of the fair value of the assets or liabilities. Certain assets are classified within Level 3 of the fair value hierarchy because they trade infrequently and, therefore, have little or no transparency. There were no Level 3 assets or liabilities held by FactSet as of August 31, 2009 or at adoption of SFAS 157 on September 1, 2008.
(b) Assets and Liabilities Measured at Fair Value on a Recurring Basis
The following table shows by level within the fair value hierarchy the Company’s financial assets and liabilities that are accounted for at fair value on a recurring basis as of August 31, 2009. As required by SFAS 157, financial assets and liabilities are classified in their entirety based on the lowest level of input that is significant to the fair value measurement. The Company’s assessment of the significance of a particular input to the fair value measurement requires judgment and may affect their placement within the fair value hierarchy levels.
| Fair Value Measurements at Reporting Date Using | ||||||||||||
| Level 1 | Level 2 | Level 3 | Total Balance | |||||||||
| Assets |
||||||||||||
| U.S. Treasury money market funds |
$ | 44,578 | $ | — | $ | — | $ | 44,578 | ||||
| Corporate money market funds |
111,855 | — | — | 111,855 | ||||||||
| U.S. Government agency money market funds |
4,493 | — | — | 4,493 | ||||||||
| Derivative assets (other current assets) |
— | 1,087 | — | 1,087 | ||||||||
| Total assets measured at fair value |
$ | 160,926 | $ | 1,087 | $ | — | $ | 162,013 | ||||
| Liabilities |
||||||||||||
| Derivative liabilities |
$ | — | $ | — | $ | — | $ | — | ||||
| Total liabilities measured at fair value |
$ | — | $ | — | $ | — | $ | — | ||||
Cash, Cash Equivalents and Investments
The Company’s institutional money market funds are traded in an active market and the net asset value of each fund on the last day of the quarter is used to determine its fair value. Valuations of these cash equivalents do not require a significant degree of judgment, and as such, are classified as Level 1.
Derivative Instruments
The derivative instrument valuations are based primarily on an “income approach” using spot, forward and interest rates, as well as credit default swap spreads, all of which are observable inputs. Derivative instruments utilizing Level 2 inputs are foreign exchange forward contracts.
Assets and liabilities measured at fair value on a recurring basis were presented on the Company’s Consolidated Statement of Financial Condition at August 31, 2009 as follows:
| Fair Value Measurements at Reporting Date Using | ||||||||||||
| Level 1 | Level 2 | Level 3 | Total Balance | |||||||||
| Cash equivalents |
$ | 160,926 | $ | — | $ | — | $ | 160,926 | ||||
| Investments |
— | — | — | — | ||||||||
| Other current assets (derivative assets) |
— | 1,087 | — | 1,087 | ||||||||
| Total assets measured at fair value |
$ | 160,926 | $ | 1,087 | $ | — | $ | 162,013 | ||||
| Accounts payable and accrued liabilities (derivative liabilities) |
$ | — | $ | — | $ | — | $ | — | ||||
| Total liabilities measured at fair value |
$ | — | $ | — | $ | — | $ | — | ||||
57
Table of Contents
4. CASH, CASH EQUIVALENTS AND INVESTMENTS
Cash and Cash Equivalents - Cash and cash equivalents consist of demand deposits and money market investments with maturities of three months or less at the date of acquisition and are reported at fair value.
Investments - Investments which have maturities greater than three months from the date of acquisition are classified as available-for-sale securities and are reported at fair value. Unrealized gains and losses on available-for-sale securities are included net of tax in accumulated other comprehensive income in stockholders’ equity.
The Company maintains a portfolio of investments that is managed to preserve principal. Pursuant to the investment guidelines established by the Company, the Company’s investments attempt to achieve high levels of credit quality, liquidity and diversification. The weighted average duration of the Company’s portfolios is managed not to exceed two years. Eligible investments include obligations issued by the U.S. Treasury and other governmental agencies, money market securities and highly rated commercial paper to be held in the custody of major financial institutions. Investments such as puts, calls, strips, straddles, short sales, options, futures, commodities, precious metals or investments on margin are not permitted under the Company’s investment guidelines. All investments are denominated in U.S. dollars.
The following table summarizes the Company’s cash and investments at August 31, 2009 (in thousands):
| Amortized Cost |
Gross Unrealized Gain |
Fair Value | |||||||
| Cash on hand |
$ | 55,394 | $ | — | $ | 55,394 | |||
| U.S Treasury money market funds |
44,578 | — | 44,578 | ||||||
| U.S Government agency money market funds |
4,493 | — | 4,493 | ||||||
| Corporate money market funds |
111,855 | — | 111,855 | ||||||
| Fixed income securities |
|||||||||
| Government securities (U.S. Treasuries) |
— | — | — | ||||||
| Government agency securities |
— | — | — | ||||||
| Publicly traded equity securities |
— | — | — | ||||||
| Total cash and investments |
$ | 216,320 | — | $ | 216,320 | ||||
The following table summarizes the Company’s cash and investments at August 31, 2008 (in thousands):
| Amortized Cost |
Gross Unrealized Gain |
Fair Value | |||||||
| Cash on hand |
$ | 42,256 | $ | — | $ | 42,256 | |||
| U.S Treasury money market funds |
24,333 | — | 24,333 | ||||||
| U.S Government agency money market funds |
51,397 | — | 51,397 | ||||||
| Corporate money market funds |
— | — | — | ||||||
| Fixed income securities |
|||||||||
| Government securities (U.S. Treasuries) |
20,355 | 39 | 20,394 | ||||||
| Government agency securities |
4,563 | 75 | 4,638 | ||||||
| Publicly traded equity securities |
— | — | — | ||||||
| Total cash and investments |
$ | 142,904 | $ | 114 | $ | 143,018 | |||
Investments are recorded at fair value determined from readily available quoted market prices. The Company did not hold any investments as of August 31, 2009. All of the Company’s investments as of August 31, 2008 were classified as available-for-sale securities in accordance with SFAS 115. Unrealized gains on available-for-sale securities of $0.1 million were included net of tax in accumulated other comprehensive income in stockholders’ equity at August 31, 2008. The Company’s cash and investment portfolio did not experience any significant realized or unrealized losses as a result of counterparty credit risk or ratings change during fiscal 2009 and 2008.
58
Table of Contents
5. DERIVATIVE INSTRUMENTS
Foreign Exchange Risk Management
FactSet conducts business outside the U.S. in several currencies including the British Pound Sterling, Euro, Japanese Yen and Indian Rupee. As such, it is exposed to movements in foreign currency exchange rates compared to the U.S. dollar. To manage the exposures related to the effects of foreign exchange rate fluctuations, the Company utilizes derivative instruments (foreign currency forward contracts). The Company’s primary objective in holding derivatives is to reduce the volatility of earnings and cash flows associated with changes in foreign currency.
Cash Flow Hedges
FactSet enters into foreign currency forward contracts with maturities up to twelve months to reduce the short-term effects of foreign currency fluctuations. These hedging programs are not designed to provide foreign currency protection over longer time horizons. In designing a specific hedging approach, FactSet considered several factors, including offsetting exposures, significance of exposures, forecasting risk and potential effectiveness of the hedge. The gains and losses on foreign currency forward contracts offset the variability in operating expenses associated with currency movements. There was no discontinuance of cash flow hedges during fiscal 2009 or fiscal 2008 and as such, no gains or losses were reclassified into earnings.
These transactions are designated and accounted for as cash flow hedges in accordance with SFAS 133. The changes in fair value for these foreign currency forward contracts are initially reported as a component of accumulated other comprehensive income and subsequently reclassified into operating expenses when the hedged exposure affects earnings. No amount of ineffectiveness was recorded in the Consolidated Statements of Income for these designated cash flow hedges. All components of each derivative’s gain or loss were included in the assessment of hedge effectiveness. At August 31, 2009, the effective portion of the Company’s cash flow hedges was $0.9 million (net of tax), which is expected to be reclassified from accumulated other comprehensive income to revenues within the next six months.
At August 31, 2009, the notional principal and fair value of foreign exchange contracts to purchase Euros with U.S. dollars were €7.9 million and $0.4 million, respectively. The notional principal and fair value of foreign exchange contracts to purchase British Pound Sterling with U.S. dollars were £9.9 million and $0.7 million, respectively, at August 31, 2009. There were no other foreign exchange contracts designated as cash flow hedges. The following is a summary of all hedging positions and corresponding fair values (in thousands):
| Gross Notional Value | Fair Value Asset (Liability) | ||||||||||||
| Currency Hedged (Buy/Sell) |
Aug 31, 2009 | Aug 31, 2008 | Aug 31, 2009 | Aug 31, 2008 | |||||||||
| British Pound Sterling / U.S. Dollar |
$ | 15,358 | $ | 11,567 | $ | 657 | $ | (186 | ) | ||||
| Euro / U.S. Dollar |
$ | 10,858 | $ | 6,934 | $ | 430 | $ | 1 | |||||
| Total |
$ | 26,216 | $ | 18,501 | $ | 1,087 | $ | (185 | ) | ||||
The fair value of all derivative instruments recorded in the Company’s Consolidated Statement of Financial Condition at August 31, 2008 was $0.2 million in accounts payable and accrued expenses and ($0.2) million (net of tax) in accumulated other comprehensive (loss) income.
Counterparty Credit Risk
As a result of the use of derivative instruments, the Company is exposed to counterparty credit risk. To mitigate such risk, FactSet enters into contracts with large financial institutions (JPMorgan Chase and Bank of America). The Company regularly reviews its credit exposure balances as well as the creditworthiness of the counterparties. At August 31, 2009, the Company did not expect any losses as a result of default of its counterparties.
Fair Value of Derivative Instruments
The following tables provide a summary of the fair value amounts of derivative instruments and gains and losses on derivative instruments (in thousands):
| Designation of Derivatives |
Balance Sheet Location |
Aug 31, 2009 |
Aug 31, 2008 |
||||||
| Derivatives designated as hedging instruments | Other current assets: | ||||||||
| Foreign Exchange Contracts – Forwards |
$ | 1,087 | $ | — | |||||
| Accounts payable and accrued expenses: | |||||||||
| Foreign Exchange Contracts – Forwards |
$ | — | $ | 185 | |||||
| Derivatives not designated as hedging instruments | $ | — | $ | — | |||||
| Net Derivative Assets (liabilities) | $ | 1,087 | $ | (185 | ) | ||||
59
Table of Contents
Derivatives in Cash Flow Hedging Relationships for the twelve months ended August 31, 2009 and 2008 (in thousands):
| Gain or
(Loss) Recognized in OCI on Derivatives (Effective Portion) |
Location of Gain or (Loss) Reclassified from AOCI into Income (Effective Portion) |
Gain or (Loss) Reclassified from AOCI to Income (Effective Portion) | ||||||||||||||
| Derivatives in Cash Flow Hedging Relationships |
2009 | 2008 | 2009 | 2008 | ||||||||||||
| Foreign exchange contracts – forwards |
$ | (4,146 | ) | $ | 110 | SG&A | $ | (5,203 | ) | $ | 316 | |||||
Note: No amount of ineffectiveness was recorded in the Consolidated Statements of Income for these designated cash flow hedges and all components of each derivative’s gain or loss was included in the assessment of hedge effectiveness.
Accumulated Other Comprehensive Income (Loss) (“AOCI”)
The following table provides a summary of the activity associated with all of the Company’s designated cash flow hedges reflected in AOCI (in thousands):
| Twelve Months Ended August 31, |
||||||||
| 2009 | 2008 | |||||||
| Beginning balance, net of tax |
$ | (206 | ) | $ | — | |||
| Changes in fair value |
(4,146 | ) | 110 | |||||
| Loss (gain) reclassified to earnings |
5,203 | (316 | ) | |||||
| Ending balance, net of tax |
$ | 851 | $ | (206 | ) | |||
6. ACCOUNTS RECEIVABLE
Accounts receivable from clients are reported net of receivable reserves. The Company calculates its receivable reserve through analyzing aged client receivables and reviewing the recent history of client receivable write-offs.
Accounts receivable, net of reserves, consists of the following (in thousands):
| At August 31, |
2009 | 2008 | ||||||
| Accounts receivable |
$ | 64,566 | $ | 76,540 | ||||
| Accounts receivable reserve |
(1,712 | ) | (1,681 | ) | ||||
| Accounts receivable, net of reserves |
$ | 62,854 | $ | 74,859 | ||||
7. PROPERTY, EQUIPMENT AND LEASEHOLD IMPROVEMENTS
Property, equipment and leasehold improvements consist of the following (in thousands):
| At August 31, |
2009 | 2008 | ||||||
| Leasehold improvements |
$ | 70,368 | $ | 62,823 | ||||
| Computers and related equipment |
63,822 | 56,275 | ||||||
| Furniture and fixtures |
27,289 | 23,294 | ||||||
| Subtotal |
$ | 161,479 | $ | 142,392 | ||||
| Less accumulated depreciation and amortization |
(73,100 | ) | (51,279 | ) | ||||
| Property, equipment and leasehold improvements, net |
$ | 88,379 | $ | 91,113 | ||||
Depreciation expense was $26.1 million, $22.9 million and $20.7 million for fiscal 2009, 2008 and 2007, respectively.
8. GOODWILL
On an ongoing basis, the Company evaluates goodwill at the reporting unit level for indications of potential impairment. Goodwill is tested for impairment based on the present value of discounted cash flows, and, if impaired, written down to fair value based on discounted cash flows. Based on the guidance in SFAS 142, the Company has determined that there were three reporting units during fiscal years 2009, 2008 and 2007, which are consistent with the operating segments reported under SFAS 131 because there is no discrete financial information available for the subsidiaries within each operating segment. The Company’s reporting units evaluated for potential impairment during fiscal years 2009, 2008 and 2007 were U.S., Europe and Asia Pacific, which reflects the level of internal reporting the Company uses to manage its business and operations. The Company performed an annual goodwill impairment test during the fourth quarter of fiscal years 2009, 2008, and 2007 and determined that there had been no impairment.
60
Table of Contents
There was no goodwill acquired during fiscal 2009. During fiscal 2008, $46.0 million of goodwill was acquired as result of the purchase of the DealMaven and Thomson Fundamentals businesses. Changes in the carrying amount of goodwill by segment for fiscal years ended August 31, 2009 and 2008 are as follows (in thousands):
| U.S. | Europe | Asia Pacific | Total | ||||||||||||
| Balance at August 31, 2007 |
$ | 62,999 | $ | 83,188 | $ | — | $ | 146,187 | |||||||
| Goodwill acquired during the period |
36,600 | 6,386 | 3,032 | 46,018 | |||||||||||
| Purchase price adjustments |
— | — | — | — | |||||||||||
| Foreign currency translation adjustments |
— | (4,400 | ) | (25 | ) | (4,425 | ) | ||||||||
| Balance at August 31, 2008 |
$ | 99,599 | $ | 85,174 | $ | 3,007 | $ | 187,780 | |||||||
| Goodwill acquired during the period |
— | — | — | — | |||||||||||
| Purchase price adjustments |
97 | (97 | ) | — | — | ||||||||||
| Foreign currency translation adjustments |
— | (6,937 | ) | 512 | (6,425 | ) | |||||||||
| Balance at August 31, 2009 |
$ | 99,696 | $ | 78,140 | $ | 3,519 | $ | 181,355 | |||||||
9. INTANGIBLE ASSETS
The Company’s identifiable intangible assets consist primarily of certain acquired content databases, software technology, client relationships, trade names and non-compete agreements resulting from the acquisitions of the Insyte, LionShares, Mergerstat, CallStreet, JCF, TrueCourse, DSI, AlphaMetrics, Global Filings, DealMaven and Thomson Fundamentals businesses between August 2000 and July 2008. The acquired businesses and related assets have been fully integrated into the Company’s operations. The weighted average useful life of all acquired intangible assets is 13.2 years at August 31, 2009.
The Company amortizes intangible assets over their estimated useful lives. Amortizable intangible assets are tested for impairment based on undiscounted cash flows, and, if impaired, written down to fair value based on either discounted cash flows or appraised values. No impairment of intangible assets has been identified during any of the periods presented. These intangible assets have no assigned residual values.
The gross carrying amounts and accumulated amortization totals related to the Company’s identifiable intangible assets are as follows (in thousands):
| At August 31, 2009 |
Gross Carrying Amount |
Accumulated Amortization |
Net Carrying Amount | ||||||
| Data content |
$ | 44,338 | $ | 9,518 | $ | 34,820 | |||
| Software technology |
19,088 | 13,388 | 5,700 | ||||||
| Client relationships |
14,733 | 9,001 | 5,732 | ||||||
| Trade names |
192 | 128 | 64 | ||||||
| Non-compete agreements |
175 | 141 | 34 | ||||||
| Total |
$ | 78,526 | $ | 32,176 | $ | 46,350 | |||
| At August 31, 2008 |
Gross Carrying Amount |
Accumulated Amortization |
Net Carrying Amount | ||||||
| Data content |
$ | 47,423 | $ | 6,980 | $ | 40,443 | |||
| Software technology |
19,579 | 9,990 | 9,589 | ||||||
| Client relationships |
15,353 | 7,304 | 8,049 | ||||||
| Trade names |
539 | 448 | 91 | ||||||
| Non-compete agreements |
837 | 676 | 161 | ||||||
| Total |
$ | 83,731 | $ | 25,398 | $ | 58,333 | |||
Amortization expense recorded for intangible assets during fiscal years 2009, 2008 and 2007 was $8.3 million, $7.8 million and $7.8 million, respectively. The estimated intangible asset amortization expense as of August 31, 2009 is as follows (in thousands):
| Fiscal Year |
Estimated Amortization Expense | ||
| 2010 |
$ | 7,969 | |
| 2011 |
5,560 | ||
| 2012 |
4,456 | ||
| 2013 |
3,063 | ||
| 2014 |
2,087 | ||
| Thereafter |
23,215 | ||
| Total |
$ | 46,350 | |
61
Table of Contents
10. COMMON STOCK AND EARNINGS PER SHARE
On May 12, 2009, the Company’s Board of Directors approved an 11% increase in the regular quarterly dividend from $0.18 per share to $0.20 per share, or $0.80 per share per annum, beginning with the Company’s dividend payment in June 2009. The cash dividend of $9.4 million was paid on June 16, 2009, to common stockholders of record on May 29, 2009. On August 13, 2009, the Company announced a regular quarterly dividend of $0.20 per share. The cash dividend was paid on September 15, 2009, to common stockholders of record on August 31, 2009. Shares of common stock outstanding were as follows (in thousands):
| Years Ended August 31, |
2009 | 2008 | 2007 | ||||||
| Balance, beginning of year |
47,969 | 48,349 | 48,889 | ||||||
| Common stock issued for employee stock plans |
956 | 946 | 766 | ||||||
| Repurchase of common stock |
(2,185 | ) | (1,326 | ) | (1,306 | ) | |||
| Balance, end of year |
46,740 | 47,969 | 48,349 |
Earnings per Share
A reconciliation between the weighted average shares outstanding used in the basic and diluted EPS computations is as follows (in thousands, except per share data):
| Net Income (Numerator) | Weighted Average Common Shares (Denominator) |
Per Share Amount | ||||||||||||||||||||||
| Years Ended August 31, |
2009 | 2008 | 2007 | 2009 | 2008 | 2007 | 2009 | 2008 | 2007 | |||||||||||||||
| Basic EPS |
||||||||||||||||||||||||
| Income available to common stockholders |
$ | 144,950 | $ | 125,017 | $ | 109,567 | 47,158 | 48,065 | 48,873 | $ | 3.07 | $ | 2.60 | $ | 2.24 | |||||||||
| Diluted EPS |
||||||||||||||||||||||||
| Dilutive effect of stock options and restricted stock |
1,631 | 2,015 | 2,411 | |||||||||||||||||||||
| Income available to common stockholders plus assumed conversions |
$ | 144,950 | $ | 125,017 | $ | 109,567 | 48,789 | 50,080 | 51,284 | $ | 2.97 | $ | 2.50 | $ | 2.14 | |||||||||
Dilutive potential common shares consist of stock options and unvested restricted stock awards. For the twelve months ended August 31, 2009, 2008 and 2007, 1,328,246, 73,332 and 14,394, respectively, stock options were excluded from the calculation of diluted earnings per share because their inclusion would have been anti-dilutive. No restricted stock awards were excluded from the calculation of diluted earnings per share for the twelve months ended August 31, 2009, 2008 or 2007.
For the twelve months ended August 31, 2009, 2008 and 2007, 1,044,262, 965,551 and 999,672, respectively, performance-based stock option grants were excluded from the calculation of diluted earnings per share in accordance with SFAS 128. As indicated in SFAS 128, performance-based stock options should be omitted from the calculation of diluted earnings per share until the performance criteria have been met. The criteria have not yet been met at August 31, 2009 or 2008 for performance-based stock options granted in fiscal 2008 and 2007, respectively.
11. STOCKHOLDERS’ EQUITY
Share Repurchase Program
On March 16, 2009, the Company’s Board of Directors approved a $100 million expansion to the existing share repurchase program. During fiscal 2009, the Company repurchased 2.2 million shares for $103.3 million under the program. Including the $100 million expansion, $102 million remains authorized for future share repurchases as of August 31, 2009. Repurchases will be made from time to time in the open market and privately negotiated transactions, subject to market conditions. No minimum number of shares to be repurchased has been fixed. There is no timeframe to complete the repurchase program and it is expected that share repurchases will be paid using existing and future cash generated by operations.
On January 25, 2008, the Company’s Board of Directors approved an expansion of the existing share repurchase program by an additional $125 million. At that time, the Company completed the $100 million expansion to the existing share repurchase program authorized by the Board on March 19, 2007. During fiscal 2008, the Company repurchased 1.3 million shares for $77 million under the program. At August 31, 2008, $105 million remained authorized for future share repurchases.
62
Table of Contents
FactSet accounts for repurchased common stock under the cost method and includes such treasury stock as a component of stockholders’ equity. Retirement of treasury stock is recorded as a reduction of common stock and additional paid-in-capital at the time such retirement is approved by the Company’s Board of Directors.
Preferred Stock
At August 31, 2009 and 2008, there were 10,000,000 shares of preferred stock (par value $0.01 per share) authorized, of which no shares were issued and outstanding. FactSet’s Board of Directors may from time to time authorize the issuance of one or more series of preferred stock and, in connection with the creation of such series, determine the characteristics of each such series including, without limitation, the preference and relative, participating, optional or other special rights, and the qualifications, limitations or restrictions of the series.
Restricted Stock Awards
During fiscal 2005, the Company granted 49,178 restricted stock awards which entitle the holder to shares of common stock as the award vests over time. The Company’s restricted stock awards cliff vest in two equal tranches over a four-year period. Restricted stock grants are amortized to expense over the vesting period using the straight-line attribution method. Based on the $37.51 average market price of FactSet common stock on the grant date, a deferred compensation charge of $1.8 million was recorded to stockholders’ equity, and is being amortized ratably to compensation expense over the vesting period of four years. On August 1, 2007, 50% of the restricted stock grants vested and were subsequently issued to restricted stock award holders on that date. The remaining 50% of the restricted stock grant vested on August 1, 2009 and were subsequently issued to restricted stock award holders on that date.
Comprehensive Income
The components of comprehensive income were as follows for the periods presented (in thousands):
| Years Ended August 31, |
2009 | 2008 | 2007 | ||||||||
| Net income |
$ | 144,950 | $ | 125,017 | $ | 109,567 | |||||
| Net unrealized (loss) gain on investments, net of tax |
(72 | ) | 25 | 3 | |||||||
| Net unrealized gain (loss) on cash flow hedges, net of tax |
1,057 | (206 | ) | — | |||||||
| Foreign currency translation adjustments |
(13,390 | ) | (7,317 | ) | 6,349 | ||||||
| Comprehensive Income |
$ | 132,545 | $ | 117,519 | $ | 115,919 | |||||
Accumulated Other Comprehensive (Loss) Income
The components of accumulated other comprehensive (loss) income were as follows (in thousands):
| At August 31, |
2009 | 2008 | 2007 | ||||||||
| Accumulated unrealized gains on investments, net of tax |
$ | — | $ | 72 | $ | 47 | |||||
| Accumulated unrealized gain (loss) on cash flow hedges, net of tax |
851 | (206 | ) | — | |||||||
| Accumulated foreign currency translation adjustments |
(11,074 | ) | 2,316 | 9,633 | |||||||
| Total accumulated other comprehensive (loss) income |
$ | (10,223 | ) | $ | 2,182 | $ | 9,680 | ||||
12. EMPLOYEE STOCK OPTION AND RETIREMENT PLANS
Stock Option Plans
Stock Option Awards
Options granted without performance conditions under the Company’s stock option plans (the “Option Plans”) expire either seven or ten years from the date of grant and the majority vest at a rate of 20% after the first year and 1.67% per month thereafter for years two through five. Options become vested and exercisable provided the employee continues employment with the Company through the applicable vesting date, and remain exercisable until expiration or cancellation. Options granted with performance conditions under the Company’s 2004 Stock Option Plan expire seven years from the date of grant and vest at a rate of 40% after the first two years and 1.67% per month thereafter for years three through five. Options generally are not transferable or assignable other than by will or the laws of descent and distribution. During the grantee’s lifetime, they may be exercised only by the grantee.
General Option Activity
In fiscal years 2009, 2008 and 2007, stock options to purchase 398,747; 1,854,372; and 1,503,738 shares of common stock, respectively, at prices which ranged from $35.80 to $65.67 were granted to employees and non-employee directors of the Company.
63
Table of Contents
At August 31, 2009, there were 4,128,000 shares available for future grants under the Option Plans.
A summary of stock option activity follows (in thousands, except per share data):
| Options Available for Grant |
Number Outstanding |
Weighted Average Exercise Price Per Share | |||||||
| Balance at August 31, 2006 |
6,316 | 7,668 | $ | 26.37 | |||||
| Granted – non performance-based |
(608 | ) | 608 | 59.41 | |||||
| Granted – performance-based |
(896 | ) | 896 | 59.42 | |||||
| Exercised |
— | (659 | ) | 18.63 | |||||
| Forfeited |
106 | (106 | ) | 36.55 | |||||
| Balance at August 31, 2007 |
4,918 | 8,407 | $ | 32.76 | |||||
| Granted – non performance-based |
(795 | ) | 795 | 64.22 | |||||
| Granted – performance-based |
(1,059 | ) | 1,059 | 65.67 | |||||
| Exercised |
— | (847 | ) | 19.09 | |||||
| Forfeited* |
498 | (498 | ) | 44.53 | |||||
| Balance at August 31, 2008 |
3,562 | 8,916 | $ | 40.11 | |||||
| Granted – non performance-based |
(399 | ) | 399 | 37.05 | |||||
| Exercised |
— | (797 | ) | 22.23 | |||||
| Forfeited** |
965 | (965 | ) | 58.31 | |||||
| Balance at August 31, 2009 |
4,128 | 7,553 | $ | 39.51 | |||||
| * | In August 2006, the Company granted 924,989 performance-based employee stock options. FactSet achieved organic ASV and diluted earnings per share growth of at least 20% on a compounded annual basis for the two years ended August 31, 2008 and as such, 60% of the initial 924,989 performance-based employee stock options granted will vest and the remaining 341,729 stock options were recorded as forfeitures in August 2008. |
| ** | In August 2007, the Company granted 896,194 performance-based employee stock options. None of these performance-based stock options granted will vest because FactSet did not achieve certain performance levels for both organic ASV and diluted earnings per share during the two fiscal years ended August 31, 2009. As such, these performance-based stock options were recorded as forfeitures in August 2009. |
The total pre-tax intrinsic value of stock options exercised during fiscal 2009, 2008 and 2007 was $19.7 million, $34.8 million and $27.1 million, respectively.
The following table summarizes the number of options outstanding and exercisable during fiscal 2009, 2008 and 2007, respectively (in thousands, except per share data):
| 2009 | 2008 | 2007 | |||||||||||||
| At August 31, |
Number of Shares |
Weighted Average Exercise Price Per Share |
Number of Shares |
Weighted Average Exercise Price Per Share |
Number of Shares |
Weighted Average Exercise Price Per Share | |||||||||
| Outstanding at fiscal year end |
7,553 | $ | 39.51 | 8,916 | $ | 40.11 | 8,407 | $ | 32.76 | ||||||
| Exercisable at fiscal year end |
4,554 | $ | 28.78 | 4,589 | $ | 25.12 | 4,502 | $ | 21.53 | ||||||
64
Table of Contents
The following table summarizes ranges of outstanding and exercisable options as of August 31, 2009 (in thousands, except per share data):
| Range of Exercise |
Number Outstanding |
Outstanding | Exercisable | |||||||||||||||||
| Weighted Average Remaining Years of Contractual Life |
Weighted Average Exercise Price Per Share |
Aggregate Intrinsic Value |
Number Exercisable |
Weighted Average Exercise Price Per Share |
Aggregate Intrinsic Value |
|||||||||||||||
| $14.97 – $19.99 |
956 | 2.53 | $ | 16.44 | $ | 36,917 | 956 | $ | 16.44 | $ | 36,917 | |||||||||
| $20.00 – $24.99 |
1,871 | 2.40 | $ | 23.41 | $ | 59,171 | 1,871 | $ | 23.41 | $ | 59,171 | |||||||||
| $25.00 – $29.99 |
696 | 2.57 | $ | 29.00 | $ | 18,116 | 589 | $ | 29.00 | $ | 15,338 | |||||||||
| $30.00 – $39.99 |
564 | 4.75 | $ | 35.47 | $ | 11,042 | 183 | $ | 34.85 | $ | 3,692 | |||||||||
| $40.00 – $49.99 |
1,094 | 4.13 | $ | 43.27 | $ | 12,867 | 591 | $ | 43.34 | $ | 6,912 | |||||||||
| $50.00 – $59.99 |
647 | 4.96 | $ | 58.93 | $ | (2,518 | ) | 225 | $ | 59.34 | $ | (968 | ) | |||||||
| $60.00 – $65.67 |
1,725 | 5.93 | $ | 65.63 | $ | (18,278 | ) | 139 | $ | 65.50 | $ | (1,454 | ) | |||||||
| 7,553 | 3.88 | $ | 39.51 | $ | 117,317 | 4,554 | $ | 28.78 | $ | 119,608 | ||||||||||
The total number of in-the-money options exercisable as of August 31, 2009 was 4.2 million with a weighted average exercise price of $25.91. As of August 31, 2008, 4.6 million in-the-money outstanding options were exercisable with a weighted average exercise price of $25.12. The aggregate intrinsic value of in-the-money stock options exercisable at August 31, 2009 and 2008 was $122.0 million and $172.5 million, respectively. The aggregate intrinsic value represents the difference between the Company’s closing stock price of $55.04 as of August 31, 2009 and the exercise price multiplied by the number of options exercisable as of that date.
Performance-based Stock Options
Performance-based stock options require management to make assumptions regarding the likelihood of achieving Company performance targets. The number of performance-based options that vest will be predicated on the Company achieving performance levels for both organic ASV and diluted earnings per share during the two fiscal years subsequent to the date of grant. Dependent on the financial performance levels attained by FactSet during the two subsequent fiscal years, 0%, 20%, 60% or 100% of the performance-based stock options will vest to the grantees of those stock options. There is no current guarantee however that such options will vest in whole or in part.
August 2006 Performance-based Option Grant Review
In August 2006, the Company granted 924,989 performance-based employee stock options. FactSet achieved organic ASV and diluted earnings per share growth of at least 20% on a compounded annual basis for the two years ended August 31, 2008 and as such, 60% of the initial 924,989 performance-based employee stock options granted will vest and the remainder were recorded as forfeitures.
August 2007 Performance-based Option Grant Review
In August 2007, the Company granted 896,194 performance-based employee stock options. None of these performance-based stock options granted will vest because FactSet did not achieve certain performance levels for both organic ASV and diluted earnings per share during the two fiscal years ended August 31, 2009. These performance-based options were recorded as forfeitures in August 2009.
August 2008 Performance-based Option Grant Review
In August 2008, the Company granted 1,058,981 performance-based employee stock options. The number of performance-based options that vest is based on the Company achieving performance levels for both organic ASV and diluted earnings per share during the two fiscal years ended August 31, 2010. At August 31, 2009, the Company estimated that none of the performance-based stock options will vest which results in zero unamortized stock-based compensation expense to be recognized as of August 31, 2009. The Company’s estimate considers the current difficult economic conditions and the potential adverse impact on many of its clients from the dislocation in the global equity and credit markets. A change in the actual financial performance levels achieved by FactSet could result in the following changes to the Company’s current estimate of the vesting percentage and related expense (in thousands):
| Vesting Percentage |
Total Unamortized Stock-based Compensation Expense at August 31, 2009 |
One-time Adjustment* |
Average Remaining Quarterly Expense to be Recognized | ||||||
| 0% |
$ | — | $ | — | $ | — | |||
| 20% |
$ | 2,410 | $ | 1,103 | $ | 150 | |||
| 60% |
$ | 7,230 | $ | 3,309 | $ | 450 | |||
| 100% |
$ | 12,050 | $ | 5,515 | $ | 750 | |||
| * | Amounts represent the one-time cumulative adjustment to be recorded if there had been a change in the vesting percentage as of August 31, 2009. The one-time cumulative adjustment increments each quarter by the amount stated in the average remaining quarterly expense to be recognized column. |
65
Table of Contents
Employee Stock Purchase Plan
On December 16, 2008, the Company’s stockholders ratified the adoption of the FactSet Research Systems Inc. 2008 Employee Stock Purchase Plan (the “Purchase Plan”). A total of 500,000 shares have been reserved for issuance under the Purchase Plan. There is no expiration date for the Purchase Plan. Shares of FactSet common stock may be purchased by eligible employees under the Purchase Plan in three-month intervals at a purchase price equal to at least 85% of the lesser of the fair market value of the Company’s common stock on either the first day or the last day of each three-month offering period. Employee purchases may not exceed 10% of their gross compensation during an offering period.
During fiscal 2009, employees purchased 144,153 shares at an average price of $34.53. At August 31, 2009, 447,685 shares were collectively reserved for future issuance under the Purchase Plan.
The Company uses the Black-Scholes model to calculate the estimated fair value for the employee stock purchase plan. The weighted average estimated value of employee stock purchase plan grants during fiscal years 2009, 2008 and 2007 were $9.12, $10.34 and $10.04 per share, respectively. The following weighted average assumptions were used to calculate the estimated fair value of employee stock purchase plan grants for fiscal years 2009, 2008 and 2007:
| 2009 | 2008 | 2007 | |||||||
| Risk-free interest rate |
0.31 | % | 2.34 | % | 4.88 | % | |||
| Expected life |
3 months | 3 months | 3 months | ||||||
| Expected volatility |
25 | % | 19 | % | 13 | % | |||
| Dividend yield |
1.7 | % | 1.0 | % | 0.5 | % |
Restricted Stock Awards
The Company stock option plans permit the issuance of restricted stock and restricted stock units. Restricted stock awards are subject to continued employment over a specified period. During fiscal 2005, the Company granted restricted stock awards which entitle the holder to shares of common stock as the award vests over time. The Company’s restricted stock awards cliff vest in two equal tranches over a four-year period. Restricted stock grants are amortized to expense over the vesting period using the straight-line attribution method. The Company granted 49,178 shares of common stock in restricted stock grants during fiscal 2005. Based on the $37.51 average market price of FactSet common stock on the grant date, a deferred compensation charge of $1.8 million was recorded to stockholders’ equity, and was amortized ratably to compensation expense over the vesting period of four years. Compensation expense recorded by FactSet was $0.5 million, $0.4 million and $0.4 million during fiscal 2009, 2008 and 2007, respectively. SFAS 123(R) requires forfeitures to be estimated at the time of grant and revised, if necessary, in subsequent periods if actual forfeitures differ from those estimates. On August 1, 2007, 50% of the restricted stock grants vested and were subsequently issued to restricted stock award holders on that date. The remaining 50% of the restricted stock grant vested on August 1, 2009 and were subsequently issued to restricted stock award holders on that date. No restricted stock awards have been granted since fiscal 2005.
Employee Stock Ownership Plan
The Company sponsored an employee stock ownership plan (“ESOP”) until March 30, 2005. There were no authorized contributions in fiscal 2009, 2008 or 2007. On June 20, 2005, the Board of Directors terminated the ESOP. Distributions were paid in the form of cash or the Company’s common stock. In cash distributions, the Company purchases the common stock in the participant’s ESOP account at the closing price of the Company’s common stock on the last day of the month in which the distribution is requested by the participant of the ESOP. These repurchases of common stock from employees are included in both treasury stock on the Consolidated Statements of Changes in Stockholders’ Equity and in cash flows from financing activities in the Consolidated Statements of Cash Flows.
No shares were held in the ESOP as of August 31, 2009. The Plan held 7,043 and 18,621 shares of the Company’s common stock at August 31, 2008 and 2007, respectively.
401(k) Plan
The Company established a 401(k) Plan (the “401(k) Plan”) in fiscal 1993. The 401(k) Plan is a defined contribution plan covering all full-time, U.S. employees of the Company and is subject to the provisions of the Employee Retirement Income Security Act of 1974 and the Internal Revenue Code of 1986. Each year, participants may contribute up to 60% of their eligible annual compensation, subject to annual limitations established by the Internal Revenue Code. Effective January 1,
66
Table of Contents
2005, the Company implemented an employer-funded matching component to its existing 401(k) retirement plan whereby the Company matches up to 4% of employees’ earnings, capped at the IRS annual maximum. Company matching contributions are subject to a five year graduated vesting schedule. All full-time, U.S. employees are eligible for the matching contribution by the Company. The Company contributed $5.0 million, $4.5 million and $3.5 million in matching contributions to employee 401(k) accounts during fiscal 2009, 2008 and 2007, respectively.
13. STOCK-BASED COMPENSATION
The Company accounts for stock-based compensation under the provisions of SFAS 123(R), which requires the measurement and recognition of compensation expense for all share-based payment awards made to employees and directors including employee stock options, common shares acquired under employee stock purchases and restricted stock based on estimated fair values of the share awards that are scheduled to vest during the period.
The following table summarizes stock-based compensation expense under SFAS 123(R) for the twelve months ended August 31, 2009, 2008 and 2007 (in thousands):
| 2009 | 2008* | 2007 | ||||||||||
| Stock-based compensation |
$ | 13,623 | $ | 13,651 | $ | 9,123 | ||||||
| Tax impact of stock-based compensation |
(4,550 | ) | (4,682 | ) | (3,129 | ) | ||||||
| Stock-based compensation, net of tax |
$ | 9,073 | $ | 8,969 | $ | 5,994 | ||||||
| * | Included in fiscal 2008 was a pre-tax charge of $2.4 million related to an increase in the estimate of the number of performance-based stock options that would vest in August 2008. During the second quarter of fiscal 2008, the Company estimated that it was probable it would achieve organic ASV and diluted earnings per share growth of at least 20% on a compounded annual basis for the two years ended August 31, 2008. This reflected a higher performance level than previously estimated and accordingly increased the number of options that was estimated to vest at the end of fiscal 2008. |
As stock-based compensation expense recognized in the Consolidated Statements of Income during fiscal 2009, 2008 and 2007 is based on awards ultimately expected to vest, it has been reduced for estimated forfeitures. SFAS 123(R) requires forfeitures to be estimated at the time of grant and revised, if necessary, in subsequent periods if actual forfeitures differ from those estimates. Forfeitures were estimated based primarily on historical experience.
As of August 31, 2009, $23.6 million of total unrecognized compensation costs related to non-vested awards is expected to be recognized over a weighted average period of 3.13 years. There were no stock-based compensation costs capitalized as of August 31, 2009, 2008 and 2007, respectively.
Stock Option Fair Value Determination
The Company utilizes the lattice-binomial option-pricing model (“binomial model”) to estimate the fair value of new employee stock option grants. The Company’s determination of fair value of share-based payment awards on the date of grant using the binomial model is affected by the Company’s stock price as well as assumptions regarding a number of variables. These variables include, but are not limited to the Company’s expected stock price volatility over the term of the awards, interest rates, option forfeitures and employee stock option exercise behaviors.
There were 329,857 employee stock options granted during fiscal 2009. The weighted average estimated value of employee stock options granted during fiscal 2009 was $9.39 per share, using the binomial model. In fiscal 2008, 1,854,372 employee stock options were granted with a weighted average estimated value of $19.05 per share, using the binomial model. In fiscal 2007, 1,503,738 employee stock options were granted with a weighted average estimated value of $19.87 per share, using the binomial model.
The weighted average estimated value of employee stock options granted during fiscal 2009, 2008 and 2007 were determined using the binomial model with the following weighted average assumptions:
| 2009 | 2008 | 2007 | ||||
| Term structure of risk-free interest rate |
0.89% - 3.09% | 1.89% - 3.46% | 4.46% - 5.09% | |||
| Expected life |
5.0 - 5.4 years | 4.9 - 5.4 years | 4.8 - 5.9 years | |||
| Term structure of volatility |
33% - 38% | 29% - 39% | 17% - 44% | |||
| Dividend yield |
2.0% | 1.0% | 0.8% |
67
Table of Contents
The risk-free interest rate assumption for periods within the contractual life of the option is based on the U.S. Treasury yield curve in effect at the time of grant. Expected volatility is based on the historical volatility of the Company’s stock. The Company uses historical data to estimate option exercises and employee terminations within the valuation model. The dividend yield assumption is based on the Company’s history and expectation of dividend payouts.
The expected life of employee stock options represents the weighted average period the stock options are expected to remain outstanding and is a derived output of the binomial model. The binomial model estimates employees exercise behavior based on the option’s remaining vested life and the extent to which the option is in-the-money. The binomial model estimates the probability of exercise as a function of these two variables based on the entire history of exercises and cancellations of all past option grants made by the Company.
Non-Employee Director Stock Option Grants
On December 16, 2008, the Company’s stockholders approved the 2008 Non-Employee Directors’ Stock Option Plan (the “Plan”) that provides for the grant of share-based awards, including stock options, to non-employee directors of FactSet. The ratification of the Plan replaced FactSet’s 1998 Non-Employee Directors’ Stock Option Plan, which had expired on November 1, 2007, except with respect to outstanding options previously granted hereunder. A total of 250,000 shares of FactSet common stock have been reserved for issuance under the Plan. The expiration date of the Plan is December 1, 2018. The shares of common stock to be issued may be either authorized and unissued shares or shares held by the Company in its treasury. Consistent with the 1998 Non-Employee Directors’ Stock Option Plan, the new Plan provides for annual equity grants for each non-employee director and will provide the Company greater flexibility to change the vesting schedule per option grant, modify the number of options granted on an annual basis and adjust the term of the grants. As such, the Compensation Committee approved an annual equity grant of 5,315 non-qualified stock options to each of the six non-employee directors on January 15, 2009.
In order to compensate each non-employee Director for his service to the Company during fiscal 2008, the Compensation Committee recommended and the Board approved a one-time grant of 4,500 options on January 15, 2009 to each of the six non-employee directors. Of the options granted, 20% vested immediately with the remainder to vest over four years. In addition, as a new outside Director of FactSet, Mr. Joseph Zimmel was awarded a new Director equity grant of 10,000 non-qualified stock options on January 15, 2009. Twenty percent or 2,000 of these non-qualified stock options granted to Mr. Zimmel vested immediately with the remainder to vest ratably at 20% per year over four years upon the anniversary date of the grant and expire seven years from the date the options were granted.
The Company utilizes the Black-Scholes model to estimate the fair value of new non-employee Director stock option grants. The Company’s determination of fair value of share-based payment awards on the date of grant is affected by the Company’s stock price as well as assumptions regarding a number of variables. These variables include, but are not limited to the Company’s expected stock price volatility over the term of the awards, interest rates, option forfeitures and employee stock option exercise behaviors.
During fiscal 2009, 68,890 stock options were granted to the Company’s non-employee Directors with a weighted average estimated fair value of $12.08 per share, using the Black-Scholes model with the following weighted average assumptions:
| Risk-free interest rate |
1.45 | % | |
| Expected life |
5.51 years | ||
| Expected volatility |
35.2 | % | |
| Dividend yield |
1.71 | % |
There were no stock options granted to the Company’s non-employee Directors during fiscal 2008 due to the expiration of the Company’s non-employee Directors plan.
During fiscal 2007, 22,500 stock options were granted to the Company’s non-employee Directors with a weighted average estimated fair value of $21.20 per share, using the Black-Scholes option-pricing model with the following weighted average assumptions:
| Risk-free interest rate |
4.7 | % | |
| Expected life |
5.9 years | ||
| Expected volatility |
32.5 | % | |
| Dividend yield |
0.4 | % |
The risk-free interest rate assumption for periods within the contractual life of the option is based on the U.S. Treasury yield curve in effect at the time of grant. Expected volatility is based on the historical volatility of the Company’s stock. The Company uses historical data to estimate option exercises and non-employee director terminations within the valuation model. The dividend yield assumption is based on the Company’s history and expectation of dividend payouts.
68
Table of Contents
Accuracy of Fair Value Estimates
The Company is responsible for determining the assumptions used in estimating the fair value of its share-based payment awards. The Company’s determination of fair value of share-based payment awards on the date of grant using an option-pricing model is affected by the Company’s stock price as well as assumptions regarding a number of highly complex and subjective variables. These variables include, but are not limited to the Company’s expected stock price volatility over the term of the awards, interest rates, option forfeiture rates and actual and projected employee stock option exercise behaviors. Option-pricing models were developed for use in estimating the value of traded options that have no vesting or hedging restrictions and are fully transferable.
Restricted Stock Awards
The Company granted restricted stock awards in fiscal 2005 which entitled the holder to shares of common stock as the award vests over time. Restricted stock grants are amortized to expense over the vesting period using the straight-line method. There were no restricted stock grants during fiscal 2009 or 2008.
14. INCOME TAXES
Provision for Income Taxes
The provision for income taxes by geographic operations is as follows (in thousands):
| Years Ended August 31, |
2009 | 2008 | 2007 | |||||||||
| U.S. operations |
$ | 63,650 | $ | 59,767 | $ | 49,274 | ||||||
| Non-U.S. operations |
3,522 | 4,263 | 4,035 | |||||||||
| Total provision for income taxes |
$ | 67,172 | $ | 64,030 | $ | 53,309 | ||||||
| The components of the provision for income taxes consist of the following (in thousands): |
| |||||||||||
| Years Ended August 31, |
2009 | 2008 | 2007 | |||||||||
| Current: |
||||||||||||
| U.S. federal |
$ | 60,547 | $ | 58,675 | $ | 49,509 | ||||||
| U.S. state and local |
6,383 | 4,661 | 4,630 | |||||||||
| Non-U.S. |
4,570 | 5,664 | 5,524 | |||||||||
| Total current taxes |
$ | 71,500 | $ | 69,000 | $ | 59,663 | ||||||
| Deferred: |
||||||||||||
| U.S. federal |
$ | (3,050 | ) | $ | (3,297 | ) | $ | (4,467 | ) | |||
| U.S. state and local |
(230 | ) | (272 | ) | (398 | ) | ||||||
| Non-U.S. |
(1,048 | ) | (1,401 | ) | (1,489 | ) | ||||||
| Total deferred taxes |
(4,328 | ) | (4,970 | ) | (6,354 | ) | ||||||
| Total tax provision |
$ | 67,172 | $ | 64,030 | $ | 53,309 | ||||||
The provision for income taxes differs from the amount of income tax determined by applying the U.S. statutory federal income tax rate to income before income taxes as a result of the following factors (expressed as a percentage of income before income taxes):
| Years Ended August 31, |
2009 | 2008 | 2007 | ||||||
| Tax at federal U.S. statutory tax rate |
35.0 | % | 35.0 | % | 35.0 | % | |||
| Increase (decrease) in taxes resulting from: |
|||||||||
| State and local taxes, net of U.S. federal income tax benefit |
2.7 | 2.6 | 2.6 | ||||||
| Foreign income at other than U.S. rates |
(1.0 | ) | (1.0 | ) | (1.0 | ) | |||
| Income tax benefit from U.S. Federal R&D tax credit |
(2.2 | ) | (0.3 | ) | (1.6 | ) | |||
| Income tax benefits from foreign tax credits |
(1.3 | ) | (0.8 | ) | (1.1 | ) | |||
| Section 199 tax deduction |
(1.6 | ) | (1.4 | ) | (0.7 | ) | |||
| Income tax benefits from closure of previously filed tax returns |
(0.3 | ) | (0.3 | ) | — | ||||
| Other, net* |
0.4 | 0.1 | (0.5 | ) | |||||
| Effective tax rate |
31.7 | % | 33.9 | % | 32.7 | % |
| * | Includes income tax benefits from additional federal, state and non-U.S. tax planning and certain changes in estimates. |
69
Table of Contents
FIN 48 - Unrecognized Tax Benefits
On September 1, 2007, the Company adopted FIN 48 which prescribes a comprehensive model for the financial statement recognition, measurement, classification and disclosure of uncertain tax positions that a company has taken or expects to take on a tax return. Under FIN 48, a company can recognize the financial effect of an income tax position only if it is more likely than not (greater than 50%) that the tax position will prevail upon tax examination, based solely on the technical merits of the tax position. Otherwise, no benefit or expense can be recognized in the consolidated financial statements. The tax benefits recognized are measured based on the largest benefit that has a greater than fifty percent likelihood of being realized upon ultimate settlement. Additionally, companies are required to accrue interest and related penalties, if applicable, on all tax exposures for which reserves have been established consistent with jurisdictional tax laws. As a result of the adoption of FIN 48, the Company reduced current taxes payable by $0.2 million and increased non-current deferred tax assets by $1.1 million. The adoption of FIN 48 was accounted for as a cumulative effect of a change in accounting principle and accordingly, increased retained earnings by $1.3 million.
Gross unrecognized tax benefits at September 1, 2007 were $4.1 million, of which $0.9 million related to the accrual of interest. FactSet historically classified unrecognized tax benefits in current taxes payable. In implementing FIN 48, the Company has reclassified unrecognized tax benefits for which the Company does not anticipate payment or receipt of cash within one year to long-term taxes payable. The Company’s policy to include interest and penalties related to income taxes, including unrecognized tax benefits, within the provision for income taxes did not change as a result of implementing FIN 48. As of the date of adoption of FIN 48, the Company had accrued $0.9 million in taxes payable for the payment of interest relating to unrecognized tax benefits.
As of August 31, 2009, the Company had gross unrecognized tax benefits totaling $6.4 million, including $1.0 million of accrued interest, recorded as non-current taxes payable in the Statement of Financial Condition. Unrecognized tax benefits represent tax positions taken on tax returns but not yet recognized in the consolidated financial statements. If recognized, essentially all of the unrecognized tax benefits and related interest would be recorded as a benefit to tax expense on the consolidated statement of income. Audits by five tax authorities are currently ongoing. The Company has no reason to believe that such audits will result in the payment of additional taxes and/or penalties that would have a material adverse effect on the Company’s results of operations or financial position, beyond current estimates. Any changes in accounting estimates resulting from new developments with respect to uncertain tax positions will be recorded as appropriate. The Company does not currently anticipate that the total amounts of unrecognized tax benefits will significantly change within the next 12 months.
The following table summarizes the changes in the balance of gross unrecognized tax benefits from September 1, 2007 to August 31, 2009 (in thousands):
| Unrecognized tax benefits at September 1, 2007 |
$ | 4,107 | ||
| Additions based on tax positions related to the current year |
499 | |||
| Additions for tax positions of prior years (includes $0.3 million for the payment of interest) |
531 | |||
| Reductions for tax positions of prior years |
— | |||
| Lapse of statue of limitations |
(603 | ) | ||
| Reductions from settlements with taxing authorities |
(629 | ) | ||
| Unrecognized income tax benefits at August 31, 2008 |
$ | 3,905 | ||
| Additions based on tax positions related to the current year |
1,372 | |||
| Additions for tax positions of prior years (includes $0.4 million for the payment of interest) |
1,902 | |||
| Reductions for tax positions of prior years |
— | |||
| Lapse of statue of limitations |
(742 | ) | ||
| Reductions from settlements with taxing authorities |
— | |||
| Unrecognized income tax benefits at August 31, 2009 |
$ | 6,437 | ||
In the normal course of business, the Company’s tax filings are subject to audit by federal, state and foreign tax authorities. At August 31, 2009, the Company remained subject to examination in the following major tax jurisdictions for the tax years as indicated below:
| Major Tax Jurisdictions |
Open Tax Years | |
| U.S. |
||
| Federal |
2007 through 2009 | |
| State (various) |
2003 through 2009 | |
| Europe |
||
| France |
2004 through 2009 | |
| United Kingdom |
2005 through 2009 |
70
Table of Contents
Deferred Tax Assets and Liabilities
The significant components of deferred tax assets that are recorded in the Consolidated Statements of Financial Condition were as follows (in thousands):
| At August 31, |
2009 | 2008 | ||||||
| Deferred tax assets |
||||||||
| Current |
||||||||
| Allowance for doubtful accounts |
$ | 650 | $ | 637 | ||||
| Deferred rent |
3,559 | 2,529 | ||||||
| Other |
110 | 105 | ||||||
| Net current deferred taxes |
4,319 | 3,271 | ||||||
| Non-current |
||||||||
| Depreciation on property, equipment and leasehold improvements |
1,398 | 1,483 | ||||||
| Deferred rent |
2,814 | 2,812 | ||||||
| SFAS 123(R) stock-based compensation |
9,293 | 7,033 | ||||||
| Purchased intangible assets, including acquired technology |
(1,871 | ) | (1,892 | ) | ||||
| Restricted stock |
— | 367 | ||||||
| Other |
661 | 476 | ||||||
| Net non-current deferred taxes |
12,295 | 10,279 | ||||||
| Total deferred tax assets |
$ | 16,614 | $ | 13,550 | ||||
| The significant components of deferred tax liabilities that are recorded in the Consolidated Statements of Financial Condition were as follows (in thousands): |
||||||||
| At August 31, |
2009 | 2008 | ||||||
| Deferred tax liabilities (non-current) |
||||||||
| Purchased intangible assets, including acquired technology |
$ | 4,594 | $ | 5,477 | ||||
| SFAS 123(R) stock-based compensation |
(724 | ) | (559 | ) | ||||
| Other |
(76 | ) | 204 | |||||
| Net deferred tax liabilities |
$ | 3,794 | $ | 5,122 | ||||
A provision has not been made for additional U.S. Federal or foreign taxes as of August 31, 2009 on undistributed earnings of foreign subsidiaries because the Company intends to reinvest these funds indefinitely to support foreign growth opportunities. It is not practicable to estimate the unrecognized deferred tax liability on these undistributed earnings. These earnings could become subject to additional tax if they are remitted as dividends, loaned to FactSet, or upon sale of the subsidiary’s stock.
Operating segments are defined as components of an enterprise that engage in business activities from which it may earn revenues and incur expenses, whose operating results are regularly reviewed by the enterprise’s chief operating decision maker (“CODM”) to make decisions about resources to be allocated to the segment and assess its performance, and for which discrete financial information is available. FactSet’s CODM is its Chief Executive Officer, who is responsible for making decisions about resources allocated amongst the operating segments based on actual results.
The Company’s operations are organized into three reportable segments based on geographic operations: the U.S., Europe and Asia Pacific. Each segment markets online integrated database services to investment managers, investment banks and other financial services professionals. The U.S. segment services financial institutions throughout North America, while the European and Asia Pacific segments service investment professionals located throughout Europe, Asia and other regions.
The European segment is headquartered in London, England and maintains office locations in France, Germany, the Netherlands and Italy. The Asia Pacific segment is headquartered in Tokyo, Japan with office locations in Hong Kong, Australia, India and the Philippines. Sales, consulting, data collection, and engineering personnel are the primary functional groups based at foreign operations. Segment revenues reflect direct sales to clients based in their respective geographic locations. There are no intersegment or intercompany sales of the FactSet service. Each segment records compensation, including stock-based compensation, amortization of intangible assets, depreciation of furniture and fixtures, amortization of
71
Table of Contents
leasehold improvements, communication costs, professional fees, rent expense, travel, marketing, office and other direct expenses related to its employees. Expenditures associated with the Company’s data centers, product development and corporate headquarters charges are recorded by the U.S. segment and are not allocated to the European and Asia Pacific segments. Of the total $181.4 million of goodwill reported by the Company at August 31, 2009, 55% was recorded in the U.S. segment, 43% in the European segment and the remaining 2% in the Asia Pacific segment. The accounting policies of the segments are the same as those described in the Note 2, Summary of Significant Accounting Policies.
The following tables reflect the results of operations of the segments consistent with the Company’s management system. These results are used, in part, by management, both in evaluating the performance of, and in allocating resources to, each of the segments (in thousands).
| U.S. | Europe | Asia Pacific | Total | |||||||||
| Year Ended August 31, 2009 |
||||||||||||
| Revenues from clients |
$ | 423,926 | $ | 156,610 | $ | 41,487 | $ | 622,023 | ||||
| Segment operating profit* |
142,893 | 47,601 | 20,536 | 211,030 | ||||||||
| Total assets |
410,420 | 202,736 | 19,981 | 633,137 | ||||||||
| Depreciation and amortization |
26,992 | 6,750 | 595 | 34,337 | ||||||||
| Stock-based compensation |
12,067 | 1,394 | 162 | 13,623 | ||||||||
| Capital expenditures |
19,144 | 2,772 | 2,124 | 24,040 | ||||||||
| Year Ended August 31, 2008 |
||||||||||||
| Revenues from clients |
$ | 398,317 | $ | 141,062 | $ | 36,140 | $ | 575,519 | ||||
| Segment operating profit* |
123,971 | 38,104 | 21,812 | 183,887 | ||||||||
| Total assets |
386,572 | 185,763 | 14,939 | 587,274 | ||||||||
| Depreciation and amortization |
23,907 | 6,461 | 286 | 30,654 | ||||||||
| Stock-based compensation |
11,892 | 1,494 | 265 | 13,651 | ||||||||
| Capital expenditures |
31,461 | 3,997 | 322 | 35,780 | ||||||||
| Year Ended August 31, 2007 |
||||||||||||
| Revenues from clients |
$ | 335,304 | $ | 114,335 | $ | 26,162 | $ | 475,801 | ||||
| Segment operating profit* |
100,916 | 38,501 | 15,674 | 155,091 | ||||||||
| Total assets |
367,083 | 148,992 | 7,675 | 523,750 | ||||||||
| Depreciation and amortization |
21,768 | 6,440 | 352 | 28,560 | ||||||||
| Stock-based compensation |
7,976 | 898 | 249 | 9,123 | ||||||||
| Capital expenditures |
34,461 | 4,632 | 158 | 39,251 | ||||||||
| * | Expenditures associated with the Company’s data centers, product development and corporate headquarters charges are recorded by the U.S. segment and are not allocated to the European and Asia Pacific segments. |
SIGNIFICANT CLIENTS - No single client represented 10% or more of FactSet’s total revenues in any fiscal year presented. No individual client accounted for more than 2% of total subscriptions as of August 31, 2009. Subscriptions from the ten largest clients did not surpass 16% of total client subscriptions.
SIGNIFICANT VENDORS - FactSet maintains contractual relationships with a minimum of two content providers for each type of financial data, when possible. No single vendor or data supplier represented 10% or more of FactSet’s total expenses in any fiscal year presents.
GEOGRAPHIC INFORMATION - The following provides information for those countries that are 10% or more of the specific category (in thousands).
| Years Ended August 31, |
2009 | 2008 | 2007 | ||||||
| Revenues* |
|||||||||
| United States |
$ | 423,926 | $ | 398,317 | $ | 335,304 | |||
| United Kingdom |
91,811 | 82,697 | 67,015 | ||||||
| All other European countries |
64,799 | 58,365 | 47,320 | ||||||
| Asia Pacific |
41,487 | 36,140 | 26,162 | ||||||
| Total revenues |
$ | 622,023 | $ | 575,519 | $ | 475,801 | |||
| * | Revenues are attributed to countries based on the location of the client. |
72
Table of Contents
| At August 31, |
2009 | 2008 | 2007 | ||||||
| Long-lived Assets* |
|||||||||
| United States |
$ | 80,553 | $ | 88,957 | $ | 78,493 | |||
| United Kingdom** |
33,592 | 39,303 | 18,019 | ||||||
| France |
15,858 | 18,508 | 18,124 | ||||||
| All other European countries |
1,395 | 1,423 | 14 | ||||||
| Asia Pacific |
3,331 | 1,255 | 1,084 | ||||||
| Total long-lived assets |
$ | 134,729 | $ | 149,446 | $ | 115,734 | |||
| * | Long-lived assets consist of property, equipment, leasehold improvements and identifiable intangible assets, net of accumulated depreciation and amortization and exclude goodwill, deferred taxes and other assets. |
| ** | Significant increase in long-lived assets within the United Kingdom in fiscal 2008 is the result of intangible assets acquired in connection with the acquisition of the Thomson Fundamentals business on July 24, 2008. |
16. COMMITMENTS AND CONTINGENCIES
Commitments represent obligations, such as those for future purchases of goods or services that are not yet recorded on the balance sheet as liabilities. FactSet records liabilities for commitments when incurred (i.e., when the goods or services are received).
Lease Commitments
At August 31, 2009, the Company leases approximately 169,000 square feet of office space in its headquarters in Norwalk, Connecticut. In addition, FactSet leases office space in the U.S. in New York, New York; Boston, Massachusetts; Chicago, Illinois; Manchester, New Hampshire; Reston, Virginia; Austin, Texas; San Mateo and Santa Monica, California; Newark, New Jersey; and Tuscaloosa, Alabama. Outside the U.S. the Company’s operations are conducted in leased office space in London, England; Paris and Avon, France; Amsterdam, the Netherlands; Frankfurt, Germany; Milan, Italy; Tokyo, Japan; Hong Kong; Hyderabad and Mumbai, India; Sydney, Australia; and Metro Manila, the Philippines. The leases expire on various dates through March 2021. Total minimum rental payments associated with the leases are recorded as rent (a component of selling, general and administrative expenses) on a straight-line basis over the periods of the respective non-cancelable lease terms.
During fiscal 2009, the Company entered into new lease agreements in the ordinary course of business to support operations in New York, Hong Kong, Hyderabad and Manila. The new office space expanded existing locations by 83,000 square feet and increased total leased office space by 16%. The additional office space is necessary to support the Company’s employee base that grew 53% over the last twelve months. New space in Hyderabad and Manila was driven by the growth of the FactSet proprietary content collection operation.
| Office Location |
Expansion Period | Incremental Future Minimum Rental Payments (in thousands) | |||
| New York, New York |
2015 | $ | 2,920 | ||
| Hong Kong |
2012 | $ | 2,343 | ||
| Hyderabad, India |
2014 | $ | 2,139 | ||
| Metro Manila, the Philippines |
2014 | $ | 894 | ||
At August 31, 2009, the Company’s lease commitments for office space provide for the following future minimum rental payments under non-cancelable operating leases with remaining terms in excess of one year (in thousands):
| Years Ended August 31, |
Minimum Lease Payments | ||
| 2010 |
$ | 20,778 | |
| 2011 |
21,061 | ||
| 2012 |
19,527 | ||
| 2013 |
18,611 | ||
| 2014 |
14,856 | ||
| Thereafter |
57,669 | ||
| Total |
$ | 152,502 | |
During fiscal 2009, 2008 and 2007, rental expense for all operating leases amounted to approximately $26.7 million, $22.1 million and $18.8 million, respectively.
73
Table of Contents
Approximately $4.4 million of standby letters of credit have been issued during the ordinary course of business in connection with the Company’s current lease commitments as of August 31, 2009.
Legal matters
FactSet accrues non income-tax liabilities for contingencies when management believes that a loss is probable and the amounts can be reasonably estimated, while contingent gains are recognized only when realized. The Company is subject to legal proceedings, claims, and litigation arising in the ordinary course of business. Although management currently believes that resolving claims against the Company, individually or in the aggregate, will not have a material adverse impact on its consolidated financial position, results of operations or cash flows, these matters are subject to inherent uncertainties and management’s view of these matters may change in the future.
Income Taxes
Uncertain income tax positions are accounted for in accordance with FIN 48 (see Note 14). FactSet is currently under audit by five tax authorities. The Company has reserved for potential adjustments to its provision for income taxes that may result from examinations by, or any negotiated agreements with, these tax authorities, and the Company believes that the final outcome of these examinations or agreements will not have a material effect on its results of operations. If events occur which indicate payment of these amounts is unnecessary, the reversal of the liabilities would result in the recognition of tax benefits in the period FactSet determines the liabilities are no longer necessary. If the Company’s estimates of the federal, state, and foreign income tax liabilities are less than the ultimate assessment, a further charge to expense would result.
Indemnifications
As permitted or required under Delaware law and to the maximum extent allowable under that law, FactSet has certain obligations to indemnify its current and former officers and directors for certain events or occurrences while the officer or director is, or was serving, at FactSet’s request in such capacity. These indemnification obligations are valid as long as the director or officer acted in good faith and in a manner the person reasonably believed to be in or not opposed to the best interests of the Company, and with respect to any criminal action or proceeding, had no reasonable cause to believe his or her conduct was unlawful. The maximum potential amount of future payments FactSet could be required to make under these indemnification obligations is unlimited; however, FactSet has a director and officer insurance policy that mitigates FactSet’s exposure and enables FactSet to recover a portion of any future amounts paid. The Company believes the estimated fair value of these indemnification obligations is minimal.
17. REVOLVING CREDIT FACILITIES
The Company maintains its three-year credit facility with JPMorgan Chase Bank. The credit facility is available in an aggregate principal amount of up to $12.5 million for working capital and general corporate purposes, maturing on March 31, 2011. Approximately $3.4 million of the credit facility has been utilized for standby letters of credit issued during the ordinary course of business as of August 31, 2009. The Company is obligated to pay a commitment fee on the unused portion of the facility at a weighted average annual rate of 0.125%. The facility also contains covenants that, among other things, require the Company to maintain minimum levels of consolidated net worth and certain leverage and fixed charge ratios.
18. RISK AND CONCENTRATIONS OF CREDIT RISK
Cash and cash equivalents are maintained with several financial institutions. Deposits held with banks may exceed the amount of insurance provided on such deposits. Generally, these deposits may be redeemed upon demand and are maintained with financial institutions with reputable credit and therefore bear minimal credit risk. The Company seeks to mitigate its credit risks by spreading such risks across multiple counterparties and monitoring the risk profiles of these counterparties.
In the normal course of business, securities transactions of commission clients of FDS are cleared through its designated clearing broker. Pursuant to an agreement between FDS and its designated clearing broker, the clearing broker has the right to charge FDS for unsecured losses that result from a client’s failure to complete such transactions. The Company has never experienced significant losses and, therefore, has not recorded a liability with regard to the right. The Company seeks to control the credit risk of nonperformance by considering the creditworthiness of its clients. The receivable from the Company’s designated clearing broker represents a concentration of credit risk in that securities transactions cleared through its clearing broker bears the potential for liability if unwound or unconsummated.
Financial instruments, which potentially subject the Company to concentrations of credit risk, consist principally of trade accounts receivable and derivative instruments. FactSet performs ongoing credit evaluations of its clients and does not require collateral from its clients. The Company reviews its receivables from clients for collectability and provides for an allowance for doubtful accounts to the extent that amounts are not expected to be collected. No individual client accounted for more than 2% of total subscriptions as of August 31, 2009. Subscriptions from the ten largest clients did not surpass 16% of total client subscriptions. At August 31, 2009 and 2008, the receivable reserve was $1.7 million, respectively.
74
Table of Contents
19. SUBSEQUENT EVENTS
On October 1, 2009, Michael F. DiChristina stepped down from his position as President and Chief Operating Officer. Mr. DiChristina, who has been with FactSet since 1986 and had been in his current role since 1999, will continue to serve on the Company’s Board of Directors.
In addition, the following changes were effective as of October 1, 2009:
| • | Peter Walsh, FactSet’s Chief Financial Officer since 2005, was promoted to Chief Operating Officer; and |
| • | Maurizio Nicolelli, the Company’s Comptroller was appointed to Senior Vice President, Director of Finance and Principal Financial Officer. |
FactSet has performed an evaluation of subsequent events through October 30, 2009, which is the date the financial statements were issued.
20. UNAUDITED QUARTERLY FINANCIAL DATA
The following table presents selected unaudited financial information for the eight quarters in the period ended August 31, 2009. The results for any quarter are not necessarily indicative of future quarterly results and, accordingly, period-to-period comparisons should not be relied upon as an indication of future performance.
| 2009 |
First Quarter |
Second Quarter |
Third Quarter |
Fourth Quarter | ||||||||
| Revenues |
$ | 155,632 | $ | 156,542 | $ | 154,387 | $ | 155,462 | ||||
| Cost of services |
53,332 | 52,537 | 50,847 | 52,648 | ||||||||
| Selling, general and administrative |
50,970 | 51,969 | 50,234 | 48,456 | ||||||||
| Operating income |
51,330 | 52,036 | 53,306 | 54,358 | ||||||||
| Net income |
35,585 | 34,555 | 38,536 | 36,274 | ||||||||
| Diluted earnings per common share |
$ | 0.73 | $ | 0.71 | $ | 0.79 | $ | 0.74 | ||||
| Weighted average common shares (diluted) |
49,076 | 48,500 | 48,836 | 48,880 | ||||||||
| 2008 |
First Quarter |
Second Quarter |
Third Quarter |
Fourth Quarter | ||||||||
| Revenues |
$ | 134,175 | $ | 140,238 | $ | 147,399 | $ | 153,707 | ||||
| Cost of services |
44,943 | 47,478 | 48,134 | 50,684 | ||||||||
| Selling, general and administrative |
46,735 | 49,520 | 51,346 | 52,792 | ||||||||
| Operating income |
42,497 | 43,240 | 47,919 | 50,231 | ||||||||
| Net income |
29,399 | 29,492 | 32,542 | 33,584 | ||||||||
| Diluted earnings per common share |
$ | 0.58 | $ | 0.59 | $ | 0.65 | $ | 0.67 | ||||
| Weighted average common shares (diluted) |
50,610 | 50,023 | 49,821 | 50,341 | ||||||||
75
Table of Contents
| ITEM 9. | CHANGES IN AND DISAGREEMENTS WITH ACCOUNTANTS ON ACCOUNTING AND FINANCIAL DISCLOSURE |
None.
| ITEM 9A. | CONTROLS AND PROCEDURES |
Evaluation of Disclosure Controls and Procedures
Under the supervision and with the participation of the Company’s management, including the principal executive officer and principal financial officer, the Company has evaluated the effectiveness of its disclosure controls and procedures pursuant to Rules 13a-15(e) and 15d-15(e) under the Securities Exchange Act of 1934, as of the end of the annual period covered by this report. Based on that evaluation, the principal executive officer and principal financial officer have concluded that the Company’s disclosure controls and procedures as defined in Rules 13a-15(e) and 15d-15(e) under the Securities Exchange Act of 1934, as amended, (the “Exchange Act”) are effective to ensure that information required to be disclosed by the Company in reports that it files or submits under the Exchange Act is recorded, processed, summarized and reported within the time periods specified in Securities and Exchange Commission rules and forms and is accumulated and communicated to the Company’s management, including its principal executive officer and principal financial officer, as appropriate to allow timely decisions regarding required disclosure.
Changes in Internal Control Over Financial Reporting
The Company regularly reviews its system of internal control over financial reporting and makes changes to its processes and systems to improve controls and increase efficiency, while ensuring that the Company maintains an effective internal control environment. Changes may include such activities as implementing new, more efficient systems, consolidating activities, and migrating processes.
There have been no changes in the Company’s internal control over financial reporting (as such term is defined in Rules 13a-15(f) and 15d-15(f) under the Exchange Act) during the fourth quarter of fiscal 2009 that has materially affected, or is reasonably likely to materially affect, the Company’s internal control over financial reporting.
Management’s Report on Internal Control over Financial Reporting
See Management’s Report on Internal Control over Financial Reporting under Item 8 on page 42.
Report of Independent Registered Public Accounting Firm
See Report of Independent Registered Public Accounting Firm under Item 8 on page 43.
| ITEM 9B. | OTHER INFORMATION |
None.
76
Table of Contents
PART III
| ITEM 10. | DIRECTORS, EXECUTIVE OFFICERS AND CORPORATE GOVERNANCE |
The information required by this item relating to our directors and nominees, regarding compliance with Section 16(a) of the Securities Act of 1934, and regarding our Audit Committee is included under the captions “Corporate Governance” and “Security Ownership of Certain Beneficial Owners and Management” and contained in the definitive Proxy Statement dated October 30, 2009, all of which information we include here by reference.
Pursuant to General Instruction G(3) of Form 10-K, the information required by this item relating to our executive officers is included under the caption “Executive Officers” of the Company’s definitive Proxy Statement dated October 30, 2009, all of which information we include here by reference.
We have adopted a code of ethics that applies to our principal executive officer and all members of our finance department, including the principal financial officer and principal accounting officer. This code of ethics, which consists of the “Code of Ethical Conduct for Financial Managers,” is posted on our website. The Internet address for our Website is www.factset.com, and the code of ethics may be found in the “Investor Relations” section under “Corporate Governance.” All employees, officers and directors are also subject to our “Code of Business Conduct and Ethics,” also posted on the “Corporate Governance” page of our website and the same information is available in print free of charge to any stockholder who submits a written request to the Company’s Investor Relations department at its corporate headquarters.
We intend to satisfy the disclosure requirement under Item 5.05 of Form 8-K regarding an amendment to (other than technical, administrative or non-substantive amendments), or waiver from, a provision of each code of ethics by posting such information on our website, at the address and general location specified above.
| ITEM 11. | EXECUTIVE COMPENSATION |
The information required by this item relating to our executive compensation is included under the caption “Executive Compensation” contained in the definitive Proxy Statement dated October 30, 2009, all of which information we include here by reference.
| ITEM 12. | SECURITY OWNERSHIP OF CERTAIN BENEFICIAL OWNERS AND MANAGEMENT AND RELATED STOCKHOLDER MATTERS |
The information required by this item relating to security ownership of certain beneficial owners and management is included under the caption “Security Ownership of Certain Beneficial Owners and Management” and the information required by this item relating to securities authorized for issuance under equity compensation plans is included under the caption “Equity Compensation Plan Information,” in the definitive Proxy Statement dated October 30, 2009, all of which information we include here by reference.
| ITEM 13. | CERTAIN RELATIONSHIPS AND RELATED TRANSACTIONS, AND DIRECTOR INDEPENDENCE |
The information required by this item relating to review, approval or ratification of transactions with related persons is included under the caption “Certain Relationships and Related Transactions” and the information required by this item relating to director independence is included under the captions “Corporate Governance” and “Director Compensation,” contained in the definitive Proxy Statement dated October 30, 2009, all of which information we include here by reference.
| ITEM 14. | PRINCIPAL ACCOUNTING FEES AND SERVICES |
The information required by this item is included under the captions “Proposal No. 2: Ratification of Independent Registered Public Accounting Firm” in the definitive Proxy Statement dated October 30, 2009, all of which information we include here by reference.
77
Table of Contents
PART IV
| ITEM 15. | EXHIBITS AND FINANCIAL STATEMENT SCHEDULES |
1. Consolidated Financial Statements
The Index to Consolidated Financial Statements under Item 8 on page 41 is incorporated herein by reference as the list of financial statements required as part of this report.
2. Financial Statement Schedule
Schedule II – Valuation and Qualifying Accounts
Years Ended August 31, 2009, 2008, and 2007 (in thousands):
| Allowance for doubtful accounts and billing adjustments (1) |
Balance at Beginning of Year |
Charged to Expense/ Against Revenue |
Write-offs, Net of Recoveries |
Balance at End of Year | ||||||||
| 2009 |
$ | 1,681 | $ | 2,488 | $ | 2,457 | $ | 1,712 | ||||
| 2008 |
$ | 1,362 | $ | 2,237 | $ | 1,918 | $ | 1,681 | ||||
| 2007 |
$ | 1,162 | $ | 1,482 | $ | 1,282 | $ | 1,362 | ||||
| (1) | Additions to the allowance for doubtful accounts are charged to bad debt expense. Additions to the allowance for billing adjustments are charged against revenues. |
Additional financial statement schedules have been omitted since they are either not required, not applicable, or the information is otherwise included.
3. Exhibits
| EXHIBIT |
DESCRIPTION | |
| 3.1 | Restated Certificate of Incorporation (1) | |
| 3.2 | Amendment to Restated Certificate of Incorporation (2) | |
| 3.3 | By-laws of FactSet Research Systems Inc. (3) | |
| 3.4 | Amended and Restated By-laws of FactSet Research Systems Inc. (13) | |
| 4.1 | Form of Common Stock (1) | |
| 10.1 | Ninth Amendment to 364-Day Credit Agreement, dated February 29, 2008 (4) | |
| 10.2 | Third Amendment to the Three-Year Credit Agreement, dated February 28, 2008 (4) | |
| 10.3 | The FactSet Research Systems Inc. 1994 Stock Option Plan and 1996 Stock Option Plan (5) | |
| 10.4 | The FactSet Research Systems Inc. 2000 Stock Option Plan (6) | |
| 10.5 | The FactSet Research Systems Inc. 2004 Stock Option Plan (7) | |
| 10.6 | The FactSet Research Systems Inc. 1998 Non-Employee Directors’ Stock Option Plan (8) | |
| 10.7 | The FactSet Research Systems Inc. 2008 Non-Employee Directors’ Stock Option Plan (9) | |
| 10.8 | The FactSet Research Systems Inc. 2001 Employee Stock Purchase Plan (10) | |
| 10.9 | The FactSet Research Systems Inc. 2008 Employee Stock Purchase Plan (9) | |
| 10.10 | Purchase Agreement, dated as of April 22, 2008, among Thomson Financial Limited, FactSet Europe Limited and FactSet Research Systems Inc. (11) | |
| 10.11 | Transition Services Agreement, dated as of July 24, 2008, among FactSet Europe Limited and Thomson Financial Limited (12) | |
| 21 | Subsidiaries of the Registrant | |
| 23 | Consent of Independent Registered Public Accounting Firm | |
| 31.1 | Section 302 Certification of Principal Executive Officer | |
| 31.2 | Section 302 Certification of Principal Financial Officer | |
| 32.1 | Section 906 Certification of Principal Executive Officer | |
| 32.2 | Section 906 Certification of Principal Financial Officer | |
| (1) | Incorporated by reference to the Company’s Registration Statement on Form S-1 (File No. 333-4238). |
| (2) | Incorporated by reference to the Company’s annual report on Form 10-K for fiscal year 2001. |
78
Table of Contents
| (3) | Incorporated by reference to the Company’s quarterly report on Form 10-Q for the third quarter of fiscal year 2000. |
| (4) | Incorporated by reference to the Company’s quarterly report on Form 10-Q for the second quarter of fiscal year 2008. |
| (5) | Incorporated by reference to the Company’s Registration Statement on Form S-8 (File No. 333-22319). |
| (6) | Incorporated by reference to the Company’s Registration Statement on Form S-8 (File No. 333-56870). |
| (7) | Incorporated by reference to the Company’s Registration Statement on Form S-8 (File No. 333-134298). |
| (8) | Incorporated by reference to the Company’s Registration Statement on Form S-8 (File No. 333-59839). |
| (9) | Incorporated by reference to the Company’s Registration Statement on Form S-8 (File No. 333-156649). |
| (10) | Incorporated by reference to the Company’s Registration Statement on Form S-8 (File No. 333-57880). |
| (11) | Incorporated by reference to the Company’s quarterly report on Form 10-Q/A for the third quarter of fiscal year 2008. |
| (12) | Incorporated by reference to the Company’s Form 8-K filed on July 24, 2008. |
| (13) | Incorporated by reference to the Company’s quarterly report on Form 10-Q for the first quarter of fiscal year 2009. |
79
Table of Contents
Pursuant to the requirements of Section 13 or 15(d) of the Securities Exchange Act of 1934, the registrant has duly caused this report to be signed on its behalf by the undersigned, thereunto duly authorized.
| FACTSET RESEARCH SYSTEMS INC. | ||||
| (Registrant) | ||||
| Date: October 30, 2009 | /s/ PHILIP A. HADLEY | |||
| Philip A. Hadley | ||||
| Chairman and Chief Executive Officer | ||||
| (Principal Executive Officer) | ||||
Pursuant to the requirements of the Securities Exchange Act of 1934, this report has been signed below by the following persons on behalf of the registrant and in the capacities and on the dates indicated.
| Name |
Title |
Date | ||
| /s/ PHILIP A. HADLEY Philip A. Hadley |
Chairman and Chief Executive Officer (Principal Executive Officer) | October 30, 2009 | ||
| /s/ MAURIZIO NICOLELLI Maurizio Nicolelli |
Senior Vice President and Director of Finance (Principal Financial Officer) | October 30, 2009 | ||
| /s/ MATTHEW J. MCNULTY Matthew J. McNulty |
Vice President and Controller (Principal Accounting Officer) | October 30, 2009 | ||
| /s/ CHARLES J. SNYDER Charles J. Snyder |
Vice Chairman of the Board of Directors | October 30, 2009 | ||
| /s/ JAMES J. MCGONIGLE James J. McGonigle |
Lead Independent Director | October 30, 2009 | ||
| /s/ SCOTT A. BILLEADEAU Scott A. Billeadeau |
Director | October 30, 2009 | ||
| /s/ MICHAEL F. DICHRISTINA Michael F. DiChristina |
Director | October 30, 2009 | ||
| /s/ JOSEPH E. LAIRD, JR. Joseph E. Laird, Jr. |
Director | October 30, 2009 | ||
| /s/ WALTER F. SIEBECKER Walter F. Siebecker |
Director | October 30, 2009 | ||
| /s/ JOSEPH R. ZIMMEL Joseph R. Zimmel |
Director | October 30, 2009 | ||
80