Attached files
UNITED STATES
SECURITIES AND EXCHANGE COMMISSION
Washington, D.C. 20549
FORM 10-Q
x Quarterly Report Pursuant to Section 13 or 15(d) of the Securities Exchange Act of 1934
For the quarterly period ended September 30, 2009
oTransition Report Pursuant to Section 13 or 15(d) of the Securities Exchange Act of 1934
For the transition period from __to ___
Commission file number 1-9735
BERRY PETROLEUM COMPANY
(Exact name of registrant as specified in its charter)
|
DELAWARE |
77-0079387 |
|
(State of incorporation or organization) |
(I.R.S. Employer Identification Number) |
1999 Broadway, Suite 3700
Denver, Colorado 80202
(Address of principal executive offices, including zip code)
Registrant's telephone number, including area code: (303) 999-4400
Indicate by check mark whether the registrant (1) has filed all reports required to be filed by Section 13 or 15(d) of the Securities Exchange Act of 1934 during the preceding 12 months (or for such shorter period that the registrant was required to file such reports), and (2) has been subject to such filing requirements for the past 90 days.
YES x NO o
Indicate by check mark whether the registrant has submitted electronically and posted on its corporate Web site, if any, every
Interactive Data File required to be submitted and posted pursuant to Rule 405 of Regulation S-T (§232.405 of this chapter) during the
preceding 12 months (or for such shorter period that the registrant was required to submit and post such files). YES o NO o
Indicate by check mark whether the registrant is a large accelerated filer, an accelerated filer, a non-accelerated filer, or a smaller reporting company. See definitions of “large accelerated filer,” “accelerated filer” and “smaller reporting company” in Rule 12b-2 of the Exchange Act.
Large accelerated filerx Accelerated filero Non-accelerated filero Smaller reporting companyo
Indicate by check mark whether the registrant is a shell company (as defined in Rule 12b-2 of the Act). YES o NO x
As of October 19, 2009, the registrant had 42,860,540 shares of Class A Common Stock ($.01 par value) outstanding. The registrant also had 1,797,784 shares of Class B Stock ($.01 par value) outstanding on October 19, 2009 all of which is held by an affiliate of the registrant.
1
BERRY PETROLEUM COMPANY
THIRD QUARTER 2009 FORM 10-Q
TABLE OF CONTENTS
|
PART I. FINANCIAL INFORMATION |
Page | |
|
Item 1. Financial Statements |
3 | |
|
3 | ||
|
4 | ||
|
4 | ||
|
5 | ||
|
5 | ||
|
6 | ||
|
7 | ||
|
19 | ||
|
31 | ||
|
35 | ||
|
PART II.
OTHER INFORMATION |
||
|
36 | ||
|
36 | ||
|
38 | ||
|
38 | ||
|
38 | ||
|
38 | ||
|
39 |
BERRY PETROLEUM COMPANY
Unaudited Condensed Balance Sheets
(In Thousands, Except Share Information)
|
September 30, 2009 |
December 31, 2008 |
|||||||
|
ASSETS |
||||||||
|
Current assets: |
||||||||
|
Cash and cash equivalents |
$ | 975 | $ | 240 | ||||
|
Short-term investments |
67 | 66 | ||||||
|
Accounts receivable, net of allowance for doubtful accounts of $38,508 and $38,511 |
67,726 | 65,873 | ||||||
|
Fair value of derivatives |
30,460 | 111,886 | ||||||
|
Crude oil inventory |
1,393 | - | ||||||
|
Prepaid expenses and other |
8,780 | 11,015 | ||||||
|
Total current assets |
109,401 | 189,080 | ||||||
|
Oil and gas properties (successful efforts basis), buildings and equipment, net |
2,096,897 | 2,254,425 | ||||||
|
Fair value of derivatives |
1,002 | 79,696 | ||||||
|
Other assets |
33,245 | 19,182 | ||||||
| $ | 2,240,545 | $ | 2,542,383 | |||||
|
LIABILITIES AND SHAREHOLDERS' EQUITY |
||||||||
|
Current liabilities: |
||||||||
|
Accounts payable |
$ | 53,755 | $ | 119,221 | ||||
|
Revenue and royalties payable |
14,325 | 34,416 | ||||||
|
Accrued liabilities |
45,630 | 34,566 | ||||||
|
Line of credit |
12,500 | 25,300 | ||||||
|
Income taxes payable |
498 | 187 | ||||||
|
Fair value of derivatives |
21,441 | 1,445 | ||||||
|
Deferred income taxes |
892 | 45,490 | ||||||
|
Total current liabilities |
149,041 | 260,625 | ||||||
|
Long-term liabilities: |
||||||||
|
Deferred income taxes |
250,045 | 270,323 | ||||||
|
Senior secured revolving credit facility |
365,000 | 931,800 | ||||||
|
8 ¼ % Senior subordinated notes due 2016 |
200,000 | 200,000 | ||||||
|
10 ¼ % Senior notes due 2014, net of unamortized discount of $14,075 and $0, respectively |
435,925 | - | ||||||
|
Abandonment obligation |
43,229 | 41,967 | ||||||
|
Other long-term liabilities |
20,828 | 5,921 | ||||||
|
Fair value of derivatives |
41,316 | 4,203 | ||||||
|
Total long-term liabilities |
1,356,343 | 1,454,214 | ||||||
|
Shareholders' equity: |
||||||||
|
Preferred stock, $.01 par value, 2,000,000 shares authorized; no shares outstanding |
- | - | ||||||
|
Capital stock, $.01 par value: |
||||||||
|
Class A Common Stock, 100,000,000 shares authorized; 42,855,902 shares issued and outstanding (42,782,365 in 2008) |
427 | 427 | ||||||
|
Class B Stock, 3,000,000 shares authorized; 1,797,784 shares issued and outstanding in 2009 and 2008 (liquidation preference of $899) |
18 | 18 | ||||||
|
Capital in excess of par value |
87,398 | 79,653 | ||||||
|
Accumulated other comprehensive (loss) income |
(17,210 | ) | 113,697 | |||||
|
Retained earnings |
664,528 | 633,749 | ||||||
|
Total shareholders' equity |
735,161 | 827,544 | ||||||
| $ | 2,240,545 | $ | 2,542,383 | |||||
The accompanying notes are an integral part of these financial statements.
BERRY PETROLEUM COMPANY
Unaudited Condensed Statements of Operations
Three Months Ended September 30, 2009 and 2008
(In Thousands, Except Per Share Data)
|
Three months ended September 30, |
||||||||
|
2009 |
2008 |
|||||||
|
REVENUES AND OTHER INCOME ITEMS |
||||||||
|
Sales of oil and gas |
$ | 127,455 | $ | 193,890 | ||||
|
Sales of electricity |
9,137 | 18,317 | ||||||
|
Gas marketing |
5,217 | 13,284 | ||||||
|
Gain on derivatives |
531 | 701 | ||||||
|
Gain on sale of assets |
828 | 95 | ||||||
|
Interest and other income, net |
287 | 747 | ||||||
| 143,455 | 227,034 | |||||||
|
EXPENSES |
||||||||
|
Operating costs - oil and gas production |
39,195 | 52,486 | ||||||
|
Operating costs - electricity generation |
6,892 | 13,706 | ||||||
|
Production taxes |
3,874 | 8,912 | ||||||
|
Depreciation, depletion & amortization - oil and gas production |
33,502 | 37,354 | ||||||
|
Depreciation, depletion & amortization - electricity generation |
951 | 646 | ||||||
|
Gas marketing |
4,633 | 12,034 | ||||||
|
General and administrative |
10,686 | 14,251 | ||||||
|
Interest expense |
14,562 | 8,031 | ||||||
|
Extinguishment of debt |
329 | - | ||||||
|
Dry hole, abandonment, impairment and exploration |
69 | 1,488 | ||||||
| 114,693 | 148,908 | |||||||
|
Income before income taxes |
28,762 | 78,126 | ||||||
|
Provision for income taxes |
10,423 | 28,511 | ||||||
|
Income from continuing operations |
18,339 | 49,615 | ||||||
|
Income from discontinued operations, net of taxes |
668 | 3,733 | ||||||
|
Net income |
$ | 19,007 | $ | 53,348 | ||||
|
Basic net income from continuing operations per share |
$ | 0.41 | $ | 1.10 | ||||
|
Basic net income from discontinued operations per share |
$ | 0.01 | $ | 0.08 | ||||
|
Basic net income per share |
$ | 0.42 | $ | 1.18 | ||||
|
Diluted net income from continuing operations per share |
$ | 0.40 | $ | 1.08 | ||||
|
Diluted netincome from discontinued operations per share |
$ | 0.01 | $ | 0.08 | ||||
|
Diluted net income per share |
$ | 0.41 | $ | 1.16 | ||||
|
Dividends per share |
$ | 0.075 | $ | 0.075 | ||||
Unaudited Condensed Statements of Comprehensive Income
Three Months Ended September 30, 2009 and 2008
(In Thousands)
|
Net income |
$ | 19,007 | $ | 53,348 | ||||
|
Unrealized gains (losses) on derivatives, net of income taxes (benefits) of ($345) and $144,881, respectively |
(563 | ) | 225,693 | |||||
|
Reclassification of realized (losses) gains on derivatives included in net income, net of income taxes (benefits) of ($279) and $18,745, respectively |
(454 | ) | 30,584 | |||||
|
Comprehensive income |
$ | 17,990 | $ | 309,625 |
The accompanying notes are an integral part of these financial statements.
BERRY PETROLEUM COMPANY
Unaudited Condensed Statements of Operations
Nine Months Ended September 30, 2009 and 2008
(In Thousands, Except Per Share Data)
|
Nine months ended September 30, |
||||||||
|
2009 |
2008 |
|||||||
|
REVENUES AND OTHER INCOME ITEMS |
||||||||
|
Sales of oil and gas |
$ | 374,117 | $ | 514,578 | ||||
|
Sales of electricity |
26,032 | 51,223 | ||||||
|
Gas marketing |
17,646 | 28,046 | ||||||
|
Gain (loss) on derivatives |
6,565 | (27 | ) | |||||
|
Gain on sale of assets |
828 | 510 | ||||||
|
Interest and other income, net |
1,375 | 2,509 | ||||||
| 426,563 | 596,839 | |||||||
|
EXPENSES |
||||||||
|
Operating costs - oil and gas production |
111,317 | 144,158 | ||||||
|
Operating costs - electricity generation |
22,071 | 45,620 | ||||||
|
Production taxes |
14,411 | 20,663 | ||||||
|
Depreciation, depletion & amortization - oil and gas production |
104,271 | 87,462 | ||||||
|
Depreciation, depletion & amortization - electricity generation |
2,938 | 1,991 | ||||||
|
Gas marketing |
16,149 | 26,087 | ||||||
|
General and administrative |
37,143 | 36,312 | ||||||
|
Interest expense |
35,201 | 14,910 | ||||||
|
Extinguishment of debt |
10,823 | - | ||||||
|
Dry hole, abandonment, impairment and exploration |
209 | 7,396 | ||||||
| 354,533 | 384,599 | |||||||
|
Income before income taxes |
72,030 | 212,240 | ||||||
|
Provision for income taxes |
24,681 | 79,377 | ||||||
|
Income from continuing operations |
47,349 | 132,863 | ||||||
|
(Loss) income from discontinued operations, net of taxes |
(6,323 | ) | 12,657 | |||||
|
Net income |
$ | 41,026 | $ | 145,520 | ||||
|
Basic net income from continuing operations per share |
$ | 1.04 | $ | 2.95 | ||||
|
Basic net (loss) income from discontinued operations per share |
$ | (0.14 | ) | $ | 0.28 | |||
|
Basic net income per share |
$ | 0.90 | $ | 3.23 | ||||
|
Diluted net income from continuing operations per share |
$ | 1.03 | $ | 2.90 | ||||
|
Diluted net (loss) income from discontinued operations per share |
$ | (0.14 | ) | $ | 0.28 | |||
|
Diluted net income per share |
$ | 0.89 | $ | 3.18 | ||||
|
Dividends per share |
$ | 0.225 | $ | 0.225 | ||||
Unaudited Condensed Statements of Comprehensive Income
Nine Months Ended September 30, 2009 and 2008
(In Thousands)
|
Net income |
$ | 41,026 | $ | 145,520 | ||||
|
Unrealized gains (losses) on derivatives, net of income taxes (benefits) of $104,173 and $58,260, respectively |
169,966 | (95,055 | ) | |||||
|
Reclassification of realized (losses)gains on derivatives included in net income, net of income taxes (benefits) of ($23,940) and $52,341, respectively |
(39,059 | ) | 85,399 | |||||
|
Comprehensive income |
$ | 171,933 | $ | 135,864 |
The accompanying notes are an integral part of these financial statements.
BERRY PETROLEUM COMPANY
Unaudited Condensed Statements of Cash Flows
Nine Months Ended September 30, 2009 and 2008
(In Thousands)
|
Nine months ended September 30, |
||||||||
|
2009 |
2008 |
|||||||
|
Cash flows from operating activities: |
||||||||
|
Net income |
$ | 41,026 | $ | 145,520 | ||||
|
Depreciation, depletion and amortization |
109,397 | 98,579 | ||||||
|
Extinguishment of debt |
10,823 | - | ||||||
|
Dry hole and impairment |
9,643 | 6,858 | ||||||
|
Commodity derivatives |
4,796 | (8 | ) | |||||
|
Stock-based compensation expense |
7,054 | 6,653 | ||||||
|
Deferred income taxes |
13,546 | 76,502 | ||||||
|
Loss (gain) on sale of oil and gas properties |
79 | (510 | ) | |||||
|
Other, net |
(362 | ) | (1,500 | ) | ||||
|
Cash paid for abandonment |
(293 | ) | (3,957 | ) | ||||
|
Change in book overdraft |
(20,199 | ) | 3,935 | |||||
|
Increase in current assets other than cash and cash equivalents |
(9,828 | ) | (35,361 | ) | ||||
|
(Decrease) increase in current liabilities other than book overdraft, line of credit and fair value of derivatives |
(17,303 | ) | 34,537 | |||||
|
Net cash provided by operating activities |
148,379 | 331,248 | ||||||
|
Cash flows from investing activities: |
||||||||
|
Exploration and development of oil and gas properties |
(93,592 | ) | (302,266 | ) | ||||
|
Property acquisitions |
(11,904 | ) | (667,030 | ) | ||||
|
Additions to vehicles, drilling rigs and other fixed assets |
(1,044 | ) | (4,146 | ) | ||||
|
Proceeds from sale of assets |
139,796 | 2,038 | ||||||
|
Capitalized interest |
(21,145 | ) | (15,461 | ) | ||||
|
Net cash provided by (used in) investing activities |
12,111 | (986,865 | ) | |||||
|
Cash flows from financing activities: |
||||||||
|
Proceeds from line of credit |
323,100 | 308,000 | ||||||
|
Payments on line of credit |
(335,900 | ) | (303,000 | ) | ||||
|
Proceeds from issuance of long-term debt |
1,099,238 | 1,481,300 | ||||||
|
Payments on long-term debt |
(1,231,076 | ) | (817,000 | ) | ||||
|
Debt issuance cost |
(23,857 | ) | (8,353 | ) | ||||
|
Proceeds from financing obligation |
18,295 | - | ||||||
|
Dividends paid |
(10,247 | ) | (10,084 | ) | ||||
|
Proceeds from stock option exercises |
601 | 2,834 | ||||||
|
Excess tax benefit and other |
91 | 1,663 | ||||||
|
Net cash (used in) provided by financing activities |
(159,755 | ) | 655,360 | |||||
|
Net increase (decrease) in cash and cash equivalents |
735 | (257 | ) | |||||
|
Cash and cash equivalents at beginning of year |
240 | 316 | ||||||
|
Cash and cash equivalents at end of period |
$ | 975 | $ | 59 | ||||
The accompanying notes are an integral part of these financial statements.
Berry Petroleum Company
Notes to the Unaudited Condensed Financial Statements
|
1. |
General |
All adjustments which are, in the opinion of management, necessary for a fair statement of Berry Petroleum Company’s (the Company) financial position at September 30, 2009 and December 31, 2008 and results of operations and other comprehensive income for the three and nine months ended September 30, 2009 and 2008, and its cash
flows for the nine months ended September 30, 2009 and 2008 have been included. All such adjustments, except as described below, are of a normal recurring nature. The results of operations and cash flows are not necessarily indicative of the results for a full year.
The accompanying unaudited condensed financial statements have been prepared on a basis consistent with the accounting principles and policies reflected in the December 31, 2008 financial statements, except that the DJ basin operations are now accounted for as discontinued operations as a result of the 2009 sale. The audited
financial statements for the three years ended December 31, 2008 and at December 31, 2007 and 2008 included in our Form 8-K filed on August 11, 2009, which give effect to the classification of the DJ Basin assets as discontinued operations, should be read in conjunction herewith. The year-end condensed Balance Sheet was derived from audited financial statements, but does not include all disclosures required by accounting principles generally accepted in the United States of America.
Our cash management process provides for the daily funding of checks as they are presented to the bank. Included in accounts payable at September 30, 2009 and December 31, 2008 is $11.6 million and $31.8 million, respectively, representing outstanding checks in excess of the bank balance (book overdraft).
|
2. |
Recent Accounting Developments |
In December 2007, the Financial Accounting Standards Board (FASB) issued authoritative guidance to establish accounting and reporting standards for the noncontrolling interests in a subsidiary (formerly called minority interests) and for the deconsolidation of a subsidiary. The adoption of this authoritative guidance did not have
a material impact on our financial statements.
In March 2008, the FASB issued authoritative guidance, which changes the disclosure requirements for derivative instruments and hedging activities. Expanded disclosures are required to provide information about (a) how and why an entity uses derivative instruments, (b) how derivative instruments and related hedged items are accounted for
and (c) how derivative instruments and related hedged items affect an entity’s financial position, financial performance, and cash flows. The adoption of this authoritative guidance did not have a material impact on our financial statements. We have expanded our disclosures accordingly. See Note 4 to the unaudited financial statements.
In June 2008, the FASB issued authoritative guidance, which clarifies that share-based payment awards that entitle their holders to receive nonforfeitable dividends before vesting should be considered participating securities. As participating securities, these instruments should be included in the earnings allocation in computing basic earnings
per share under the two-class method described in authoritative guidance. All prior period earnings per share data presented shall be adjusted retrospectively to conform with the provisions of this guidance. This guidance is effective for financial statements issued for fiscal years beginning after December 15, 2008 and interim periods within those years. The adoption of this authoritative guidance did not have a material impact on our financial statements. See Note 12 to the unaudited
financial statements.
In December 2008, the Securities and Exchange Commission adopted revisions to its oil and gas disclosure requirements that are intended to align them with current practices and changes in technology. Among other things, the amendments will: replace the single-day year-end pricing assumption with a twelve-month average pricing assumption;
permit the disclosure of probable and possible reserves; allow the use of certain technologies to establish reserves; require the disclosure of the qualifications of the technical person primarily responsible for preparing the reserves estimates or conducting a reserves audit; require the filing of the independent reserve engineers' summary report; and permit the disclosure of a reserves sensitivity analysis table to illustrate the impact of different price and/or cost assumptions on reserves. These amendments
are effective for registration statements filed on or after January 1, 2010, and for annual reports on Form 10-K for fiscal years ending on December 31, 2009, with early adoption prohibited. The Company is currently evaluating the impact that the adoption of this pronouncement will have on the Company's financial position, results of operations, and disclosures.
In April 2009, the FASB issued authoritative guidance which requires disclosures about the fair value of financial instruments for interim reporting periods as well as in annual financial statements. The adoption of this authoritative guidance did not have a material impact
on our financial statements. We have expanded our disclosures accordingly. See Note 3 to the unaudited financial statements.
Berry Petroleum Company
Notes to the Unaudited Condensed Financial Statements
In May 2009, the FASB issued authoritative guidance, which establishes general standards of accounting for and disclosure of events that occur after the balance sheet date but before financial statements are issued or are available to be issued. We implemented this guidance during the
second quarter of 2009 and we expanded our disclosures accordingly. See Note 15 to the unaudited financial statements.
In June 2009, the FASB approved the FASB Accounting Standards Codification (ASC), which after its effective date of July 1, 2009 is the single source of authoritative, nongovernmental U.S. Generally Accepted Accounting Principles (GAAP). The Codification reorganizes all previous U.S. GAAP pronouncements into roughly 90 accounting
topics and displays all topics using a consistent structure. All existing standards that were used to create the Codification are now superseded, replacing the previous references to specific Statements of Financial Accounting Standards (SFAS) with numbers used in the Codification’s structural organization. The adoption of this authoritative guidance did not have a material impact on our financial statements. We have updated our disclosures accordingly.
|
3. |
Fair Value Measurements |
In September 2006, the Financial Accounting Standards Board (FASB) issued authoritative guidance that clarifies the definition of fair value, establishes a framework for measuring fair value, and expands disclosures about fair value measurements. We adopted the authoritative guidance as of January 1, 2008 for all financial and nonfinancial
assets and liabilities recognized or disclosed at fair value on a recurring basis. We have also adopted the authoritative guidance as it relates to all nonfinancial assets and liabilities that are not recognized or disclosed on a recurring basis as of January 1, 2009 pursuant to the authoritative guidance issued by the FASB in February 2008. The adoption of the authoritative guidance did not have a material impact on our financial statements.
The authoritative guidance establishes a three-tier fair value hierarchy, which prioritizes the inputs used to measure fair value. These tiers include: Level 1, defined as unadjusted quoted prices in active markets for identical assets or liabilities; Level 2, defined as inputs other than quoted prices in active markets that are
either directly or indirectly observable; and Level 3, defined as unobservable inputs for use when little or no market data exists, therefore requiring an entity to develop its own assumptions.
A financial instrument’s categorization within the valuation hierarchy is based upon the lowest level of input that is significant to the fair value measurement. The Company’s assessment of the significance of a particular input to the fair value measurement requires judgment and may affect the classification of assets
and liabilities within the fair value hierarchy. Our oil swaps, natural gas swaps and interest rate swaps are valued using internal models which are based on active market data and are classified within Level 2 of the valuation hierarchy. The observable inputs include underlying commodity and interest rate levels and quoted prices of these instruments on actively traded markets. Derivatives that are valued based upon models with significant unobservable market inputs (primarily volatility),
and that are normally traded less actively are classified within Level 3 of the valuation hierarchy. Level 3 derivatives include oil collars, natural gas collars and natural gas basis swaps.
The following tables sets forth by level within the fair value hierarchy the Company’s assets and liabilities that were measured at fair value on a recurring basis as of September 30, 2009 and December 31, 2008.
|
September 30, 2009 (in millions) |
Total carrying value on the condensed Balance Sheet |
Level 2 |
Level 3 |
|||||||||
|
Commodity derivative asset (liability) |
$ | (21.5 | ) | $ | (54.1 | ) | $ | 32.6 | ||||
|
Interest rate swap asset (liability) |
(9.8 | ) | (9.8 | ) | - | |||||||
|
Total fair value asset (liability) |
$ | (31.3 | ) | $ | (63.9 | ) | $ | 32.6 | ||||
|
December 31, 2008 (in millions) |
Total carrying value on the condensed Balance Sheet |
Level 2 |
Level 3 |
|||||||||
|
Commodity derivative asset (liability) |
$ | 198.4 | $ | 25.9 | $ | 172.5 | ||||||
|
Interest rate swap asset (liability) |
(12.5 | ) | (12.5 | ) | - | |||||||
|
Total fair value asset (liability) |
$ | 185.9 | $ | 13.4 | $ | 172.5 | ||||||
Berry Petroleum Company
Notes to the Unaudited Condensed Financial Statements
Changes in Level 3 fair value measurements
The following table sets forth a reconciliation of changes in the fair value of financial instruments classified as Level 3 in the fair value hierarchy:
|
Three months ended September 30, |
Nine months ended September 30, |
|||||||||||||||
|
(in millions) |
2009 |
2008 |
2009 |
2008 |
||||||||||||
|
Fair value of Level 3 derivative assets, beginning of period |
$ | 43.1 | $ | 569.6 | $ | 172.5 | $ | 194.3 | ||||||||
|
Total realized and unrealized losses included in Gain (loss) on derivatives |
(1.0 | ) | (0.6 | ) | (1.7 | ) | 0.2 | |||||||||
|
Purchases, sales and settlements, net |
(9.5 | ) | (360.1 | ) | (141.6 | ) | 14.4 | |||||||||
|
Transfers in and/or out of Level 3 |
- | - | 3.4 | - | ||||||||||||
|
Fair value of Level 3 derivative assets, September 30, 2009 |
$ | 32.6 | $ | 208.9 | $ | 32.6 | $ | 208.9 | ||||||||
|
Total unrealized gains (losses) included in income related to financial assets and liabilities on the condensed balance sheet at September 30, 2009 |
$ | (0.7 | ) | $ | - | $ | (1.3 | ) | $ | - | ||||||
The $3.4 million of transfers into Level 3 for the nine months ended September 30, 2009 represent crude oil collars that were converted to crude oil swaps during the first quarter of 2009.
Fair Market Value of Financial Instruments
The Company used various assumptions and methods in estimating the fair values of its financial instruments. The carrying amounts of cash and cash equivalents and accounts receivable approximated their fair value due to the short-term maturity of these instruments. The carrying amount of the Company's credit facilities approximated fair value,
because the interest rates on the credit facilities are variable. The fair values of our 8 ¼ % senior subordinated notes due 2016 and our 10 ¼ % senior notes due 2014 were estimated based on quoted market prices. The fair values of the Company's derivative instruments and other investments are discussed above.
|
(in millions) |
Carrying Amount |
Estimated Fair Value |
||||||
|
Line of credit |
$ | 13 | $ | 13 | ||||
|
Senior secured revolving credit facility |
365 | 365 | ||||||
|
8 ¼ % Senior subordinated notes due 2016 |
200 | 191 | ||||||
|
10 ¼ % Senior notes due 2014 |
436 | 479 | ||||||
| $ | 1,014 | $ | 1,048 | |||||
|
4. |
Hedging |
To minimize the effect of a downturn in oil and gas prices and protect our profitability and the economics of our development plans, we enter into crude oil and natural gas hedge contracts from time to time. The terms of contracts depend on various factors, including management's view of future crude oil and natural gas prices, acquisition
economics on purchased assets and our future financial commitments. This price hedging program is designed to moderate the effects of a severe crude oil and natural gas price downturn while allowing us to participate in some commodity price increases. We benefit from lower natural gas pricing as we are a consumer of natural gas in our California operations. In the Rocky Mountains and East Texas we benefit from higher natural gas pricing. We have hedged, and may hedge in the future, both natural gas
purchases and sales as determined appropriate by management. Management regularly monitors the crude oil and natural gas markets and our financial commitments to determine if, when, and at what level some form of crude oil and/or natural gas hedging and/or basis adjustments or other price protection is appropriate in accordance with policy established by our Board of Directors. Currently, our hedges are in the form of swaps and collars. However, we may use a variety of hedge instruments
in the future to hedge WTI or the index gas price. We also utilize interest rate derivatives to protect against changes in interest rates on our floating rate debt.
Berry Petroleum Company
Notes to the Unaudited Condensed Financial Statements
The related cash flow impact of all of our hedges is reflected in cash flows from operating activities. At September 30, 2009, our net fair value derivative liability was $31.3 million as compared to a net fair value asset of $185.9 million at December 31, 2008 which reflects changes in commodity prices and interest rates. Based on NYMEX
strip pricing as of September 30, 2009, we expect to receive hedge payments under the existing derivatives of $14.7 million during the next twelve months. At September 30, 2009, “Accumulated Other Comprehensive Income (Loss)” (“AOCL”) consisted of $17.2 million, net of tax, of unrealized losses from our crude oil and natural gas swaps and collars that qualified for hedge accounting treatment at September 30, 2009. Deferred net losses recorded in AOCL at September 30, 2009 and subsequent
mark-to-market changes in the underlying hedging contracts are expected to be reclassified to earnings in the same period that the forecasted transaction impacts earnings.
We present our derivative assets and liabilities on our Condensed Balance Sheets on a net basis. We net derivative assets and liabilities whenever we have a legally enforceable master netting agreement with a counterparty to a derivative contract. We use these agreements to manage
and reduce our potential counterparty credit risk.
The following table disaggregates our net derivative assets and liabilities into gross components on a contract-by-contract basis before giving effect to master netting arrangements. Finally, we identify the line items on our Condensed Balance Sheets in which these fair value amounts are included. The
gross asset and liability values in the table below are segregated between those derivatives designated in qualifying hedge accounting relationships and those not designated in hedge accounting relationships. We use the end of period accounting designation to determine the classification for each derivative position.
|
As of September 30, 2009 |
||||||||||
|
Derivative Assets |
Derivative Liabilities |
|||||||||
|
(in millions) |
Balance Sheet Location |
Fair Value |
Balance Sheet Location |
Fair Value |
||||||
|
Commodity – Oil |
Current assets |
$ | 31.7 |
Current liability |
$ | 14.5 | ||||
|
Commodity – Natural Gas |
Current assets |
1.4 | ||||||||
|
Commodity – Oil |
Long term assets |
1.0 |
Long term liabilities |
37.3 | ||||||
|
Commodity – Natural Gas |
Long term liabilities |
0.3 | ||||||||
|
Commodity – Natural Gas |
Current liability |
0.7 | ||||||||
|
Interest rate contracts |
Current assets |
2.7 | ||||||||
|
Interest rate contracts |
Current liabilities |
3.6 | ||||||||
|
Interest rate contracts |
Long term liabilities |
3.4 | ||||||||
|
Total derivatives designated as hedging instruments under authoritative guidance |
34.8 | 61.8 | ||||||||
|
Commodity – Oil |
- |
Current liabilities |
3.1 | |||||||
|
Commodity – Natural Gas |
- |
Current liabilities |
0.9 | |||||||
|
Commodity – Natural Gas |
- |
Long term liabilities |
0.3 | |||||||
|
Total derivatives not designated as hedging instruments under authoritative guidance |
- | 4.3 | ||||||||
|
Total Derivatives |
$ | 34.8 | $ | 66.1 | ||||||
Berry Petroleum Company
Notes to the Unaudited Condensed Financial Statements
The tables below summarize the Statement of Operations impacts of our derivative instruments for the three and nine months ending September 30,2009 (in millions):
|
Derivatives cash flow hedging relationships |
Amount of gain (loss) Recognized in AOCI on Derivative
(Effective portion) |
Location of Gain (Loss) Reclassified from AOCI into Income (Effective Portion) |
Amount of Gain (Loss) Reclassified from AOCI into Income (Effective Portion) |
Location of Gain (loss) Recognized in Income of Derivative (Ineffective Portion and Amount Excluded from Effectiveness Testing) |
Amount of Gain (loss) Recognized in Income of Derivative (Ineffective Portion and Amount Excluded from Effectiveness Testing) |
|||||||||
|
Three Months Ended
September 30, 2009 |
Three Months Ended
September 30, 2009 |
Three Months Ended
September 30, 2009 |
||||||||||||
|
Commodity - Oil |
$ | (2.5 | ) |
Sales of oil and gas |
$ | 1.0 |
Sales of oil and gas |
$ | - | |||||
|
Commodity - Natural Gas |
1.8 |
Sales of oil and gas |
0.6 |
Gain (loss) on derivatives |
(0.6 | ) | ||||||||
|
Interest rate |
0.7 |
Interest expense |
(1.1 | ) |
Gain (loss) on derivatives |
0.1 | ||||||||
|
Total |
$ | - | $ | 0.5 | $ | (0.5 | ) | |||||||
|
Derivatives cash flow hedging relationships |
Amount of gain (loss) Recognized in AOCI on Derivative
(Effective portion) |
Location of Gain (Loss) Reclassified from AOCI into Income (Effective Portion) |
Amount of Gain (Loss) Reclassified from AOCI into Income (Effective Portion) |
Location of Gain (loss) Recognized in Income of Derivative (Ineffective Portion and Amount Excluded from Effectiveness Testing) |
Amount of Gain (loss) Recognized in Income of Derivative (Ineffective Portion and Amount Excluded from Effectiveness Testing) |
|||||||||
|
Nine Months Ended
September 30, 2009 |
Nine Months Ended
September 30, 2009 |
Nine Months Ended
September 30, 2009 |
||||||||||||
|
Commodity - Oil |
$ | 161.4 |
Sales of oil and gas |
$ | 36.4 |
Sales of oil and gas |
$ | - | ||||||
|
Commodity - Natural Gas |
13.1 |
Sales of oil and gas |
5.4 |
Gain (loss) on derivatives |
14.0 | |||||||||
|
Interest rate |
(3.9 | ) |
Interest expense |
(2.7 | ) |
Gain (loss) on derivatives |
(0.2 | ) | ||||||
|
Total |
$ | 170.6 | $ | 39.1 | $ | 13.8 | ||||||||
Amount of Gain or (Loss) Recognized in Income on Derivatives not designated as Hedging Instruments under authoritative guidance:
|
Derivatives not designated as Hedging Instruments under authoritative guidance |
Location of Gain (Loss) Recognized in Income on Derivative |
Amount of Gain (Loss) Recognized in Income on Derivatives not designated as Hedging Instruments under authoritative guidance |
Amount of Gain (Loss) Recognized in Income on Derivatives not designated as Hedging Instruments under authoritative guidance |
||||||
|
Three months ended
September 30, 2009 |
Nine months ended
September 30, 2009 |
||||||||
|
Commodity – Oil |
Gain (loss) on derivatives |
$ | 1.6 | (5.7 | ) | ||||
|
Commodity - Natural Gas |
Gain (loss) on derivatives |
(0.5 | ) | (1.5 | ) | ||||
|
Commodity - Natural Gas |
(Loss) income from discontinued operations, net of taxes |
- | (0.5 | ) | |||||
|
Total Derivatives |
$ | 1.1 | (7.7 | ) | |||||
We did not enter into any crude oil or natural gas hedges during the three months ended September 30, 2009.
Berry Petroleum Company
Notes to the Unaudited Condensed Financial Statements
During the first quarter of 2009, we converted oil collars for 6,000 Bbl/D for the full year 2010 into swaps for the same volumes with swap prices ranging from $61.00 to $64.80.
We generally utilize NYMEX WTI based derivatives to hedge cash flows from our California oil sales. Our oil sales contracts with multiple refiners are primarily based on the field posting prices. There is a high correlation between WTI and the field posting prices which allows us to utilize hedge accounting. As
there is a ready market for our crude oil in California, we do not believe the loss of any particular contract impacts the probability that our hedged forecasted transactions will occur. We generally hedge our natural gas at the basis location that corresponds to the forecasted sale.
While we designate the majority of our hedges as cash flow hedges, we have not elected hedge accounting on certain of our crude oil and natural gas hedges. During the three and nine months ended September 30, 2009, we recorded $0.5 million and $6.6 million under the caption “Gain (loss) on derivatives” related
to hedges for which we either did not elect hedge accounting or which no longer qualified for hedge accounting. In conjunction with the sale of the DJ basin assets, during the first quarter of 2009, we concluded that the forecasted transaction in certain of our hedging relationships was not probable of occurring. As such, we reclassified a gain of $14.3 million from accumulated other comprehensive income (loss) to the statement of operations under the caption “Gain (loss) on derivative.” Additionally,
a portion of the change in fair value for hedges that we have designated as cash flow hedges may impact our income as our sales price is not perfectly correlated with our hedges. We recognized an unrealized net loss of $0.5 million and $0.4 million on the statement of operations under the caption “Gain (loss) on derivatives” for the three and nine months ended September 30, 2009, respectively, as a result of ineffectiveness. During the first quarter of 2009, we entered into natural
gas derivatives on behalf of the purchaser of our DJ assets. We did not elect hedge accounting for these hedges and recorded an unrealized net loss of $0.5 million on the statement of operations under the caption “(Loss) income from discontinued operations, net of taxes.”
Our hedge contracts have been executed only with counterparties that are party to our senior secured revolving credit facility.
Neither we nor our counterparties are required to post collateral in connection with our derivative positions and netting agreements are in place with each of our counterparties allowing us to offset our commodity derivative asset and liability positions. The credit rating of each of these counterparties was AA-/Aa2, or better
as of September 30, 2009. Our derivatives are held with a small number of counterparties and as of September 30, 2009, our largest four counterparties accounted for 90% of the value of our total derivative positions.
As of September 30, 2009, we had the following commodity hedges:
|
2009 |
2010 |
2011 |
2012 | |
|
Oil Bbl/D: |
17,535 |
14,930 |
9,020 |
3,000 |
|
Natural Gas MMBtu/D: |
14,000 |
14,000 |
5,000 |
5,000 |
|
5. |
Crude Oil Inventory |
In May 2009, we entered into a sales agreement with a refiner for 1,500 barrels per day of production from our Poso Creek property for the months of May and June 2009. Under this agreement, we delivered approximately 100,000 barrels of oil to the refiner and received inventory of a slightly higher quality crude oil at the refinery. This
transaction was accounted for as a non-monetary exchange and the amount was recorded in crude oil inventory. The refiner purchased 50,000 barrels from us during the third quarter of 2009 and the remaining balance in “Crude Oil Inventory” at September 30, 2009 reflects the cost of production, transportation costs and quality differentials for the remaining 50,000 barrels of inventory volume.
|
6. |
Asset Retirement Obligations |
The following table summarizes the change in abandonment obligation for the nine months ended September 30, 2009 (in thousands):
|
Beginning balance at January 1, 2009 |
$ | 41,967 | ||
|
Liabilities incurred |
1,407 | |||
|
Liabilities settled |
(3,044 | ) | ||
|
Revisions in estimated liabilities |
- | |||
|
Accretion expense |
2,899 | |||
|
Ending balance at September 30, 2009 |
$ | 43,229 |
Berry Petroleum Company
Notes to the Unaudited Condensed Financial Statements
The asset retirement obligation (“ARO”) reflects the estimated present value of the amount of dismantlement, removal, site reclamation and similar activities associated with our oil and gas properties. Inherent in the fair value calculation of the ARO are numerous assumptions and judgments including the ultimate settlement amounts,
inflation factors, credit adjusted discount rates, timing of settlement, and changes in the legal, regulatory, environmental and political environments. To the extent future revisions to these assumptions impact the fair value of the existing ARO liability, a corresponding adjustment is made to the oil and gas property balance.
|
7. |
Acquisitions |
During the nine months ended September 30, 2009, we completed acquisitions totaling $11.9 million. In June 2009, we acquired property near McKittrick, California, the deep rights to one of the leases in our Darco property in East Texas, and additional interests in our Piceance Garden Gulch assets.
|
8. |
Dispositions and Discontinued Operations |
On July 17, 2009, we completed the financing of our East Texas gas gathering system for $18.4 million in cash. We entered into concurrent long-term gas gathering agreements for the East Texas production which contained an embedded lease. The transaction was treated as a financing obligation. Accordingly,
the net book value of the property of $16.7 million will be depreciated over the remaining useful life of the asset and the cash received of $18.4 million was recorded as a financing obligation. A portion of future payments will be recorded as gathering expense, a portion as interest expense and the balance as a reduction in the financing obligation. There is no minimum payment required under these agreements.
On March 3, 2009, we entered into an agreement to sell our DJ basin assets and related hedges for $154 million before customary closing adjustments. The closing date of the sale of the assets was April 1, 2009. We recorded a pre-tax impairment loss of $9.6 million related to the sale, which is aggregated within the $6.3 million
“(Loss) income from discontinued operations, net of taxes” on our statement of operations for the nine months ended September 30, 2009.
(Loss) income from discontinued operations, net of tax on our accompanying statements of operations is comprised of the following (in thousands):
|
For the Three Months Ended
September 30, |
For the Nine Months Ended
September 30, |
|||||||||||||||
|
2009 |
2008 |
2009 |
2008 |
|||||||||||||
|
Oil and gas revenue |
$ | - | $ | 13,972 | $ | 5,396 | $ | 43,111 | ||||||||
|
Loss on sale of asset |
(578 | ) | - | (908 | ) | - | ||||||||||
|
Other revenue |
- | 350 | 623 | 1,441 | ||||||||||||
|
Total Revenue |
(578 | ) | 14,322 | 5,111 | 44,552 | |||||||||||
|
Operating expenses |
- | 3,552 | 2,576 | 8,694 | ||||||||||||
|
Production taxes |
- | 761 | 195 | 2,458 | ||||||||||||
|
DD&A |
- | 3,086 | 2,188 | 9,126 | ||||||||||||
|
General and administrative |
- | 273 | 388 | 755 | ||||||||||||
|
Interest expense |
- | 724 | 815 | 1,534 | ||||||||||||
|
Commodity derivatives |
- | - | 484 | - | ||||||||||||
|
Dry hole, abandonment, impairment and exploration |
- | 84 | 9,637 | 1,766 | ||||||||||||
|
Total Expenses |
- | 8,480 | 16,283 | 24,333 | ||||||||||||
|
(Loss) income from discontinued operations, before income taxes |
(578 | ) | 5,842 | (11,172 | ) | 20,219 | ||||||||||
|
Income tax benefit (expense) |
1,246 | (2,109 | ) | 4,849 | (7,562 | ) | ||||||||||
|
Income (Loss) from discontinued operations |
$ | 668 | $ | 3,733 | $ | (6,323 | ) | $ | 12,657 | |||||||
Berry Petroleum Company
Notes to the Unaudited Condensed Financial Statements
|
9. |
Dry Hole, Abandonment and Impairment |
During the nine months ended September 30, 2009 and 2008, we recorded dry hole, abandonment, impairment and exploration expense of $0.2 million and $7.4 million, respectively. Charges of $2.7 million, $2.6 million and $1.5 million were recorded during the first, second and third quarters of 2008, respectively for
technical difficulties that were encountered on five wells in the Piceance basin before reaching total depth. These holes were abandoned in favor of drilling to the same bottom hole location by drilling new wells. In addition, $0.5 million of exploration expense was recorded during the nine months ended September 30, 2008 for exploration activities which were primarily 3-D seismic in nature.
|
10. |
Pro Forma Results |
On July 15, 2008, the Company acquired certain interests in natural gas producing properties on 4,500 net acres in Limestone and Harrison Counties in East Texas for $668 million cash (East Texas Acquisition) including an initial purchase price of $622 million, and normal post closing adjustments of $46 million.
The unaudited pro forma results presented below for the three and nine months ended September 30, 2008 have been prepared to give effect to the East Texas Acquisition on the Company’s results of continuing operations under the purchase method of accounting as if it had been consummated at January 1, 2008. The unaudited pro
forma results (in millions) do not purport to represent the results of continuing operations that actually would have occurred on such date or to project the Company’s results of operations for any future date or period:
|
Three Months Ended
September 30, 2008 |
Nine Months Ended
September 30, 2008 |
|||||||
|
Pro forma revenue |
$ | 233,236 | $ | 643,396 | ||||
|
Pro forma income from operations |
$ | 83,575 | $ | 217,351 | ||||
|
Pro forma net income |
$ | 52,977 | $ | 136,016 | ||||
|
Pro forma basic earnings per share |
$ | 1.17 | $ | 3.02 | ||||
|
Pro forma diluted earnings per share |
$ | 1.16 | $ | 2.97 | ||||
|
11. |
Income Taxes |
The effective income tax rate was 36.2% for the third quarter of 2009 compared to 36.1% for the second quarter of 2009 and 36.5% for the third quarter of 2008. The effective tax rate was 34.3% and 37.4% for the nine months ended September 30, 2009 and 2008, respectively. The change for the nine month period ended September
30, 2009 when compared to the same period in 2008 was primarily due to reduced state tax rates and the reduction in our liability related to uncertain tax positions. Our estimated annual effective tax rate varies from the 35% federal statutory rate due to the effects of state income taxes and estimated permanent differences.
As of September 30, 2009, we had a gross liability for uncertain tax benefits of $7.4 million of which $6.2 million, if recognized, would affect the effective tax rate. The liability related to uncertain tax positions was reduced during the nine months ended September 30, 2009 due to the resolution of our IRS examination for 2005.
Due to the uncertainty about the future periods in which other examinations will be completed and limited information related to current audits, we are not able to make reasonably reliable estimates of the periods in which cash settlements will occur with taxing authorities for the noncurrent liabilities.
|
12. |
Earnings per Share |
In June 2008, the FASB issued authoritative guidance, which clarifies that share-based payment awards that entitle their holders to receive nonforfeitable dividends before vesting should be considered participating securities. As participating securities, these instruments should be included in the earnings allocation in computing basic
earnings per share under the two-class method. All prior period earnings per share data presented were adjusted retrospectively to conform with the provisions of the guidance which is effective for financial statements issued for fiscal years beginning after December 15, 2008 and interim periods within those years.
Berry Petroleum Company
Notes to the Unaudited Condensed Financial Statements
The following table shows the computation of basic and diluted net (loss) income per share from continuing and discontinued operations for the three and nine months ended September 30, 2009 and 2008 (in thousands):
|
Three months ended
September 30, |
Nine months ended
September 30, |
|||||||||||||||
|
2009 |
2008 |
2009 |
2008 |
|||||||||||||
|
Net income from continuing operations |
$ | 18,339 | $ | 49,615 | $ | 47,349 | $ | 132,863 | ||||||||
|
Less: Income allocable to participating securities |
445 | 691 | 1,153 | 1,841 | ||||||||||||
|
Income available for shareholders |
17,894 | 48,924 | 46,196 | 131,022 | ||||||||||||
|
Net income (loss) from discontinued operations |
668 | 3,733 | (6,323 | ) | 12,657 | |||||||||||
|
Less: Income allocable to participating securities |
17 | 53 | - | 178 | ||||||||||||
|
Income (loss) from discontinued operations available for shareholders |
651 | 3,680 | (6,323 | ) | 12,479 | |||||||||||
|
Basic earnings per share from continuing operations |
0.41 | 1.10 | 1.04 | 2.95 | ||||||||||||
|
Basic earnings (loss) per share from discontinued operations |
0.01 | 0.08 | (0.14 | ) | 0.28 | |||||||||||
|
Basic earnings per share |
0.42 | 1.18 | 0.90 | 3.23 | ||||||||||||
|
Diluted earnings per share from continuing operations |
0.40 | 1.08 | 1.03 | 2.90 | ||||||||||||
|
Diluted earnings (loss) per share from discontinued operations |
0.01 | 0.08 | (0.14 | ) | 0.28 | |||||||||||
|
Diluted earnings per share |
$ | 0.41 | $ | 1.16 | $ | 0.89 | $ | 3.18 | ||||||||
|
Weighted average shares outstanding – basic |
44,633 | 44,527 | 44,607 | 44,466 | ||||||||||||
|
Add: dilutive effects of stock options |
303 | 651 | 189 | 702 | ||||||||||||
|
Weighted average shares outstanding – dilutive |
44,936 | 45,178 | 44,796 | 45,168 | ||||||||||||
Options to purchase 1.2 million and 1.6 million shares were not included in the diluted (loss) earnings per share calculation for the three and nine months ended September 30, 2009, respectively, because their effect would have been anti-dilutive. Options to purchase 0.2 million and 0.1 million shares were not included in the diluted
(loss) earnings per share calculation for the three and nine months ended September 30, 2008, respectively, because their effect would have been anti-dilutive.
The adoption of the guidance issued by the FASB decreased basic earnings per share from continuing operations by $0.02 and $0.04 for the three and nine months ended September 30, 2008, respectively, and dilutive earnings per share from continuing operations by $0.01 and $0.02 for the three and nine months ended September 30, 2008, respectively. Basic
and dilutive (loss) earnings per share from discontinued operations remained unchanged for the three and nine months ended September 30, 2008.
|
13. |
Debt Obligations |
Short-term lines of credit
In 2005, we completed an unsecured uncommitted money market line of credit (Line of Credit). Borrowings under the Line of Credit may be up to $30 million for a maximum of 30 days. The Line of Credit may be terminated at any time upon written notice by either us or the lender. In conjunction with the amendment to our
senior secured credit facility, on July 15, 2008, the Line of Credit was secured by our assets. At September 30, 2009 and December 31, 2008, the outstanding balance under this Line of Credit was $12.5 million and $25.3 million, respectively. Interest on amounts borrowed is charged at LIBOR plus a margin of approximately 1.6%.
Senior Secured Revolving Credit Facility
Our Senior Secured Revolving Credit Facility (the Agreement) has a current borrowing base and lender commitments of $938 million. The LIBOR and prime rate margins are between 2.25% and 3.0% based on the ratio of credit outstanding to the borrowing base and the annual commitment fee on the unused portion of the credit facility is 0.50%.
Berry Petroleum Company
Notes to the Unaudited Condensed Financial Statements
Covenants under the Agreement are as follows:
|
Total funded debt to EBITDAX ratio not greater than: |
Senior secured debt to EBITDAX ratio not greater than: | ||||||
|
2009 |
2010 |
Thereafter |
to Sep 2010 |
Mar 2011 |
Sep 2011 |
Thereafter | |
|
4.75 |
4.50 |
4.00 |
3.75 |
3.50 |
3.25 |
3.0 | |
The write off of $38.5 million to bad debt expense associated with the bankruptcy of Big West Oil of California (‘Big West”) is excluded from the calculation of EBITDAX, per the Agreement.
The Agreement contains a current ratio covenant which, as defined, must be at least 1.0. During the third quarter of 2009 our borrowing base decreased from $969 billion to $938 million as a result of the add-on of our senior unsecured notes. The total outstanding debt at September 30, 2009 under the Agreement, as amended,
and the Line of Credit was $365 million and $13 million, respectively, and $4 million in letters of credit have been issued under the facility, leaving $556 million in borrowing capacity available. The maximum amount available is subject to semi-annual redeterminations of the borrowing base, based on the value of our proved oil and gas reserves, in April and October of each year in accordance with the lenders’ customary procedures and practices. Both we and the banks have the bilateral
right to one additional redetermination each year.
Second Lien Term Loan
On April 27, 2009 we completed a $140 million second lien credit facility, with lenders from among our current lending group, with a maturity of January 16, 2013. We paid off the second lien term loan on May 29, 2009 from the proceeds of our senior unsecured notes issuance and wrote off $7.2 million in deferred loan fees for the
nine months ended September 30, 2009.
Senior Unsecured 10.25% notes due 2014
On May 27, 2009, we issued in a public offering $325 million of 10.25% senior unsecured notes due 2014 ($325 million Notes). Interest on the $325 million Notes is paid semiannually in June and December of each year. The $325 million Notes were issued at a discount to par value of 93.546%, and are carried on the balance
sheet at their amortized cost. The deferred costs of approximately $9.5 million associated with the issuance of this debt are being amortized over the five year life of the $325 million Notes. Pursuant to the terms of our senior secured credit facility, the issuance of the $325 million Notes automatically reduced our borrowing base by 25 cents per dollar of Notes issued, or approximately $81 million. We wrote off $3.3 million of deferred
loan fees during the second quarter of 2009 as a result of the decrease in our borrowing base.
On August 13, 2009, we issued in a public offering a $125 million add-on to our 10.25% senior unsecured notes due 2014 ($125 million Notes). The $125 million Notes were issued at a premium to par value of 104.75%, and are carried on the balance sheet at their amortized cost. The deferred costs of approximately $1.9 million associated
with the issuance of this debt are being amortized over the five year life of the Notes. Pursuant to the terms of our senior secured credit facility, the issuance of the $125 million Notes automatically reduced our borrowing base by 25 cents per dollar of notes issued, or approximately $31 million. We wrote off $0.3 million of deferred loan fees during the third quarter of 2009 as a result of the decrease in our borrowing base.
The $125 million Notes and the previously issued $325 million Notes will be treated as a single series of debt securities under the indenture and are carried on the balance sheet at their combined amortized cost in which the $325 million Notes discount and the $125 million Notes premium net to a discount.
Senior Subordinated 8.25% notes due 2016
In 2006, we issued in a public offering $200 million of 8.25% senior subordinated notes due 2016 (the Sub notes). Interest on the Sub notes is paid semiannually in May and November of each year. The deferred costs of approximately $5.2 million associated with the issuance of this debt are being amortized over the
ten year life of the Sub notes.
Financial Covenants
The senior secured revolving credit facility contains restrictive covenants as described above. Under our senior subordinated and senior unsecured notes as long as the interest coverage ratio (as defined) is greater than 2.5 times, we may incur additional debt. We were in compliance with all of these covenants
as of September 30, 2009.
Berry Petroleum Company
Notes to the Unaudited Condensed Financial Statements
|
As of
September 30, 2009 |
||
|
Current Ratio (Not less than 1.0) |
5.1 |
|
|
EBITDAX To Total Funded Debt Ratio (Not greater than 4.75) |
3.3 |
|
|
Interest Coverage Ratio (Not less than 2.5) |
4.0 |
|
|
EBITDAX To Senior Secured Debt Ratio (Not greater than 3.75) |
1.2 |
The weighted average interest rate on total outstanding borrowings at September 30, 2009 was 7.0%.
|
14. |
Contingencies and Commitments |
Our contractual obligations as of September 30, 2009 are as follows (in millions):
|
Total |
2009 |
2010 |
2011 |
2012 |
2013 |
Thereafter |
||||||||||||||||||||||
|
Total debt and interest |
$ | 1,385.1 | $ | 30.5 | $ | 71.8 | $ | 71.8 | $ | 430.3 | $ | 62.6 | $ | 718.1 | ||||||||||||||
|
Abandonment obligations |
43.2 | 1.3 | 2.9 | 2.9 | 2.8 | 2.8 | 30.5 | |||||||||||||||||||||
|
Operating lease obligations |
16.6 | 0.6 | 2.4 | 2.4 | 2.5 | 2.5 | 6.2 | |||||||||||||||||||||
|
Drilling and rig obligations |
38.6 | 4.4 | 8.0 | 8.0 | 18.2 | - | - | |||||||||||||||||||||
|
Firm natural gas transportation contracts |
140.1 | 4.6 | 19.1 | 19.1 | 17.8 | 15.7 | 63.8 | |||||||||||||||||||||
|
Total |
$ | 1,623.6 | $ | 41.4 | $ | 104.2 | $ | 104.2 | $ | 471.6 | $ | 83.6 | $ | 818.6 | ||||||||||||||
On July 17, 2009, we closed on the financing of our East Texas gas gathering system for $18.4 million in cash. We entered into concurrent long-term gas gathering agreements for the East Texas production which contained an embedded lease. There is no minimum payment required under these agreements. For the
first nine months of 2009, we have incurred $1.0 million under the agreements.
On June 17, 2009, we amended our natural gas firm transportation agreement with Enbridge Pipelines providing for transportation of our gas from Tex-OK to Orange County, Florida (Zone 1). The agreement provides for minimum volume of 25,000 MMBtu/d and a maximum volume of 55,000 MMBtu/D.
We have two long-term firm transportation contracts that total 35,000 MMBtu/D on the Rockies Express (REX) pipeline for gas production in the Piceance basin. We pay a demand charge for this capacity and our own production did not completely fill that capacity. To maximize the utilization of our firm transportation, we bought our
partners’ share of the gas produced in the Piceance basin at the market rate for that area and used our excess transportation to move this gas to the sales point. The pre-tax net of our gas marketing revenue and our gas marketing expense in the Statements of Operations is $0.6 million and $1.5 million for the three and nine month periods ended September 30, 2009, respectively.
In addition, Berry has signed a binding precedent agreement with El Paso Corporation for an average of 35,000 MMBtu/D of firm transportation on the proposed Ruby Pipeline from Opal, WY to Malin, OR. While it is not certain that this new line will be constructed, the expectation is that the project will proceed and be in service
by 2011. As part of this agreement and in order to access the Ruby pipeline, we also secured firm transportation from the Piceance basin to Opal.
In February 2007, we entered into a multi-staged crude oil sales contract with a refiner for our Uinta basin light crude oil. Under the agreement, the refiner began purchasing 3,200 Bbl/D in July 2007. The refiner has increased its total capacity to 5,000 Bbl/D as provided in our contract. As operator we deliver all produced volumes under
our sales contracts, although our working interest partners or royalty owners may take their respective volumes in kind and market their own volumes. Gross oil production averaged approximately 3,100 BOE/D in the quarter ended September 30, 2009.
On August 13, 2009, we issued in a public offering a $125 million add-on to our 10.25% senior notes due 2014.
On May 27, 2009, we issued in a public offering $325 million of 10.25% senior notes due 2014. Interest on the $325 million Notes is paid semiannually in June and December of each year.
Berry Petroleum Company
Notes to the Unaudited Condensed Financial Statements
In December 2008, Flying J, Inc., and its wholly owned subsidiary Big West Oil and its wholly owned subsidiary BWOC filed for bankruptcy protection under Chapter 11 of the United States Bankruptcy Code. Also in December 2008, BWOC informed the Company that it was unable to receive the Company’s California production. Included
in our allowance for doubtful accounts is $38.5 million due from BWOC. Of the $38.5 million due from BWOC, $11.8 million represents 20 days of our December crude oil sales, an administrative claim under the bankruptcy proceedings, and $26.7 million represents November and the balance of December crude oil sales which would have the same priority as other general unsecured claims. BWOC will also be liable to us for damages under this contract. We have guarantees from Big West Oil and from
Flying J, Inc. in the amount of $75 million each, in the event that our claim is not fully collectible from BWOC. While we believe that we may recover some or all of the amounts due from BWOC, the data received from the bankruptcy proceedings to date has not provided us with adequate data from which to make a conclusion that any amounts will be collected.
We have no material accrued environmental liabilities for our sites, including sites in which governmental agencies have designated us as a potentially responsible party, because it is not probable that a loss will be incurred and the minimum cost and/or amount of loss cannot be reasonably estimated. However, because of the uncertainties
associated with environmental assessment and remediation activities, future expense to remediate the currently identified sites, and sites identified in the future, if any, could be incurred. Management believes, based upon current site assessments, that the ultimate resolution of any matters will not result in substantial costs incurred. We are involved in various other lawsuits, claims and inquiries, most of which are routine to the nature of our business. In the opinion of management, the resolution of these
matters will not have a material effect on our financial position, or on the results of operations or liquidity.
Certain of our royalty payment calculations are being disputed. We believe that our royalty calculations are in accordance with applicable leases and other agreements. However, the disputed amounts that we may be required to pay are up to approximately $6 million.
In July 2009, we received a notice of proposed civil penalty from the Bureau of Land Management (BLM) related to the Company’s alleged non-compliance during 2007 with regulations relating to the operation and position of certain valves in our Uinta Basin operations. The proposed civil penalty was $69.6 million and reflects
the theoretical maximum penalty amount under applicable regulations, absent mitigating factors. In 2007 we immediately remediated the instances of non-compliance, cooperated fully with the BLM’s investigation and we believe no production was lost, all royalties were paid and there was no harm to the environment. Due to the above mitigating factors, among others, we believe this matter will be resolved by the payment of a penalty that will not exceed $2.1 million and accrued such amount
in the second quarter of 2009.
During the California energy crisis in 2000 and 2001, we had electricity sales contracts with various utilities and a portion of the electricity prices paid to us under such contracts from December 2000 to March 27, 2001 has been under a degree of legal challenge since that time. It is possible that we may have a liability pending
the final outcome of the CPUC proceedings on the matter. There are ongoing proceedings before the CPUC in which Edison and PG&E are seeking credit against future payments they are to make for electricity purchases based on retroactive adjustments to pricing under contracts with us. Whether or not retroactive adjustments will be ordered, how such adjustments would be calculated and what period they would cover are too uncertain to estimate at this time.
|
15. |
Subsequent Events |
The Company evaluates subsequent events through the date the financial statements are issued, which for the quarterly period ended September 30, 2009, is October 30, 2009. No subsequent events requiring disclosure were identifited by the Company.
Berry Petroleum Company
Management's Discussion and Analysis of Financial Condition and Results of Operations
Item 2. Management’s Discussion and Analysis of Financial Condition and Results of Operations
General. The following discussion provides information on the results of operations for the three and nine months ended September 30, 2009 and 2008 and our financial condition, liquidity and capital resources as of September 30, 2009. The unaudited financial statements
and the notes thereto contain detailed information that should be referred to in conjunction with this discussion.
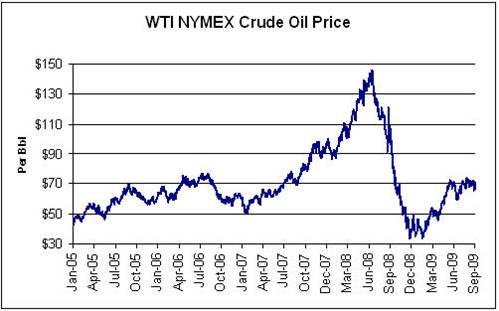
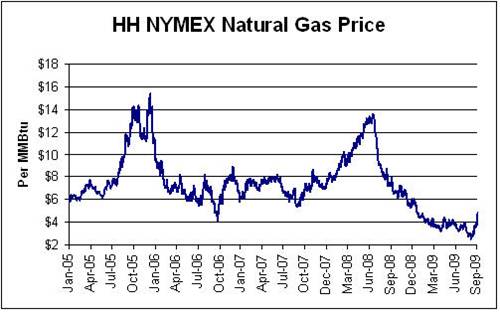
The profitability of our operations in any particular accounting period will be directly related to the realized prices of oil, gas and electricity sold, the type and volume of oil and gas produced and electricity generated and the results of development, exploitation, acquisition, exploration and hedging activities. The realized prices for
natural gas and electricity will fluctuate from one period to another due to regional market conditions and other factors, while oil prices will be predominantly influenced by global supply and demand. The aggregate amount of oil and gas produced may fluctuate based on the success of development and exploitation of oil and gas reserves pursuant to current reservoir management. The cost of natural gas used in our steaming operations and electrical generation, production rates, labor, equipment costs, maintenance
expenses, and production taxes are expected to be the principal influences on operating costs. Accordingly, our results of operations may fluctuate from period to period based on the foregoing principal factors, among others.
Overview. We seek to increase shareholder value through consistent growth in our production and reserves, both through the drill bit and acquisitions. We strive to operate our properties in an efficient manner to maximize the cash flow and earnings of our assets. The
strategies to accomplish these goals include:
|
|
· |
Maximize production from our base oil assets |
|
|
· |
Grow oil production from our inventory of organic development projects |
|
|
· |
Increase natural gas production that will meet the growing demand for steam generation |
|
|
· |
Acquire additional resources with an emphasis on crude oil |
Notable Third Quarter Items.
|
|
· |
Achieved production averaging 28,417 BOE/D, of which 68% is crude oil production, with $22 million of capital investment |
|
|
· |
Increased Diatomite net production to an average of 3,119 BOE/D, up 49% from the third quarter of 2008 |
|
|
· |
Secured twelve month contracts for approximately 90% of our California crude oil |
|
|
· |
Issued a $125 million add-on to our 10.25% senior unsecured notes due in 2014 with a yield of 9% |
|
|
· |
Paid down $78 million of additional debt and increased liquidity to approximately $550 million |
|
|
· |
Completed the sale of our East Texas midstream assets for $18 million |
|
|
· |
Tested our new completion method in the Piceance basin, delivering a 25% improvement compared to our historical field average |
|
|
· |
Received category exemption allowing 25 wells to be drilled in the Uinta basin in Ashley Forest |
Notable Items and Expectations for the Fourth Quarter and Full Year 2009.
|
|
· |
Completed our credit facility borrowing base redetermination and reconfirmed our $938 million borrowing base |
|
|
· |
Initiate a steam flood pilot on the McKittrick, California property |
|
|
· |
Expect to drill our first East Texas Haynesville well during the fourth quarter of 2009 |
|
|
· |
Expect production to average approximately 30,000 BOED for the full year 2009 |
Overview of the Third Quarter of 2009. We had net income from continuing operations of $18 million, or $0.40 per diluted share, and cash provided from operations was $89 million in the third quarter of 2009. Net income includes $1 million from the sale
of crude oil inventory. We drilled 32 gross wells, and capital expenditures excluding property acquisitions totaled $22 million. We achieved average production of 28,417 BOE/D in the third quarter of 2009.
Acquisitions. In June 2009, we acquired the Section 21Z property in McKittrick, California. We believe this acquisition provides us with another opportunity to increase our crude oil production and reserves with potential similar to our Poso Creek
asset. We also acquired deep rights to one of the leases in our Darco property in East Texas, providing us with an additional 13 Haynesville horizontal locations, and increased our interest at Garden Gulch in the Piceance.
Berry Petroleum Company
Management's Discussion and Analysis of Financial Condition and Results of Operations
Asset Dispositions.
On July 17, 2009, we completed the sale of our East Texas gas gathering system for $18.4 million in cash. See Note 8 to the unaudited financial statements.
On March 3, 2009, we entered into an agreement to sell our DJ basin assets and related hedges for $154 million before customary closing adjustments. The closing date of the sale of our DJ basin assets was April 1, 2009. We recorded an impairment charge associated with the sale of $9.6 million during the first quarter of 2009. Post
closing adjustments recorded in the second and third quarters of 2009 totaled $0.5 million income, net of tax. The total loss on sale was recorded within “(Loss) income from discontinued operations, net of tax,” on the condensed statements of operations for the nine months ended September 30, 2009.
Results of Operations. The following results from continuing operations are in millions (except per share data) for the three and nine month periods ended:
|
Three months ended, |
Nine months ended, |
|||||||||||||||||||
|
Sept 30, 2009 |
Sept 30, 2008 |
June 30, 2009 |
Sept 30, 2009 |
Sept 30, 2008 |
||||||||||||||||
|
Sales of oil |
$ | 109 | $ | 146 | $ | 103 | $ | 311 | $ | 423 | ||||||||||
|
Sales of gas |
18 | 48 | 16 | 63 | 92 | |||||||||||||||
|
Total sales of oil and gas |
$ | 127 | $ | 194 | $ | 119 | $ | 374 | $ | 515 | ||||||||||
|
Sales of electricity |
9 | 18 | 6 | 26 | 51 | |||||||||||||||
|
Gas Marketing |
5 | 13 | 5 | 18 | 28 | |||||||||||||||
|
Gain (loss) on derivative |
1 | 1 | (31 | ) | 7 | - | ||||||||||||||
|
Interest and other income, net |
1 | 1 | 1 | 2 | 3 | |||||||||||||||
|
Total revenues and other income |
$ | 143 | $ | 227 | $ | 100 | $ | 427 | $ | 597 | ||||||||||
|
Net income (loss) from continuing operations |
$ | 18 | $ | 50 | $ | (13 | ) | $ | 47 | $ | 133 | |||||||||
|
Diluted earnings (loss) per share from continuing operations |
$ | 0.40 | $ | 1.08 | $ | (0.28 | ) | $ | 1.03 | $ | 2.90 | |||||||||
Our revenues may vary significantly from period to period as a result of changes in commodity prices and/or production volumes. Crude oil sales in the three months ended September 30, 2009 were higher compared to the three months ended June 30, 2009 resulting from realized price increases of 1%, sales volume increases of 6% and
we recognized revenue of $2.7 million resulting from the sale of 50,000 barrels of crude oil inventory. The decrease in crude oil revenue when compared to the third quarter of 2008 is primarily the result of a 24% decrease in realized prices. Natural gas revenues increased from the quarter ended June 30, 2009 as a result of a 12% increase in realized prices and a 2% decrease in volumes from our Piceance and Uinta properties where no capital activity occurred during the quarter. Natural
gas revenues were lower in the third quarter of 2009 compared to the third quarter of 2008 primarily due to a 58% decrease in realized prices.
 |
 |
Berry Petroleum Company
Management's Discussion and Analysis of Financial Condition and Results of Operations
Operating data. The following table is for the three months ended:
|
September 30, 2009 |
% |
September 30, 2008 |
% |
June 30, 2009 |
% |
|||||||||||||||||||
|
Heavy Oil Production (Bbl/D) |
16,780 | 59 | 17,264 | 49 | 16,822 | 57 | ||||||||||||||||||
|
Light Oil Production (Bbl/D) |
2,530 | 9 | 3,898 | 11 | 3,085 | 11 | ||||||||||||||||||
|
Total Oil Production (Bbl/D) |
19,310 | 68 | 21,162 | 60 | 19,907 | 68 | ||||||||||||||||||
|
Natural Gas Production (Mcf/D) |
54,637 | 32 | 83,928 | 40 | 56,174 | 32 | ||||||||||||||||||
|
Total operations (BOE/D) |
28,417 | 100 | 35,150 | 100 | 29,270 | 100 | ||||||||||||||||||
|
DJ Basin Production (BOE/D) |
- | 3,337 | - | |||||||||||||||||||||
|
Production - Continuing Operations (BOE/D) |
28,417 | 31,813 | 29,270 | |||||||||||||||||||||
|
Oil and gas, per BOE for continuing operations |
||||||||||||||||||||||||
|
Average sales price before hedging |
$ | 45.41 | $ | 83.90 | $ | 39.34 | ||||||||||||||||||
|
Average sales price after hedging |
46.39 | 67.04 | 45.74 | |||||||||||||||||||||
|
Oil, per Bbl, for continuing operations: |
||||||||||||||||||||||||
|
Average WTI price |
$ | 68.24 | $ | 118.22 | $ | 59.79 | ||||||||||||||||||
|
Price sensitive royalties |
(2.36 | ) | (5.30 | ) | (2.08 | ) | ||||||||||||||||||
|
Quality differential and other |
(8.78 | ) | (10.80 | ) | (7.86 | ) | ||||||||||||||||||
|
Crude oil hedges reported with Sales of oil and gas |
2.28 | (26.12 | ) | 8.91 | ||||||||||||||||||||
|
Crude oil hedges reported with Gain on derivatives (a) |
(1.41 | ) | - | - | ||||||||||||||||||||
|
Average oil sales price after hedging |
$ | 57.97 | $ | 76.00 | $ | 58.76 | ||||||||||||||||||
|
Natural gas price for continuing operations: |
||||||||||||||||||||||||
|
Average Henry Hub (HH) price per MMBtu |
$ | 3.39 | $ | 10.24 | $ | 3.51 | ||||||||||||||||||
|
Conversion to Mcf |
0.17 | 0.51 | 0.18 | |||||||||||||||||||||
|
Natural gas hedges reported with Sales of oil and gas |
0.27 | 0.20 | 0.21 | |||||||||||||||||||||
|
Natural gas hedges reported with Gain (loss) on derivatives (a) |
(0.07 | ) | - | - | ||||||||||||||||||||
|
Location, quality differentials and other |
(0.28 | ) | (2.69 | ) | (0.72 | ) | ||||||||||||||||||
|
Average gas sales price after hedging per Mcf |
$ | 3.48 | $ | 8.26 | $ | 3.18 | ||||||||||||||||||
(a) Includes cash settlements on hedges for which the Company has not elected hedge accounting that are recorded in ‘Gain (Loss) on hedges.”
Berry Petroleum Company
Management's Discussion and Analysis of Financial Condition and Results of Operations
Operating data. The following table is for the nine months ended:
|
September 30, 2009 |
% |
September 30, 2008 |
% |
|||||||||||||
|
Heavy Oil Production (Bbl/D) |
16,691 | 55 | 16,845 | 54 | ||||||||||||
|
Light Oil Production (Bbl/D) |
2,892 | 10 | 3,710 | 12 | ||||||||||||
|
Total Oil Production (Bbl/D) |
19,583 | 65 | 20,555 | 66 | ||||||||||||
|
Natural Gas Production (Mcf/D) |
64,493 | 35 | 61,201 | 34 | ||||||||||||
|
Total operations (BOE/D) |
30,332 | 100 | 30,755 | 100 | ||||||||||||
|
DJ Basin Production (BOE/D) |
1,020 | 3,255 | ||||||||||||||
|
Production - Continuing Operations (BOE/D) |
29,312 | 27,500 | ||||||||||||||
|
Oil and gas, per BOE for continuing operations |
||||||||||||||||
|
Average sales price before hedging |
$ | 37.99 | $ | 86.63 | ||||||||||||
|
Average sales price after hedging |
46.43 | 68.50 | ||||||||||||||
|
Oil, per Bbl, for continuing operations: |
||||||||||||||||
|
Average WTI price |
$ | 57.22 | $ | 113.52 | ||||||||||||
|
Price sensitive royalties |
(1.83 | ) | (3.36 | ) | ||||||||||||
|
Quality differential and other |
(8.65 | ) | (12.90 | ) | ||||||||||||
|
Crude oil hedges reported with Sales of oil and gas |
11.49 | (23.83 | ) | |||||||||||||
|
Crude oil hedges reported with Gain on derivatives (a) |
(0.49 | ) | - | |||||||||||||
|
Correction to royalties payable |
- | 1.88 | ||||||||||||||
|
Average oil sales price after hedging |
$ | 57.74 | $ | 75.31 | ||||||||||||
|
Natural gas price for continuing operations: |
||||||||||||||||
|
Average HH price per MMBtu |
$ | 3.94 | $ | 9.74 | ||||||||||||
|
Conversion to Mcf |
0.20 | 0.49 | ||||||||||||||
|
Natural gas hedges reported with Sales of oil and gas |
0.56 | (0.22 | ) | |||||||||||||
|
Natural gas hedges reported with Gain (loss) on derivatives (a) |
(0.02 | ) | - | |||||||||||||
|
Location, quality differentials and other |
(0.74 | ) | (1.93 | ) | ||||||||||||
|
Average gas sales price after hedging per Mcf |
$ | 3.94 | $ | 8.08 | ||||||||||||
(a) Includes cash settlements on hedges for which the Company has not elected hedge accounting that are recorded in ‘Gain (Loss) on hedges.”
Berry Petroleum Company
Management's Discussion and Analysis of Financial Condition and Results of Operations
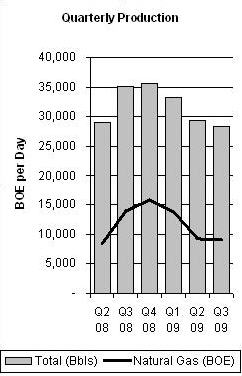 |
Gas Basis Differential. We have two contracts with the Rockies Express pipeline providing for 35,000 MMBtu/d of firm transport. Unlike the first and second quarters of 2009 in which the Piceance gas was sold based upon a mid-continent index
such as PEPL, third quarter gas was sold based an eastern price such as the Gas Daily Lebanon, Ohio index. For the third quarter of 2009, this index was approximately equal to HH based on daily averages. Our Uinta basin gas is sold based upon a Questar index which averaged $0.77 below HH during the third quarter of 2009 using first of month averages. In East Texas, the majority of the gas was sold based on the Florida Gas Transmission Zone 1 index which averaged $0.03 below HH. |
Gas Marketing. We have two long-term firm transportation contracts for our Piceance natural gas production, with total capacity of 35,000 MMBtu/D. We pay a demand charge for this capacity and our own production does not currently fill that capacity. In order
to maximize our firm transportation, we have contracted to purchase our partners’ share of the gas produced in the Piceance at the market rate for that area through December 2009. We used our excess transportation to move this gas to eastern markets where it was eventually sold. The pre-tax net of our gas marketing revenue and our gas marketing expense in the Statement of Operations is $0.6 million and $1.5 million in the three and nine month periods ended September 30, 2009. Firm transportation
costs related to all of our Rockies Express volumes is reflected in Operating costs - oil and gas production and total $3.5 million and $8.5 million for the three months and nine months ended September 30, 2009, respectively.
In addition, Berry has signed a binding precedent agreement with El Paso Corporation for an average of 35,000 MMBtu/D of firm transportation on the proposed Ruby Pipeline from Opal, WY to Malin, OR. While it is not certain that this new line will be constructed, the expectation is that the project will proceed and be in service
in 2011. As part of this agreement and in order to access the Ruby pipeline, we also secured firm transportation from Piceance to Opal.
Oil Contracts. California - On September 24, 2009, we executed a crude oil purchase contract with a refiner for the sale of all of our crude oil production from the Midway Sunset field. The volume approximates 12,500 barrels per day. The agreement
was effective on October 1, 2009 and continues until September 30, 2010. We also signed a 13 month contract for the sale of the Poso Creek crude oil to a refiner which had an effective date of September 1, 2009. Previously on March 20, 2009, we entered into a crude oil purchase contract with a refiner for the sale of all the Placerita crude. The agreement covers the period April 2009 through December 2009.
Utah - In February 2007, we entered into a multi-staged crude oil sales contract with a refiner for our Uinta basin light crude oil. Under the agreement, the refiner began purchasing 3,200 Bbl/D in July 2007. The refiner has increased its total capacity to 5,000 Bbl/D as provided in our contract. As operator we deliver all produced volumes
under our sales contracts, although our working interest partners or royalty owners may take their respective volumes in kind and market their own volumes. Gross oil production averaged approximately 3,100 BOE/D in the quarter ended September 30, 2009. The differential under the contract, which includes transportation and gravity adjustments, is linked to the price for NYMEX WTI.
Berry Petroleum Company
Management's Discussion and Analysis of Financial Condition and Results of Operations
Crude Oil Inventory. In May 2009, we entered into a sales agreement with a refiner for 1,500 barrels per day of production from our Poso Creek property for the months of May and June
2009. Under this agreement, we delivered approximately 100,000 barrels of oil to the refiner and received inventory of a slightly higher quality crude oil at the refinery. This transaction was accounted for as a non-monetary exchange and the amount recorded in crude oil inventory. The refiner purchased 50,000 barrels from us during the third quarter of 2009 and the remaining balance in “Crude Oil Inventory” at September 30, 2009 reflects the cost of production, transportation
costs and quality differentials for the remaining 50,000 barrels of inventory volume.
Hedging. See Note 4 to the unaudited financial statements and Item 3. Quantitative and Qualitative Disclosures about Market Risk.
Electricity. We consume natural gas as fuel to operate our three cogeneration facilities which are intended to provide an efficient and secure long-term supply of steam necessary for
the cost-effective production of heavy oil in California. We sell our electricity to utilities under standard offer contracts based on "avoided cost" or SRAC pricing approved by the California Public Utilities Commission (CPUC) and under which our revenues are currently linked to the cost of natural gas. On July 9, 2009, the CPUC issued a resolution that implemented a revised SRAC price methodology effective August 1, 2009 and resolved many of the disputed issues regarding the calculation of SRAC. The
revised pricing changes the gas indices upon which SRAC is based and reduces the avoided utility heat rates used to calculate SRAC. These changes are not expected to have a material impact on electricity revenues. Natural gas index prices and an avoided utility heat rate are the primary determinant of our electricity sales price based on the current pricing formula under these contracts. The correlation between electricity sales and natural gas prices allows us to manage our cost of producing steam
more effectively.
Electricity revenues and operating costs were down for the quarter ended September 30, 2009 from the quarter ended September 30, 2008 primarily due to 67% lower natural gas prices. Revenues and operating costs were higher in the quarter ended September 30, 2009 than in the quarter ended June 30, 2009 due to a 10% increase in electricity sold
offset by 3% lower electricity prices and 3% lower natural gas prices, respectively. We purchased approximately 28,000 MMBtu/D and 26,000 MMBtu/D as fuel for use in our cogeneration facilities in the quarters ended September 30, 2009 and September 30, 2008, respectively.
On September 20, 2007, the CPUC issued a decision (SRAC Decision) that changes the way SRAC energy prices will be determined for existing and new SO contracts, revises the capacity prices paid under current S01 contracts and establishes the capacity prices that will be paid under new SO contracts.
The following table is for the three months ended:
|
September 30, 2009 |
September 30, 2008 |
June 30, 2009 |
||||||||||
|
Electricity |
||||||||||||
|
Revenues (in millions) |
$ | 9.1 | $ | 18.3 | $ | 6.6 | ||||||
|
Operating costs (in millions) |
$ | 6.9 | $ | 13.7 | $ | 6.4 | ||||||
|
Electric power produced - MWh/D |
2,048 | 2,096 | 2,007 | |||||||||
|
Electric power sold - MWh/D |
1,966 | 1,908 | 1,783 | |||||||||
|
Average sales price/MWh |
$ | 45.24 | $ | 104.91 | $ | 46.99 | ||||||
|
Fuel gas cost/MMBtu (including transportation) |
$ | 3.26 | $ | 8.20 | $ | 3.54 | ||||||
Berry Petroleum Company
Management's Discussion and Analysis of Financial Condition and Results of Operations
The following table is for the nine months ended:
|
September 30, 2009 |
September 30, 2008 |
|||||||
|
Electricity |
||||||||
|
Revenues (in millions) |
$ | 26.0 | $ | 51.2 | ||||
|
Operating costs (in millions) |
$ | 22.1 | $ | 45.6 | ||||
|
Electric power produced - MWh/D |
2,048 | 1,539 | ||||||
|
Electric power sold - MWh/D |
1,896 | 1,869 | ||||||
|
Average sales price/MWh |
$ | 65.88 | $ | 100.88 | ||||
|
Fuel gas cost/MMBtu (including transportation) |
$ | 3.44 | $ | 8.70 | ||||
Oil and Gas Operating, Production Taxes, G&A and Interest Expenses. The following table presents information about our continuing operating expenses for each of the three month periods ended:
|
Amount per BOE |
Amount (in thousands) |
|||||||||||||||||||||||
|
Sept 30, 2009 |
Sept 30, 2008 |
June 30, 2009 |
Sept 30, 2009 |
Sept 30, 2008 |
June 30, 2009 |
|||||||||||||||||||
|
Operating costs – oil and gas production |
$ | 14.99 | $ | 17.93 | $ | 13.03 | $ | 39,195 | $ | 52,486 | $ | 34,738 | ||||||||||||
|
Production taxes |
1.48 | 3.04 | 1.83 | 3,874 | 8,912 | 4,885 | ||||||||||||||||||
|
DD&A – oil and gas production |
12.81 | 12.76 | 12.89 | 33,502 | 37,354 | 34,371 | ||||||||||||||||||
|
G&A |
4.09 | 4.87 | 4.94 | 10,686 | 14,251 | 13,164 | ||||||||||||||||||
|
Interest expense |
5.57 | 2.74 | 3.97 | 14,562 | 8,031 | 10,589 | ||||||||||||||||||
|
Total |
$ | 38.94 | $ | 41.34 | $ | 36.66 | $ | 101,819 | $ | 121,034 | $ | 97,747 | ||||||||||||
|
|
· |
Operating costs. Steam costs are the primary variable component of our operating costs and fluctuate based on the amount of steam we inject and the price of fuel used to generate steam. The following table presents steam information: |
|
September 30, 2009
(3Q09) |
September 30, 2008
(3Q08) |
3Q09
to 3Q08 Change |
June 30,
2009
(2Q09) |
3Q09 to 2Q09 Change |
||||||||||||||||
|
Average volume of steam injected (Bbl/D) |
110,381 | 105,574 | 5 | % | 107,739 | 2 | % | |||||||||||||
|
Fuel gas cost/MMBtu (including transportation) |
$ | 3.26 | $ | 8.20 | (60 | %) | $ | 3.12 | 4 | % | ||||||||||
|
Approximate net fuel gas volume consumed in steam generation (MMBtu/D) |
32,193 | 29,362 | 10 | % | 29,459 | 9 | % | |||||||||||||
Operating costs increased by $4.5 million or 13% from the second quarter of 2009 to the third quarter of 2009. During the second quarter of 2009 $2.8 million of the costs related to crude oil inventory were recorded on the balance sheet. During the third quarter of 2009, as a result of the sale of 50,000 barrels of this
inventory, we recognized $1.2 million of operating costs. Additionally, fuel gas costs increased approximately 4% as a result of increased natural gas prices and 9% higher fuel gas volume consumed in steam generation. The decrease in operating costs from the third quarter of 2008 to the third quarter of 2009 was due to decreased fuel gas costs of approximately 60% as a result of decreased natural gas prices and 10% lower fuel gas volume.
|
|
· |
Production taxes. Severance taxes paid in Utah, Colorado and Texas are directly related to the field sales price of the commodity. In California and Utah, our properties are burdened with ad valorem taxes on proved reserves. In Colorado,
we are also burdened with ad valorem tax on equipment. We take advantage of all credits and exemptions allowed in our various taxing jurisdictions. As the proportion of our production changes from area to area, our production tax rate will vary depending on the quantities produced from each area and the production tax rates in effect for those areas. Our production tax cost per barrel during the third quarter of 2009 compared to the second quarter of 2009 is lower due to decreased
ad valorem assessments primarily driven by lower lien date commodity pricing from various assessment jurisdictions. In addition, we have experienced greater reductions in tax from various severance exemptions per state. Rates were higher in 2008 due to increased oil and natural gas prices. |
Berry Petroleum Company
Management's Discussion and Analysis of Financial Condition and Results of Operations
|
|
· |
General and administrative. Approximately 65% of our G&A is related to compensation. Our G&A decreased during the third quarter of 2009 as compared to the second quarter of 2009 due to a liability that was established during the second quarter of 2009 for a regulatory compliance
matter. |
|
|
· |
Interest expense. Our total outstanding borrowings were approximately $1.0 billion at September 30, 2009 compared to $1.1 billion and $1.2 billion at September 30, 2008 and December 31, 2008, respectively. The increase in interest expense between periods is due to the amortization
of additional debt issuance costs and amortization of the net discount, which were incurred in June 2009 and August 2009 in connection with the issuance of our 10.25% senior notes due in 2014. For the three months ended September 30, 2009, $8.5 million of interest cost has been capitalized and we expect to capitalize between $28 million and $33 million of interest cost during the full year of 2009. |
|
|
· |
Debt Extinguishment Costs. During the third quarter of 2009 our borrowing base decreased from $969 million to $938 million as a result of the issuance of our $125 million senior unsecured notes add-on. We wrote off $0.3 million of deferred loan fees during the third quarter of 2009 related to this borrowing base reduction. |
Estimated 2009 and Actual Nine Months Ended September 30, 2009 and 2008 Oil and Gas Operating, G&A and Interest Expenses. Variances for the nine month periods are discussed below when substantially different from the three month periods.
|
Nine months ended, |
||||||||||||||||||||
|
Anticipated range |
Amount per BOE |
Amount (in thousands) |
||||||||||||||||||
|
Full Year 2009
per BOE |
Sept 30, 2009 |
Sept 30, 2008 |
Sept 30, 2009 |
Sept 30, 2008 |
||||||||||||||||
|
Operating costs-oil and gas production |
$ | 13.00 - 15.00 | $ | 13.91 | $ | 19.13 | $ | 111,317 | $ | 144,158 | ||||||||||
|
Production taxes |
1.50 - 2.50 | 1.80 | 2.74 | 14,411 | 20,663 | |||||||||||||||
|
DD&A – oil and gas production (1) |
12.50 – 13.50 | 13.03 | 11.61 | 104,271 | 87,462 | |||||||||||||||
|
G&A |
4.25 - 4.75 | 4.64 | 4.82 | 37,143 | 36,312 | |||||||||||||||
|
Interest expense |
4.00 - 4.75 | 4.40 | 1.98 | 35,201 | 14,910 | |||||||||||||||
|
Total |
$ | 35.25 – 40.50 | $ | 37.78 | $ | 40.28 | $ | 302,343 | $ | 303,505 | ||||||||||
(1) Full year estimate includes both oil and gas and electricity
|
|
· |
Operating costs. Steam costs are the primary variable component of our operating costs and fluctuate based on the amount of steam we inject and the price of fuel used to generate steam. The following table presents steam information for each of the nine month periods ended: |
|
September 30,
2009 |
September 30,
2008 |
Change |
||||||||||
|
Average volume of steam injected (Bbl/D) |
106,892 | 98,050 | 9 | % | ||||||||
|
Fuel gas cost/MMBtu (including transportation) |
$ | 3.44 | $ | 8.70 | (60 | %) | ||||||
|
Approximate net fuel gas volume consumed in steam generation (MMBtu/D) |
29,308 | 26,128 | 12 | % | ||||||||
Operating costs decreased by $32.8 million or 23% during the nine months ended September 30, 2009 compared to the nine months ended September 30, 2008. The majority of the decrease came from decreased fuel gas costs of 60% from decreased natural gas prices.
|
|
· |
Depreciation, depletion and amortization. DD&A increased per BOE by 12% for the nine months ended September 30, 2009 as compared to the nine months ended September 30, 2008 due to an increase in the contribution of our development properties with higher drilling and leasehold acquisition costs and the integration of our East Texas assets
which have higher finding and development costs than our legacy assets. |
Berry Petroleum Company
Management's Discussion and Analysis of Financial Condition and Results of Operations
|
|
· |
Dry Hole, Abandonment, impairment and exploration. During the nine months ended September 30, 2009 and 2008, we recorded dry hole, abandonment, impairment and exploration expense of $0.2 million and $7.4 million, respectively. Charges
of $2.7 million, $2.6 million and $1.5 million were recorded during the first, second and third quarters of 2008, respectively for technical difficulties that were encountered on five wells in the Piceance basin before reaching total depth. These holes were abandoned in favor of drilling to the same bottom hole location by drilling new wells. In addition, $0.5 million of exploration expense was recorded during the nine months ended September 30, 2008 for exploration activities
which were primarily 3-D seismic in nature. |
|
|
· |
Debt Extinguishment Costs. During the nine months ended September 30, 2009 and 2008, we recorded debt extinguishment costs of $10.8 million and $0, respectively. During the second quarter of 2009 our borrowing base decreased from $1.25 billion to $969 million as a result of our scheduled borrowing base redetermination and
the issuance of our senior unsecured notes. We wrote off $3.3 million of deferred loan fees during the second quarter of 2009 related to these transactions. Additionally, we paid off our second lien term loan in conjunction with the issuance of our senior unsecured notes. We expensed $7.2 million in fees related to the second lien term loan in the second quarter of 2009. During the third quarter of 2009 our borrowing base decreased from $969 million to $938 million
as a result of the issuance of our senior unsecured notes. We wrote off $0.3 million of deferred loan fees during the third quarter of 2009 related to the $31 million borrowing base reduction. |
|
|
· |
Income Taxes. We experienced an effective tax rate of 34.3% and 37.4% in the nine months ended September 30, 2009 and September 30, 2008, respectively. The change for the nine month period ended September 30, 2009 when compared to the same period in 2008 was primarily due to reduced state rates and the reduction in our liability
related to uncertain tax positions. Our estimated annual effective tax rate varies from the 35% federal statutory rate due to the effects of state income taxes and estimated permanent differences. See Note 11 to the unaudited financial statements. |
Drilling Activity. The following
table sets forth certain information regarding drilling activities:
|
Three months ended
September 30, 2009 |
Nine months ended
September 30, 2009 | ||||||
|
Asset Team |
Gross Wells |
Net Wells |
Gross Wells |
Net Wells | |||
|
S. Midway |
24 |
24 |
34 |
34 | |||
|
N. Midway |
6 |
6 |
51 |
51 | |||
|
Texas |
2 |
2 |
8 |
8 | |||
|
Totals |
32 |
32 |
93 |
93 | |||
Properties
Asset Team Descriptions
S. Midway – Our S. Midway Asset Team includes four assets (Homebase, Formax, Ethel D and Poso Creek). In 2009 through the third quarter we have drilled 14 Homebase horizontal wells and two vertical producers. These wells have been placed
deeper and closer to the oil-water contact. All of these wells are currently on production and are performing in line with expectations. An additional five horizontal wells will be drilled at S. Midway during the fourth quarter of 2009. We are also accelerating plans to expand our continuous steam support for these horizontal wells by drilling six steam injectors. At Ethel D we have been encouraged by the performance of our steam flood pilots and are preparing to expand
the flood in the fourth quarter of 2009. As part of this preparation we will be increasing our steam generation capacity at Ethel D by 50% by year-end. At Poso Creek we expanded the steam flood by drilling eight new injectors. To provide steam to these wells we also installed a fifth steam generator. Average daily production during the three months ended September 30, 2009 from all S. Midway assets was approximately 11,300 BOE/D.
N. Midway – Our N. Midway Asset Team includes four assets (Diatomite, N. Midway, Placerita and McKittrick). Based on capital spending of $39 million we have drilled 51 diatomite wells and installed additional steam generation and water treating
facilities. Production in the third quarter of 2009 was 3,119 Bbl/D and is expected to average 3,000 Bbl/D for the year. During the fourth quarter of this year we will initiate a four pattern steam flood pilot on our recently acquired McKittrick property. Average daily production during the three months ended September 30, 2009 from all N. Midway assets was approximately 5,500 BOE/D.
Uinta – Average daily production during the three months ended September 30, 2009 from all Uinta basin assets averaged 4,900 BOE/D. Implementation of a waterflood pilot in Brundage
Canyon continues and we had initial start up in the beginning of the fourth quarter of 2009. While the Ashley Forest Development EIS continues to progress with approval now expected in 2010, we obtained a category exemption for 25 wells in the Ashley Forest.
Berry Petroleum Company
Management's Discussion and Analysis of Financial Condition and Results of Operations
East Texas – During the three months ended September 30, 2009, production from our East Texas assets averaged 23 MMcf/D. We continue to operate a one rig program and drilled two vertical
wells in the Oakes field during the third quarter of 2009. We plan to begin drilling a vertical well in the Darco field during the fourth quarter of 2009 and our first horizontal Haynesville well in the fourth quarter of 2009.
Piceance – During the three months ended September 30, 2009, production from the Piceance basin averaged 17 MMcf/D. Infrastructure expansions were completed in preparation for completions
planned over the third and fourth quarters to test new completion techniques. Our initial tests delivered a 25% improvement compared to our historical field average. As of September 30, 2009, we had an inventory of 38 initial completion and recompletion opportunities, of which we expect to complete 18 during the fourth quarter of 2009.
DJ – In March 2009, we announced the sale of our DJ basin assets and related hedges for approximately $154 million. Our assets in the DJ basin produced 3,100 BOE/D during the first
quarter of 2009. The sale of the assets closed on April 1, 2009.
Financial Condition, Liquidity and Capital Resources. Substantial capital is required to replace and grow reserves. We achieve reserve replacement and growth primarily through successful development and exploration drilling and the acquisition of properties. Fluctuations
in commodity prices, production rates and operating expenses have been the primary reason for changes in our cash flow from operating activities.
Liquidity. The total outstanding debt at September 30, 2009 under the Agreement and the Line of Credit was $365 million and $13 million, respectively, and $4 million in letters of credit have been issued under the facility.
Subsequent to the August 2009 issuance of the $125 million of 10.25% senior unsecured notes due 2014, the borrowing base under our senior secured revolving credit facility is approximately $938 million. This borrowing base was reconfirmed by our banks in October 2009. As of September 30, 2009, we had approximately
$378 million outstanding under our senior secured revolving credit facility, with liquidity of approximately $550 million.
Capital Expenditure and Cash Flows. We establish a capital budget for each calendar year based on our development opportunities and the expected cash flow from operations for that year. Acquisitions are typically
debt financed. We may revise our capital budget during the year as a result of acquisitions and/or drilling outcomes or significant changes in cash flows.
In 2009, we have a capital program of approximately $130 million and we expect to fully fund this program from operating cash flow. Cash provided by operating activities was impacted during the nine months ended September 30, 2009 by a reduction in accounts payable which, at year-end 2008, reflected our higher 2008 capital budget. Approximately
90% of our oil production is hedged for 2009 and thus our sensitivity to changes in oil prices is limited. A ten dollar change in oil prices has a minimal impact on operating cash flow and a one dollar change in natural gas prices impacts our annual operating cash flow by approximately $1 million.
Capital expenditures, excluding property acquisitions, totaled $22 million and $95 million during the three and nine months ended September 30, 2009.
Working Capital. Cash flow from operations is dependent upon the price of crude oil and natural gas and our ability to increase production and manage costs. Our working capital balance fluctuates as a result
of the amount of borrowings and the timing of repayments under our credit arrangements. We use our long-term borrowings under our credit facility primarily to fund property acquisitions. Generally, we use excess cash to pay down borrowings under our credit arrangement. As a result, we often have a working capital deficit or a relatively small amount of positive working capital.
Berry Petroleum Company
Management's Discussion and Analysis of Financial Condition and Results of Operations
The table below compares continuing operations, financial condition, liquidity and capital resources changes for the three month periods ended (in millions, except for production and average prices):
|
September 30, 2009
(3Q09) |
September 30, 2008
(3Q08) |
3Q09 to 3Q08 Change |
June 30, 2009
(2Q09) |
3Q09 to 2Q09 Change |
||||||||||||||||
|
Average production (BOE/D) |
28,417 | 31,813 | (11 | %) | 29,270 | (3 | %) | |||||||||||||
|
Average oil and gas sales prices, per BOE after hedging |
46.39 | $ | 67.04 | (31 | %) | $ | 45.74 | 1 | % | |||||||||||
|
Net cash provided by operating activities |
$ | 89 | $ | 137 | (35 | %) | $ | 51 | 75 | % | ||||||||||
|
Working capital (deficit) |
$ | (40 | ) | $ | (148 | ) | 73 | % | $ | (3 | ) | n/a | ||||||||
|
Sales of oil and gas |
$ | 127 | $ | 194 | (35 | %) | $ | 119 | 7 | % | ||||||||||
|
Total debt |
$ | 1,013 | $ | 1,129 | (10 | %) | $ | 1,085 | (7 | %) | ||||||||||
|
Capital expenditures |
$ | 22 | $ | 742 | (97 | %) | $ | 23 | (4 | %) | ||||||||||
|
Dividends paid |
$ | 3.4 | $ | 3.4 | - | $ | 3.4 | - | ||||||||||||
Contractual Obligations. Our contractual obligations as of September 30, 2009 are as follows (in millions):
|
Total |
2009 |
2010 |
2011 |
2012 |
2013 |
Thereafter |
||||||||||||||||||||||
|
Total debt and interest |
$ | 1,385.1 | $ | 30.5 | $ | 71.8 | $ | 71.8 | $ | 430.3 | $ | 62.6 | $ | 718.1 | ||||||||||||||
|
Abandonment obligations |
43.2 | 1.3 | 2.9 | 2.9 | 2.8 | 2.8 | 30.5 | |||||||||||||||||||||
|
Operating lease obligations |
16.6 | 0.6 | 2.4 | 2.4 | 2.5 | 2.5 | 6.2 | |||||||||||||||||||||
|
Drilling and rig obligations |
38.6 | 4.4 | 8.0 | 8.0 | 18.2 | - | - | |||||||||||||||||||||
|
Firm natural gas transportation contracts |
140.1 | 4.6 | 19.1 | 19.1 | 17.8 | 15.7 | 63.8 | |||||||||||||||||||||
|
Total |
$ | 1,623.6 | $ | 41.4 | $ | 104.2 | $ | 104.2 | $ | 471.6 | $ | 83.6 | $ | 818.6 | ||||||||||||||
Drilling obligations - Under our June 2006 joint venture agreement in the Piceance basin we are required to have 120 wells drilled by February 2011 to avoid penalties of $0.2 million per well or a maximum of $24 million. As of September 30, 2009 we have drilled 29 of these wells
and we expect to meet our obligation.
Other Obligations - As of September 30, 2009 we had a gross liability for uncertain tax benefits of $7.4 million of which $6.2 million, if recognized, would affect the effective tax rate. We are unable to predict the year in which these uncertain tax positions will
be settled and have excluded these contingencies from the table above.
In February 2007, we entered into a multi-staged crude oil sales contract with a refiner for our Uinta basin light crude oil. Under the agreement, the refiner began purchasing 3,200 Bbl/D in July 2007. The refiner has increased its total capacity to 5,000 Bbl/D as provided in our contract. As operator we deliver all produced volumes under
our sales contracts, although our working interest partners or royalty owners may take their respective volumes in kind and market their own volumes. Gross oil production averaged approximately 3,100 BOE/D in the quarter ended September 30, 2009. The differential under the contract, which includes transportation and gravity adjustments, is linked to the price for NYMEX Light Sweet Crude. This contract provides us an outlet to sell all of our current oil production in the Uinta basin.
On July 17, 2009, we closed on the sale of our East Texas gas gathering system for $18.4 million in cash. We entered into concurrent long-term gas gathering agreements for the East Texas production. There is no minimum payment required under these agreements. For the first nine months of 2009, we have
incurred $1.0 million under these agreements.
On June 17, 2009, we amended our natural gas firm transportation agreement with Enbridge Pipelines providing for transportation of our East Texas gas to Orange County, Florida (Zone 1). The agreement provides for minimum volume of 25,000 MMBtu/D and a maximum volume of 55,000 MMBtu/D.
Recent Accounting Developments
In December 2007, the FASB issued authoritative guidance to establish accounting and reporting standards for the noncontrolling interests in a subsidiary (formerly called minority interests) and for the deconsolidation of a subsidiary. The adoption of this authoritative guidance did not have a material impact on our financial statements.
Berry Petroleum Company
Management's Discussion and Analysis of Financial Condition and Results of Operations
In March 2008, the FASB issued authoritative guidance, which changes the disclosure requirements for derivative instruments and hedging activities. Expanded disclosures are required to provide information about (a) how and why an entity uses derivative instruments, (b) how derivative instruments and related hedged items are accounted for,
and (c) how derivative instruments and related hedged items affect an entity’s financial position, financial performance, and cash flows. The adoption of this authoritative guidance did not have a material impact on our financial statements. We have expanded our disclosures accordingly. See Note 4 to the unaudited financial statements.
In June 2008, the FASB issued authoritative guidance, which clarifies that share-based payment awards that entitle their holders to receive nonforfeitable dividends before vesting should be considered participating securities. As participating securities, these instruments should be included in the earnings allocation in computing basic earnings
per share under the two-class method described in authoritative guidance. All prior period earnings per share data presented shall be adjusted retrospectively to conform with the provisions of this guidance. This guidance is effective for financial statements issued for fiscal years beginning after December 15, 2008 and interim periods within those years. The adoption of this authoritative guidance did not have a material impact on our financial statements. See Note 12 to the unaudited
financial statements.
In December 2008, the Securities and Exchange Commission adopted revisions to its oil and gas disclosure requirements that are intended to align them with current practices and changes in technology. Among other things, the amendments will: replace the single-day year-end pricing assumption with a twelve-month average pricing assumption;
permit the disclosure of probable and possible reserves; allow the use of certain technologies to establish reserves; require the disclosure of the qualifications of the technical person primarily responsible for preparing the reserves estimates or conducting a reserves audit; require the filing of the independent reserve engineers' summary report; and permit the disclosure of a reserves sensitivity analysis table to illustrate the impact of different price and/or cost assumptions on reserves. These amendments
are effective for registration statements filed on or after January 1, 2010, and for annual reports on Form 10-K for fiscal years ending on December 31, 2009, with early adoption prohibited. The Company is currently evaluating the impact that the adoption of this pronouncement will have on the Company's financial position, results of operations, and disclosures.
In April 2009, the FASB issued authoritative guidance which requires disclosures about fair value of financial instruments for interim reporting periods as well as in annual financial statements. The adoption of this authoritative guidance did not have a material impact on
our financial statements. We have expanded our disclosures accordingly. See Note 3 – to the unaudited financial statements.
In May 2009, the FASB issued authoritative guidance, which establishes general standards of accounting for and disclosure of events that occur after the balance sheet date but before financial statements are issued or are available to be issued. We implemented this guidance during the
second quarter of 2009 and we expanded our disclosures accordingly. See Note 15 to the unaudited financial statements.
In June 2009, the FASB approved the FASB Accounting Standards Codification (ASC), which after its effective date of July 1, 2009 is the single source of authoritative, nongovernmental U.S. Generally Accepted Accounting Principles (GAAP). The Codification reorganizes all previous U.S. GAAP pronouncements into roughly 90 accounting
topics and displays all topics using a consistent structure. All existing standards that were used to create the Codification are now superseded, replacing the previous references to specific Statements of Financial Accounting Standards (SFAS) with numbers used in the Codification’s structural organization. The adoption of this authoritative guidance did not have a material impact on our financial statements. We have updated our disclosures accordingly.
Forward Looking Statements
“Safe harbor under the Private Securities Litigation Reform Act of 1995:” Any statements in this Form 10-Q that are not historical facts are forward-looking statements that involve risks and uncertainties. Words such as “plan,”
“will,” “intend,” “continue,” “target(s),” “expect,” “achieve,” “future,” “may,” “could,” “goal(s),” “anticipate,” or other comparable words or phrases, or the negative of those words, and other words of similar meaning indicate forward-looking statements and important factors which could affect actual results. Forward-looking statements are made based on management’s current
expectations and beliefs concerning future developments and their potential effects upon Berry Petroleum Company. These items are discussed at length in Part I, Item 1A on page 15 of our Form 10-K dated February 25, 2009, filed with the Securities and Exchange Commission, under the heading “Risk Factors” and all material changes are updated in Part II, Item 1A within this Form 10-Q.
Berry Petroleum Company
Item 3. Quantitative and Qualitative Disclosures About Market Risk
As discussed in Note 4 to the unaudited condensed financial statements, to minimize the effect of a downturn in oil and gas prices and protect our profitability and the economics of our development plans, we enter into crude oil and natural gas hedge contracts from time to time. The terms of contracts depend on various factors, including
management's view of future crude oil and natural gas prices, acquisition economics on purchased assets and our future financial commitments. This price hedging program is designed to moderate the effects of a severe crude oil and natural gas price downturn while allowing us to participate in some commodity price increases. In California, we benefit from lower natural gas pricing as we are a consumer of natural gas in our operations, and elsewhere we benefit from higher natural gas pricing. We have hedged, and
may hedge in the future, both natural gas purchases and sales as determined appropriate by management. Management regularly monitors the crude oil and natural gas markets and our financial commitments to determine if, when, and at what level some form of crude oil and/or natural gas hedging and/or basis adjustments or other price protection is appropriate in accordance with policy established by our board of directors. Currently, our hedges are in the form of swaps and collars. However,
we may use a variety of hedge instruments in the future to hedge WTI or the index gas price. The collar strike prices allow us to protect our cash flow if oil prices decline below our floor prices which range from $55.00 to $100.00 per barrel while still participating in any oil price increase up to the ceiling prices which range from $68.00 to $163.60 per barrel on the volumes indicated above. In total, we have approximately 90% and 75% of our expected 2009 and 2010 oil production
hedged in the form of swaps and collars. Our natural gas collars have a floor of from $6.00 to $6.50 per MMBtu and ceilings ranging from $8.60 to $8.90 per MMBtu. In total, we have approximately 25% of both our 2009 and 2010 expected natural gas production hedged in the form of swaps and collars.
Berry Petroleum Company
The following table summarizes our commodity hedge position as of September 30, 2009:
|
Average |
|
Average |
||||||||
|
Barrels |
Average |
MMBtu |
Average | |||||||
|
Term |
Per Day |
Prices |
|
Term |
Per Day |
Price | ||||
|
Crude Oil Sales (NYMEX WTI) Collars |
|
Natural Gas Sales (NYMEX HH TO PEPL) Basis Swaps | ||||||||
|
Full year 2009 |
295 |
$80.00/$91.00 |
4th quarter 2009 |
4,000 |
$1.05 | |||||
|
Full year 2009 |
1,000 |
$100.00/$163.60 |
Full year 2009 |
2,000 |
$1.24 | |||||
|
Full year 2009 |
1,000 |
$100.00/$150.30 |
Full year 2009 |
3,000 |
$1.19 | |||||
|
Full year 2009 |
1,000 |
$100.00/$160.00 |
Full year 2010 |
2,000 |
$1.05 | |||||
|
Full year 2009 |
1,000 |
$100.00/$150.00 |
Full year 2010 |
3,000 |
$1.00 | |||||
|
Full year 2009 |
1,000 |
$100.00/$157.48 |
||||||||
|
Full year 2010 |
1,000 |
$65.15 / $75.00 |
Natural Gas Sales (NYMEX HH) Swaps | |||||||
|
Full year 2010 |
1,000 |
$65.50 / $78.50 |
Full year 2009 |
2,000 |
$6.15 | |||||
|
Full year 2010 |
280 |
$80.00 / $90.00 |
Full year 2009 |
3,000 |
$6.19 | |||||
|
Full year 2010 |
1,000 |
$100.00/$161.10 |
4th quarter 2009 |
4,000 |
$8.50 | |||||
|
Full year 2010 |
1,000 |
$100.00/$150.30 |
July – December 2009 |
5,000 |
$4.21 | |||||
|
Full year 2010 |
1,000 |
$100.00/$160.00 |
Full year 2010 |
5,000 |
$6.02 | |||||
|
Full year 2010 |
1,000 |
$100.00/$150.00 |
Full year 2011 |
5,000 |
$6.89 | |||||
|
Full year 2010 |
1,000 |
$100.00/$158.50 |
Full year 2012 |
5,000 |
$7.16 | |||||
|
Full year 2010 |
1,000 |
$70.00/$86.00 |
||||||||
|
Full year 2011 |
270 |
$80.00/$90.00 |
||||||||
|
Full year 2011 |
1,000 |
$55.20/$70.00 |
||||||||
|
Full year 2011 |
1,000 |
$55.00/$70.50 |
Natural Gas Sales (NYMEX HH) Collars | |||||||
|
Full year 2011 |
1,000 |
$55.00/$68.65 |
Full year 2010 |
2,000 |
$6.00/$8.60 | |||||
|
Full year 2011 |
1,000 |
$55.00/$68.00 |
Full year 2010 |
3,000 |
$6.00/$8.65 | |||||
|
Full year 2011 |
1,000 |
$55.00/$71.20 |
Full year 2010 |
1,000 |
$6.50/$8.75 | |||||
|
Full year 2011 |
1,000 |
$60.00/$76.00 |
Full year 2010 |
1,000 |
$6.50/$8.85 | |||||
|
Full year 2011 |
1,000 |
$60.00/$81.25 |
Full year 2010 |
2,000 |
$6.50/$8.90 | |||||
|
Full year 2012 |
1,000 |
$63.00/$82.60 |
||||||||
|
Full year 2012 |
1,000 |
$63.00/$83.50 |
||||||||
|
Full year 2012 |
1,000 |
$70.00/$93.00 |
||||||||
|
Crude Oil Sales (NYMEX WTI) Swaps |
Natural Gas Sales (NYMEX HH TO NGPL) Basis Swaps | |||||||||
|
Full year 2009 |
240 |
$71.50 |
Full year 2010 |
2,000 |
$0.49 | |||||
|
Full year 2009 |
1,000 |
$70.30 |
||||||||
|
Full year 2009 |
1,000 |
$70.50 |
Natural Gas Sales (NYMEX HH TO HSC) Basis Swaps | |||||||
|
Full year 2010 |
2,000 |
$0.38 | ||||||||
|
4th Quarter 2009 |
2,000 |
$55.00 |
July – December 2009 |
2,500 |
$0.031 | |||||
|
Full year 2009 |
1,000 |
$54.67 |
Full year 2010 |
2,500 |
$0.345 | |||||
|
Full year 2009 |
2,000 |
$54.10 |
Full year 2011 |
2,500 |
$0.325 | |||||
|
Full year 2009 |
5,000 |
$54.39 |
Full year 2012 |
2,500 |
$0.320 | |||||
|
Full year 2010 |
1,000 |
$61.00 |
||||||||
|
Full year 2010 |
1,000 |
$61.25 |
Natural Gas Sales (NYMEX HH to NGPL-Tex OK) Basis Swaps | |||||||
|
Full year 2010 |
1,000 |
$64.80 |
July – December 2009 |
2,500 |
$0.475 | |||||
|
Full year 2010 |
1,000 |
$62.03 |
Full year 2010 |
2,500 |
$0.415 | |||||
|
Full year 2010 |
1,000 |
$63.00 |
Full year 2011 |
2,500 |
$0.460 | |||||
|
Full year 2010 |
1,000 |
$63.75 |
Full year 2012 |
2,500 |
$0.440 | |||||
|
Full year 2010 |
650 |
$56.90 |
||||||||
|
Full year 2011 |
500 |
$57.36 |
||||||||
|
Full year 2011 |
500 |
$57.40 |
||||||||
|
Full year 2011 |
500 |
$57.50 |
||||||||
|
Full year 2011 |
250 |
$61.80 |
||||||||
|
October 2009 |
1,613 |
$65.85 |
||||||||
|
November 2009 |
1,667 |
$65.85 |
||||||||
Berry Petroleum Company
We generally utilize NYMEX WTI based derivatives to hedge cash flows from our California oil sales. Our oil sales contracts with multiple refiners are primarily based on the field posting prices. There is a high correlation between WTI and the field posting prices which allows us to utilize hedge accounting. As
there is a ready market for our crude oil in California, we do not believe the loss of any particular refiner impacts the probability that our hedged forecasted transactions will occur. We generally hedge our natural gas at the basis location that corresponds to the sale.
While we designate the majority of our hedges as cash flow hedges, we have not elected hedge accounting on certain of our crude oil and natural gas hedges. During the three and nine months ended September 30, 2009, we recorded $0.5 million and $6.6 million under the caption “Gain (loss) on derivatives” related
to hedges for which we either did not elect hedge accounting or which no longer qualified for hedge accounting. In conjunction with the sale of the DJ basin assets, during the first quarter of 2009, we concluded that the forecasted transaction in certain of our hedging relationships was not probable of occurring. As such, we reclassified a gain of $14.3 million from accumulated other comprehensive income (loss) to the statement of operations under the caption “Gain (loss) on derivative.” Additionally,
a portion of the change in fair value for hedges that we have designated as cash flow hedges may impact our income as our sales price is not perfectly correlated with our hedges. We recognized an unrealized net loss of $0.5 million and $0.4 million on the statement of operations under the caption “Gain (loss) on derivatives” for the three and nine months ended September 30, 2009, respectively, as a result of ineffectiveness. During the first quarter of 2009, we entered into natural
gas derivatives on behalf of the purchaser of our DJ assets. We did not elect hedge accounting for these hedges and recorded an unrealized net loss of $0.5 million on the statement of operations under the caption “(Loss) income from discontinued operations, net of taxes.”
We have entered into interest rate hedges as shown below to swap the floating rate under our senior secured credit facility (LIBOR) for a fixed interest rate. These interest rate swaps have been designated as cash flow hedges.
|
Notional |
||||
|
Amount |
||||
|
Hedge Term |
$MM |
Fixed Rate | ||
|
4/1/2009 – 6/30/2012 |
100 |
4.74% | ||
|
4/15/2009 – 7/15/2012 |
100 |
1.99% | ||
|
9/15/2009 – 7/15/2012 |
50 |
2.31% |
The related cash flow impact of all of our hedges is reflected in cash flows from operating activities. At September 30, 2009, our net fair value of derivative liability was $31.3 million as compared to a net fair value asset of $185.9 million at December 31, 2008 which reflects increases in commodity prices. Based on NYMEX strip pricing
as of September 30, 2009, we expect to receive cash under the existing derivatives of $14.7 million during the next twelve months. At September 30, 2009, Accumulated Other Comprehensive Income (Loss) consisted of $17.2 million, net of tax, of unrealized losses from our crude oil and natural gas swaps and collars that qualified for hedge accounting treatment at September 30, 2009. Deferred net losses recorded in “Accumulated Other Comprehensive Income (Loss)” at September 30, 2009 and subsequent mark-to-market
changes in the underlying hedging contracts are expected to be reclassified to earnings in the same period that the forecasted transaction impacts earnings.
Berry Petroleum Company
Based on average NYMEX futures prices as of September 30, 2009 (WTI $76.24; HH $6.51) for the term of our hedges we would expect to make pre-tax future cash payments or to receive payments over the remaining term of our crude oil and natural gas hedges in place as follows:
| September 30, 2009 NYMEX Futures |
Impact of percent change in futures prices on pre-tax future cash (payments) and receipts |
|||||||||||||||||||
| -40 | % | -20 | % | + 20 | % | +40 | % | |||||||||||||
|
Average WTI Futures Price (2009 – 2012) |
$ | 76.24 | $ | 45.75 | $ | 61.00 | $ | 91.49 | $ | 106.74 | ||||||||||
|
Average HH Futures Price (2009 – 2010) |
6.51 | 3.91 | 5.21 | 7.81 | 9.12 | |||||||||||||||
|
Crude Oil gain/(loss) (in millions) |
$ | (8.8 | ) | $ | 276.9 | $ | 118.0 | $ | (163.6 | ) | $ | (323.9 | ) | |||||||
|
Natural Gas gain/(loss) (in millions) |
(0.9 | ) | 29.9 | 19.5 | 0.8 | (6.3 | ) | |||||||||||||
|
Total |
$ | (9.7 | ) | $ | 306.8 | $ | 137.5 | $ | (162.8 | ) | $ | (330.2 | ) | |||||||
|
Net pre-tax future cash (payments) and receipts by year (in millions) based on average price in each year: |
||||||||||||||||||||
|
2009 (WTI $70.76: HH $4.72) |
$ | (1.7 | ) | $ | 47.6 | $ | 24.2 | $ | (22.5 | ) | $ | (45.8 | ) | |||||||
|
2010 (WTI $73.84; HH $6.13) |
19.1 | 199.0 | 108.3 | (53.8 | ) | (134.6 | ) | |||||||||||||
|
2011 (WTI $77.15) |
(27.2 | ) | 43.7 | 2.3 | (79.6 | ) | (134.5 | ) | ||||||||||||
|
2012 (WTI $79.11) |
0.1 | 16.5 | 2.7 | (6.9 | ) | (15.3 | ) | |||||||||||||
|
Total |
$ | (9.7 | ) | $ | 306.8 | $ | 137.5 | $ | (162.8 | ) | $ | (330.2 | ) | |||||||
Interest Rates. Our exposure to changes in interest rates results primarily from long-term debt. In October 2006, we issued, in a public offering, $200 million of 8.25% senior subordinated notes due 2016. In May 2009, we issued, in a public offering, $325
million of 10.25% senior notes due 2014. In August 2009, we issued, in a public offering, an additional $125 million of 10.25% senior notes due 2014. At September 30, 2009, total long-term debt outstanding was $1 billion. Interest on amounts borrowed under our credit facility is charged at LIBOR plus 2.25% to 3.0%, with the exception of the principal for which we have hedged, plus the credit facility’s margin through July 15, 2012. Based on September 30, 2009 credit facility
borrowings, a 1% change in interest rates, including our interest rate hedges, would have an annualized $1 million after tax impact on our financial statements.
Berry Petroleum Company
Item 4. Controls and Procedures
As of September 30, 2009, we have carried out an evaluation under the supervision of, and with the participation of, our management, including our Chief Executive Officer and Chief Financial Officer, of the effectiveness of the design and operation of our disclosure controls and procedures pursuant to Rule 13a-15 under the Securities Exchange
Act of 1934, as amended (“Exchange Act”).
Our Chief Executive Officer and Chief Financial Officer have concluded that, as of September 30, 2009, our disclosure controls and procedures are effective to ensure that the information required to be disclosed by us in the reports that we file or submit under the Exchange Act is recorded, processed, summarized and
reported within the time periods specified in SEC rules and forms, and that information required to be disclosed by us in such reports is accumulated and communicated to our management, including our principal executive officer and principal financial officer, as appropriate to allow timely decisions regarding required disclosure.
There was no change in our internal control over financial reporting that occurred during the three months ended September 30, 2009 that materially affected, or is reasonably likely to materially affect, our internal control over financial reporting.
Berry Petroleum Company
PART II. OTHER INFORMATION
Item 1. Legal Proceedings
In September 2009 a final consent agreement with the U.S. Environmental Protection Agency was approved relating to alleged late filing of certain leak detection and repair reports for one of our facilities in Utah. We paid a penalty of $36,000 and are obligated to spend $114,000 for an agreed supplemental environmental project. In
an unrelated matter, also in September 2009, we entered into a settlement agreement with the Colorado Department of Health and Environment relating to an alleged failure to implement certain best management practices designed to limit impacts to storm water discharges at certain of our construction sites in Colorado. Under the agreement, which is currently subject to a public comment period, we will pay a penalty of $150,000 and will spend an additional $250,000 on two agreed supplemental environmental
projects.
In July 2009, we received a notice of proposed civil penalty from the Bureau of Land Management (BLM) related to the Company’s alleged non-compliance during 2007 with regulations relating to the operation and position of certain valves in our Uinta Basin operations. The proposed civil penalty was $69.6 million and reflects
the theoretical maximum penalty amount under applicable regulations, absent mitigating factors. In 2007 we immediately remediated the instances of non-compliance, cooperated fully with the BLM’s investigation and we believe no production was lost, all royalties were paid and there was no harm to the environment. Due to the above mitigating factors, among others, we believe this matter will be resolved by the payment of a penalty that will not exceed $2.1 million and have accrued such amount
in the second quarter of 2009.
Item 1A. Risk Factors
We are subject to complex federal, state, regional, local and other laws and regulations that could give rise to substantial liabilities from environmental contamination or otherwise adversely affect our cost, manner or feasibility of doing business.
All facets of our operations are regulated extensively at the federal, state, regional and local levels. In addition, a portion of our leases in Uinta are, and some of our future leases may be, regulated by Native American tribes. Environmental laws and regulations impose limitations on our discharge of pollutants into the environment, establish
standards for our management, treatment, storage, transportation and disposal of hazardous materials and of solid and hazardous wastes, and impose on us obligations to investigate and remediate contamination in certain circumstances. We also must satisfy, in some cases, federal and state requirements for providing environmental assessments, environmental impact studies and/or plans of development before we commence exploration and production activities. Environmental and other requirements applicable to our operations
generally have become more stringent in recent years, and compliance with those requirements more expensive. Frequently changing environmental and other governmental laws and regulations have increased our costs to plan, design, drill, install, operate and abandon oil and natural gas wells and other facilities, and may impose substantial liabilities if we fail to comply with such regulations or for any contamination resulting from our operations. Our business results from operations and financial condition may
be adversely affected by any failure to comply with, or future changes to, these laws and regulations. In particular, failure to comply with these laws and regulations may result in the suspension or termination of our operations and subject us to administrative, civil and criminal penalties.
From time to time we have experienced accidental spills, leaks and other discharges of contaminants at some of our properties. We could be liable for the investigation or remediation of such contamination, as well as other liabilities concerning hazardous materials or contamination such as claims for personal injury or property damage. We
have incurred expenses and penalties in connection with remediation of contamination in the past, and we may do so in the future. Such liabilities may arise at many locations, including properties in which we have an ownership interest but no operational control, properties we formerly owned or operated and sites where our wastes have been treated or disposed of, as well as at properties that we currently own or operate, and may arise even where the contamination does not result from any noncompliance with applicable
environmental laws. Under a number of environmental laws, including the Comprehensive Environmental Response, Compensation and Liability Act (“CERCLA”), such liabilities may be joint and several, meaning that we could be held responsible for more than our share of the liability involved, or even the entire share. Some of the properties that we have acquired, or in which we may hold an interest but not operational control, may have past or ongoing contamination for which we may be held responsible.
Some of our operations are in environmentally sensitive areas that may provide habitat for endangered or threatened species, and other protected areas, and our operations in such areas must satisfy additional regulatory requirements. Moreover, public interest in environmental protection has increased in recent years, and environmental organizations have opposed certain drilling projects and/or access to prospective lands and have filed litigation to attempt to stop such projects, including decisions by the Bureau
of Land Management regarding several leases in Utah that we have been awarded.
Berry Petroleum Company
Our activities are also subject to regulation by oil and natural gas-producing states and one Native American tribe of conservation practices and protection of correlative rights. These regulations affect our operations and limit the quantity of oil and natural gas we may produce and sell. A major risk inherent in our drilling plans is the
need to obtain drilling permits from federal, state, local and Native American tribal authorities. Delays in obtaining regulatory approvals or drilling permits, the failure to obtain a drilling permit for a well, or the receipt of a permit with unreasonable conditions that are more expensive than we have anticipated could have a negative effect on our ability to explore or develop our properties. Additionally, the oil and natural gas regulatory environment could change in ways that might substantially increase
the financial and managerial costs to comply with the requirements of these laws and regulations and, consequently, adversely affect our profitability.
Recent and future environmental laws and regulations, including additional federal and state restrictions on greenhouse gas emissions that may be passed in response to climate change concerns, may increase our operating costs and also reduce the demand for the oil and natural gas we produce. The oil and gas industry is a direct source of
certain greenhouse gas (GHG) emissions, such as carbon dioxide and methane, and future restrictions on such emissions could impact our future operations. Specifically, on April 17, 2009, EPA issued a notice of its proposed finding and determination that emission of carbon dioxide, methane, and other GHGs present an endangerment to human health and the environment because emissions of such gases are, according to EPA, contributing to warming of the earth’s atmosphere. EPA’s proposed finding and determination, allows it
to begin regulating emissions of GHGs under existing provisions of the federal Clean Air Act. To this end, on September 22, 2009, EPA issued a “Mandatory Reporting of Greenhouse Gases” final rule (“Reporting Rule”). The Reporting Rule establishes a new comprehensive scheme requiring operators of stationary sources emitting more than established annual thresholds of carbon dioxide-equivalent GHGs to inventory and report their GHG emissions annually on a facility-by-facility basis.
EPA has stated that it intends to review public comments and other relevant information before requiring compliance with the Reporting Rule by oil and gas systems sources, such as oil and gas production, processing and transmission. Monitoring obligations for other source categories will begin on January 1, 2010, and reporting of emissions from the 2010 calendar year is required by no later than March 31, 2011. It is unclear how long it will take EPA to revise the Reporting Rule so that it will be
applicable to oil and gas systems. In addition, EPA has proposed a stationary source GHG permitting rule that would establish "significance levels" for major GHGs that would trigger review and permitting requirements. Compliance with the Reporting Rule and any other GHG regulation could require us to incur increased costs. . Similarly, on June 26, 2009, the U.S. House of Representatives approved adoption of the “American
Clean Energy and Security Act of 2009,” also known as the “Waxman-Markey cap-and-trade legislation” or ACESA. ACESA would establish an economy-wide cap on emissions of GHGs in the United States and would require most sources of GHG emissions to obtain GHG emission “allowances” corresponding to their annual emissions of GHGs. The U.S. Senate has begun work on its own legislation for controlling and reducing emissions of GHGs in the United States. Any
laws or regulations that may be adopted to restrict or reduce emissions of GHGs would likely require us to incur increased operating costs and could have an adverse effect on demand for the oil and natural gas we produce. At the state level, more than one-third of the states, including California, have begun taking actions to control and/or reduce emissions of GHGs. The California Global Warming Solutions Act of 2006, also known as “AB 32,” caps California’s greenhouse gas emissions
at 1990 levels by 2020, and the California Air Resources Board is currently developing mandatory reporting regulations and early action measures to reduce GHG emissions prior to January 1, 2012. Although most of the regulatory initiatives developed or being developed by the various states have to date been focused on large sources of GHG emissions, such as coal-fired electric power plants, it is possible that smaller sources of emissions could become subject to GHG emission limitations in the future. A number
of our personnel are involved in monitoring the establishment of these regulations through industry trade groups and other organizations in which we are a member. It is not possible, at this time, to estimate accurately how these regulations would impact our business.
In addition, the U.S. Congress is currently considering certain other legislation which, if adopted in its current proposed form, could subject companies involved in oil and natural gas exploration and production activities to substantial additional regulation. If such legislation is adopted, federal tax incentives
could be curtailed, and hedging activities as well as certain other business activities of exploration and production companies could be limited, resulting in increased operating costs. Any such limitations or increased operating costs could have a material adverse effect on our business.
A change in the jurisdictional characterization of some of our assets by federal, state or local regulatory agencies or a change in policy by those agencies may result in increased regulation of our assets, which may cause our revenues to decline and operating expenses to increase.
Berry Petroleum Company
Section 1(b) of the Natural Gas Act (“NGA”) exempts natural gas gathering facilities from regulation by the Federal Energy Regulatory Commission (“FERC”) as a natural gas company under the NGA. We believe that the natural gas pipelines in our gathering systems meet the traditional tests FERC has used to establish a
pipeline’s status as a gatherer not subject to regulation as a natural gas company, but the status of these lines has never been challenged before FERC. The distinction between FERC-regulated transmission services and federally unregulated gathering services is subject to change based on future determinations by FERC, the courts, or Congress, and application of existing FERC policies to individual factual circumstances. Accordingly the classification and regulation of some of our natural gas gathering facilities
may be subject to challenge before FERC or subject to change based on future determinations by FERC, the courts, or Congress. In the event our gathering facilities are reclassified to FERC-regulated transmission services, we may be required to charge lower rates and our revenues could thereby be reduced.
Should we fail to comply with all applicable FERC-administered statutes, rules, regulations and orders, we could be subject to substantial penalties and fines.
FERC has issued an order requiring certain participants in the natural gas market, including natural gas gatherers and marketers that engage in a minimum level of natural gas sales or purchases to submit annual reports regarding those transactions to FERC. In addition, FERC has issued an order requiring major non-interstate pipelines, defined
as certain non-interstate pipelines delivering, on an annual basis, more than an average of 50 million MMBtu of gas over the previous three calendar years, to post daily certain information regarding the pipeline’s capacity and scheduled flows for each receipt and delivery point that has design capacity equal to or greater than 15,000 MMBtu per day. Should we fail to comply with these requirements or any other applicable FERC-administered statute, rule, regulation or order, we could be subject to substantial
penalties and fines. Under the Energy Policy Act of 2005, or EP Act 2005, FERC has civil penalty authority under the NGA to impose penalties for current violations of up to $1 million per day for each violation and disgorgement of profits associated with any violation.
Item 2. Unregistered Sales of Equity Securities and Use of Proceeds
None.
Item 3. Defaults Upon Senior Securities
None.
Item 4. Submission of Matters to a Vote of Security Holders
None.
Item 5. Other Information
None.
Item 6. Exhibits
|
Exhibit No. |
Description of Exhibit |
|
4.1 |
Form of 10¼% Senior Notes due 2014 (included in Exhibit 4.2 to the Registrant’s Current Report on Form 8-K on August 17, 2009, File No. 1-9735). |
|
10.1 |
Underwriting Agreement, dated August 11, 2009, by and among Registrant and Wachovia Capital Markets, LLC, RBS Securities Inc., BNP Paribas Securities Corp., SG Americas Securities, LLC and Calyon Securities (USA) Inc., as representatives of the underwriters named therein (filed as Exhibit 1.1 to the Registrant’s Current Report on Form 8-K on August 13, 2009, File No. 1-9735). |
|
10.2* |
Crude Oil Purchase Contract dated September 24, 2009 between the Registrant and ExxonMobil Oil Corporation. |
|
Computation of Ratio of Earnings to Fixed Charges |
|
31.1 |
Certification of Chief Executive Officer pursuant to Section 302 of the Sarbanes-Oxley Act of 2002 |
|
31.2 |
Certification of Chief Financial Officer pursuant to Section 302 of the Sarbanes-Oxley Act of 2002 |
|
32.1 |
Certification of Chief Executive Officer pursuant to 18 U.S.C. Section 1350, as adopted pursuant to Section 906 of the Sarbanes-Oxley Act of 2002 |
|
32.2 |
Certification of Chief Financial Officer pursuant to 18 U.S.C. Section 1350, as adopted pursuant to Section 906 of the Sarbanes-Oxley Act of 2002 |
|
|
* Portions of this exhibit have been omitted pursuant to a request for confidential treatment. |
SIGNATURE
Pursuant to the requirements of the Securities Exchange Act of 1934, the registrant has duly caused this report to be signed on its behalf by the undersigned thereto duly authorized.
BERRY PETROLEUM COMPANY
/s/ Shawn M. Canaday
Shawn M. Canaday
Vice President of Finance
(Principal Accounting Officer)
Date: October 30, 2009
39