Attached files
| file | filename |
|---|---|
| 8-K - FORM 8-K - BECKMAN COULTER INC | d8k.htm |
| EX-99.1 - PRESS RELEASE - BECKMAN COULTER INC | dex991.htm |
 1 BEC Q3 2009 Conf Call & Webcast Presentation 10/29/09 - 1 Beckman Coulter Q3 2009 – Financial Presentation Scott Garrett Chairman, President & Chief Executive Officer Exhibit 99.2 1 |
 BEC
Q3 2009 Conf Call & Webcast Presentation 10/29/09 - 2 Key Points Q3 2009 Core Business (ex. ODS) performing well: #1 - Recurring Revenue: 7.7%
(cc) #2 - Cash Instrument Sales: 15% (cc) #3 - Operating Income Margin: 13.5% #4 - Expanded Earnings and Cash Flow EPS: $0.95 Free Cash Flow YTD: > $180M |
 BEC
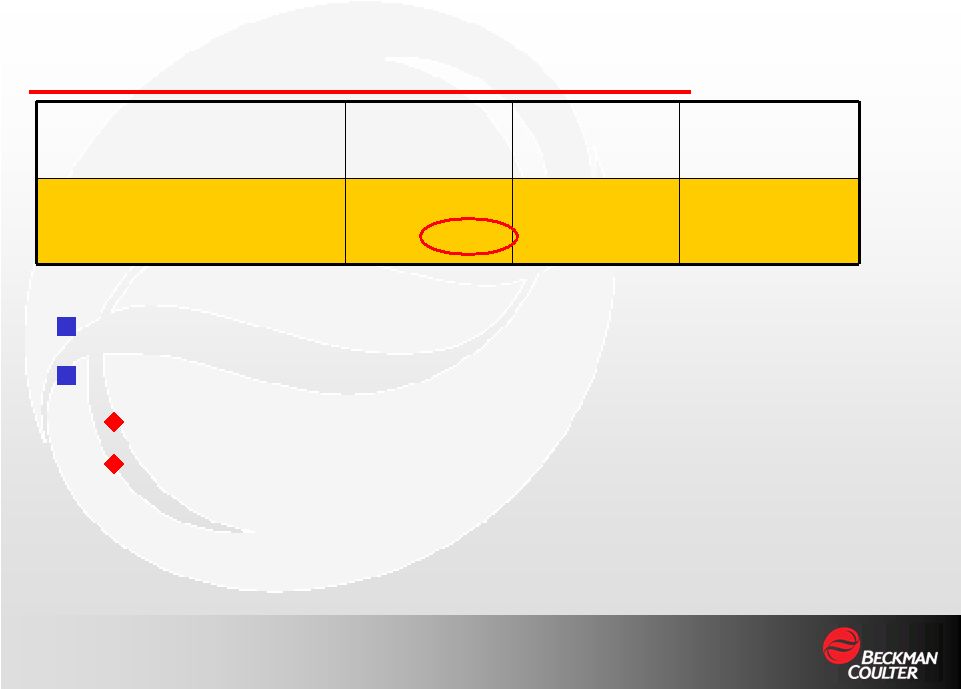
Q3 2009 Conf Call & Webcast Presentation 10/29/09 - 3 Strength in Diagnostics- ex ODS 8.4% (cc) AutoChemistry and Immunoassay growing above market Access Immunoassay growing >10% (cc) Recurring Revenue: Q3 2009 ($ millions) Product Area Beckman Coulter Olympus Diagnostics (ODS) Consolidated Total Recurring Revenue % Chg in constant currency $620.2 7.7% $55.9 $676.1 17.3% |
 BEC
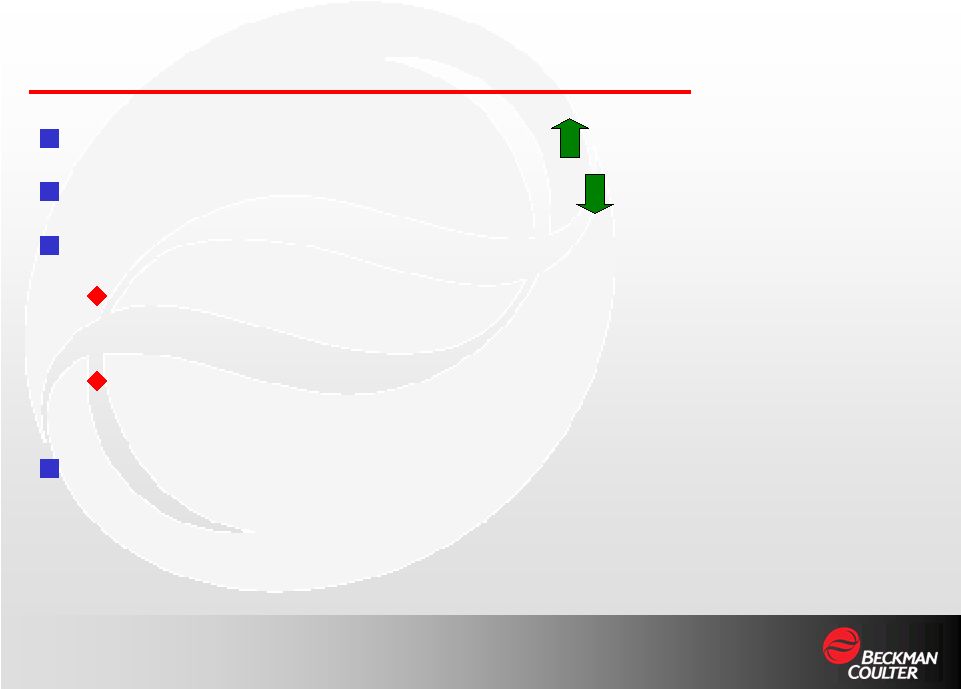
Q3 2009 Conf Call & Webcast Presentation 10/29/09 - 4 Deferred instrument renewals Weakness in Cellular and Life Science Prior year comparables Challenging economic environment Cash Instrument Sales: Q3 2009 ($ millions) Product Area Beckman Coulter Olympus Diagnostics (ODS) Consolidated Total Cash Instrument Sales % Chg in constant currency $137.5 (14.8%) $9.2 $146.7 (9.4%) |
 BEC
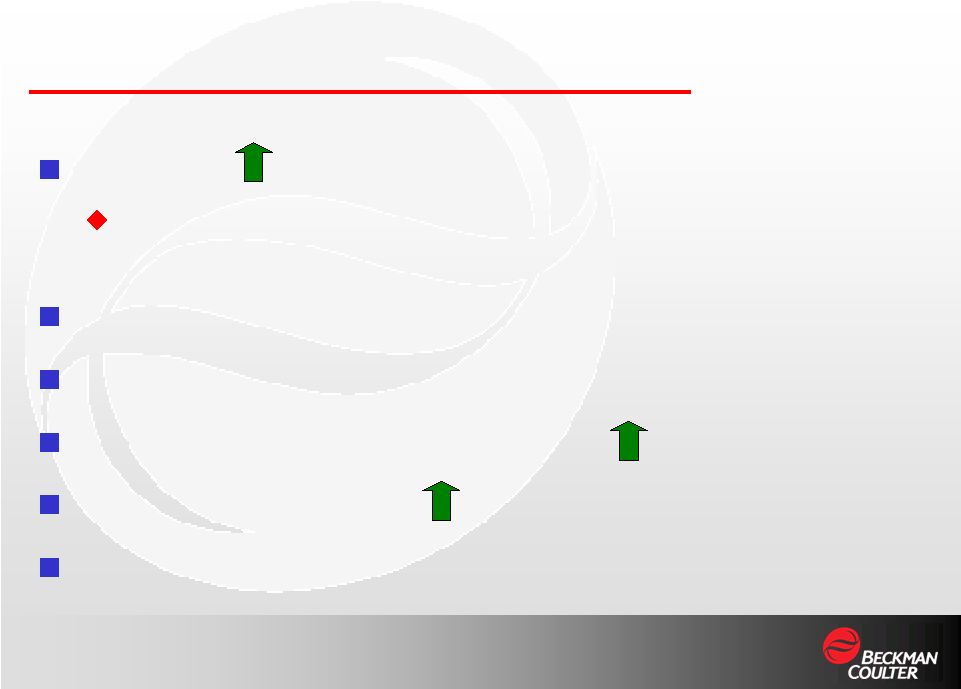
Q3 2009 Conf Call & Webcast Presentation 10/29/09 - 5 Revenue by Geography: Q3 2009 ($ millions) Beckman Coulter Olympus Diagnostics (ODS) Consolidated United States % Chg $381.0 1.2% $21.2 $402.2 6.8% International % Chg in constant currency $376.8 4.4% $43.9 $420.6 16.2% United States: Recurring revenue growing mid-single digits Life Science 7% International: Recurring revenue growing double digits Europe (ex ODS) 4% (cc) Asia Pacific was strong led by China |
 BEC
Q3 2009 Conf Call & Webcast Presentation 10/29/09 - 6 Olympus Integration Progress to Date Integration is meeting expectations 2010 Anticipated Synergies: $50 to $60M R&D: $20M Discontinued Immunoassay R&D Selling Expense: $25M Eliminated redundancies to achieve 2010 run rate by year-end General and Admin.: $5-15M Still working through transition services Re-configuring Operations Rationalizing distribution Converting to OTL model |
 7 BEC Q3 2009 Conf Call & Webcast Presentation 10/29/09 - 7 Beckman Coulter Q3 2009 – Financial Presentation Charlie Slacik SVP & Chief Financial Officer 7 |
 BEC
Q3 2009 Conf Call & Webcast Presentation 10/29/09 - 8 2009 Outlook- (ex ODS) Provided 10/29/09 Total revenue: Reported Flat Constant currency 0% to 2% Recurring revenue (cc) 6% to 7% Op income margin ~13% Non-Operating expense ~ $55 M Tax rate ~ 25% CAPEX ~ $325 M Depreciation & Amortization $270 to $290 M EPS (based on ~ 65.5M shares) $3.85 to $3.95 Olympus dilution (ex amortization) $0.08 Olympus dilution (inc amortization) $0.18 |
 BEC
Q3 2009 Conf Call & Webcast Presentation 10/29/09 - 9 Adjusted P & L: Q3 2009 ($ millions) Beckman Coulter Olympus Diagnostics (ODS) Consolidated Revenue: Recurring revenue % Chg in constant currency Cash instrument sales % Chg in constant currency TOTAL % Chg in constant currency $620.2 7.7% 137.5 (14.8%) $757.7 2.8% $55.9 9.2 $65.1 $676.1 17.3% 146.7 (9.4%) $822.8 11.6% Operating Income Margin $101.7 13.5% $ 2.0 3.1% $103.7 12.6% EPS diluted % Chg $0.95 26.7% ($0.10*) $0.85 13.3% *Includes $0.04 for intangible amortization |
 BEC
Q3 2009 Conf Call & Webcast Presentation 10/29/09 - 10 Adjusted Non-Op*: Q3 2009 ($ millions) Q3 2009 Q3 2008 Change Interest Income ($1.4) ($2.4) ($1.0) Interest Expense $21.9 $16.7 ($5.2) Misc Non-Op $0.0 ($2.0) ($2.0) Total $20.5 $12.3 ($8.2) * Excludes Olympus Acquisition related currency gains
|
 BEC
Q3 2009 Conf Call & Webcast Presentation 10/29/09 - 11 Adjusted P & L: YTD Q3 2009 ($ millions) Beckman Coulter Olympus Diagnostics (ODS) Consolidated Revenue: Recurring revenue % Chg in constant currency Cash instrument sales % Chg in constant currency TOTAL % Chg in constant currency $1,822.9 6.8% 383.0 (20.1%) $2,205.9 0.9% $55.9 9.2 $65.1 $1,878.8 10.0% 392.2 (18.3%) $2,271.0 3.8% Operating Income Margin $265.2 12.0% $ 2.0 3.1% $267.2 11.8% EPS diluted % Chg $2.65 17.7% ($0.10*) $2.55 12.8% *Includes $0.04 for intangible amortization |
 BEC
Q3 2009 Conf Call & Webcast Presentation 10/29/09 - 12 Balance Sheet & Cash Flow YTD Q3 2009 CAPEX: $18M Increase in PP&E CAPEX offset by decrease in OTL CAPEX DSO (ex ODS): 4 day improvement Inventory turns (ex ODS): 3.0 to 3.1 (cc) Adjusted EBITDA TTM: $675M 12% Operating cash flow: $158M to $402M YTD Free cash flow > $180M YTD |
 13 BEC Q3 2009 Conf Call & Webcast Presentation 10/29/09 - 13 Beckman Coulter Q3 2009 – Financial Presentation 13 |
 BEC
Q3 2009 Conf Call & Webcast Presentation 10/29/09 - 14 Concluding Remarks YTD Q3 2009 Recurring
revenue*: 6.8% (cc) Adjusted operating expense*: 3% (cc) Olympus update: Rationale: Reach into high-volume labs, extending cross-selling Integration: Synergies on plan 2010 preliminary outlook, including Olympus, on December 17, 2009 at our Annual Business Review in New York *Excludes ODS |
 15 BEC Q3 2009 Conf Call & Webcast Presentation 10/29/09 - 15 Beckman Coulter Q3 2009 – Financial Presentation 15 |
 BEC
Q3 2009 Conf Call & Webcast Presentation 10/29/09 - 16 Forward-Looking Statements and Non-GAAP Financial Information This presentation contains forward-looking statements within the meaning of Section
27A of the Securities Act of 1933, as amended, and Section 21E of the
Securities Exchange Act of 1934, as amended. The forward-looking
statements expectations, estimates, forecasts and projections about the company and are subject to risks and uncertainties, some of which may be beyond the
company’s control, that could cause actual results and events to differ
materially from those stated in the forward- looking statements. These
risks and uncertainties include our ability to compete effectively; changes in laws and regulations, including pending health care reform; market demand for the
company’s new and existing products; intellectual property infringement
claims by others and the ability to protect the company’s intellectual
property; difficulty in obtaining materials and components for our products; consolidation of our customer base, formation of group purchasing organizations and
changes in customer inventory levels and inventory management practices;
reductions in government funding to our customers; foreign currency exchange
fluctuations; global market, economic and political conditions and natural
disasters; costs associated with our supply chain initiatives; tax risks and regulations; changes in the value of our investment in marketable securities; and our ability to successfully
acquire and integrate acquired businesses and realize the anticipated
benefits from such acquisitions, including our acquisition of the
lab-based diagnostics business of Olympus Corporation. Additional factors that could cause actual results to differ are discussed in Part I, Item 1A (Risk Factors) of the
Company’s Form 10- K filed with the SEC on February 23, 2009 as well
as in the Company’s Form 10-Q filed since then and reports on Form
8-K. Forward-looking statements contained in this presentation are made only as of the date hereof, and we undertake no obligation to update these disclosures except as may be
required by law. The financial information provided in this presentation uses non-GAAP financial
measures. Reconciliations of the non-GAAP financial measures to
the most directly comparable GAAP financial measures and management’s
view about the usefulness of the information to investors can be found in our third quarter earnings release filed with our Form 8-K dated October 29, 2009
and also is available on our website at www.beckmancoutler.com under
Investor Relations “What’s Ahead.” |