Attached files
| file | filename |
|---|---|
| 8-K - FORM 8-K - TRAVELZOO | form8k.htm |
| EX-99.1 - PRESS RELEASE - TRAVELZOO | ex99-1.htm |
Exhibit 99.2


Please read this management presentation together
with the Company’s press release issued earlier today
announcing the Company’s third quarter 2009 financial
results and in conjunction with
the Company’s recent
Annual Report and Quarterly Results as filed with the
Securities and Exchange Commission (SEC).
IMPORTANT NOTICE

Certain statements contained in this presentation that are not historical facts may be
forward looking statements within the meaning of Section 27A of the Securities Act of
1933, as amended, and Section
21E of the Securities and Exchange Act of 1934, as
amended. These forward looking statements may include, but are not limited to,
statements about our plans, objectives, expectations, prospects and intentions, markets in
which we participate
and other statements contained in this presentation that are not
historical facts. When used in this presentation, the words "expect," "predict," "project,"
"anticipate," "believe," "estimate," "intend," "plan," "seek" and similar expressions
are
generally intended to identify forward looking statements. Because these forward looking
statements involve risks and uncertainties, there are important factors that could cause
actual results to differ materially from those expressed
or implied by these forward looking
statements, including changes in our plans, objectives, expectations, prospects and
intentions and other factors discussed in our filings with the SEC. We cannot guarantee
any future levels of activity, performance
or achievements. Travelzoo Inc. undertakes no
obligation to update forward-looking statements to reflect events or circumstances
occurring after the date of this presentation.

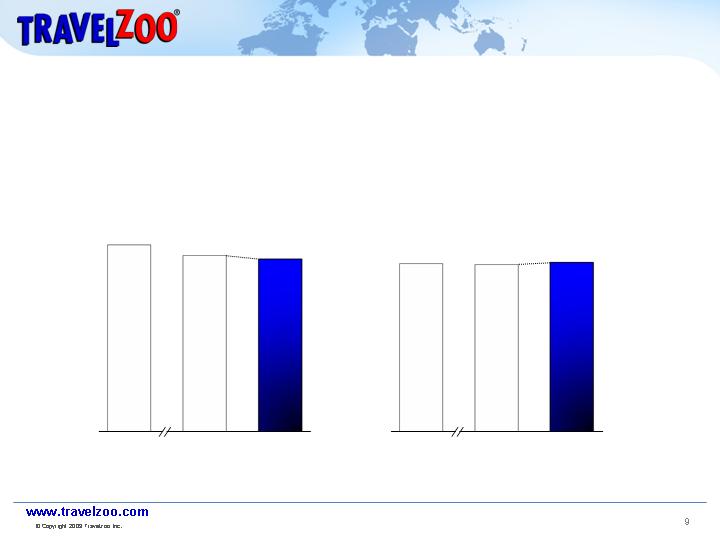
Revenues
(continuing operations)
$ millions
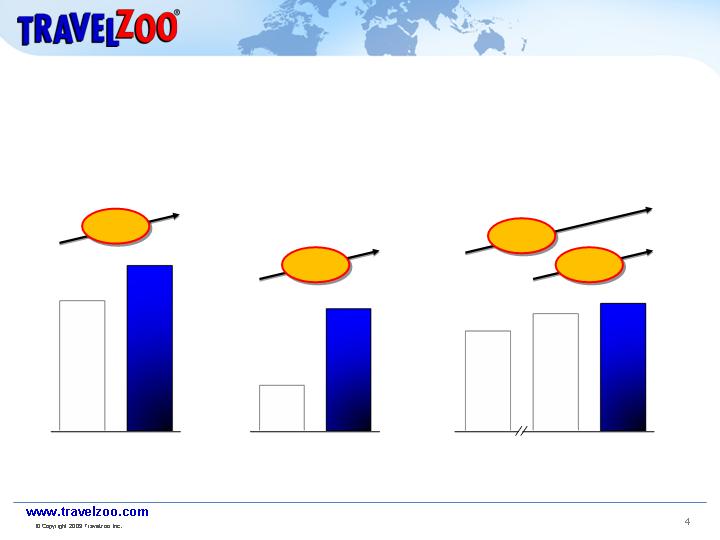
In a challenging economy, Travelzoo was able to close Q3 2009
with significant growth across our most important metrics.
Q3 2009 FINANCIAL PERFORMANCE
Q3
2008
Q3
2009
Q3
2008
Q2
2009
Q3
2009
Q3
2008
Q3
2009
EPS
(continuing operations)
$ per share
Subscribers
(continuing operations)
Millions
18.6
23.6
13.2
15.2
16.3
+27%
+167%
+7%
+24%
$0.03
$0.08

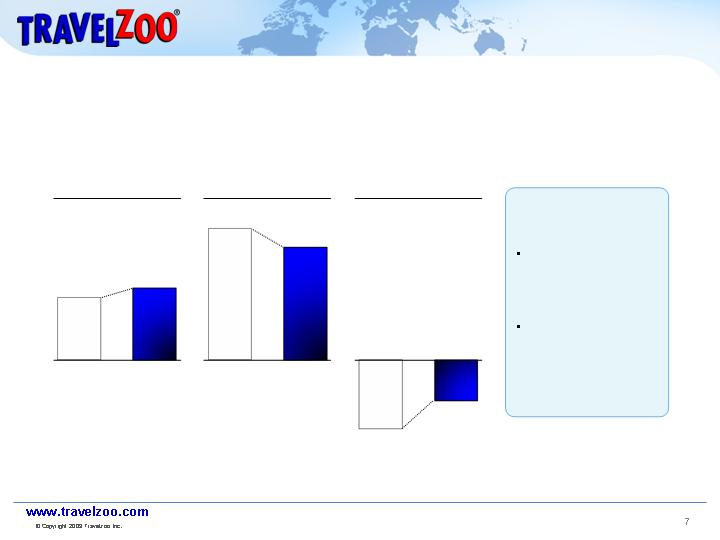
With the pending sale of our Asia Pacific assets, the business segment
is now being treated as discontinued operations.
2008
2009
Sale of Asia Pacific
assets expected to close
on October 31.
Asia Pacific business
segment treated as
discontinued operations
2008 EPS from
continuing operations:
$0.37, compared to
previously reported loss
of $(0.29) per share
EPS FROM CONTINUING OPERATIONS
$ per share
Q1
Q2
Q3
Q4
0.10
0.13
0.03
0.11
0.13
0.10
0.08
N/A
Q1
2008
2009
2009
2008
2009
2008
North America
$ millions
18.9
20.0
19.2
19.7
18.9
16.0
Europe
$ millions
Europe
(local currency)
£ millions
+6%
Year-over-year revenue growth accelerated in both North America and
Europe.
QUARTERLY REVENUES BY SEGMENT
2.0
3.0
2.6
4.0
4.8
2.6
1.0
2.1
1.3
2.6
2.9
1.4
Q2
Q3
+3%
+18%
+45%
+57%
+82%
+100%
+100%
+110%
Operating income increased in spite of significantly higher spending on
subscriber acquisition and the launch of Fly.com.
Increased investment
levels in Q3 2009:
Subscriber acquisition
up by
$1.3 million
versus Q3 2008
Launch of Fly.com
added over
$1.6 million
in expenses, com-pared
to Q3 2008
Q3
2008
Q3
2009
2.0
2.3
Q3
2008
Q3
2009
4.2
3.6
Q3
2008
Q3
2009
(1.3)
Q3 OPERATING INCOME – 2009 VS. 2008
$ millions
Total*
North America
Europe
(2.2)
* From continuing operations
The effective tax rate continues to be high, as we treat losses from
Europe as not having a recognizable tax benefit.
Q3 2009 INCOME AND TAX EXPENSES*
$ millions
0.3
2.6
-1.3
1.3
-1.3
3.6
Operating
income
North
America
Operating
income
Europe
Non-
operating
income**
Income
from con-
tinuing
operations
before
income
taxes
Income
taxes
Income
from con-
tinuing
operations,
net of tax
Effective
tax income
rate 50%
* From continuing operations
** Interest income and foreign currency gain
Cash management during Q3 2009 improved slightly versus last year
and the previous quarter.
Q2
2009
Q3
2009
49
48
DSO
(Days Sales Outstanding)
# of days
Q3
2008
Q2
2009
15.8
15.5
Cash Balance
at End of Quarter*
$ millions
DSO AND CASH BALANCES
Q3
2008
52
Q3
2009
15.7
* Includes cash and cash equivalents
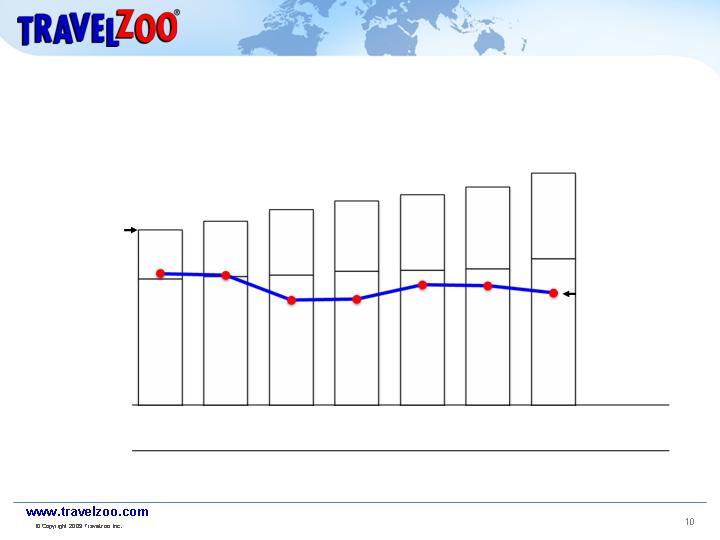
While headcount has increased, productivity has remained relatively
stable.
HEADCOUNT AND AVERAGE ANNUALIZED REVENUE PER EMPLOYEE*
Q1
2008
Q2
2008
Q3
2008
Q4
2008
Q1
2009
Q2
2009
Q3
2009
140
147
156
163
168
174
185
Europe
North America
39
44
52
56
60
65
68
101
103
104
107
108
109
117
Headcount
Average
annualized
revenues per
employee
(in $ thousands)
$598
$590
$477
$481
$547
$543
$510
* Continuing operations only

OPERATING EXPENSES – NORTH AMERICA DIVISION
$ millions and as percentage
of revenues
Q3
2008
Q3
2009
3.8
4.7
7.3
9.2
Sales &
Marketing
General &
Administrative
24%
46%
25%
49%
Operating expenses in North America increased, driven primarily by
increased spend on subscriber acquisition, SuperSearch, and Fly.com.
11.1
13.9
70%
74%
Major reasons for Y/Y increase
in operating expenses
Impact
Increased subscriber
acquisition
$0.6 million
Launch of Fly.com
$1.0 million
Increased marketing
for SuperSearch
$0.8 million

OPERATING EXPENSES – EUROPE DIVISION
$ millions and as percentage of revenues
Q3
2008
Q3
2009
1.7
1.7
3.1
4.3
Sales &
Marketing
General &
Administrative
66%
117%
35%
90%
In Europe, operating expenses as a percentage of revenues
declined in spite of increased spend on subscriber acquisition.
4.8
6.0
183%
125%
Major reasons for Y/Y increase
in operating expenses
Impact
Increased subscriber
acquisition
$0.8 million
Larger sales force
and production team
$0.4 million
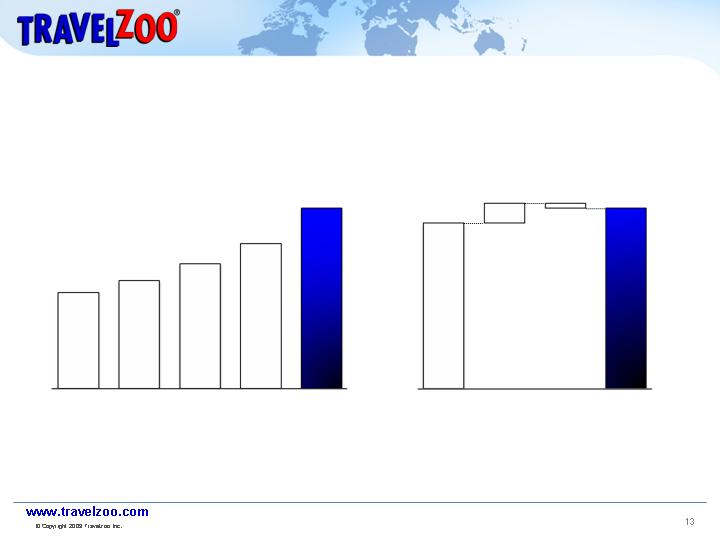
During Q3 2009 we further accelerated subscriber acquisition as we see
audience growth as investment into future revenues and profits.
Subscribers to Travelzoo publications
in North America & Europe
Millions
Quarter-over-quarter
comparison: Q3 09 vs. Q2 08
Millions
YE
2005
YE
2006
YE
2007
YE
2008
QE
Q3 2009
Total
sub-
scribers
at end of
Q2 2009
New
sub-
scribers
Sub-
scribers
removed
Total
sub-
scribers
at end of
Q3 2009
9.7
10.9
12.4
13.5
16.3
15.2
1.6
-0.5
16.3
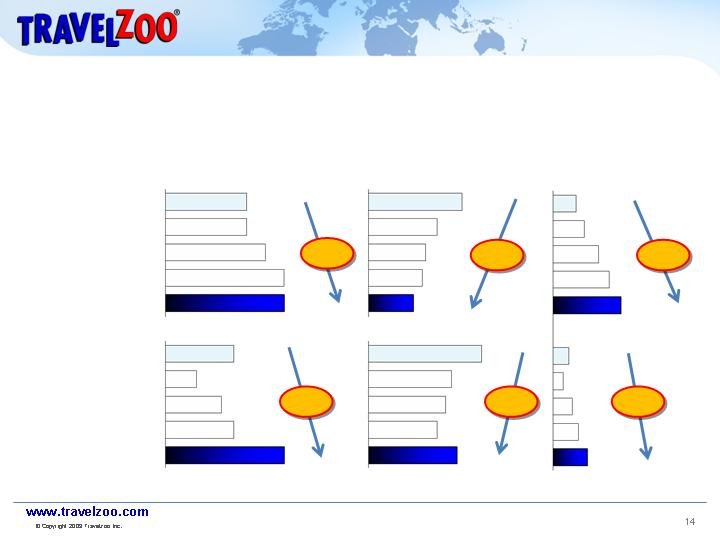
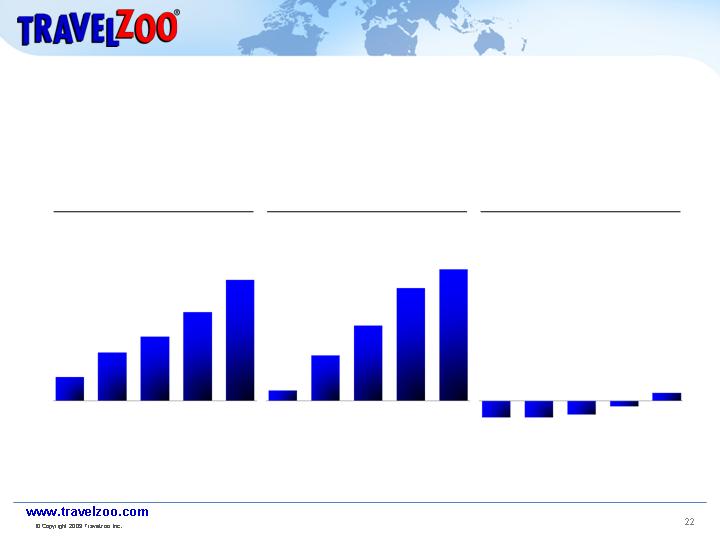
Improved execution and lower media prices helped us drive down
acquisition costs for new subscribers significantly year-over-year.
Q3 2008
North
America
Europe
Q4 2008
Q1 2009
Q2 2009
Q3 2009
Q4 2008
Q1 2009
Q2 2009
Q3 2009
Q3 2008
1.3
Subscriber
acquisition expense
$ millions
1.3
1.6
1.9
1.9
1.1
0.5
0.9
1.9
1.1
3.73
Acquisition cost
per subscriber
$/subscriber
2.75
2.29
2.15
1.80
4.52
3.32
3.09
3.53
2.74
361
New subscribers
added
Thousands
488
720
885
1,076
254
160
297
542
408
+44%
-52%
+199%
+67%
-22%
+114%
Note: In Q3 2009 subscriber acquisition in Europe had an increased focus on Germany, where acquisition costs are higher.


International Expansion
Multiply the Travelzoo business in attractive international
markets; build global brand and global content
Expand scope of Travelzoo® business
Expand Travelzoo product offerings and content into
entertainment (e.g., Broadway shows, sports events)
Fly.com
Meta-search identified as opportunity with attractive
economics and great synergies with Travelzoo business
TRAVELZOO’S GROWTH STRATEGY
Our growth strategy is built on three pillars that include both
geographical and product expansion.
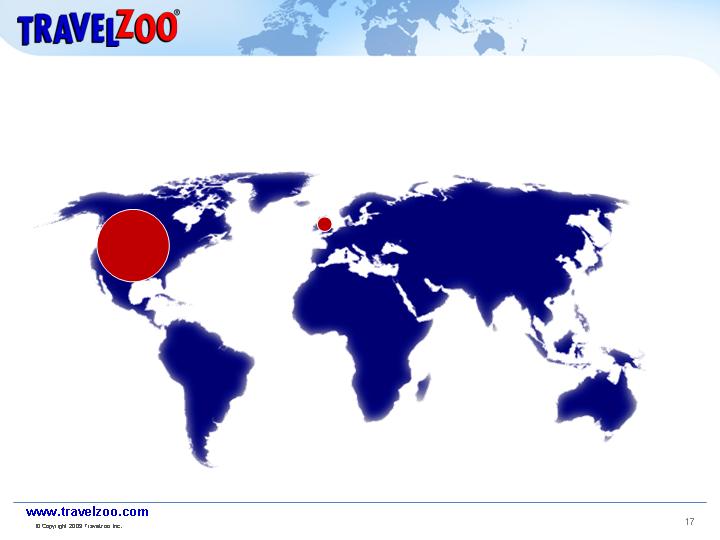
In 2005, Travelzoo’s subscriber base resided almost exclusively in the U.S.
We just started growing internationally.
TRAVELZOO SUBSCRIBERS BY COUNTRY AT END OF 2005
Millions
U.K.
0.3
Worldwide:
9.7 million subscribers
U.S.
9.4
Germany
0.4
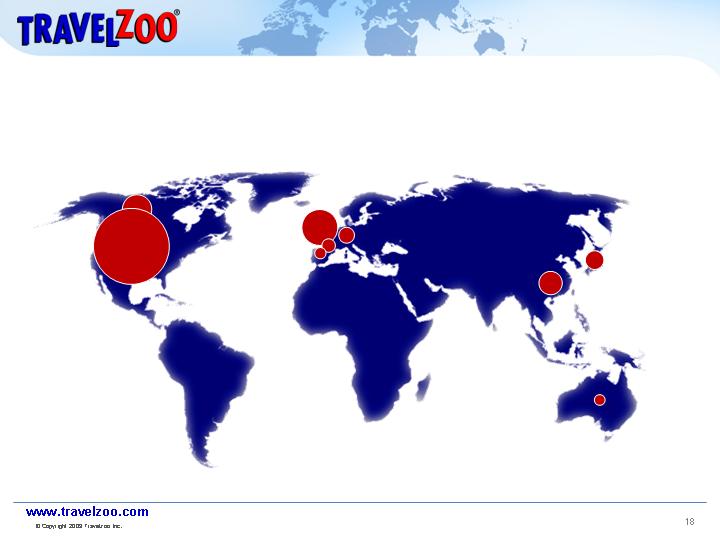
From 2005 through 2008, we expanded primarily in Europe and launched
operations in Asia Pacific.
TRAVELZOO SUBSCRIBERS BY COUNTRY AT END OF 2008
Millions
Canada
0.9
U.K.
1.1
Spain
0.1
France
0.6
Greater
China*
0.7
Japan
0.3
Australia
0.1
U.S.
10.4
U.S.
10.4
* Includes Hong Kong, China, and Taiwan
Worldwide:
14.6 million subscribers
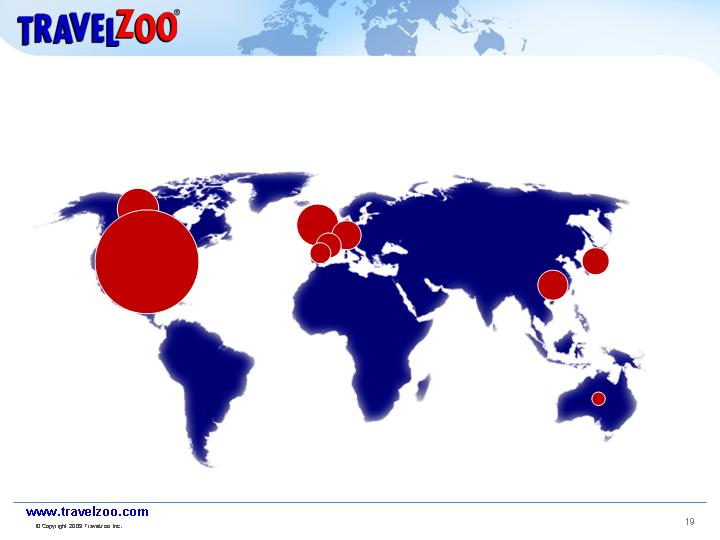
During 2009, we have begun re-igniting growth in North America, and
accelerated our expansion in Europe.
TRAVELZOO SUBSCRIBERS BY COUNTRY (AS OF Q3 2009)
Millions
Canada
1.1
U.K.
1.5
Germany
0.7
Spain
0.4
France
0.8
Greater
China*
0.9
Japan
0.6
Australia
0.3
U.S.
12.0
* Includes Hong Kong, Mainland China, and Taiwan
Worldwide:
18.2 million subscribers
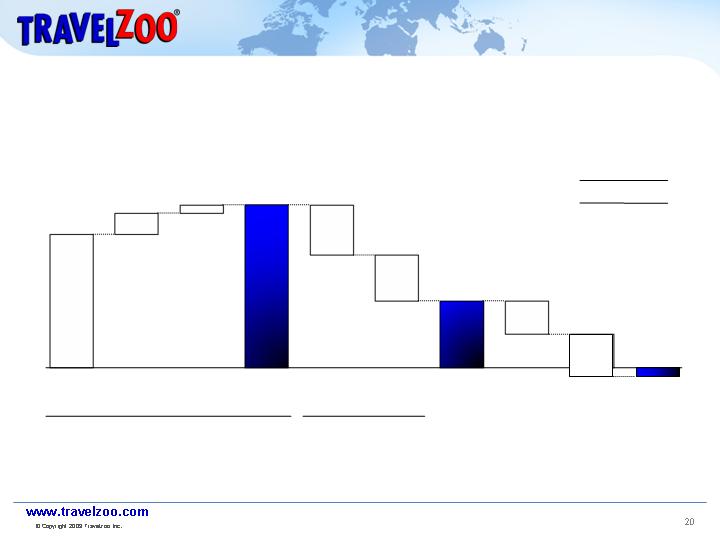
The international expansion comes at a cost: Subscriber acquisition as
well as losses that have no immediate tax benefit, are dragging EPS down.
OPERATING INCOME AND NET INCOME ON PER-SHARE BASIS
$ per share
0.39
(0.12)
(0.11)
0.16
0.03
0.34
0.02
(0.08)
-0.02
(0.10)
Europe
Interest &
FX gains
Europe
Taxes
Loss from
discon-
tinued
operations
EPS
net loss
per share
Operating income
excluding subscriber acquisition
Subscriber acquisition
expenses
Q3 2009 EXAMPLE
North
America
North
America
Operating
income
before
taxes

As a result of our aggressive global expansion, EPS is impacted by
increased investments in subscriber acquisition.
EARNINGS FROM CONTINUING OPERATIONS,
INCLUDING AND EXCLUDING SUBSCRIBER ACQUISITION
Q3 2008
Q4 2008
Q1 2009
Q2 2009
Q3 2009
Operating income excluding
subscriber acquisition expense
$0.27
$0.27
$0.44
$0.38
$0.37
- Subscriber acquisition expense
$0.15
$0.12
$0.16
$0.18
$0.23
Operating income
$0.12
$0.15
$0.28
$0.20
$0.14
+ Currency gain and interest income
-
$0.03
($0.01)
-
$0.02
Income taxes
($0.09)
($0.07)
($0.14)
($0.10)
($0.08)
Income from continuing operations,
net of tax
$0.03
$0.11
$0.13
$0.10
$0.08
Over time, audience and revenue growth appear to drive profitability.
U.K. EXAMPLE: SUBSCRIBERS, REVENUES AND OPERATING
INCOME/LOSS
Millions, and £ millions
0.3
Subscribers at Year-End*
0.6
0.8
1.1
1.5*
0.4
1.7
2.8
4.2
4.9**
(0.6)
(0.6)
(0.5)
(0.2)
0.3**
Revenues
Operating income/loss
2005
2006
2007
2008
2009*
2005
2006
2007
2008
2009**
2005
2006
2007
2008
2009**
* Subscribers at end of Q3 2009
** Q1 through Q3 only

In our international markets revenues are growing faster than expenses,
bringing us closer to our goal of profitability in each country.
COMPARISON OF REVENUE GROWTH, EXPENSES AND
OPERATING MARGINS BY COUNTRY
Percent*
U.K.
Canada
Germany
France
Spain
Year launched
2005
2006
2006
2007
2008
Revenue growth*
Q3 2009 over Q3 2008
40%
86%
240%
228%
> 1000%
Growth in expenses*
Q3 2009 over Q3 2008
25%
(8%)
33%
13%
24%
Operating margin
Q3 2007
(10%)
(22%)
> (1,000%)
n/a
n/a
Q3 2008
(6%)
(25%)
(330%)
(371%)
n/a
Q3 2009
5%
38%
(69%)
(62%)
(256%)
* Growth rates calculated based on revenues and expenses in US-dollars

Close sale of Asia Pacific assets
(Keeping option to purchase back Asia Pacific
business in the future)
Continue to grow audience in Europe, while moving
operations closer to positive income/contribution
Monetize the increased audience in North America
Aggressively sell global audience; produce global
content
Continue expansion into entertainment
Grow Fly.com audience and revenues
MANAGEMENT FOCUS Q4 2009 AND 2010