Attached files
| file | filename |
|---|---|
| 8-K - CURRENT REPORT - INTERNATIONAL PAPER CO /NEW/ | d8k.htm |
| EX-99.1 - PRESS RELEASE OF INTERNATIONAL PAPER COMPANY - INTERNATIONAL PAPER CO /NEW/ | dex991.htm |
 Third Quarter 2009 Review October 28, 2009 Third Quarter 2009 Review October 28, 2009 John V. Faraci Chairman & Chief Executive Officer Tim S. Nicholls Senior Vice President & Chief Financial Officer Exhibit 99.2 |
 2
Forward-Looking Statements Forward-Looking Statements These slides and statements made during this presentation contain forward-looking
statements. These statements reflect management's current views and are
subject to risks and uncertainties that could cause actual results to differ
materially from those expressed or implied in these statements. Factors which could cause actual results to differ relate to: (i) increases in interest rates; (ii) industry conditions, including but not
limited to changes in the cost or availability of raw materials, energy and
transportation costs, competition we face, cyclicality and changes in
consumer preferences, demand and pricing for its products; (iii) global
economic conditions and political changes, including but not limited to the
impairment of financial institutions, changes in currency exchange rates, credit ratings issued by recognized credit rating organizations, the amount of our future pension
funding obligation, changes in tax laws and pension and health care costs;
(iv) unanticipated expenditures related to the cost of compliance with
environmental and other governmental regulations and to actual or potential
litigation; and (v) whether we experience a material disruption at one of
our manufacturing facilities and risks inherent in conducting business through a joint venture. We undertake no obligation to publicly update any
forward-looking statements, whether as a result of new information,
future events or otherwise. These and other factors that could cause or
contribute to actual results differing materially from such forward looking
statements are discussed in greater detail in the company's Securities and Exchange Commission filings. |
 3
Statements Relating to Non-GAAP Financial Measures Statements Relating to Non-GAAP Financial Measures During the course of this presentation, certain non-U.S. GAAP financial information will be presented. A reconciliation of those numbers to U.S. GAAP financial measures is available on the company’s website at internationalpaper.com under Investors. |
 4
Third Quarter 2009 Solid Results Third Quarter 2009 Solid Results Stabilized Volumes Continued Margin Expansion $1.3 Billion in Free Cash Flow* $1.3 Billion Debt Reduction Earnings from continuing operations before special items • * Cash provided by continuing operations less capital expenditures, including alternative fuel mixture credits |
 5
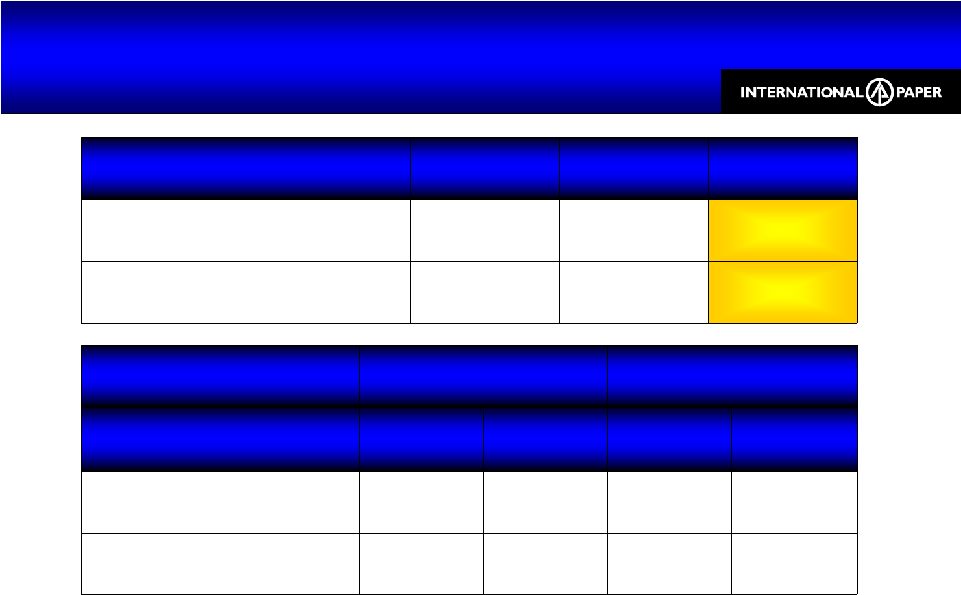
3Q09 Financial Snapshot 3Q09 Financial Snapshot • Earnings from continuing operations before special items • * Cash provided by continuing operations less capital expenditures, excluding alternative
fuel credits of $0.7B in 2Q09 and $0.5B in 3Q09 and cash received under European accounts receivable securitization • of $0.2B in 3Q09 $ Billion 3Q08 2Q09 3Q09 Sales $6.8 $5.8 $5.9 EBITDA $1.0 $0.7 $0.8 Free Cash Flow $0.7 $0.6* $0.6* Debt $12.7 $10.9 $9.6 Cash Balance $0.8 $1.7 $1.7 |
 6
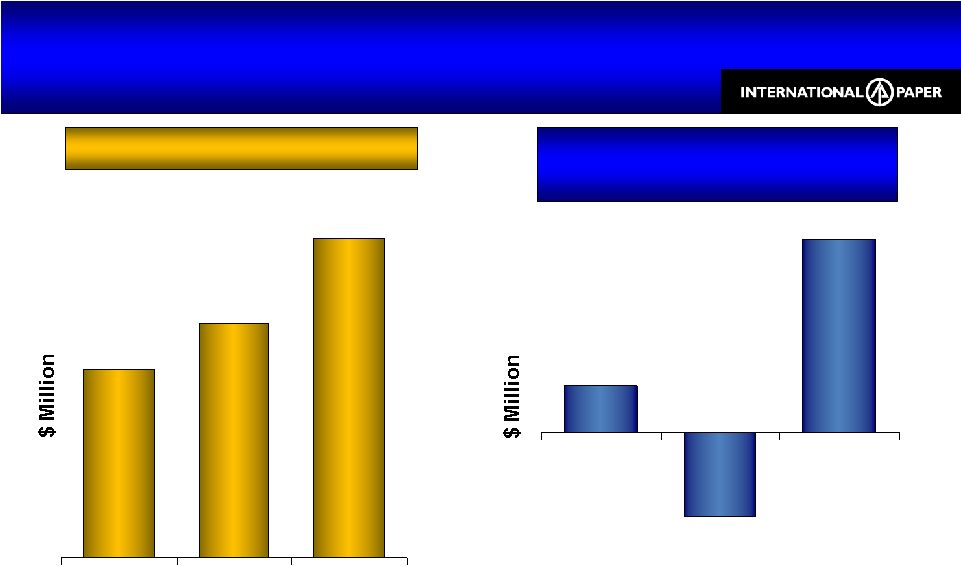
Overcoming Economic Challenges EBITDA Margin Expansion in Difficult Markets Overcoming Economic Challenges EBITDA Margin Expansion in Difficult Markets Operating profit before special items Excludes Forest Products earnings EBITDA Margins EBITDA Margins exc. xpedx |
 7
Free Cash Flow Free Cash Flow $ Million 3Q08 2Q09 3Q09 Cash from Operations $946 $707 $713* Alternative Fuel Mixture Tax Credits - $688 $463 Cash Provided by Continuing Operations $946 $1,395 $1,381 Less Capital Investment ($250) ($131) ($108) Free Cash Flow $696 $1,264 $1,273 * Excludes $205MM cash received under European accounts receivable securitization
|
 8
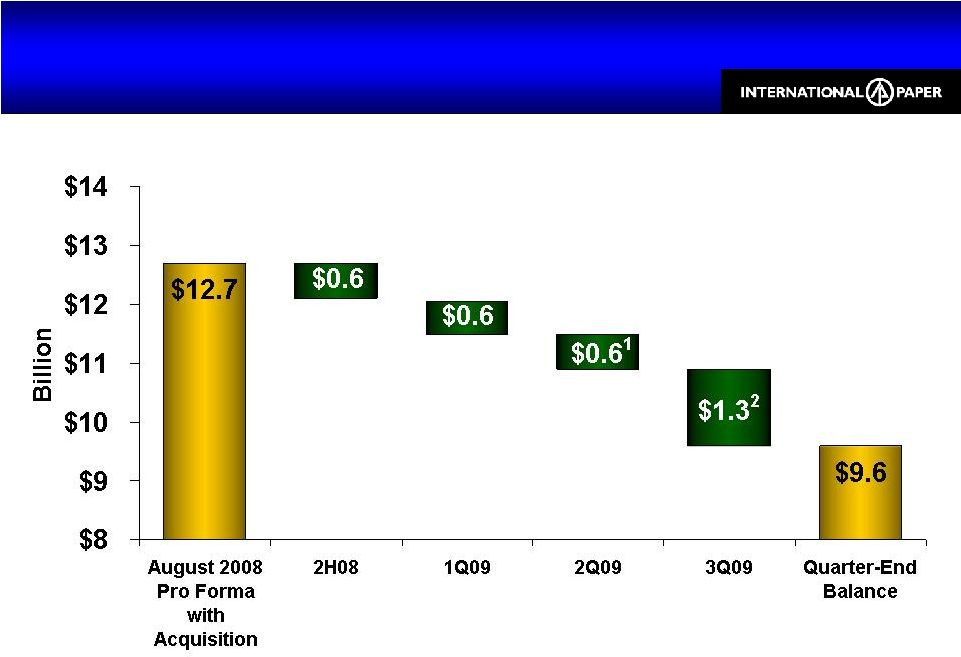
Debt Reduction Progress $3.1 Billion Reduction since Acquisition Debt Reduction Progress $3.1 Billion Reduction since Acquisition 1 Excludes the debt repayment of $1B from the proceeds of our May bond issuance: $1B 9.375% notes due 2019 2 Excludes the debt repayment of $1B from the proceeds of our August bond issuance: $1B
7.5% notes due 2021 |
 9
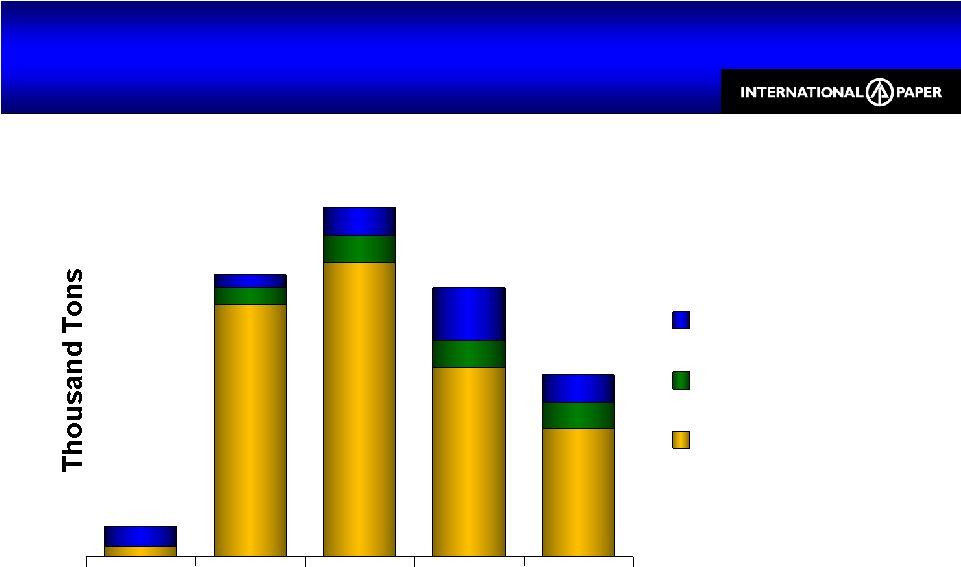
1,056 676 459 97 97 97 100 192 97 903 35 60 72 50 3Q08 4Q08 1Q09 2Q09 3Q09 Maintenance Valliant #3 LOO Lack-of-Order N.A. Lack of Order & Maintenance Downtime 15% of Capacity in 3Q, Down from 29% Peak in 1Q
N.A. Lack of Order & Maintenance Downtime 15% of Capacity in 3Q, Down from 29% Peak in 1Q
Lack-of-order & maintenance downtime for North American
Containerboard, Uncoated Papers, Market Pulp, & Coated Paperboard. See Appendix slide 33 for detail by business. 2009 LOO downtime excludes capacity from mills or machines that have been permanently shutdown (Franklin #3 - 32,000 tons and Louisiana mill -120,000 tons) as of September 30, 2009 107 1,013 1,253 965 653 |
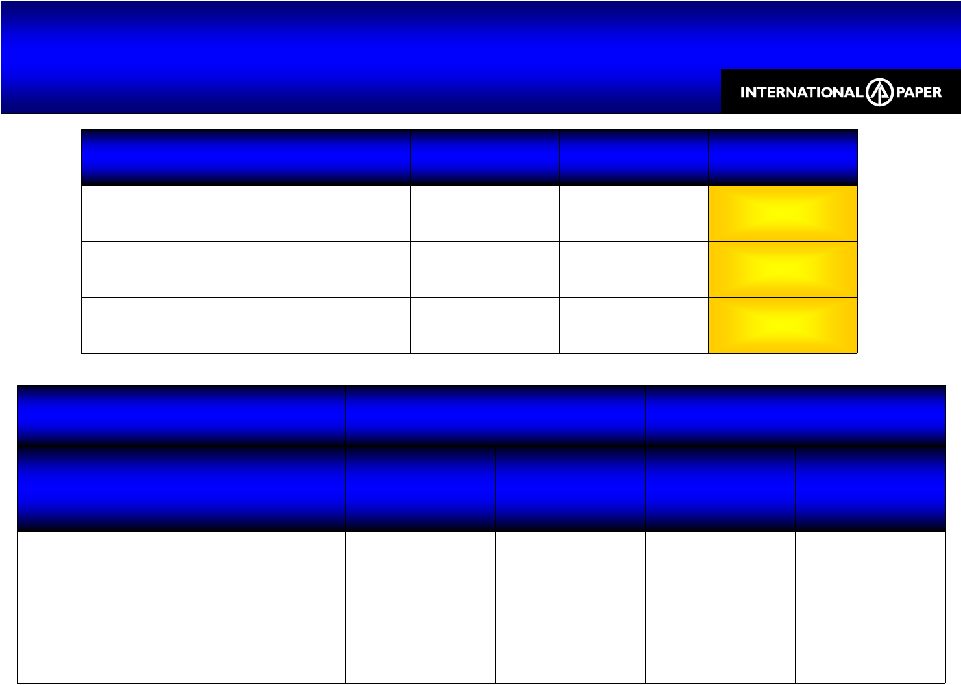
 10 Capacity Management Summary Adjusting Mill Capacity to Meet our Customers’ Needs Capacity Management Summary Adjusting Mill Capacity to Meet our Customers’ Needs Mill Products Annual Capacity (Tons) Number of Machines % of IP Capacity Estimated Closure Franklin, VA Uncoated Freesheet 600,000 1 3 19% Spring 2010 Coated Paperboard 140,000 1 7% By 2009 Year-End Albany, OR Containerboard 580,000 2 12% Mid- December Pineville, LA Containerboard 390,000 1 Valliant, OK Containerboard 430,000 2 1 • 1 Does not include 150,000-ton capacity of #3 machine previously closed in November
2008 • 2 Capacity of #3 machine previously indefinitely idled in November 2008
|
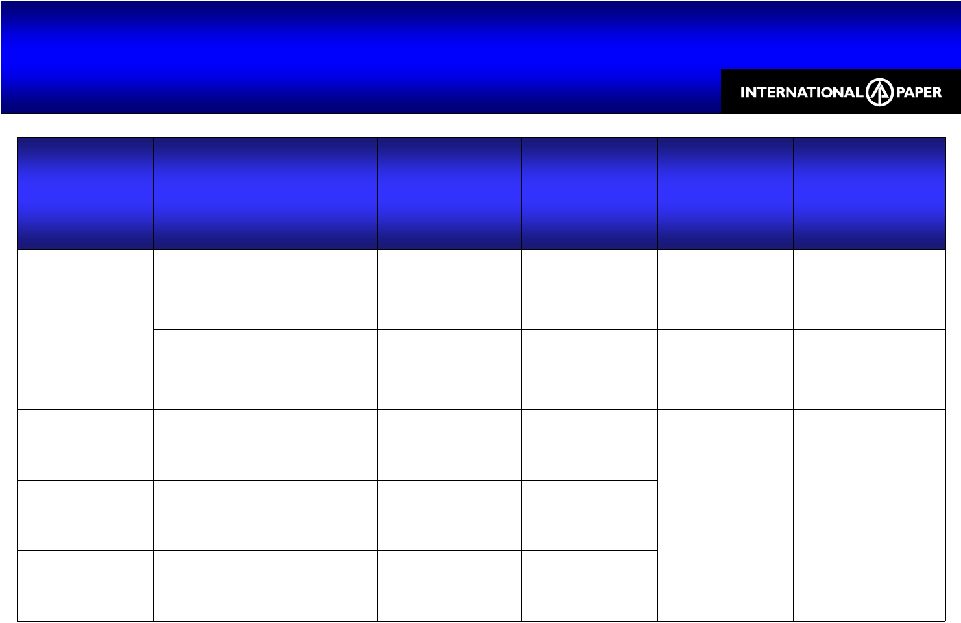
 11 80 58 66 (8) WY PKG (4) (24) 0 15 30 45 60 75 90 2005 Headcount* Divestments & Acquisitions Headcount Reduction June 2008 Headcount Reduction September 2009 Aggressive Restructuring & Cost Reduction 28% Headcount Reduction Aggressive Restructuring & Cost Reduction 28% Headcount Reduction * At January 1, 2005 Excludes Ilim joint venture employees |
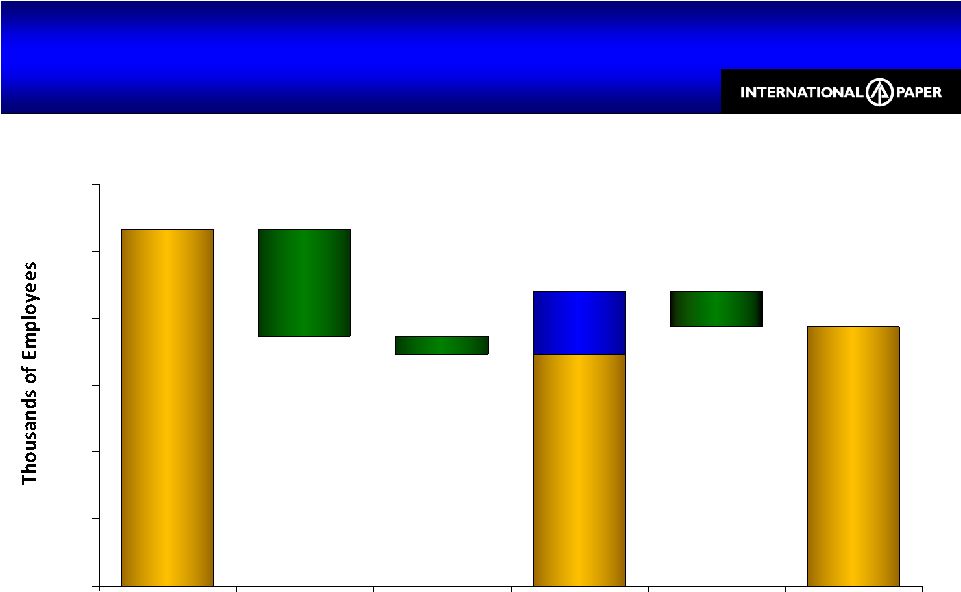
 12 .20 .37 .09 .03 .03 .11 .02 .07 (.12) (.06) $0.00 $0.05 $0.10 $0.15 $0.20 $0.25 $0.30 $0.35 $0.40 2Q09 Volume/ LOO Price Input Costs Operations/ Costs Mix Maintenance Outages Tax Ilim JV 3Q09 Earnings before special items. 3Q09 vs. 2Q09 EPS Volumes Improved, Strong Cost Management,
Ilim Recovery 3Q09 vs. 2Q09 EPS Volumes Improved, Strong Cost Management,
Ilim Recovery |
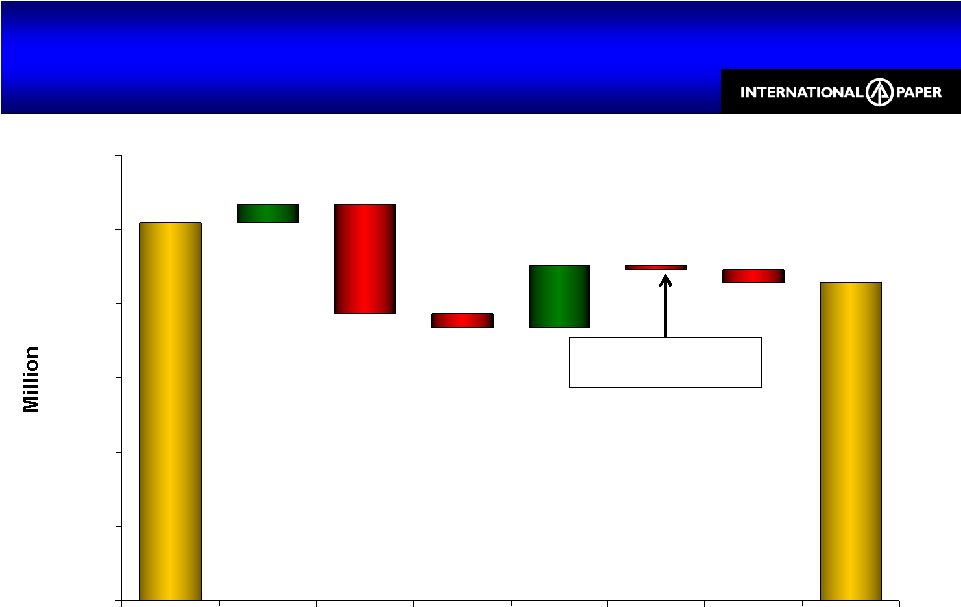 13 255 214 12 42 (74) (9) (3) (9) $0 $50 $100 $150 $200 $250 $300 2Q09 Volume/ LOO Price Input Costs Maintenance Outages Operations/ Costs Mix 3Q09 Industrial Packaging Earnings 3Q09 vs. 2Q09 Industrial Packaging Earnings 3Q09 vs. 2Q09 Includes ($7MM) cost of fire at Savannah Mill Earnings before special items |
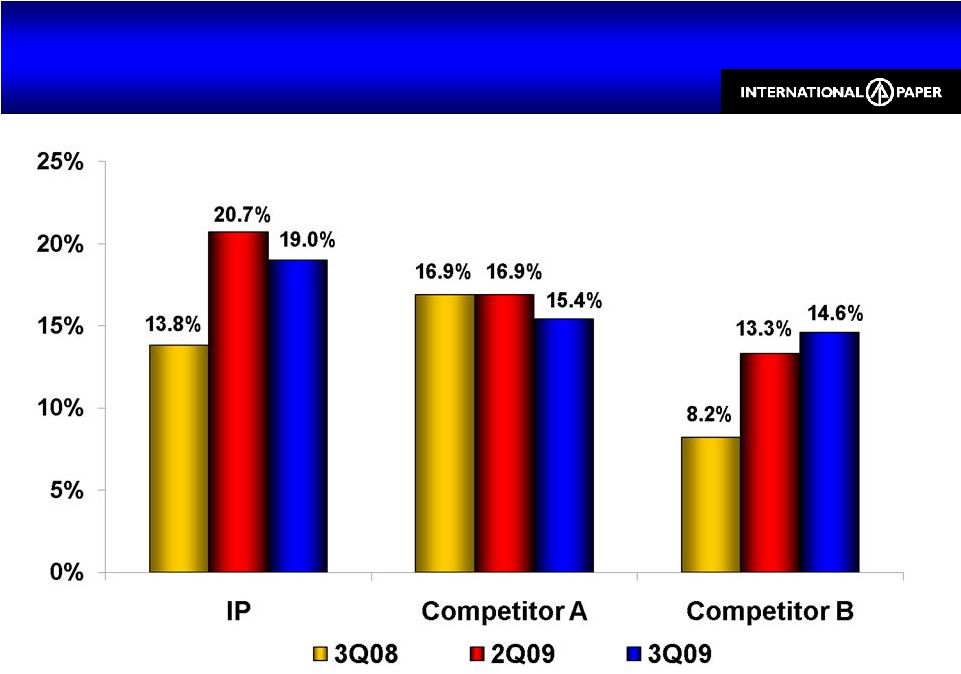 14 N.A. Industrial Packaging Relative EBITDA Margins Outperforming Competitors in
2009 N.A. Industrial Packaging Relative EBITDA Margins Outperforming Competitors in 2009 IP EBITDA margins based on North American Industrial Packaging operating profit before
special items Competitor EBITDA margin estimates obtained from public filings and IP analysis |
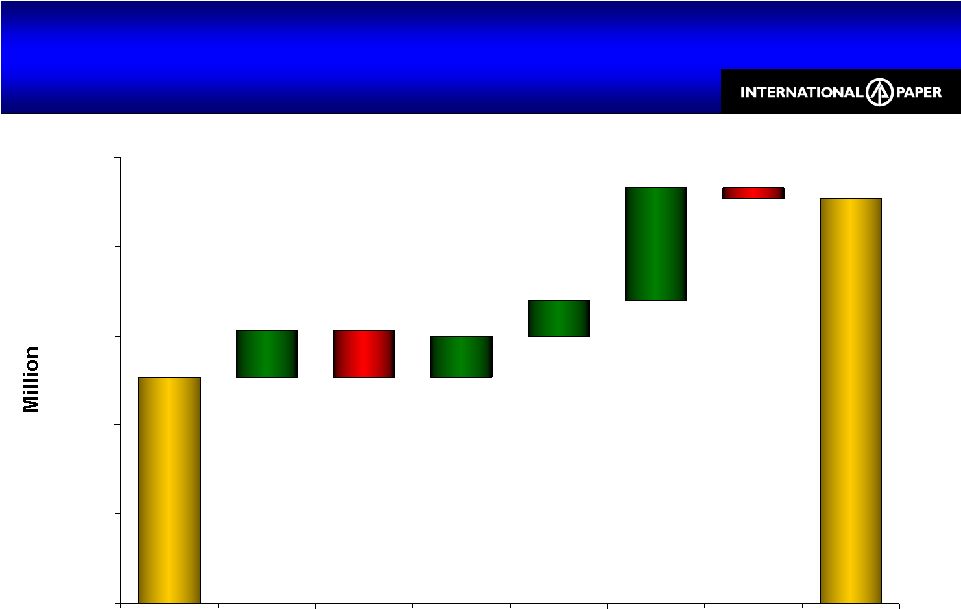
 15 86 138 27 3 19 22 6 4 (29) $0 $25 $50 $75 $100 $125 $150 $175 2Q09 Volume/ LOO Price Input Costs Operations/ Costs Maintenance Outages Mix Other 3Q09 Printing Papers Earnings 3Q09 vs. 2Q09 Printing Papers Earnings 3Q09 vs. 2Q09 Earnings Before Special Items |
 16 86 138 31 12 13 (4) $0 $25 $50 $75 $100 $125 $150 2Q09 NA Paper NA Pulp Europe Brazil 3Q09 Printing Papers Earnings 3Q09 vs. 2Q09 Printing Papers Earnings 3Q09 vs. 2Q09 Earnings Before Special Items |
 17 38 68 8 7 6 19 (8) (2) $0 $15 $30 $45 $60 $75 2Q09 Volume/ LOO Price Input Costs Operations/ Costs Maintenance Outages Mix 3Q09 Consumer Packaging Earnings 3Q09 vs. 2Q09 Consumer Packaging Earnings 3Q09 vs. 2Q09 Earnings before special items |
 18 $ Million 3Q08 2Q09 3Q09 Sales $2,075 $1,595 $1,665 Earnings $35 $10 $21 xpedx 3Q09 vs. 2Q09 xpedx 3Q09 vs. 2Q09 Sales revenue up 5% vs. 2Q09 Cost savings driving the bottom line Volume improvements in all segments Printing, Packaging & Facility Supplies Winning new business in National Accounts |
 19 $ Million 3Q08 2Q09 3Q09 Sales (100%) $530 $290 $305 Earnings (IP Share) $5 ($30) $0 Ilim’s results are reported on a one-quarter lag IP’s shares of Ilim’s 3Q08, 2Q09 & 3Q09 earnings includes after-tax
foreign exchange losses of $3 million and $22 million, and an after-tax
foreign exchange gain of $10 million, respectively Ilim Joint Venture Ilim Joint Venture 3Q09 vs. 2Q09 3Q09 vs. 3Q08 Business Volume Price / Ton Volume Price / Ton Pulp 3% $5 (4%) ($304) Containerboard 7% ($26) 6% ($222) |
 20 IP Asia – Building Breadth & Scale Surpassed $1 Billion Revenue Run Rate IP Asia – Building Breadth & Scale Surpassed $1 Billion Revenue Run Rate Consumer Packaging - Sun Joint Venture • 3 machines with 900,000 tons capacity • #1 in coated paperboard Shorewood & Foodservice • 4 facilities Industrial Packaging • 12 corrugated plants Printing & Communications Papers • UFS sales revenue up 50% over 2Q Distribution • Sales volume up 50% over 2Q Corrugator Plant Sheet Plant Shorewood/ foodservice plant IP-Sun JV China India Korea Thai Indonesia Beijing Chengdu Guangzhou Shenyang Chongqing Shanghai Tianjin Dongguan Yanzhou Dalian Wuxi Guangzhou Foshan Sacheon International Paper’s Asian results are reported in the Industrial Packaging,
Consumer Packaging and Printing Papers segments |
 21 IP Asia Strong Growth IP Asia Strong Growth International Paper’s Asian results are reported in the Industrial Packaging,
Consumer Packaging and Printing Papers segments. $680 $845 $1,150 2007 2008 3Q09 Run-Rate $15 $62 ($27) 2007 2008 3Q09 Run-Rate Sales Change in Earnings Contribution to IP |
 22 $ Million 3Q08 2Q09 3Q09 Sales $255 $215 $275 Earnings $58 $23 $36 EBITDA Margin 35% 24% 25% IP Brazil results are reported in the Printing Papers segment IP Brazil IP Brazil 3Q09 vs. 2Q09 3Q09 vs. 3Q08 Business Volume (000 Metric Tons) Price / Ton Volume (000 Metric Tons) Price / Ton Uncoated Freesheet 21% ($37) 31% ($110) Domestic 16% ($25) 2% $16 Export 25% ($48) 69% ($211) |
 23 Third Quarter Summary Solid Results Despite Recession Third Quarter Summary Solid Results Despite Recession Stabilized Volumes Margin Expansion Strong Free Cash Flow Accelerated Debt Reduction |
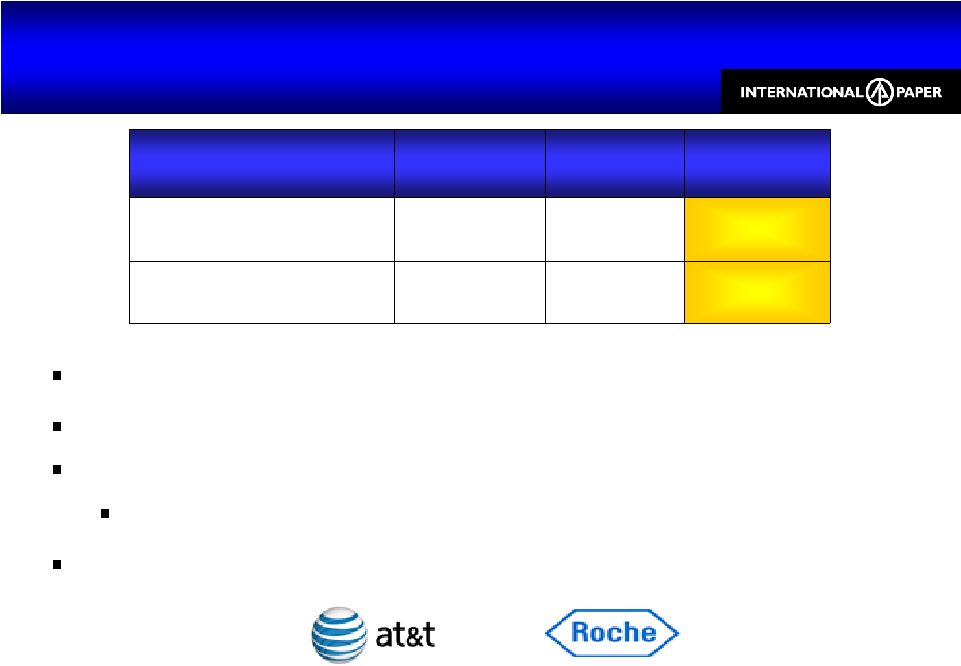
 24 Biomass Crop Assistance Program &
Cellulosic Ethanol Tax Credits Biomass Crop Assistance Program &
Cellulosic Ethanol Tax Credits Biomass Crop Assistance Program • Investigating the program • Need final, written regulations to understand • Believe that the definition of biomass should be narrowly defined to ensure level playing field for paper industry • Encourage implementation of Phase II to increase biomass supply Cellulosic Ethanol Tax Credits • We believe that pulp & paper producers do not qualify |
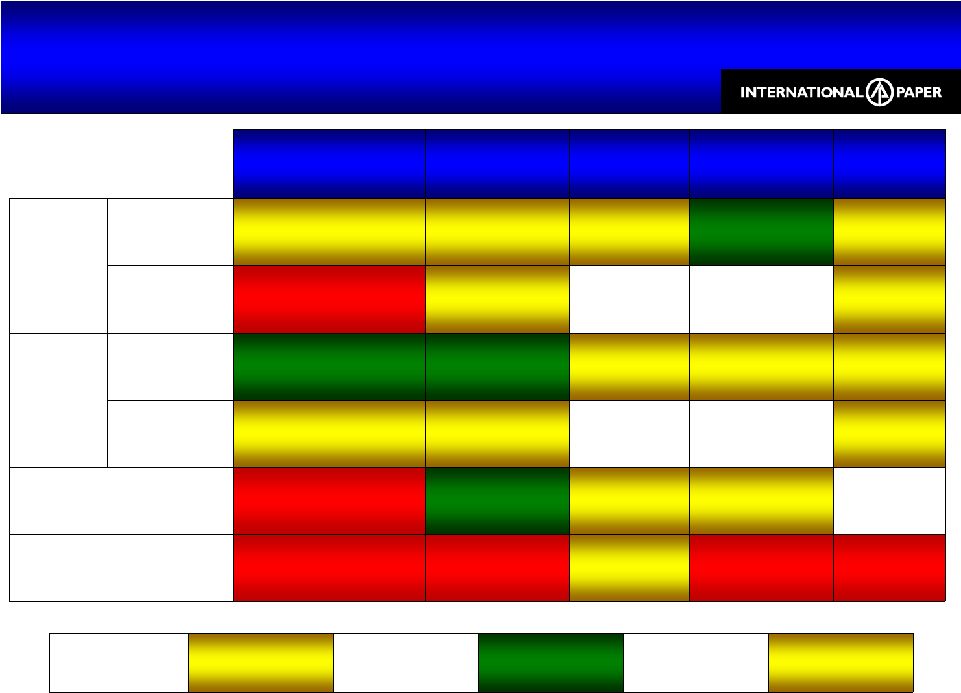 25 Fourth Quarter Outlook Changes from 3Q09 Fourth Quarter Outlook Changes from 3Q09 North America Europe Brazil Russia - Svetogorsk Asia Volume Paper Seasonally Soft Stable Seasonal Increase Increasing Stable Packaging Seasonal Decrease Seasonal Increase Stable Pricing Paper Pulp Increasing, Paper Stable Improving Stable Stable Stable Packaging Box Pricing Margin Pressure Stable Maintenance Outages $31MM Unfavorable $10MM Favorable Flat Flat Input & Freight Costs Increasing Increasing Flat Increasing Pulp Up xpedx Stable Ilim Joint Venture Improving Forest Products Flat |
 26 Priorities Priorities Realize Restructuring & Cost Reduction Benefits Match our Supply to our Customers’ Needs Optimize Industrial Packaging Business Continue Debt Reduction |
 27 Appendix Investor Relations Contacts Thomas A. Cleves 901-419-7566 Emily Nix 901-419-4987 Media Contact Kathleen Bark 901-419-4333 |
 28 Special Items Net of Taxes 3Q09 Special Items Net of Taxes 3Q09 $ Million EPS Earnings Before Special Items $157 $0.37 Special Items Net of Taxes: Alternative Fuel Mixture Credits $320 Debt Extinguishment Costs ($63) Overhead Reduction Initiative ($24) Integration Costs ($11) Other Previously Announced Closures* ($8) Total Special Items Net of Taxes $214 $0.50 Net Earnings $371 $0.87 * Does not include closures announced on October 22, 2009 |
 29 $ Billion 2007 1 2008 2009 Estimate Capital Spending $1.3 $1.0 $0.6 Depreciation & Amortization $1.1 $1.3 $1.5 3 Net Interest Expense $0.3 $0.5 $0.7 Corporate Items 2 $0.2 $0.1 $0.2 Effective Tax Rate 2 30% 31.5% 30-32% 1 Excludes discontinued operations 2 Before special items and excluding Ilim 3 Estimated depreciation impacted by extensive lack-of-order downtime Key Financial Statistics Key Financial Statistics |
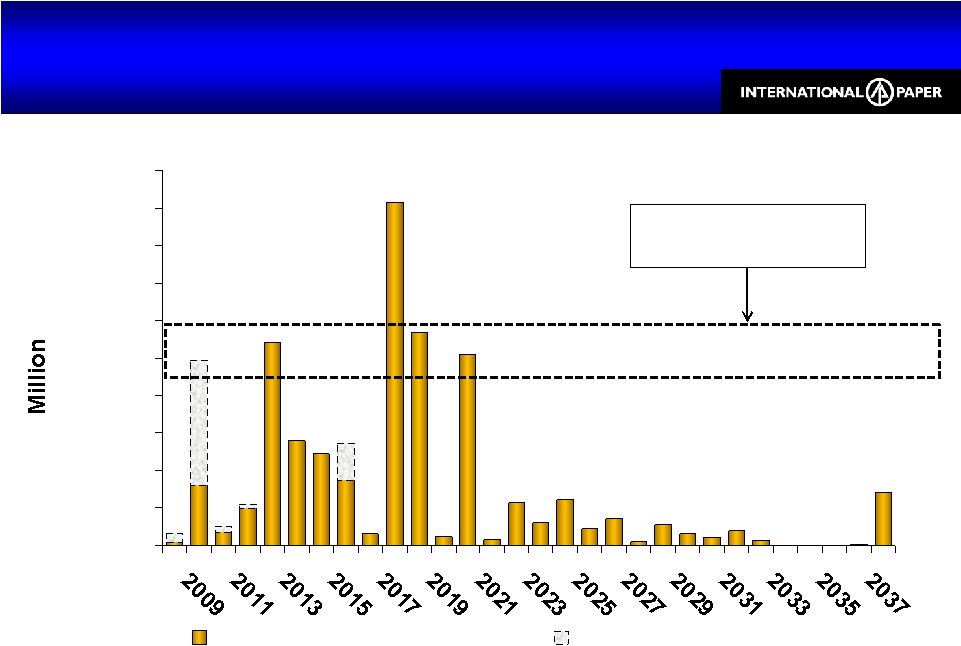 30 $0 $200 $400 $600 $800 $1,000 $1,200 $1,400 $1,600 $1,800 $2,000 Debt Maturities Monetization & Other Monetization & Other: Intend to rollover or refinance timber monetization debt, Sun
JV debt and other foreign subsidiary debt Preferred Annual Debt Ceiling Debt Maturity Profile Maturities as of Quarter-End Debt Maturity Profile Maturities as of Quarter-End |
 31 Cash & Committed Facilities $4.2 Billion Cash & Committed Facilities $4.2 Billion $ Billion Maturity Facility Cost Quarter-End Cash - $1.7 - $1.0B 1 Accounts Receivables Program JAN 2010 Zero Drawn CP Rate 2 + 150 bps $1.5B Corporate Revolver MAR 2011 Zero Drawn LIBOR + 50 to 60 bps Total Cash & Committed Facilities $4.2 - Cost includes commitment fees 1 $942 million available at quarter-end based on eligible receivable balances
2 Conduit’s rate |
 32 Debt Covenants & Credit Ratings
Debt Covenants & Credit Ratings Covenant As of 9/30 Maximum Debt-to-Total Capital 60% 44.7% Minimum Consolidated Net Worth $9B $11.9B Rating Outlook Standard & Poor’s BBB Negative Moody’s Baa3 Negative |
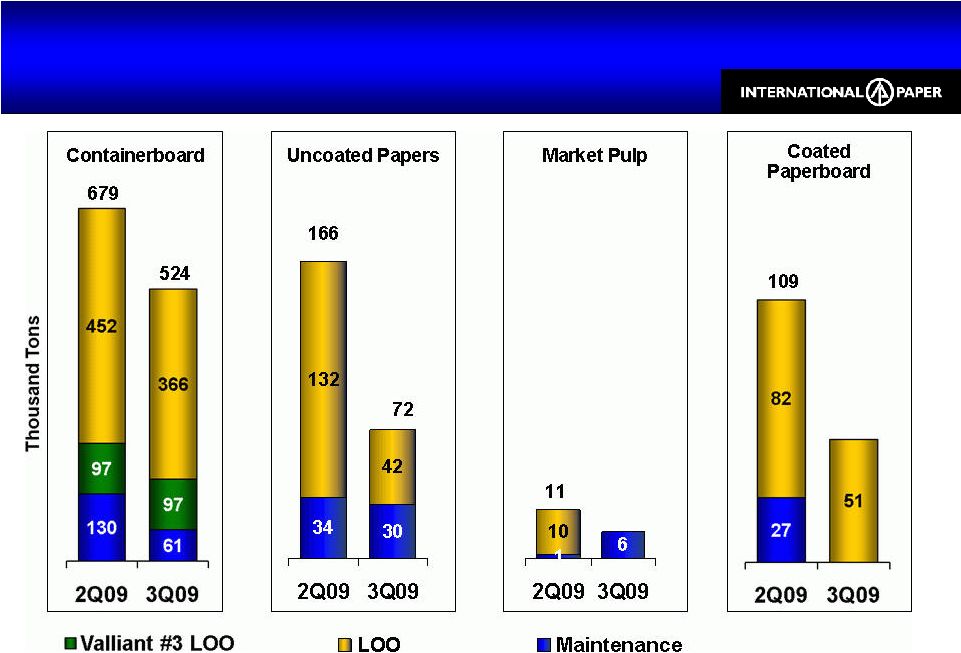 33 N.A. Lack of Order & Maintenance Downtime 15% of Capacity in 3Q, Improved from 22% in 2Q N.A. Lack of Order & Maintenance
Downtime 15% of Capacity in 3Q, Improved from 22% in 2Q LOO downtime excludes capacity from mills or machines that have been permanently shutdown (Franklin #3 - 32,000 tons and Louisiana mill - 120,000 tons) as of September 30, 2009 |
 34 $ Millions 1Q09 2Q09 3Q09 4Q09E Industrial Packaging $44 $46 $4 $26 North America 19 33 34 25 Europe 7 19 10 0 Brazil 5 0 2 0 Printing Papers Total $31 $52 $46 $25 Consumer Packaging $4 $20 $1 $19 Total Impact $79 $118 $51 $70 Dollar impact of planned maintenance outages are estimates and subject to change
Maintenance Outages Expenses Maintenance Outages Expenses
|
 35 Forest Products 3Q09 vs. 2Q09 Forest Products 3Q09 vs. 2Q09 3Q08 2Q09 3Q09 Sales ($ Million) $55* $10 $5 Earnings ($ Million) $305 $3 $2 Acres Sold 33,000 2,900 3,200 Price / Acre $1,564 $2,649 $1,994 The pending sale of 143,000 acres not expected to close in 4Q09. Interested parties are continuing their due diligence efforts and we will have a better view on this transaction later in 4Q09. * Mineral rights sale is not reflected in sales but in Other Income
|
 36 3Q09 vs. 2Q09 3Q09 vs. 3Q08 Business Volume Price / Ton Volume Price / Ton N.A. Container (2%) ($33) (15%) * ($15) * European Container (6%) (€14) (4%) (€92) Industrial Packaging Industrial Packaging * Estimate based on IP legacy plus WY PKG history |
 37 Average IP price realization (includes the impact of mix across all grades) 3Q09 vs. 2Q09 3Q09 vs. 3Q08 Business Volume Price / Ton Volume Price / Ton N.A. Paper 8% ($24) * (13%) ($79) N.A. Pulp 15% $2 (8%) ($131) European Paper (8%) (€18) (14%) (€101) Printing Papers Printing Papers * The average selling price for 20# cut-size remained flat during the third
quarter |
 38 Average IP price realization (includes the impact of mix across all grades) 3Q09 vs. 2Q09 3Q09 vs. 3Q08 Volume Price/Ton Volume Price/Ton U.S. Coated Paperboard 2% ($23) (19%) $31 Revenue Price Revenue Price Converting Businesses 0% NA (9%) NA Consumer Packaging Consumer Packaging |
 39 Special Items Special Items Special Items Pre-Tax: 3Q08 2Q09 3Q09 Industrial Packaging Alternative Fuel Mixture Credits $208 $221 Integration Costs ($58) ($18) ($18) Facility Closure Costs* ($63) ($7) Printing Papers Alternative Fuel Mixture Credits $197 $226 Facility Closure Costs* ($107) ($4) ($1) Consumer Packaging Alternative Fuel Mixture Credits $77 $78 Reorganization ($8) ($1) ($2) Corporate Restructuring & Other Charges ($89) ($59) ($141) Sale of Forestlands $3 Total Special Items Pre-Tax ($259) $337 $356 * Does not include closures announced on October 22, 2009 |
 40 3Q09 EBITDA before Special Items 3Q09 EBITDA before Special Items Operating Profit $ Million D & A $ Million Tons Thousand EBITDA $ per Ton EBITDA Margin % Industrial Packaging North America $201 $156 2,469 $145 19.8% Europe $13 $8 252 $83 8.8% Printing Papers North America $92 $58 775 $194 20.7% Western Europe ($5) $5 68 $0 0% Eastern Europe & Russia $43 $15 236 $246 28.7% Brazil $36 $32 282 $241 24.8% U.S. Market Pulp ($18) $10 301 ($27) (5.2%) Consumer Packaging U.S. Coated Paperboard $46 $35 324 $250 22.9% 1 Excludes Recycling & Bag businesses; includes Saturating Kraft business 2 Includes Bleached Kraft business 3 Excludes Market Pulp 3 3 2 1 |
 41 Operating Profits by Industry Segment Operating Profits by Industry Segment $ Million 3Q08 2Q09 3Q09 Industrial Packaging $153 $255 $214 Printing Papers $210 $86 $138 Consumer Packaging $6 $38 $68 Distribution $35 $10 $21 Forest Products $305 $3 $2 Operating Profit $709 $392 $443 Net Interest Expense ($144) ($173) ($169) Noncontrolling Interest / Equity Earnings Adjustment ($1) $8 $5 Corporate Items ($40) ($44) ($46) Special Items ($259) $337 $356 Earnings from continuing operations before income taxes, equity earnings & noncontrolling interest $265 $520 $589 Equity Earnings, net of taxes - Ilim $5 ($30) $0 |
 42 Geographic Business Segment Operating Results from Continuing Operations before Special Items Geographic Business Segment Operating Results from Continuing Operations before Special Items $ Million Sales Operating Profit 3Q08 2Q09 3Q09 3Q08 2Q09 3Q09 Industrial Packaging North American $1,935 $1,955 $1,890 $140 $241 $201 European $285 $240 $240 $11 $14 $14 Asian $100 $75 $100 $2 $0 $0 Printing Papers North American $905 $685 $725 $131 $61 $92 European $425 $315 $300 $29 $16 $28 Brazilian $255 $215 $275 $58 $23 $36 U.S. Market Pulp $210 $135 $155 ($9) ($14) ($18) Asian $5 $10 $15 $1 $0 $0 Consumer Packaging North American $645 $565 $565 $7 $17 $44 European $80 $80 $80 $1 $14 $17 Asian $105 $125 $145 ($2) $7 $7 Distribution $2,075 $1,595 $1,665 $35 $10 $21 Excludes Forest Products |
 43 1 Assuming dilution 2 A reconciliation to GAAP EPS is available at www.internationalpaper.com under the Investors tab at presentations Pre-Tax $MM Tax $MM Minority Interest $MM Equity Earnings Net Income $MM Estimated Tax Rate Average Shares MM Diluted EPS Before Special Items 1Q09 $97 ($32) ($4) ($27) $34 33% 423 $0.08 2Q09 $183 ($61) ($4) ($32) $86 33% 425 $0.20 3Q09 $233 ($70) ($6) $0 $157 30% 429 $0.37 Special Items 1Q09 $421 ($198) $0 $0 $223 47% 423 $0.53 2Q09 $337 ($287) $0 $0 $50 85% 425 $0.12 3Q09 $356 ($142) $0 $0 $214 40% 429 $0.50 Earnings 1Q09 $518 ($230) ($4) ($27) $257 44% 423 $0.61 2Q09 $520 ($348) ($4) ($32) $136 67% 425 $0.32 3Q09 $589 ($212) ($6) $0 $371 36% 429 $0.87 2009 Earnings 2009 Earnings 2 1 |
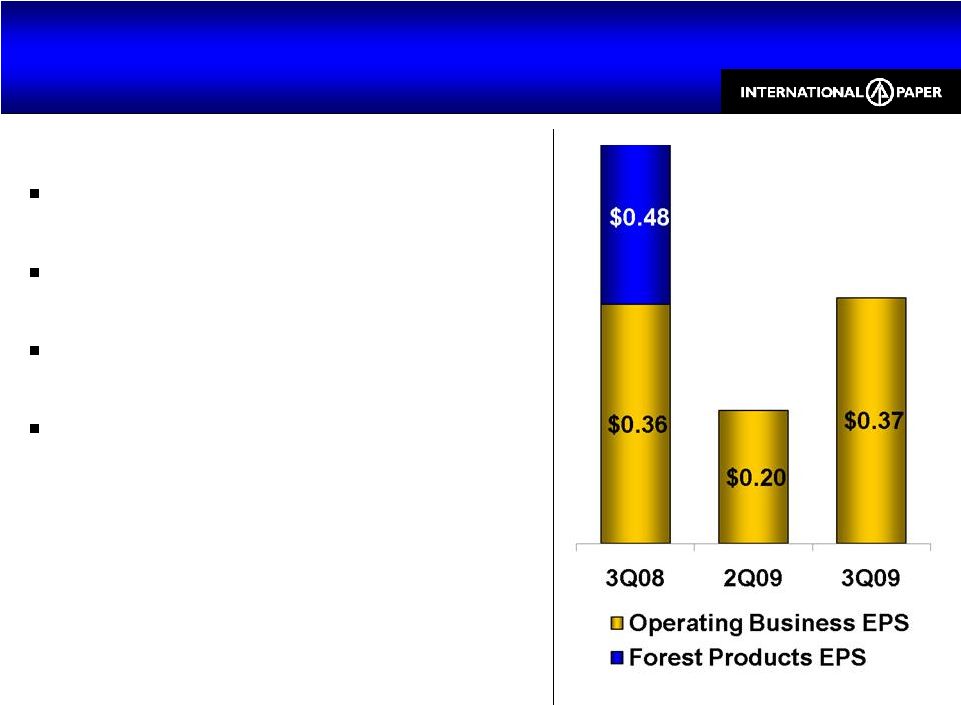
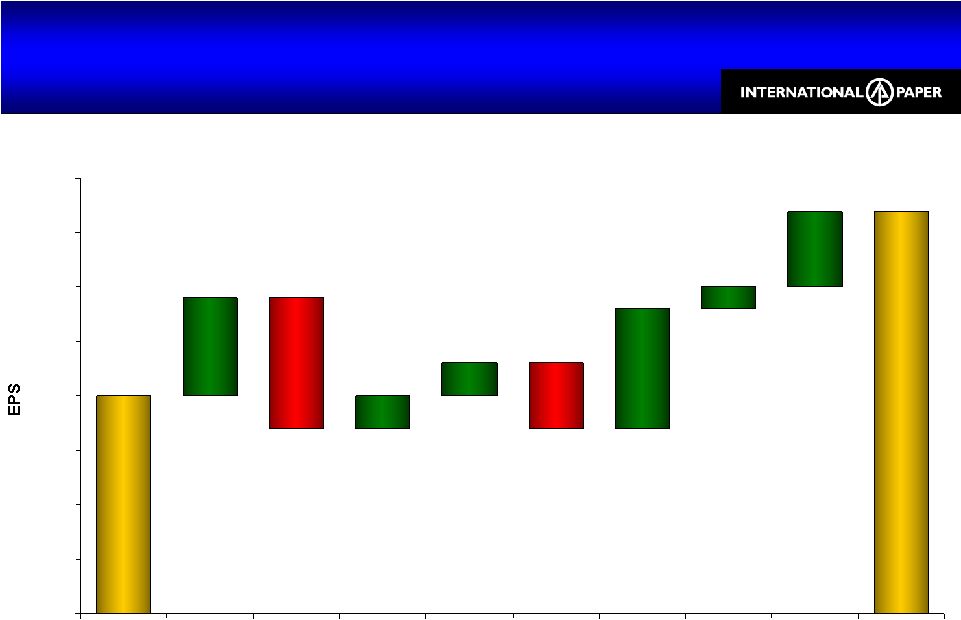
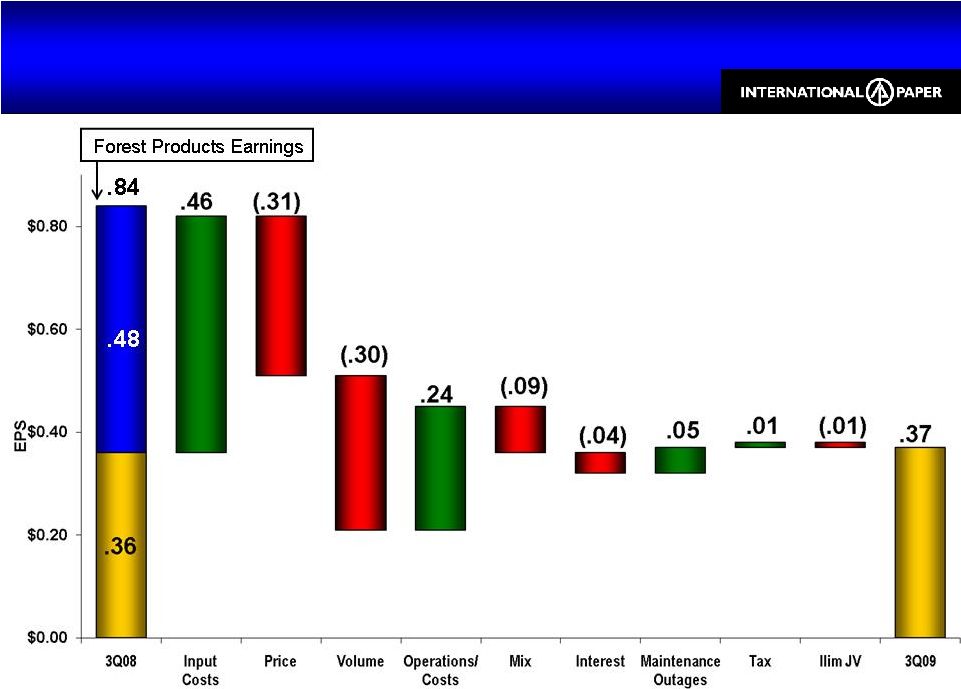 44 Earnings from continuing operations before special items; volume includes earnings from WY PKG 3Q09 vs. 3Q08 EPS 3Q09 vs. 3Q08 EPS .48 |
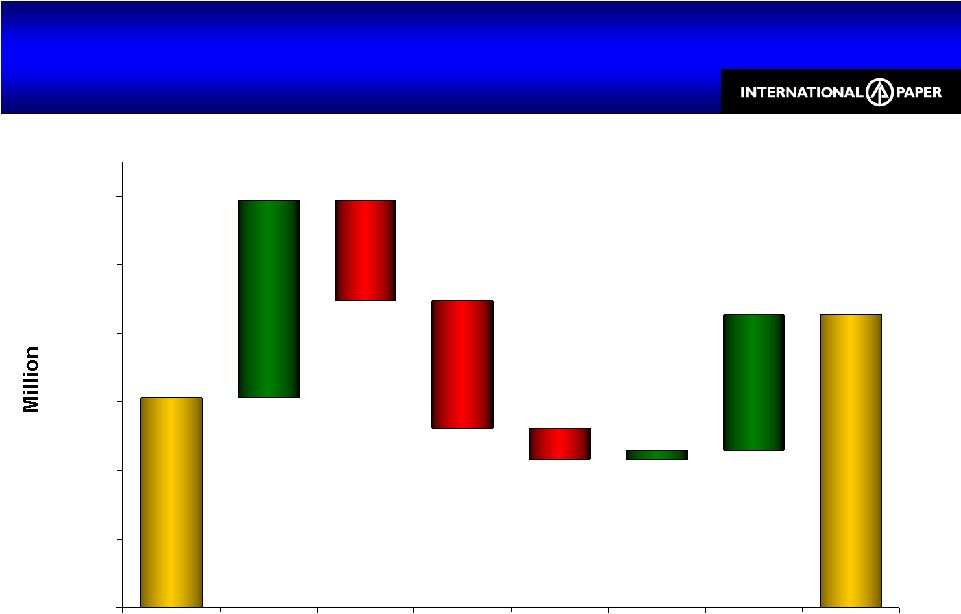 45 153 214 144 7 99 (73) (93) (23) $0 $50 $100 $150 $200 $250 $300 3Q08 Input Costs Price Volume/ LOO Mix Maintenance Outages Operations/ Costs 3Q09 Industrial Packaging Earnings 3Q09 vs. 3Q08 Industrial Packaging Earnings 3Q09 vs. 3Q08 Earnings before special items |
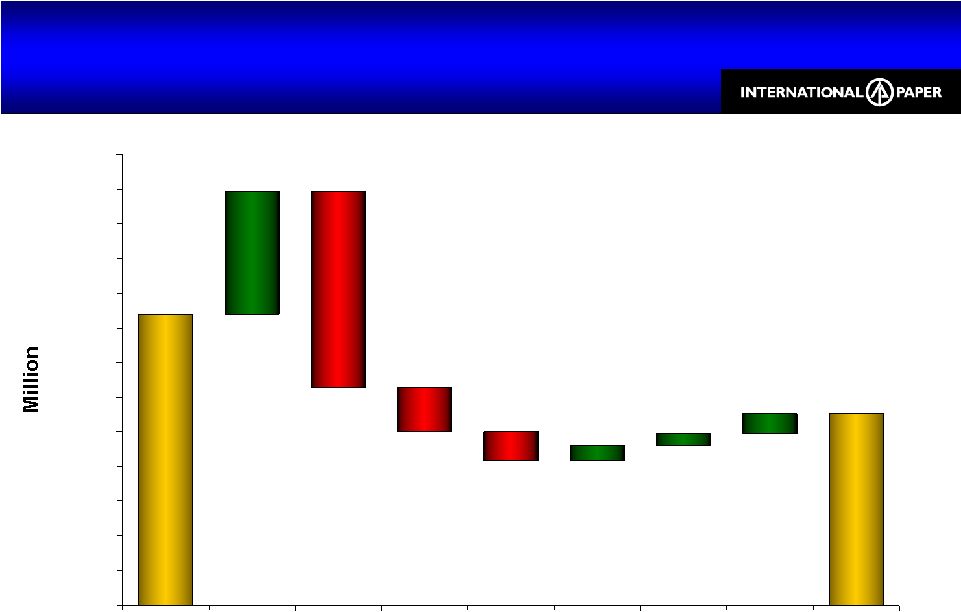 46 210 138 88 11 9 14 (141) (32) (21) $0 $25 $50 $75 $100 $125 $150 $175 $200 $225 $250 $275 $300 $325 3Q08 Input Costs Price Volume/ LOO Mix Maintenance Outages Operations/ Costs Other 3Q09 Printing Papers Earnings 3Q09 vs. 3Q08 Printing Papers Earnings 3Q09 vs. 3Q08 Earnings before special items |
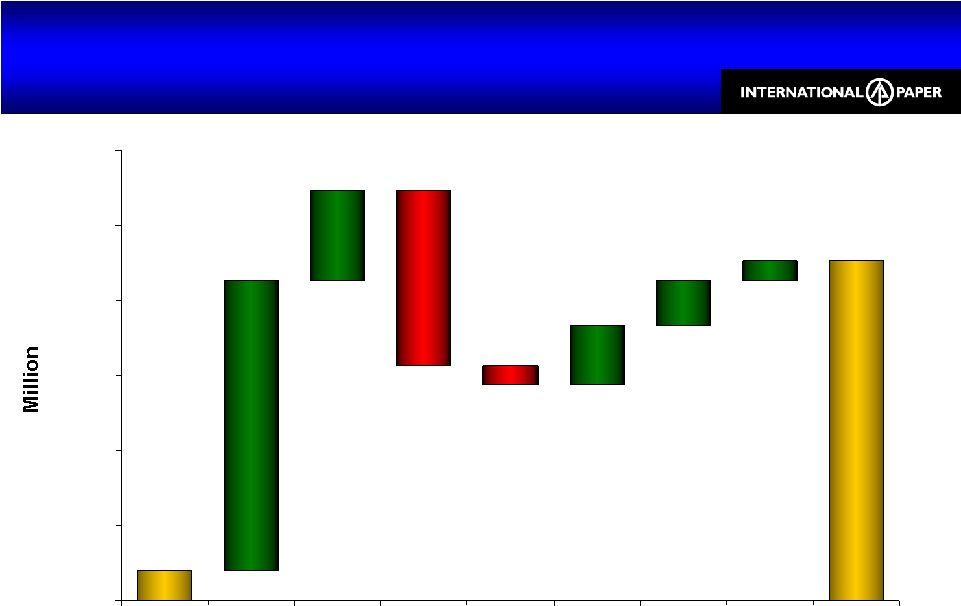 47 6 68 58 18 12 9 4 (35) (4) $0 $15 $30 $45 $60 $75 $90 3Q08 Input Costs Price Volume/ LOO Mix Maintenance Outages Operations/ Costs Other 3Q09 Consumer Packaging Earnings 3Q09 vs. 3Q08 Consumer Packaging Earnings 3Q09 vs. 3Q08 Earnings before special items |
 48 Total Cash Cost Components 3Q09 YTD Total Cash Cost Components 3Q09 YTD North American Mills Only Fiber 28% Materials 14% Labor 14% Chemicals 12% Freight 12% Energy 11% Overhead 9% |
 49 Global Input Costs by Segment $17 Million, or $0.03/Share Favorable vs. 2Q09 Global Input Costs by Segment $17 Million, or
$0.03/Share Favorable vs. 2Q09 By Business By Input Type |
 50 97 68 66 59 ($5) $10 $25 $40 $55 $70 $85 $100 Energy Fiber Chemicals Freight Global Input Costs by Input $290MM, or $0.47/Share Favorable vs. 3Q08 Global Input Costs by Input
$290MM, or $0.47/Share Favorable vs. 3Q08 Input costs for continuing
businesses; does not include WY PKG |
 51 0 50 100 150 200 250 Jan Apr Jul Oct Jan Apr Jul Oct Jan Apr Jul Oct Jan Apr Jul Oct Jan Apr Jul 2005 2006 2007 NYMEX Natural Gas closing prices Index: Jan 2005 Natural Gas Costs = 100 Natural Gas Costs 3% Decrease vs. 2Q09 Average Cost Natural Gas Costs 3% Decrease vs. 2Q09 Average Cost 2008 2009 |
 52 90 95 100 105 110 115 120 125 Jan Apr Jul Oct Jan Apr Jul Oct Jan Apr Jul Oct Jan Apr Jul Oct Jan Apr Jul U.S. Mill Wood Costs Flat vs. 2Q09 Average Cost U.S. Mill Wood Costs Flat vs. 2Q09 Average Cost Index: Jan 2005 Wood Costs = 100 2005 2006 2007 2009 Delivered cost to U.S. facilities 2008 |
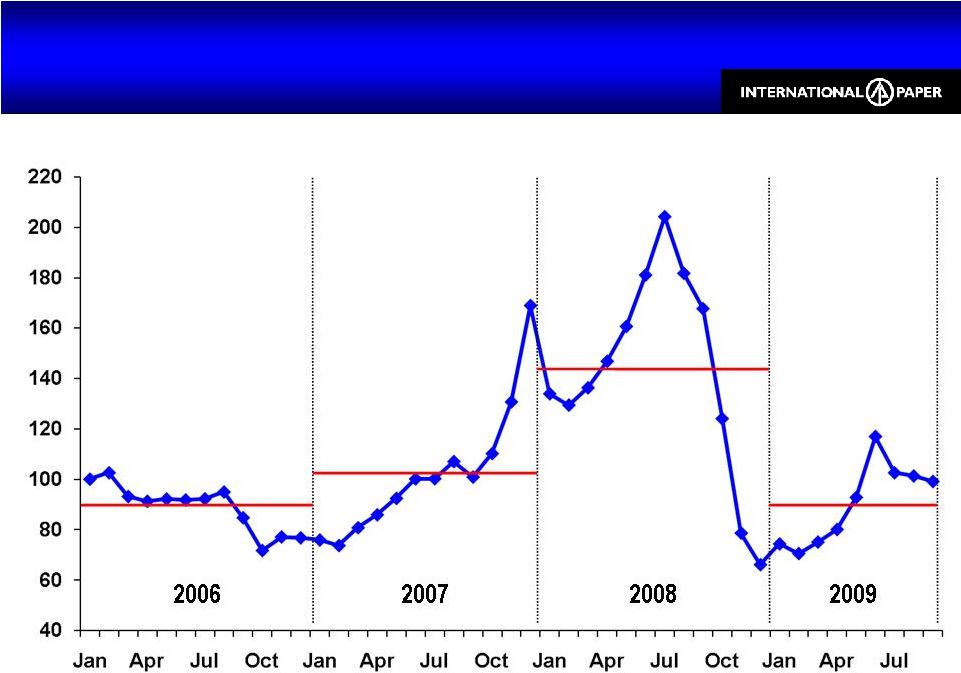
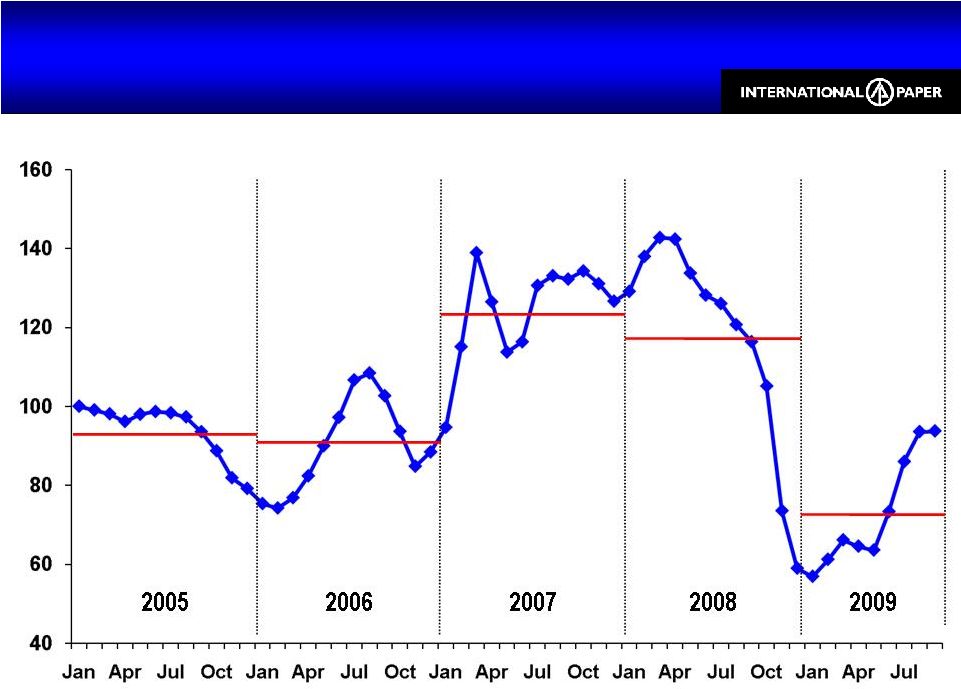 53 Index: Jan 2005 OCC Costs = 100 U.S. Old Corrugated Containers Costs 36% Increase vs. 2Q09 Average Cost U.S. Old Corrugated Containers Costs 36% Increase vs. 2Q09 Average Cost 2005-2007 represents WY PKG delivered costs; 2008-2009 represents the integrated
system |
 54 Index: Jan 2006 Fuel Oil Costs = 100 U.S. Fuel Oil 5% Increase vs. 2Q09 Average Cost U.S. Fuel Oil 5% Increase vs. 2Q09 Average Cost WTI Crude prices |
 55 2005 2006 2007 2009 Index: 1Q05 Chemical Composite= 100 2008 Delivered cost to U.S. facilities; includes Caustic Soda, Sodium Chlorate, Starch and Sulfuric Acid 2005 - 2008 excludes WY PKG U.S. Chemical Composite Index 21% Decrease vs. 2Q09 Average Cost U.S. Chemical Composite Index 21% Decrease vs. 2Q09 Average Cost |
 56 Global Consumption Annual Purchase Estimates for Key Inputs Global Consumption Annual Purchase Estimates for Key Inputs Does not include Asian or Ilim consumption Estimates are based on normal operations and may be impacted by downtime Commodity U. S. Non – U. S. Energy Natural Gas (MM BTUs) 50,500,000 16,000,000 Fuel Oil (Barrels) 2,100,000 500,000 Coal (Tons) 1,100,000 230,000 Fiber Wood (Tons) 50,000,000 8,400,000 Old Corrugated Containers (Tons)
3,500,000 310,000 Chemicals Caustic Soda (Tons) 330,000 60,000 Starch (Tons) 490,000 110,000 Sodium Chlorate (Tons) 225,000 50,000 LD Polyethylene (Tons) 45,000 - Latex (Tons) 25,000 4,000 |