Attached files
| file | filename |
|---|---|
| 8-K - 8-K - Allegiant Travel CO | a09-32353_18k.htm |
Exhibit 99.1
|
|
Management Presentation October 2009 |
|
|
Notice on Forward Looking Statements This presentation as well as oral statements made by officers or directors of Allegiant Travel Company, its advisors and affiliates (collectively or separately, the "Company") will contain forward-looking statements that are only predictions and involve risks and uncertainties. Forward-looking statements may include, among others, references to future performance , future growth and any comments about our strategic plans. There are many risk factors that could prevent us from achieving our goals and cause the underlying assumptions of these forward-looking statements, and our actual results, to differ materially from those expressed in, or implied by, our forward-looking statements. These risk factors and others are more fully discussed in our filings with the Securities and Exchange Commission. Any forward-looking statements are based on information available to us today and we undertake no obligation to update publicly any forward-looking statements, whether as a result of future events, new information or otherwise. The Company cautions users of this presentation not to place undue reliance on forward looking statements, which may be based on assumptions and anticipated events that do not materialize. |
|
|
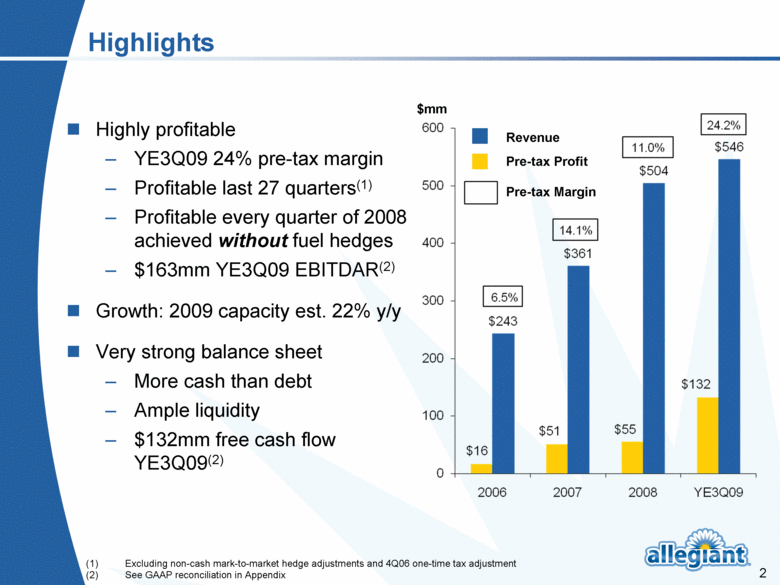
Highlights $mm Highly profitable YE3Q09 24% pre-tax margin Profitable last 27 quarters(1) Profitable every quarter of 2008 achieved without fuel hedges $163mm YE3Q09 EBITDAR(2) Growth: 2009 capacity est. 22% y/y Very strong balance sheet More cash than debt Ample liquidity $132mm free cash flow YE3Q09(2) Revenue Pre-tax Profit Pre-tax Margin Excluding non-cash mark-to-market hedge adjustments and 4Q06 one-time tax adjustment See GAAP reconciliation in Appendix |
|
|
A Travel Company Nonstop, low-frequency service from small cities to large leisure destinations 58 small cities (~50K to over ½ mm population) 11 destinations Six are bases (aircraft, crews, maintenance): Las Vegas, Orlando, Phoenix, Tampa Bay, Ft. Lauderdale, Southern California Five are not...yet: Palm Springs, Myrtle Beach, San Diego, Bay Area, Southwest Florida Sell third party provided products and services (hotels, car rentals, show tickets, etc) using “merchant” model We’re not just an airline |
|
|
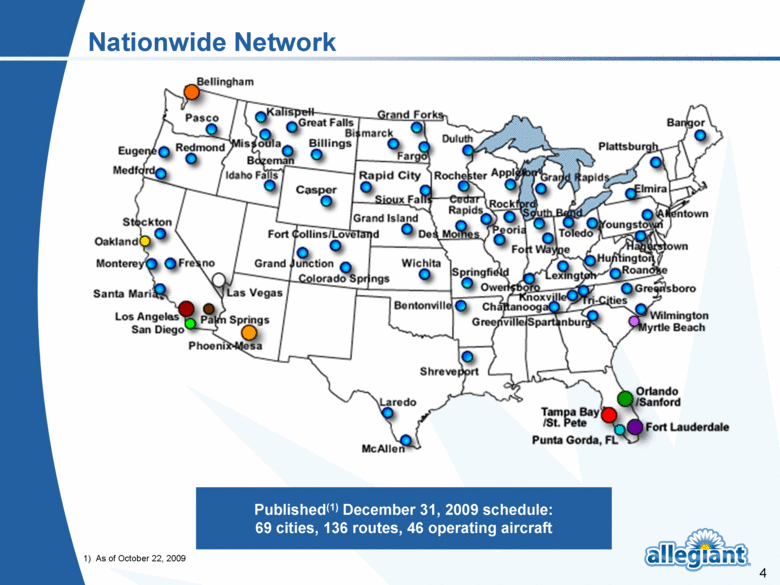
Nationwide Network Published(1) December 31, 2009 schedule: 69 cities, 136 routes, 46 operating aircraft 1) As of October 22, 2009 |
|
|
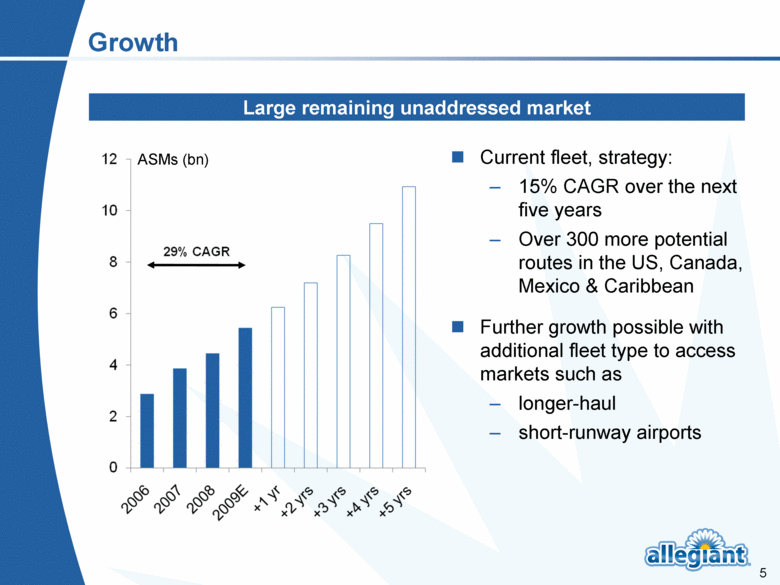
Growth Current fleet, strategy: 15% CAGR over the next five years Over 300 more potential routes in the US, Canada, Mexico & Caribbean Further growth possible with additional fleet type to access markets such as longer-haul short-runway airports ASMs (bn) Large remaining unaddressed market |
|
|
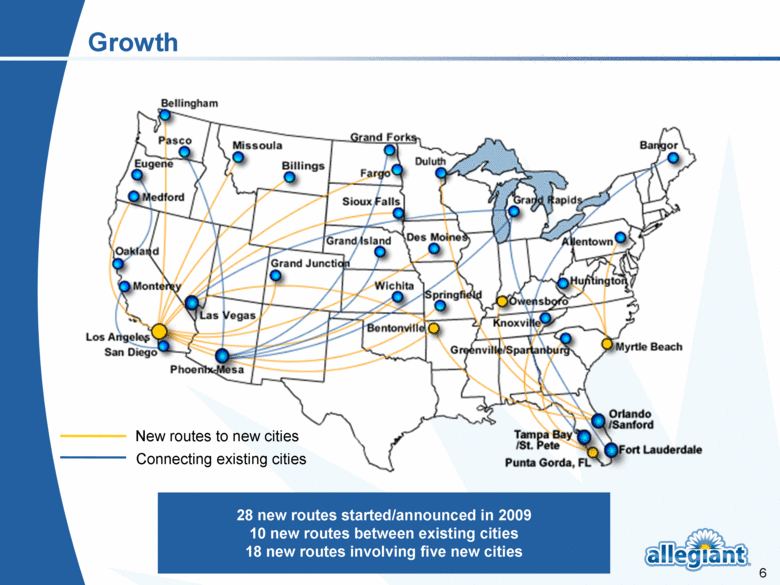
Growth 28 new routes started/announced in 2009 10 new routes between existing cities 18 new routes involving five new cities New routes to new cities Connecting existing cities |
|
|
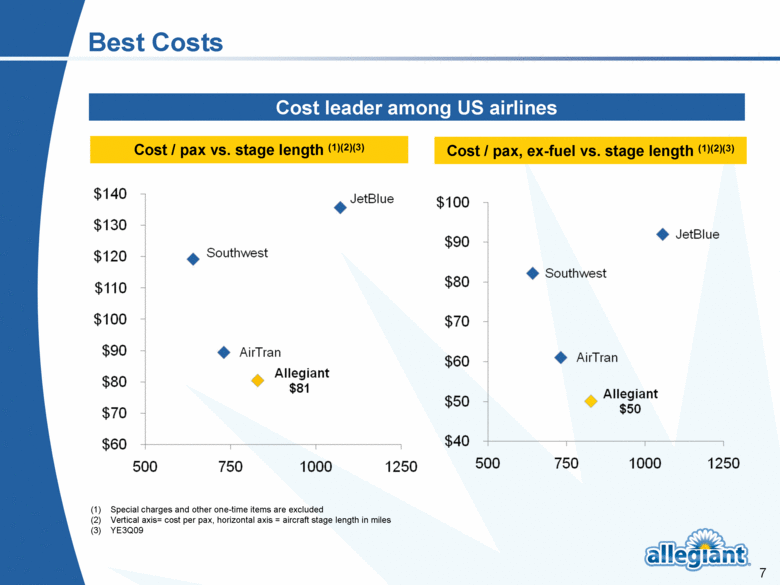
Best Costs Cost / pax vs. stage length (1)(2)(3) Cost / pax, ex-fuel vs. stage length (1)(2)(3) Cost leader among US airlines Special charges and other one-time items are excluded Vertical axis= cost per pax, horizontal axis = aircraft stage length in miles YE3Q09 |
|
|
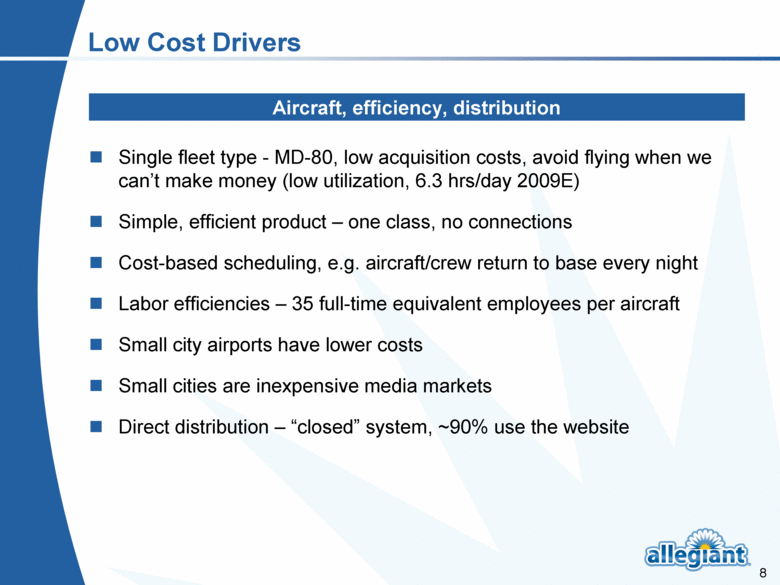
Low Cost Drivers Aircraft, efficiency, distribution Single fleet type - MD-80, low acquisition costs, avoid flying when we can’t make money (low utilization, 6.3 hrs/day 2009E) Simple, efficient product – one class, no connections Cost-based scheduling, e.g. aircraft/crew return to base every night Labor efficiencies – 35 full-time equivalent employees per aircraft Small city airports have lower costs Small cities are inexpensive media markets Direct distribution – “closed” system, ~90% use the website |
|
|
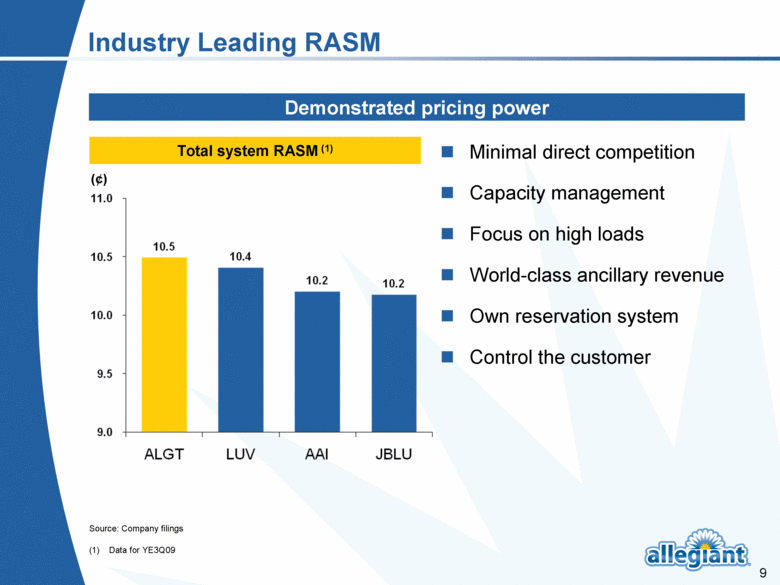
Industry Leading RASM (1) Data for YE3Q09 Minimal direct competition Capacity management Focus on high loads World-class ancillary revenue Own reservation system Control the customer Demonstrated pricing power Total system RASM (1) Source: Company filings (¢) |
|
|
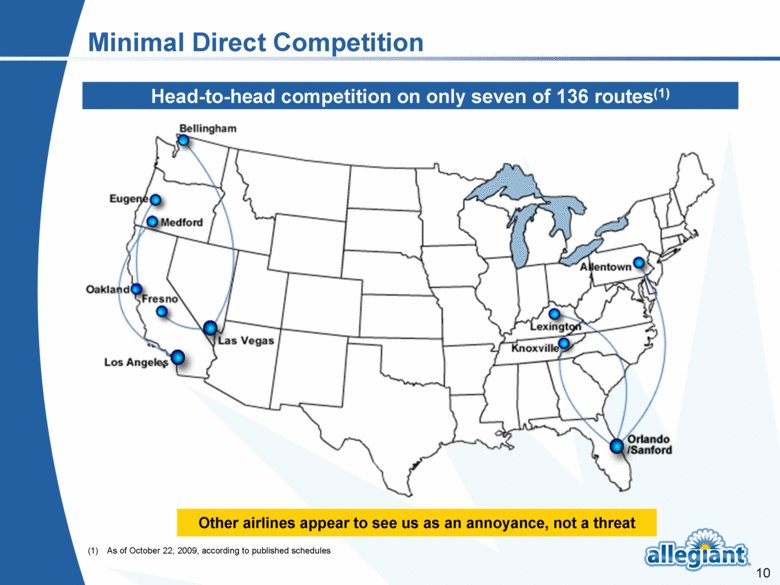
Minimal Direct Competition Head-to-head competition on only seven of 136 routes(1) Other airlines appear to see us as an annoyance, not a threat (1) As of October 22, 2009, according to published schedules |
|
|
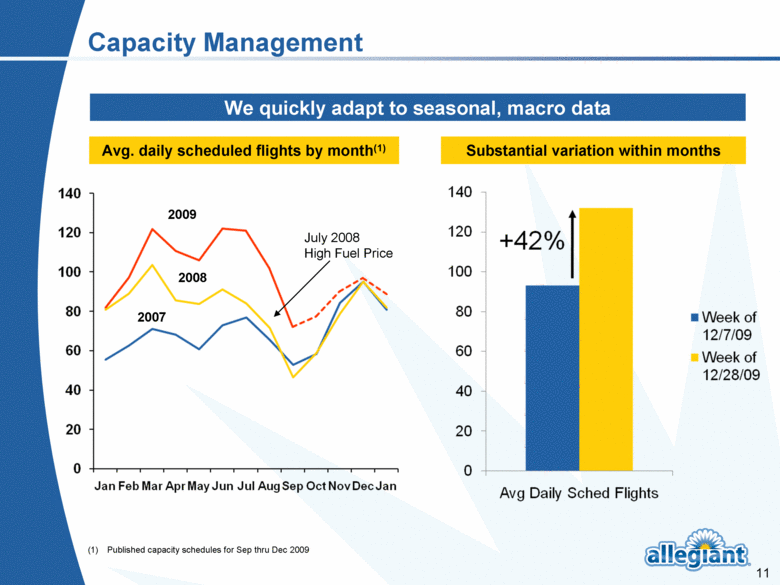
We quickly adapt to seasonal, macro data Capacity Management 2008 2007 2009 July 2008 High Fuel Price Avg. daily scheduled flights by month(1) (1) Published capacity schedules for Sep thru Dec 2009 Substantial variation within months |
|
|
Price for Load Capacity plan (over long-term) & revenue plan (in short-term) to hit ~90% load factor $30+/pax ancillary incents us to fill airplanes Reduces cost/pax Low air fare gets potential customers to invest in transaction High load factors and high ancillary revenues permit low base fares Low base fares generate consumer interest Demand elasticity almost solely with respect to base fares Key is low base air fare |
|
|
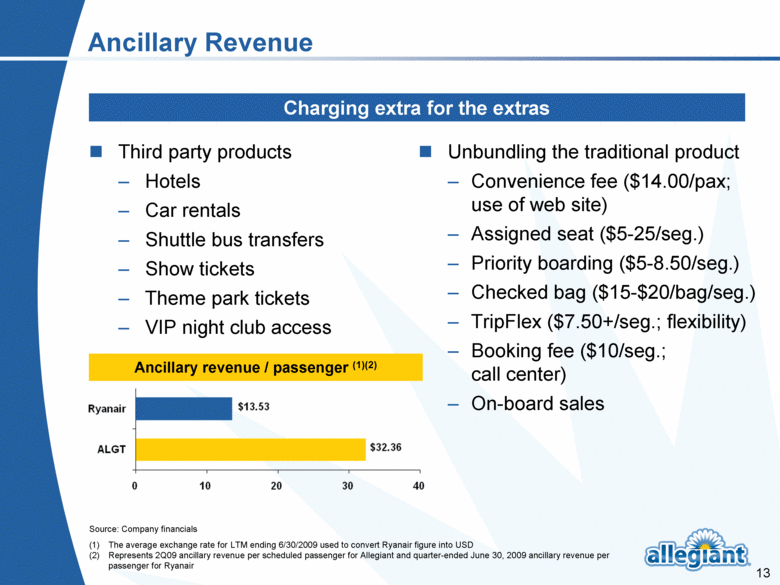
Ancillary Revenue Charging extra for the extras Source: Company financials (1) The average exchange rate for LTM ending 6/30/2009 used to convert Ryanair figure into USD (2) Represents 2Q09 ancillary revenue per scheduled passenger for Allegiant and quarter-ended June 30, 2009 ancillary revenue per passenger for Ryanair Ancillary revenue / passenger (1)(2) Third party products Hotels Car rentals Shuttle bus transfers Show tickets Theme park tickets VIP night club access Unbundling the traditional product Convenience fee ($14.00/pax; use of web site) Assigned seat ($5-25/seg.) Priority boarding ($5-8.50/seg.) Checked bag ($15-$20/bag/seg.) TripFlex ($7.50+/seg.; flexibility) Booking fee ($10/seg.; call center) On-board sales |
|
|
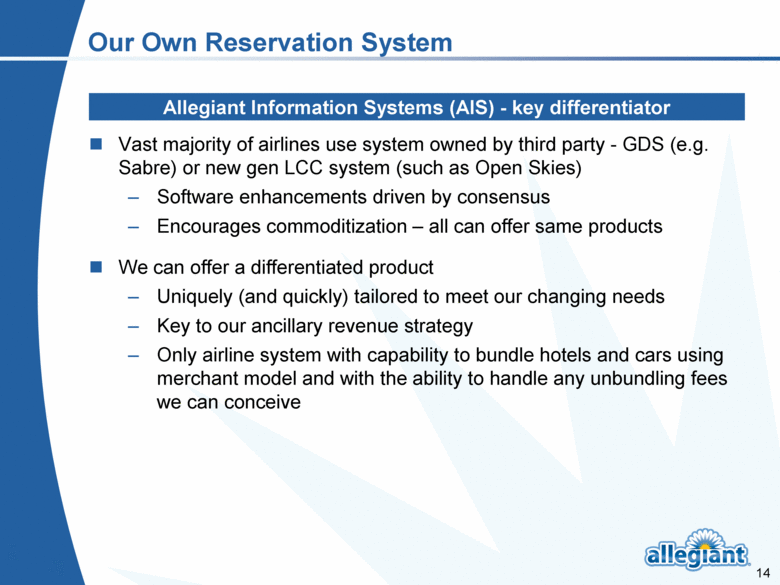
Our Own Reservation System Vast majority of airlines use system owned by third party - GDS (e.g. Sabre) or new gen LCC system (such as Open Skies) Software enhancements driven by consensus Encourages commoditization – all can offer same products We can offer a differentiated product Uniquely (and quickly) tailored to meet our changing needs Key to our ancillary revenue strategy Only airline system with capability to bundle hotels and cars using merchant model and with the ability to handle any unbundling fees we can conceive Allegiant Information Systems (AIS) - key differentiator |
|
|
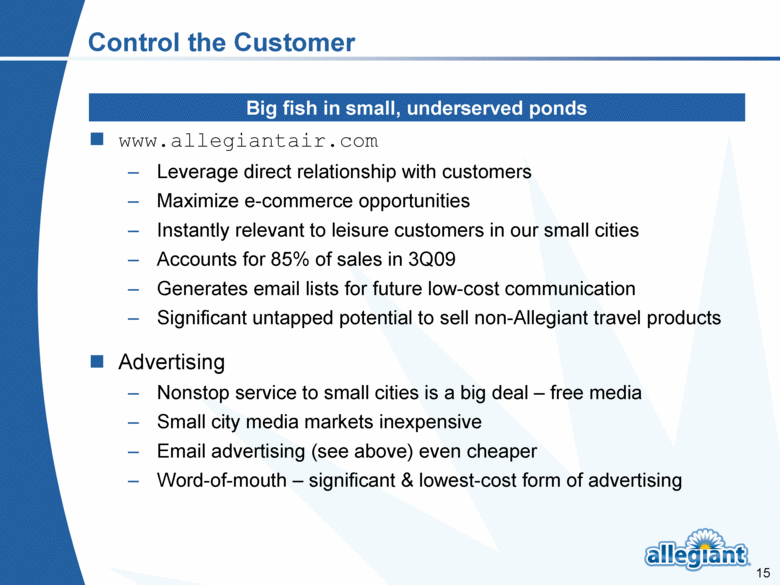
Control the Customer www.allegiantair.com Leverage direct relationship with customers Maximize e-commerce opportunities Instantly relevant to leisure customers in our small cities Accounts for 85% of sales in 3Q09 Generates email lists for future low-cost communication Significant untapped potential to sell non-Allegiant travel products Advertising Nonstop service to small cities is a big deal – free media Small city media markets inexpensive Email advertising (see above) even cheaper Word-of-mouth – significant & lowest-cost form of advertising Big fish in small, underserved ponds |
|
|
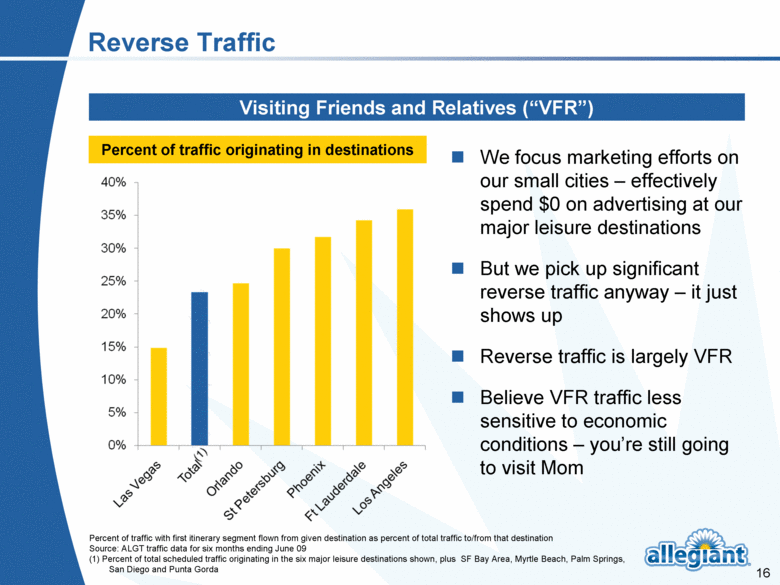
Reverse Traffic We focus marketing efforts on our small cities – effectively spend $0 on advertising at our major leisure destinations But we pick up significant reverse traffic anyway – it just shows up Reverse traffic is largely VFR Believe VFR traffic less sensitive to economic conditions – you’re still going to visit Mom Visiting Friends and Relatives (“VFR”) Percent of traffic originating in destinations Percent of traffic with first itinerary segment flown from given destination as percent of total traffic to/from that destination Source: ALGT traffic data for six months ending June 09 (1) Percent of total scheduled traffic originating in the six major leisure destinations shown, plus SF Bay Area, Myrtle Beach, Palm Springs, San Diego and Punta Gorda |
|
|
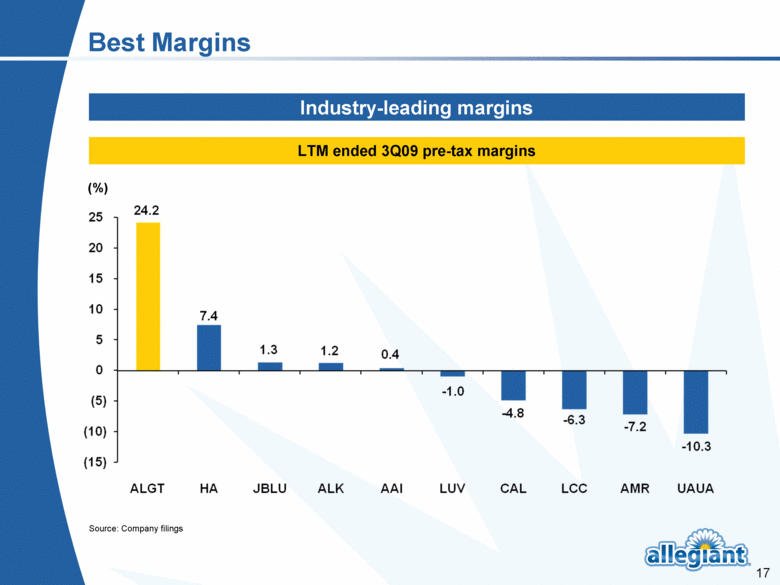
Best Margins Source: Company filings (%) LTM ended 3Q09 pre-tax margins Industry-leading margins |
|
|
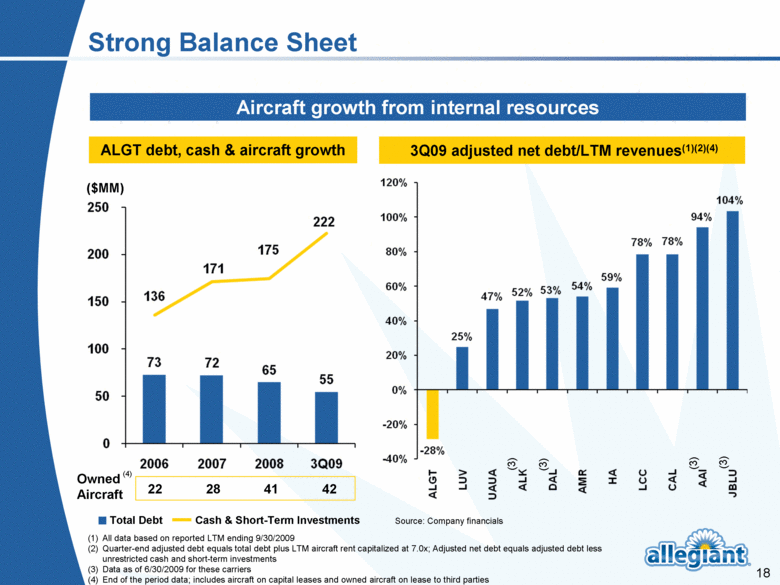
(1) All data based on reported LTM ending 9/30/2009 (2) Quarter-end adjusted debt equals total debt plus LTM aircraft rent capitalized at 7.0x; Adjusted net debt equals adjusted debt less unrestricted cash and short-term investments (3) Data as of 6/30/2009 for these carriers (4) End of the period data; includes aircraft on capital leases and owned aircraft on lease to third parties ALGT debt, cash & aircraft growth 3Q09 adjusted net debt/LTM revenues(1)(2)(4) Source: Company financials Aircraft growth from internal resources Total Debt Cash & Short-Term Investments Owned Aircraft 22 28 41 42 ($MM) Strong Balance Sheet (4) (3) (3) (3) (3) |
|
|
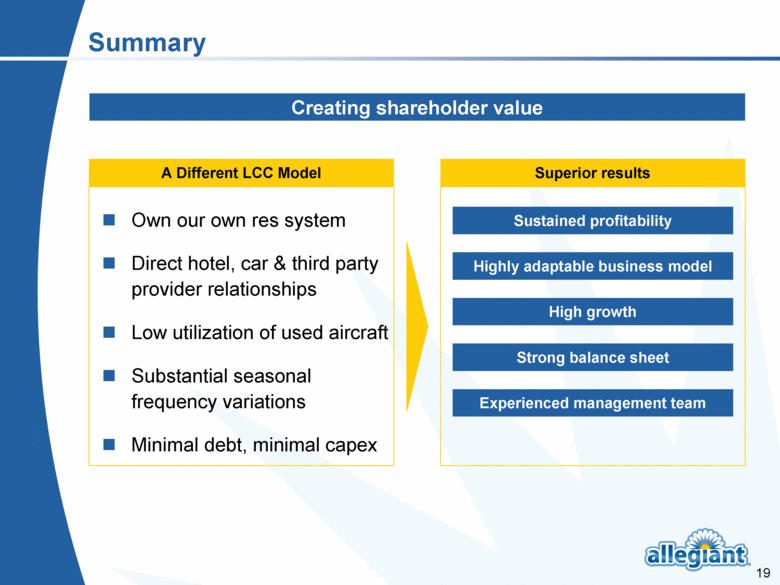
Summary Own our own res system Direct hotel, car & third party provider relationships Low utilization of used aircraft Substantial seasonal frequency variations Minimal debt, minimal capex Creating shareholder value A Different LCC Model Sustained profitability Highly adaptable business model High growth Strong balance sheet Experienced management team Superior results |
|
|
Appendix |
|
|
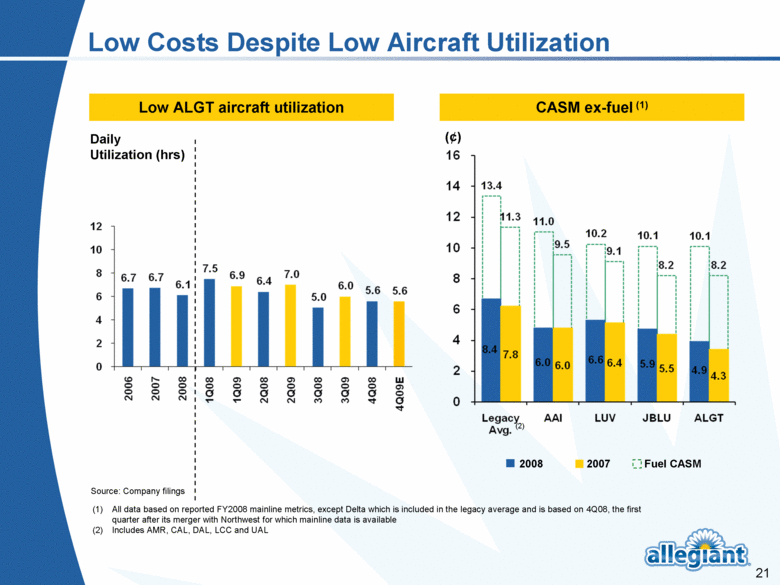
2008 Low Costs Despite Low Aircraft Utilization Low ALGT aircraft utilization (1) All data based on reported FY2008 mainline metrics, except Delta which is included in the legacy average and is based on 4Q08, the first quarter after its merger with Northwest for which mainline data is available (2) Includes AMR, CAL, DAL, LCC and UAL CASM ex-fuel (1) (¢) (2) Daily Utilization (hrs) 2007 Fuel CASM Source: Company filings |
|
|
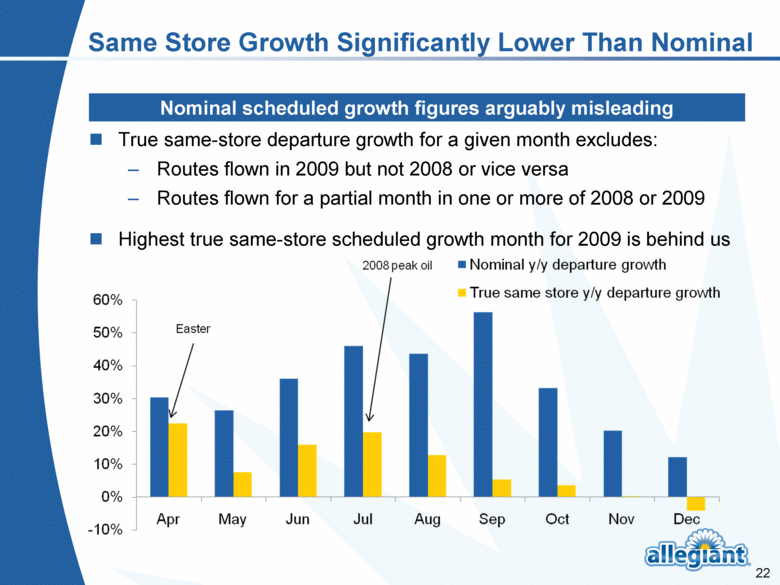
Same Store Growth Significantly Lower Than Nominal True same-store departure growth for a given month excludes: Routes flown in 2009 but not 2008 or vice versa Routes flown for a partial month in one or more of 2008 or 2009 Highest true same-store scheduled growth month for 2009 is behind us Nominal scheduled growth figures arguably misleading |
|
|
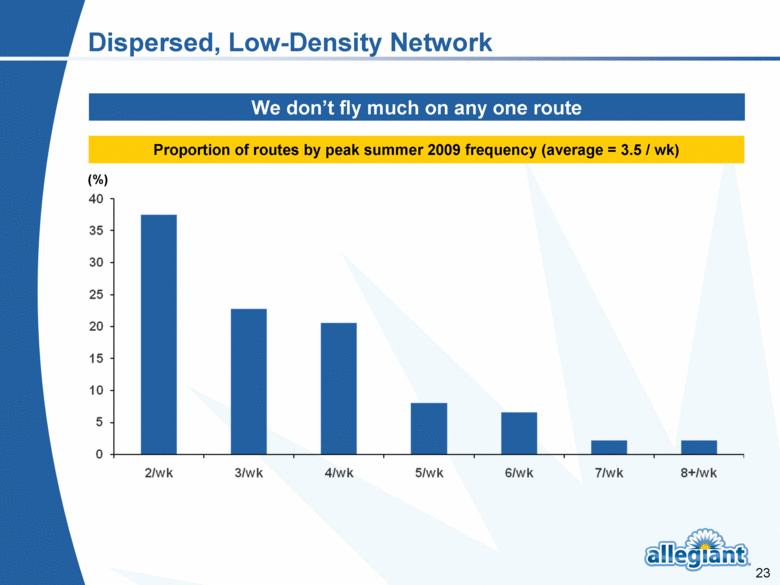
Dispersed, Low-Density Network We don’t fly much on any one route Proportion of routes by peak summer 2009 frequency (average = 3.5 / wk) (%) |
|
|
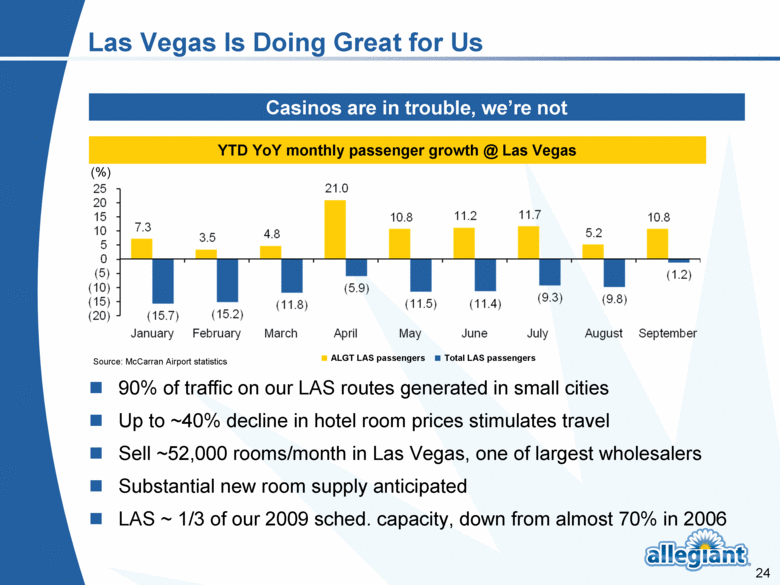
Las Vegas Is Doing Great for Us Casinos are in trouble, we’re not 90% of traffic on our LAS routes generated in small cities Up to ~40% decline in hotel room prices stimulates travel Sell ~52,000 rooms/month in Las Vegas, one of largest wholesalers Substantial new room supply anticipated LAS ~ 1/3 of our 2009 sched. capacity, down from almost 70% in 2006 YTD YoY monthly passenger growth @ Las Vegas (%) ALGT LAS passengers Total LAS passengers Source: McCarran Airport statistics |
|
|
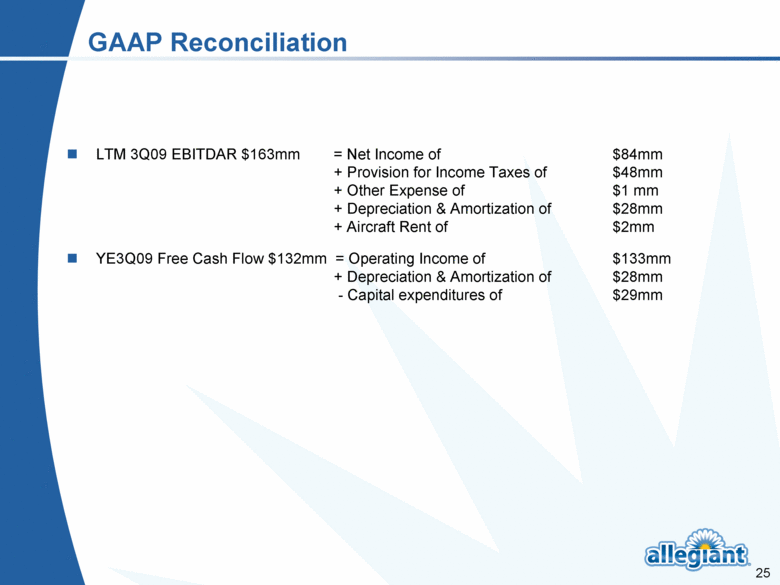
GAAP Reconciliation LTM 3Q09 EBITDAR $163mm = Net Income of $84mm + Provision for Income Taxes of $48mm + Other Expense of $1 mm + Depreciation & Amortization of $28mm + Aircraft Rent of $2mm YE3Q09 Free Cash Flow $132mm = Operating Income of $133mm + Depreciation & Amortization of $28mm - Capital expenditures of $29mm |

