Attached files
UNITED STATES
SECURITIES AND EXCHANGE COMMISSION
Washington, D.C. 20549
FORM 10-K
|
|
|
|
(Mark One) |
|
|
x |
ANNUAL REPORT PURSUANT TO SECTION 13 OR 15(D) OF THE SECURITIES EXCHANGE ACT OF 1934 for the fiscal year ended August 29, 2009; or |
|
o |
TRANSITION REPORT PURSUANT TO SECTION 13 OR
15(D) OF THE SECURITIES EXCHANGE ACT OF 1934 for the
transition period from ___________________ to _______________________ |
|
|
|
|
WINNEBAGO INDUSTRIES, INC. |
|
|
(Exact name of registrant as specified in its charter) |
|
|
|
|
|
|
Iowa |
|
42-0802678 |
|
(State or other jurisdiction of |
|
(I.R.S. Employer |
|
incorporation or organization) |
|
Identification No.) |
|
|
|
|
|
P.O. Box 152, Forest City, Iowa |
|
50436 |
|
(Address of Principal executive offices) |
|
(Zip Code) |
|
|
|
|
|
Registrant’s telephone number, including area code: (641) 585-3535 |
|
|
Securities registered pursuant to Section 12(b) of the Act: |
|
|
|
|
|
TITLE OF EACH CLASS |
|
NAME OF EACH EXCHANGE ON |
|
Common Stock ($.50 par value) |
|
The New York Stock Exchange, Inc. |
|
and Preferred Share Purchase Rights |
|
Chicago Stock Exchange, Inc. |
Securities registered pursuant to Section 12(g) of the Act:
None
Indicate by
check mark if the registrant is a well-known seasoned issuer, as defined in
Rule 405 of the Securities Act.
Yes o
No x
Indicate by check mark whether the registrant is not required to file reports pursuant to Section 13 or Section 15(d) of the Act. Yes o No x
Indicate by check mark whether the registrant (1) has filed all reports required to be filed by Section 13 or 15(d) of the Securities Exchange Act of 1934 during the preceding 12 months (or for such shorter period that the registrant was required to file such reports), and (2) has been subject to such filing requirements for the past 90 days. Yes x No o
Indicate by
check mark whether the registrant has submitted electronically and posted on
its corporate Web Site, if any, every Interactive Data File required to be
submitted and posted pursuant to Rule 405 of Regulation S-T (§ 232.405 of this
chapter) during the preceding 12 months (or for such shorter period that the
registrant was required to submit and post such files).
Yes o No o
Indicate by check mark if disclosure of delinquent filers pursuant to Item 405 of Regulation S-K is not contained herein, and will not be contained, to the best of the registrant’s knowledge, in definitive proxy or information statements incorporated by reference in Part III of this Form 10-K or any amendment to this Form 10-K o.
Indicate by
check mark whether the registrant is a shell company (as defined in Rule 12b-2
of the Exchange Act).
Yes o
No x
Aggregate market value of the common stock held by nonaffiliates of the registrant: $114,636,623 (28,305,339 shares at the closing price on the New York Stock Exchange of $4.05 on February 27, 2009).
Common stock outstanding on October 6, 2009: 29,088,144 shares.
Winnebago
Industries, Inc.
2009 Form 10-K Annual Report
Table of Contents
|
|
|
|
|
|
|
|
|
|
|
Page |
||
|
|
|
|
|
|
|
|
Item 1. |
|
|
1 |
|
|
|
Item 1A. |
|
|
6 |
|
|
|
Item 1B. |
|
|
8 |
|
|
|
Item 2. |
|
|
9 |
|
|
|
Item 3. |
|
|
9 |
|
|
|
Item 4. |
|
|
9 |
|
|
|
|
|
|
|
|
|
|
|
|
|
|
|
|
|
|
|
|
|
|
|
|
Item 5. |
|
|
11 |
|
|
|
Item 6. |
|
|
13 |
|
|
|
Item 7. |
|
Management’s Discussion and Analysis of Financial Condition and Results of Operations |
|
14 |
|
|
Item 7A. |
|
|
24 |
|
|
|
Item 8. |
|
|
25 |
|
|
|
Item 9. |
|
Changes In and Disagreements with Accountants on Accounting and Financial Disclosure |
|
50 |
|
|
Item 9A. |
|
|
50 |
|
|
|
Item 9B. |
|
|
50 |
|
|
|
|
|
|
|
|
|
|
|
|
|
|
|
|
|
|
|
|
|
|
|
|
Item 10. |
|
|
50 |
|
|
|
Item 11. |
|
|
51 |
|
|
|
Item 12. |
|
Security Ownership of Certain Beneficial Owners and Management and Related Stockholder Matters |
|
51 |
|
|
Item 13. |
|
Certain Relationships and Related Transactions and Director Independence |
|
51 |
|
|
Item 14. |
|
|
51 |
|
|
|
|
|
|
|
|
|
|
|
|
|
|
|
|
|
|
|
|
|
|
|
|
Item 15. |
|
|
51 |
|
|
WINNEBAGO INDUSTRIES, INC.
FORM 10-K
Report for the Fiscal Year Ended August 29, 2009
Forward-Looking Information
Certain of the matters discussed in this Annual Report on Form 10-K are “forward-looking statements” within the meaning of Section 27A of the Securities Act of 1933, as amended, and Section 21E of the Securities Exchange Act of 1934, as amended, which involve risks and uncertainties. A number of factors could cause actual results to differ materially from these statements, including, but not limited to, interest rates and availability of credit, low consumer confidence, significant increase in repurchase obligations, inadequate liquidity or capital resources, availability and price of fuel, a further or continued slowdown in the economy, availability of chassis and other key component parts, sales order cancellations, slower than anticipated sales of new or existing products, new product introductions by competitors, the effect of global tensions and other factors which may be disclosed throughout this Annual Report on Form 10-K. Although we believe that the expectations reflected in the “forward-looking statements” are reasonable, we cannot guarantee future results, levels of activity, performance or achievements. Undue reliance should not be placed on these “forward-looking statements,” which speak only as of the date of this report. We undertake no obligation to publicly update or revise any “forward-looking statements,” whether as a result of new information, future events or otherwise, except as required by law or the rules of the New York Stock Exchange.
General
The “Company,” “we,” “our” and “us” are used interchangeably to refer to Winnebago Industries, Inc. as appropriate in the context. At August 29, 2009, we had no subsidiaries.
Winnebago Industries, Inc., headquartered in Forest City, Iowa, is the leading United States manufacturer of motor homes which are self-contained recreation vehicles (RV) used primarily in leisure travel and outdoor recreation activities. We sell motor homes through independent dealers under the Winnebago, Itasca and ERA brand names. Other products manufactured by us consist primarily of original equipment manufacturing (OEM) parts, including extruded aluminum and other component products for other manufacturers and commercial vehicles.
We were incorporated under the laws of the state of Iowa on February 12, 1958, and adopted our present name on February 28, 1961. Our executive offices are located at 605 West Crystal Lake Road in Forest City, Iowa. Our telephone number is (641) 585-3535.
Available Information
Our Web Site, located at www.winnebagoind.com, provides additional information about us. On our Web Site, you can obtain, free of charge, this and prior year Annual Reports on Form 10-K, Quarterly Reports on Form 10-Q, Current Reports on Form 8-K and all of our other filings with the Securities and Exchange Commission. Our recent press releases are also available on our Web Site. Our Web Site also contains important information regarding our corporate governance practices. Information contained on our Web Site is not incorporated into this Annual Report on Form 10-K.
1
Principal Products
Net revenues by major product classes:
|
|
|
|
|
|
|
|
|
|
|
|
|
|
|
|
|
|
|
|
|
|
|
|
|
|
|
|
|
|
|
|
|
Year Ended (1) |
||||||||||||||||||||||||||
|
(In thousands) |
|
|
Aug. 29, |
|
% |
|
|
Aug. 30, |
|
% |
|
Aug. 25, |
|
% |
|
Aug. 26, |
|
% |
|
Aug. 27, |
|
% |
|
|||||
|
Motor homes |
|
|
$ |
178,619 |
|
84.5 |
|
|
$ |
555,671 |
|
91.9 |
|
$ |
815,895 |
|
93.8 |
|
$ |
808,715 |
|
93.6 |
|
$ |
946,350 |
|
95.4 |
|
|
Motor home parts and services |
|
|
|
12,559 |
|
5.9 |
|
|
|
16,923 |
|
2.8 |
|
|
16,413 |
|
1.9 |
|
|
15,901 |
|
1.8 |
|
|
16,401 |
|
1.7 |
|
|
Other manufactured products |
|
|
|
20,341 |
|
9.6 |
|
|
|
31,758 |
|
5.3 |
|
|
37,844 |
|
4.3 |
|
|
39,787 |
|
4.6 |
|
|
29,224 |
|
2.9 |
|
|
Total net revenues |
|
|
$ |
211,519 |
|
100.0 |
|
|
$ |
604,352 |
|
100.0 |
|
$ |
870,152 |
|
100.0 |
|
$ |
864,403 |
|
100.0 |
|
$ |
991,975 |
|
100.0 |
|
|
|
|
|
(1) The fiscal year ended August 30, 2008 contained 53 weeks; all other fiscal years contained 52 weeks. |
|
Motor Homes
A motor home is a self-propelled mobile dwelling used primarily as temporary living quarters during vacation and camping trips, or to support some other active lifestyle. The Recreation Vehicle Industry Association (RVIA) classifies motor homes into three types which are defined as follows:
|
|
|
|
|
Class A models are conventional motor homes constructed directly on medium- and heavy-duty truck chassis, which include the engine and drivetrain components. The living area and driver’s compartment are designed and produced by the motor home manufacturer. We manufacture Class A motor homes with gas and diesel engines. |
|
|
|
|
|
Class B models are panel-type trucks to which sleeping, kitchen, and/or toilet facilities are added. These models may also have a top extension to provide more headroom. We manufacture Class B motor homes with diesel engines. |
|
|
|
|
|
Class C models are mini motor homes built on van-type chassis onto which the motor home manufacturer constructs a living area with access to the driver’s compartment. We manufacture Class C motor homes with gas and diesel engines. |
We manufacture and sell Class A and C motor homes under the Winnebago and Itasca brand names and Class B motor homes under the ERA brand name. Our product offerings for the 2010 model year are as follows:
|
|
|
|
|
|
|
|
|
Type |
|
Winnebago |
|
Itasca |
|
ERA |
|
|
||||||
|
Class A (gas) |
|
Vista, Sightseer, Adventurer |
|
Sunstar, Sunova, Suncruiser |
|
|
|
Class A (diesel) |
|
Via, Journey, Journey Express, Tour |
|
Reyo, Meridian, Meridian V Class, Ellipse |
|
|
|
Class B (diesel) |
|
|
|
|
|
ERA |
|
Class C |
|
Access, Outlook, Aspect, View, View Profile |
|
Impulse, Cambria, Navion, Navion iQ |
|
|
Models in our 2009 model year lineup that have been discontinued in the 2010 lineup are as follows: Destination, Latitude, Spirit, Vectra and Horizon.
These motor homes generally provide living accommodations for up to seven people and include kitchen, dining, sleeping and bath areas, and in some models, a lounge. Optional equipment accessories include, among other items, generators, home theater systems, king-size beds, and UltraLeather upholstery and a wide selection of interior equipment. With the purchase of any new Class A, B or C motor home, we offer a comprehensive 12-month/15,000-mile warranty on the coach and a 3-year/36,000-mile structural warranty on sidewalls and floors of the Class A and C motor homes.
Our Class A, B and C motor homes are sold by dealers in the retail market with manufacturer’s suggested retail prices ranging from approximately $65,000 to $317,000, depending on size and model, plus optional equipment and delivery charges. Our motor homes range in length from 22 to 42 feet.
2
Unit sales of our recreation vehicles for the last five fiscal years were as follows:
|
|
|
|
|
|
|
|
|
|
|
|
|
|
|
|
|
|
|
|
|
|
|
|
|
|
Year Ended (1) |
|||||||||||||||||||
|
Unit Sales |
|
Aug. 29, |
|
% |
|
Aug. 30, |
|
% |
|
Aug. 25, |
|
% |
|
Aug. 26, |
|
% |
|
Aug. 27, |
|
% |
|
|
Class A |
|
822 |
|
37.4 |
|
3,029 |
|
47.3 |
|
5,031 |
|
53.1 |
|
4,455 |
|
45.3 |
|
6,674 |
|
62.7 |
|
|
Class B |
|
149 |
|
6.8 |
|
140 |
|
2.2 |
|
- - - |
|
- - - |
|
- - - |
|
- - - |
|
- - - |
|
- - - |
|
|
Class C |
|
1,225 |
|
55.8 |
|
3,238 |
|
50.5 |
|
4,438 |
|
46.9 |
|
5,388 |
|
54.7 |
|
3,963 |
|
37.3 |
|
|
Total motor homes |
|
2,196 |
|
100.0 |
|
6,407 |
|
100.0 |
|
9,469 |
|
100.0 |
|
9,843 |
|
100.0 |
|
10,637 |
|
100.0 |
|
(1) The fiscal year ended August 30, 2008 contained 53 weeks; all other fiscal years contained 52 weeks.
The primary use of recreation vehicles for leisure travel and outdoor recreation has historically led to a peak retail selling season concentrated in the spring and summer months. Our sales of recreation vehicles are generally influenced by this pattern in retail sales, but can also be affected by the level of dealer inventory. Our products are generally manufactured against orders from dealers.
Motor Home Parts and Services
Motor home parts and service activities represent revenues generated by service work we perform for retail customers at our Forest City, Iowa facility and parts we sell to our dealers. As of August 29, 2009, our parts inventory was approximately $2.5 million and is located in a 450,000-square foot warehouse with what we believe to be the most sophisticated distribution and tracking system in the industry. Our competitive strategy is to provide proprietary manufactured parts through our dealer network, which we believe increases customer satisfaction and the value of our motor homes.
Other Manufactured Products
We manufacture aluminum extrusions which are sold to approximately 70 customers. To a limited extent, we manufacture other component parts sold to outside manufacturers. We also manufacture commercial vehicles which are motor home shells, primarily custom designed for the buyer’s special needs and requirements, such as law enforcement command centers and mobile medical and dental clinics. These commercial vehicles are sold through our dealer network.
Production
We generally produce motor homes to order from dealers. We have the ability to increase our capacity by scheduling overtime and/or hiring additional production employees or to decrease our capacity through the use of shortened workweeks and/or reducing head count.
Our Forest City facilities have been designed to provide vertically integrated production line manufacturing. As of August 29, 2009, we also operated a fiberglass manufacturing facility in Hampton, Iowa, and a Class B motor home assembly plant and a cabinet products manufacturing facility in Charles City, Iowa. On June 11, 2009, we announced the decision to close the Hampton facility and to relocate a portion of the production capabilities for fiberglass components to our Forest City facilities with the balance to be outsourced. This transition is expected to be completed during the first quarter of Fiscal 2010. Our motor home bodies are made from various materials and structural components which are typically laminated into rigid, lightweight panels. Body designs are developed with computer design and analysis and subjected to a variety of tests and evaluations to meet our standards and requirements. We manufacture a number of components utilized in our motor homes, with the principal exceptions being chassis, engines, generators and appliances.
Most of our raw materials such as steel, aluminum, fiberglass and wood products are obtainable from numerous sources. Certain parts, especially motor home chassis, are available from a small group of suppliers. We are currently purchasing Class A and C chassis from Ford Motor Company, Class A chassis from Freightliner Custom Chassis Corporation (a Daimler company) and Workhorse Custom Chassis, LLC (a Navistar Company) and Class A, B and C chassis from Chrysler Motors LLC. In Fiscal 2009, only one vendor, Chrysler Motors LLC, individually, accounted for more than 10 percent (11.6 percent) of our raw material purchases.
Backlog
As of August 29, 2009, we had a backlog for our motor homes of 940 units with an approximate revenue value of $86.6 million. In comparison as of August 30, 2008, our backlog was 596 units with an approximate revenue value of $50.6 million.
3
Distribution and Financing
We market our recreation vehicles on a wholesale basis to a diversified independent dealer organization located throughout the United States and, to a limited extent, in Canada. Foreign sales, including Canada, were less than 8 percent of net revenues during each of the past three fiscal years. As of August 29, 2009 and August 30, 2008, our motor home dealer organization in the United States and Canada included approximately 245 and 280 dealer locations, respectively. The contraction in our dealer locations during Fiscal 2009 was a direct result of the challenging market conditions. We have a number of dealers that carry our Winnebago, Itasca and ERA brands; we count each dealer location only once no matter how many of our brands are offered at each such dealer location. During Fiscal 2009, four dealer organizations accounted for approximately 25 percent of our net revenues. One of our dealer organizations, FreedomRoads, LLC, accounted for 13 percent of our net revenue, as they sold our products in 27 of their dealership locations across 18 U.S. states.
We have sales and service agreements with dealers which generally have a term of ten years but are subject to annual review. Many of the dealers are also engaged in other areas of business, including the sale of automobiles, and many dealers carry one or more competitive lines of motor homes. We continue to place high emphasis on the capability of our dealers to provide complete service for our recreation vehicles. Dealers are obligated to provide full service for owners of our recreation vehicles or, in lieu thereof, to secure such service at their own expense from other authorized providers.
We advertise and promote our products through national RV magazines, the distribution of product brochures, the Go RVing national advertising campaign sponsored by RVIA, direct-mail advertising campaigns, various national promotional opportunities and on a local basis through trade shows, television, radio and newspapers, primarily in connection with area dealers.
Recreation vehicle sales to dealers are made on cash terms. Most dealers are financed on a “floorplan” basis under which a bank or finance company lends the dealer all, or substantially all, of the purchase price, collateralized by a security interest in the merchandise purchased. As is customary in the recreation vehicle industry, we typically enter into a repurchase agreement with a lending institution financing a dealer’s purchase of our product upon the lending institution’s request and after completion of a credit check of the dealer involved. Our repurchase agreements provide that for up to 18 months after a unit is financed, in the event of default by the dealer on the agreement to pay the lending institution and repossession of the unit(s) by the lending institution, we will repurchase the financed merchandise. Our maximum exposure for repurchases varies significantly from time to time, depending upon general economic conditions, seasonal shipments, competition, dealer organization, gasoline availability and access to and the cost of bank financing. (See Note 10 to the Consolidated Financial Statements.)
Competition
The recreation vehicle market is highly competitive with more than 20 other manufacturers selling products which compete directly with our products. The competition in the motor home industry is based upon design, price, quality and service of the products. We believe our principal competitive advantages are our brand strength, product quality and our service after the sale. We believe that our products command a price premium as a result of these competitive advantages.
There have been significant changes within the motor home industry during the past year, as follows:
|
|
|
|
§ |
In December 2008, Coachmen Industries, Inc. sold their RV assets to Forest River, Inc., a subsidiary of Berkshire Hathaway, Inc., for approximately $41 million. |
|
§ |
In February 2009, Rexhall Industries, Inc. filed for Chapter 11 bankruptcy protection. |
|
§ |
In March 2009, three additional RV manufacturing companies filed for Chapter 11 bankruptcy protection: Country Coach, LLC, Monaco Coach Corporation (Monaco) and Fleetwood Enterprises, Inc. (Fleetwood). |
|
§ |
In June 2009, certain RV assets of Monaco were purchased by Navistar International Corp. for approximately $47 million and a new company named Monaco RV, LLC was established. |
|
§ |
In July 2009, certain motor home assets of Fleetwood were purchased by American Industrial Partners Capital Fund IV, L.P. for approximately $35 million and a new company named Fleetwood RV, Inc. was established. |
Due to the market disruption caused by the actions as described above of some of our larger competitors, we believe that we have unique opportunity in the current market environment to increase our market share, shelf space and points of distribution.
4
As evidenced by the following table, we are the largest combined Class A and C motor home manufacturer in the U.S. in terms of retail registrations as reported by Statistical Surveys, Inc. (Statistical Surveys) for the eight months ended August 31, 2009.
|
|
|
|
|
|
|
|
|
|
|
|
|
|
|
|
|
|
|
|
|
|
|
|
|
|
|
|
|
|
|
|
|
8 Months Ended August 31, 2009 |
||||||||||||||||||||||||
|
|
|
|
Class A |
|
Class C |
|
Total Class A |
|
|||||||||||||||||||
|
|
|
|
Gas |
|
% of |
|
Diesel |
|
% of |
|
Total |
|
% of |
|
Units |
|
% of |
|
Units |
|
% of |
|
|||||
|
1. |
Winnebago Industries, Inc. |
|
840 |
|
23.2 |
|
|
453 |
|
10.8 |
|
|
1,293 |
|
16.5 |
|
|
1,313 |
|
22.5 |
|
|
2,606 |
|
19.1 |
|
|
|
2. |
Thor Industries, Inc. |
|
823 |
|
22.7 |
|
|
335 |
|
8.0 |
|
|
1,158 |
|
14.8 |
|
|
1,222 |
|
21.0 |
|
|
2,380 |
|
17.4 |
|
|
|
3. |
Fleetwood RV, Inc. (1) |
|
746 |
|
20.6 |
|
|
719 |
|
17.1 |
|
|
1,465 |
|
18.7 |
|
|
675 |
|
11.6 |
|
|
2,140 |
|
15.7 |
|
|
|
4. |
Forest River, Inc. (2) |
|
438 |
|
12.1 |
|
|
224 |
|
5.3 |
|
|
662 |
|
8.5 |
|
|
1,040 |
|
17.8 |
|
|
1,702 |
|
12.5 |
|
|
|
5. |
Monaco RV, LLC (3) |
|
285 |
|
7.9 |
|
|
994 |
|
23.6 |
|
|
1,279 |
|
16.3 |
|
|
257 |
|
4.4 |
|
|
1,536 |
|
11.2 |
|
|
|
6. |
Tiffin Motor Homes, Inc. |
|
189 |
|
5.2 |
|
|
704 |
|
16.7 |
|
|
893 |
|
11.4 |
|
|
1 |
|
- - - |
|
|
894 |
|
6.5 |
|
|
|
7. |
Gulfstream Coach |
|
96 |
|
2.6 |
|
|
156 |
|
3.7 |
|
|
252 |
|
3.2 |
|
|
397 |
|
6.8 |
|
|
649 |
|
4.8 |
|
|
|
8. |
Jayco, Inc. |
|
1 |
|
- - - |
|
|
25 |
|
0.6 |
|
|
26 |
|
0.3 |
|
|
601 |
|
10.3 |
|
|
627 |
|
4.6 |
|
|
|
9. |
Newmar Corporation |
|
116 |
|
3.2 |
|
|
291 |
|
6.9 |
|
|
407 |
|
5.2 |
|
|
- - - |
|
- - - |
|
|
407 |
|
3.0 |
|
|
|
10. |
Other |
|
89 |
|
2.5 |
|
|
304 |
|
7.3 |
|
|
393 |
|
5.1 |
|
|
325 |
|
5.6 |
|
|
718 |
|
5.2 |
|
|
|
Total |
|
3,623 |
|
100.0 |
|
|
4,205 |
|
100.0 |
|
|
7,828 |
|
100.0 |
|
|
5,831 |
|
100.0 |
|
|
13,659 |
|
100.0 |
|
|
|
(1) Includes all Fleetwood retail
registrations.
(2) Includes Coachmen retail registrations.
(3) Includes all Monaco retail registrations.
Backlog
Our order backlog for motor homes is included in Item 7, “Management’s Discussion and Analysis of Financial Condition and Company and Business Outlook” below.
Regulations, Trademarks and Patents
We are subject to a variety of federal, state and local laws and regulations, including the National Traffic and Motor Vehicle Safety Act, under which the National Highway Traffic Safety Administration may require manufacturers to recall recreation vehicles that contain safety-related defects, and numerous state consumer protection laws and regulations relating to the operation of motor vehicles, including so-called “Lemon Laws.” We are also subject to regulations established by the Occupational Safety and Health Administration (OSHA). Our facilities are periodically inspected by federal and state agencies, such as OSHA. We believe that our products and facilities comply in all material respects with the applicable vehicle safety, consumer protection, RVIA and OSHA regulations and standards. Amendments to any of these regulations or the implementation of new regulations, however, could significantly increase the cost of manufacturing, purchasing, operating or selling our products and could have a material adverse effect on our results of operations. Our failure to comply with present or future regulations could result in fines being imposed on us, potential civil and criminal liability, suspension of sales or production or cessation of operations. In addition, a major product recall could have a material adverse effect on our results of operations.
Our operations are subject to a variety of federal and state environmental laws and regulations relating to the use, generation, storage, treatment, emission and disposal of hazardous materials and wastes and noise pollution. Although we believe that we currently are in material compliance with applicable environmental regulations, the failure by us to comply with present or future laws and regulations could result in fines being imposed on us, potential civil and criminal liability, suspension of production or operations, alterations to the manufacturing process or costly cleanup or capital expenditures.
We have several registered trademarks which include: Adventurer, Aspect, Cambria, Destination, Ellipse, ERA, Horizon, Impulse, Itasca, Journey, Latitude, Meridian, Navion, Outlook, Sightseer, Spirit, Suncruiser, Sunova, Sunrise, Sunstar, Tour, Vectra, View, Vista, Voyage, and Winnebago. We believe that our trademarks and trade names are significant to our business and we will vigorously protect them against infringement. We are not dependent upon any patents or technology licenses for the conduct of our business.
5
Research and Development
Research and development expenditures are expensed as incurred. During Fiscal 2009, 2008 and 2007, we spent approximately $3.3 million, $4.1 million and $4.3 million, respectively on research and development activities.
Human Resources
At the end of Fiscal 2009, 2008 and 2007, we employed approximately 1,630, 2,250 and 3,310 persons, respectively. None of our employees are covered under a collective bargaining agreement. We believe our relations with our employees are good.
ITEM 1A. Risk Factors
The following risk factors should be considered carefully in addition to the other information contained in this Annual Report on Form 10-K. The risks and uncertainties described below are not the only ones we face, but represent some of the most significant risk factors that we believe may adversely affect the RV industry and our business, operations or financial position.
Interest Rates and Credit Availability
Our business is affected by the availability and terms of the financing to dealers. Generally, recreation vehicle dealers finance their purchases of inventory with financing provided by lending institutions. The decrease in the availability of this type of wholesale financing has prevented many dealers from carrying adequate levels of inventory, which limits product offerings and leads to reduced demand. Two financial flooring institutions held 53 percent of our total financed dealer inventory dollars that were outstanding at August 29, 2009.
Our business is also affected by the availability and terms of financing to retail purchasers. Customers purchasing a motor home may elect to finance their purchase through the dealership or a financial institution of their choice. Substantial increases in interest rates and decreases in the general availability of credit have also had an adverse impact upon our business and results of operations in the past and may continue to do so in the future. In particular, the current credit availability crisis has had and may continue to have a significant impact on our business.
General Economic Conditions and Certain Other External Factors
Companies within the recreation vehicle industry are subject to volatility in operating results due primarily to general economic conditions. Specific factors affecting the recreation vehicle industry include:
|
|
|
|
|
|
• |
overall consumer confidence and the level of discretionary consumer spending; |
|
|
• |
employment trends; |
|
|
• |
the adverse impact of global tensions on consumer spending and travel-related activities; and |
|
|
• |
adverse impact on margins of increases in raw material costs which we are unable to pass on to customers without negatively affecting sales. |
Maintaining Adequate Liquidity and Capital Resources
Although we have historically generated revenues from our operations to pay operating expenses, make capital expenditures, buy back stock and pay cash dividends, our ability to continue to meet our cash requirements over the long term may be substantially more difficult. As a result of the financial crisis and the global recession, our revenues generated from motor home sales have been significantly reduced and our ability to liquidate our auction rate securities investments has been limited, further constraining our liquidity and capital resources. We have taken a number of steps, as discussed in “Item 7 – Management’s Discussion and Analysis of Financial Condition and Results of Operations – Analysis of Financial Condition, Liquidity and Resources” below, to increase our cash position and ensure adequate liquidity. However, the continuation of reduced demand for our products could weaken the Company’s liquidity position and materially adversely affect net revenues available for the Company’s anticipated cash needs. To the extent the initiatives we have undertaken are not successful or we are unable to successfully implement other alternative actions, our ability to cover both short-term and long-term operation requirements would be significantly adversely affected.
6
Cyclicality and Seasonality
The recreation vehicle industry has been characterized by cycles of growth and contraction in consumer demand, reflecting prevailing economic and demographic conditions, which affect disposable income for leisure-time activities. Consequently, the results for any prior period may not be indicative of results for any future period.
Seasonal factors, over which we have no control, also have an effect on the demand for our products. Demand in the recreation vehicle industry generally declines over the winter season, while sales are generally highest during the spring and summer months. Also, unusually severe weather conditions in some markets may impact demand.
Competition
The market for recreation vehicles is very competitive. Competition in this industry is based upon price, design, value, quality and service. There can be no assurance that existing or new competitors will not develop products that are superior to our recreation vehicles or that achieve better consumer acceptance, thereby adversely affecting market share, sales volume and profit margins.
Potential Repurchase Liabilities
In accordance with customary practice in the recreation vehicle industry, we enter into formal repurchase agreements with lending institutions pursuant to which we agree, in the event of a default by an independent retailer in its obligation to a lender and repossession of the unit(s) by the lending institution, we will repurchase units at declining prices over the term of the agreements, which can last up to 18 months. The difference between the gross repurchase price and the price at which the repurchased product can then be resold, which is typically at a discount to the gross repurchase price, represents a potential expense to us. Our maximum potential exposure under these formal repurchase agreements was approximately $90.6 million at August 29, 2009.
In certain instances, we also repurchase inventory from our dealers due to state law or regulatory requirements that govern voluntary or involuntary terminations. Incremental repurchase exposure beyond repurchase agreements was approximately $3.1 million at August 29, 2009.
Prior to Fiscal 2009, our losses associated with repurchases have not been material. However, the substantial decrease in retail demand for recreation vehicles in the past 12 months and tightened credit standards by lenders resulted in a significant increase in defaults by our dealers. If we are obligated to repurchase a larger number of motor homes in the future, this would increase our costs and could be material. (See Note 10 to the Consolidated Financial Statements.)
Fuel Availability and Prices
Gasoline or diesel fuel is required for the operation of motorized recreation vehicles. There can be no assurance that the supply of these petroleum products will continue uninterrupted or that the price or tax on these petroleum products will not significantly increase in the future. Fuel shortages and substantial increases in fuel prices have had a material adverse effect on the recreation vehicle industry as a whole in the past and could have a material adverse effect on us in the future.
Dependence on Chassis Suppliers
Most RV components are readily available from numerous sources. However, decisions by suppliers to decrease production, utilize production internally or shortages, production delays or work stoppages by the employees of such suppliers could have a material adverse effect on our ability to produce motor homes and ultimately, on the results of operations. A few components are produced by only a small group of quality suppliers that have the capacity to supply large quantities on a national basis. This is especially true in the case of motor home chassis where Ford Motor Company, Freightliner Custom Chassis Corporation, Workhorse Custom Chassis and Chrysler Motors LLC are our major suppliers. Our relationship with our chassis suppliers is similar to our other supplier relationships in that no special contractual commitments are engaged in by either party. Historically, chassis suppliers resort to an industry-wide allocation system during periods when supply is restricted. These allocations have been based on the volume of chassis previously purchased. Sales of motor homes rely on chassis and are affected accordingly. If economic conditions improve and dealers begin to replenish their inventory, there may be a shortage of chassis for a period of time, which would adversely affect our production capacity and results of operations.
7
Warranty Claims
We receive warranty claims from our dealers in the ordinary course of our business. Although we maintain reserves for such claims, which to date have been adequate, there can be no assurance that warranty expense levels will remain at current levels or that such reserves will continue to be adequate. A significant increase in warranty claims exceeding our current warranty expense levels could have a material adverse effect on our results of operations, financial condition and cash flows.
In addition to the costs associated with the contractual warranty coverage provided on our motor homes, we also occasionally incur costs as a result of additional service actions not covered by our warranties, including product recalls and customer satisfaction actions. Although we estimate and reserve for the cost of these service actions, there can be no assurance that expense levels will remain at current levels or such reserves will continue to be adequate.
Product Liability
We are involved in legal proceedings in the ordinary course of business, including a variety of warranty, “Lemon Law” and product liability claims typical in the recreation vehicle industry. We have an insurance policy covering product liability, however, we are self-insured for a portion of product liability claims. Self-insurance retention liability for at least the past five fiscal years was $2.5 million per occurrence and $6.0 million in aggregate per policy year. In the event that the annual aggregate of the self-insured retention is exhausted by payment of claims and defense expenses, a deductible of $1.0 million, excluding defense expenses, is applicable to each claim covered under this insurance policy. We cannot be certain that our insurance coverage will be sufficient to cover all future claims against us, which may have a material adverse effect on our results of operations and financial condition. In addition, if these claims rise to a level of frequency or size that are significantly higher than similar claims made against our competitors, our reputation and business may be harmed.
Government Regulation
We are subject to numerous federal, state and local regulations governing the manufacture and sale of our products, including the provisions of the National Traffic and Motor Vehicle Safety Act (“Motor Vehicle Act”), and the safety standards for recreation vehicles and components which have been established under the Motor Vehicle Act by the Department of Transportation. The Motor Vehicle Act authorizes the National Highway Traffic Safety Administration to require a manufacturer to recall and repair vehicles which contain certain hazards or defects. Any recalls of our vehicles, voluntary or involuntary, could have a material adverse effect on our results of operations, financial condition and cash flows.
We are also subject to federal and numerous state consumer protection and unfair trade practice laws and regulations relating to the sale, transportation and marketing of motor vehicles, including so-called “Lemon Laws.” Federal and state laws and regulations also impose upon vehicle operators various restrictions on the weight, length and width of motor vehicles, including motor homes that may be operated in certain jurisdictions or on certain roadways. Certain jurisdictions also prohibit the sale of vehicles exceeding length restrictions.
Finally, federal and state authorities also have various environmental control standards relating to air, water, noise pollution and hazardous waste generation and disposal which affect us and our operations. Failure to comply with any of the foregoing laws or regulations could have an adverse impact on our results of operations, financial condition and cash flows.
ITEM 1B. Unresolved Staff Comments
None
8
Our principal manufacturing, maintenance and service operations are conducted in multibuilding complexes owned by us. The following sets forth our material facilities as of August 29, 2009:
|
|
|
|
|
|
|
|
|
|
|
|
|
|
Location |
|
Facility Type/Use |
|
No. of |
|
Owned or Leased |
|
Square |
|
||
|
|
|
|
|
|
|
|
|
|
|
||
|
Forest City, Iowa |
|
Manufacturing, maintenance, service and office |
|
31 |
|
|
Owned |
|
1,593,000 |
|
|
|
Forest City, Iowa |
|
Warehouse |
|
4 |
|
|
Owned |
|
702,000 |
|
|
|
Charles City, Iowa |
|
Manufacturing |
|
2 |
|
|
Owned |
|
161,000 |
|
|
|
Charles City, Iowa |
|
Assets Held for Sale (Manufacturing Facility) |
|
3 |
|
|
Owned |
|
191,000 |
|
|
|
Hampton, Iowa |
|
Assets Held for Sale (Manufacturing Facility) |
|
2 |
|
|
Owned |
|
135,000 |
|
|
|
|
|
|
|
42 |
|
|
|
|
2,782,000 |
|
|
Our facilities in Forest City are located on approximately 500 acres of land, all owned by us. We lease 244,000 square feet of our warehouse facilities in Forest City to others. Most of our buildings are of steel or steel and concrete construction and are protected from fire with high-pressure sprinkler systems, dust collector systems, automatic fire doors and alarm systems. We believe that our facilities and equipment are well maintained, in excellent condition and suitable for the purposes for which they are intended.
For our new credit facility, as further described in Note 7 to the Consolidated Financial Statements, we have committed to encumber substantially all of our real property for the benefit of the lender under such facility.
We are involved in various legal proceedings which are ordinary routine litigation incidental to our business, some of which are covered in whole or in part by insurance. While it is impossible to estimate with certainty the ultimate legal and financial liability with respect to this litigation, we believe that while the final resolution of any such litigation may have an impact on our consolidated results for a particular reporting period, the ultimate disposition of such litigation will not have any material adverse effect on our financial position, results of operations or liquidity.
ITEM 4. Submission of Matters to a Vote of Security Holders
None
9
Executive Officers of the Registrant
|
|
|
|
|
|
|
Name |
|
Office (Year First Elected an Officer) |
|
Age |
|
Robert J. Olson + |
|
Chairman of the Board, Chief Executive Officer and President (1996) |
|
58 |
|
Raymond M. Beebe |
|
Vice President, General Counsel & Secretary (1974) |
|
67 |
|
Robert L. Gossett |
|
Vice President, Administration (1998) |
|
58 |
|
Roger W. Martin |
|
Vice President, Sales and Marketing (2003) |
|
49 |
|
Sarah N. Nielsen |
|
Vice President, Chief Financial Officer (2005) |
|
36 |
|
William J. O’Leary |
|
Vice President, Product Development (2001) |
|
60 |
|
Randy J. Potts |
|
Vice President, Manufacturing (2006) |
|
50 |
|
Brian J. Hrubes |
|
Controller (1996) |
|
58 |
|
Donald L. Heidemann |
|
Treasurer (2007) |
|
37 |
+ Director
Officers are elected annually by the Board of Directors. There are no family relationships between or among any of the Corporate Officers or Directors of the Company.
Mr. Olson has over 40 years of experience with Winnebago Industries. He was elected Chairman of the Board and Chief Executive Officer on May 5, 2008. He has been President since 2007, previously serving as Senior Vice President, Operations, since January 2006. He served as Vice President, Manufacturing, from August 1996 to January 2006.
Mr. Beebe has over 35 years of experience with Winnebago Industries. He has been Vice President, General Counsel and Secretary since 1986.
Mr. Gossett has over 10 years of experience with Winnebago Industries. He has been Vice President, Administration since joining the Company in 1998.
Mr. Martin has over 15 years of experience with Winnebago Industries. He has been Vice President, Sales and Marketing since February 2003. He joined the Company as Director of Marketing in 1994.
Ms. Nielsen has four years of experience with Winnebago Industries. She has been Vice President, Chief Financial Officer since November 2005. Ms. Nielsen joined the Company in August 2005. Prior to joining Winnebago Industries, she was employed by Deloitte & Touche LLP since 1995 in the position of Assurance and Advisory Services Senior Manager from 2003 to August 2005.
Mr. O’Leary has over 37 years of experience with Winnebago Industries. He has been Vice President, Product Development since 2001.
Mr. Potts has over 26 years of experience with Winnebago Industries. He was elected Vice President, Manufacturing in October 2006. He served as Director of Manufacturing from February 2006 to October 2006. Prior to that time, he served as General Manager of Manufacturing Services since 2001.
Mr. Hrubes has over 38 years of experience with Winnebago Industries. He has been Controller since December 1996.
Mr. Heidemann has two years of experience with Winnebago Industries and was elected to the position of Treasurer in August 2007. Prior to joining Winnebago Industries, Mr. Heidemann served in various treasury positions for Select Comfort Corporation from 2003 to July 2007.
10
ITEM 5. Market for the Registrant’s Common Equity, Related Stockholder Matters and Issuer Purchases of Equity Securities
Market Information
Our common stock is listed on the New York and Chicago Exchanges with the ticker symbol of WGO.
Below are the New York Stock Exchange high, low and closing prices of Winnebago Industries, Inc. stock for each quarter of Fiscal 2009 and Fiscal 2008:
|
|
|
|
|
|
|
|
|
|
|
|
|
|
|
|
|
|
|
|
|
|
|
|
|
Fiscal 2009 |
High |
Low |
Close |
Fiscal 2008 |
High |
Low |
Close |
|||||||||||||||
|
First Quarter |
|
$ |
15.20 |
|
$ |
4.22 |
|
$ |
5.88 |
|
|
First Quarter |
|
$ |
30.09 |
|
$ |
20.66 |
|
$ |
21.27 |
|
|
Second Quarter |
|
|
7.47 |
|
|
3.90 |
|
|
4.05 |
|
|
Second Quarter |
|
|
24.03 |
|
|
18.16 |
|
|
20.07 |
|
|
Third Quarter |
|
|
9.23 |
|
|
3.14 |
|
|
7.67 |
|
|
Third Quarter |
|
|
24.14 |
|
|
13.98 |
|
|
14.92 |
|
|
Fourth Quarter |
|
|
12.23 |
|
|
6.01 |
|
|
11.62 |
|
|
Fourth Quarter |
|
|
14.94 |
|
|
9.09 |
|
|
11.35 |
|
Holders
Shareholders of record as of October 6, 2009: 3,642.
Dividends Paid Per Share
Listed below are the dates paid and amounts per share for Fiscal 2009 and Fiscal 2008:
|
|
|
|
|
|
|
|
|
|
|
|
||
|
Fiscal 2009 |
|
|
|
|
|
Fiscal 2008 |
|
|
|
|
||
|
October 6, 2008 |
|
$ |
0.12 |
|
|
October 8, 2007 |
|
$ |
0.12 |
|
||
|
|
|
|
|
|
|
January 7, 2008 |
|
|
|
0.12 |
|
|
|
|
|
|
|
|
|
April 7, 2008 |
|
|
|
0.12 |
|
|
|
|
|
|
|
|
|
July 8, 2008 |
|
|
0.12 |
|
|
|
|
|
|
|
|
|
Total |
|
$ |
0.48 |
|
|
||
Dividends of $0.12 per share (approximately $3.5 million) were paid in the first quarter of Fiscal 2009; however, on October 15, 2008, our Board of Directors suspended future cash dividend payments in order to conserve capital and to maintain liquidity.
Our new credit facility, as further described in Note 7 to the Consolidated Financial Statements, contains typical covenants that limit our ability, among other things, to pay certain dividends and distributions including stock repurchases. Except for limited redemptions of Winnebago Industries’ common stock from employees, the credit facility prohibits us from making any cash dividends, distributions or payments with respect to or purchases of Winnebago Industries’ common stock without the consent of Burdale Capital Finance, Inc., as Agent and the lenders thereunder, in their sole discretion.
Issuer Purchases of Equity Securities
On December 19, 2007, the Board of Directors authorized the repurchase of outstanding shares of our common stock, depending on market conditions, for an aggregate consideration of up to $60 million. There is no time restriction on this authorization. During the fourth quarter of Fiscal 2009, there were no shares repurchased under this authorization. As of August 29, 2009, approximately 31,000 shares have been repurchased under the authorization, at an aggregate cost of approximately $407,000, which leaves approximately $59.6 million remaining under this authorization.
11
Equity Compensation Plan Information
The following table provides information as of August 29, 2009 with respect to shares of our common stock that may be issued under our existing equity compensation plans:
|
|
|
|
|
|
|
|
|
|
|
|
|
(Adjusted for the 2-for-1 |
(a) |
(b) |
(c) |
|||||||
|
Equity compensation plans approved by shareholders |
|
|
1,010,224 |
(1) |
$ |
27.31 |
|
|
1,012,771 |
(2) |
|
Equity compensation plans not approved by shareholders (3) |
87,881 |
(4) |
14.90 |
N/A |
(5) |
|||||
|
Total |
1,098,105 |
$ |
26.32 |
1,012,771 |
||||||
|
|
|
|
(1) |
This number includes 655,388 stock options granted under the 2004 Incentive Compensation Plan (the “Plan”). Also included are 354,836 options granted under the 1997 Stock Option Plan. |
|
(2) |
This number represents stock options available for grant under the Plan as of August 29, 2009. The Plan replaced the 1997 Stock Option Plan effective January 1, 2004. No new grants may be made under the 1997 Stock Option Plan. Any stock options previously granted under the 1997 Stock Option Plan will continue to be exercisable in accordance with their original terms and conditions. |
|
(3) |
Our sole equity compensation plan not previously submitted to our shareholders for approval is the Directors’ Deferred Compensation Plan. The Board of Directors may terminate the Directors’ Deferred Compensation Plan at any time. If not terminated earlier, the Directors’ Deferred Compensation Plan will automatically terminate on June 30, 2013. For a description of the key provisions of the Directors’ Deferred Compensation Plan, see the information in our Proxy Statement for the Annual Meeting of Shareholders scheduled to be held December 15, 2009 under the caption “Director Compensation,” which information is incorporated by reference herein. |
|
(4) |
Represents shares of common stock issued to a trust which underlie stock units, payable on a one-for-one basis, credited to stock unit accounts as of August 29, 2009 under the Directors’ Deferred Compensation Plan. |
|
(5) |
The table does not reflect a specific number of stock units which may be distributed pursuant to the Directors’ Deferred Compensation Plan. The Directors’ Deferred Compensation Plan does not limit the number of stock units issuable thereunder. The number of stock units to be distributed pursuant to the Directors’ Deferred Compensation Plan will be based on the amount of the director’s compensation deferred and the per share price of our common stock at the time of deferral. |
12
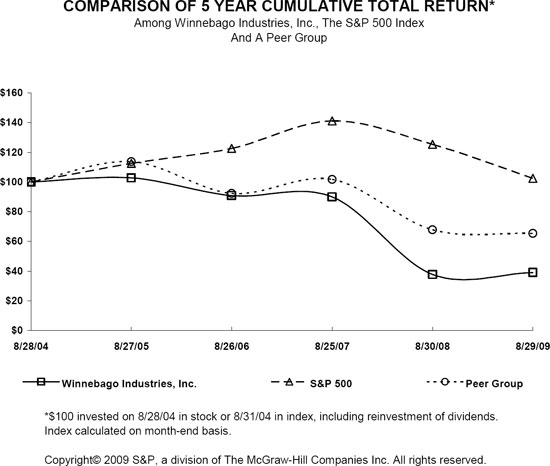
Performance Graph
The following graph compares our five-year cumulative total shareholder return (including reinvestment of dividends) with the cumulative total return on the Standard & Poor’s 500 Index and a peer group.(1) It is assumed in the graph that $100 was invested in our common stock, in the stock of the companies in the Standard & Poor’s 500 Index and in the stocks of the peer group companies on August 28, 2004 and that all dividends received within a quarter were reinvested in that quarter. In accordance with the guidelines of the Securities and Exchange Commission, the shareholder return for each entity in the peer group index has been weighted on the basis of market capitalization as of each annual measurement date set forth in the graph.
|
|
|
|
|
|
|
|
|
|
|
|
|
|
|
|
|
|
|
|
|
|
|
|
Base Period |
|
Indexed Returns |
|||||||||||||||
|
Company/Index |
08/27/05 |
08/26/06 |
08/25/07 |
08/30/08 |
08/29/09 |
||||||||||||||
|
Winnebago Industries, Inc. |
|
|
100.00 |
|
|
102.78 |
|
|
90.81 |
|
|
89.98 |
|
|
37.67 |
|
|
38.95 |
|
|
S&P 500 Index |
|
|
100.00 |
|
|
112.56 |
|
|
122.56 |
|
|
141.11 |
|
|
125.38 |
|
|
102.50 |
|
|
Peer Group (1) |
|
|
100.00 |
|
|
113.70 |
|
|
92.28 |
|
|
101.69 |
|
|
67.80 |
|
|
65.43 |
|
|
|
|
|
(1) |
The peer group companies consisting of Thor Industries, Inc., Polaris Industries, Inc. and Brunswick Corporation were selected by us as they also manufacture recreational products. Coachmen Industries, Inc., a member of our peer group in prior fiscal years, has been omitted from our peer group as its RV related assets were sold to Forest River, Inc., a subsidiary of Berkshire Hathaway, Inc. in December 2008. Fleetwood Enterprises, Inc. and Monaco Coach Corporation, members of the peer group in prior fiscal years, were also omitted from our peer group because they filed for protection under Chapter 11 of the U.S. Bankruptcy Code in March of 2009 and their securities are no longer traded on the New York Stock Exchange (NYSE). |
ITEM 6. Selected Financial Data (See pages 62 and 63)
13
ITEM 7. Management’s Discussion and Analysis of Financial Condition and Results of Operations
Executive Overview
Winnebago Industries, Inc. is the leading U.S. manufacturer of motor homes with a proud history of manufacturing recreation vehicles for more than 50 years. Our strategy is to manufacture quality motor homes in a profitable manner. We produce all of our motor homes in highly vertically integrated manufacturing facilities in the state of Iowa. We distribute our products through independent dealers throughout the United States and Canada, who then retail the products to the end consumer. We have led the industry with the highest market share in the U.S. of Class A and C motor homes combined for the past eight calendar years and in Calendar 2009 through August 31, 2009. We began producing Class B motor homes in February 2008 and in Calendar Year through August 31, 2009, we hold the number three U.S. position in retail unit market share. See our U.S. retail unit market share for all categories in the following table:
|
|
|
|
|
|
|
|
|
|
|
|
|
|
|
|
|
|
Winnebago Industries U.S. Retail Market Share (1) |
|||||||||||
|
|
|
Calendar Year Through August 31, |
|
Calendar Year |
|||||||||
|
|
|
2009 |
|
2008 |
|
2008 |
|
2007 |
|
||||
|
Class A gas |
|
23.2 |
% |
|
23.3 |
% |
|
23.2 |
% |
|
22.0 |
% |
|
|
Class A diesel |
|
10.8 |
% |
|
7.6 |
% |
|
8.1 |
% |
|
8.9 |
% |
|
|
Total Class A |
|
16.5 |
% |
|
15.2 |
% |
|
15.3 |
% |
|
15.1 |
% |
|
|
Class C |
|
22.5 |
% |
|
23.0 |
% |
|
22.9 |
% |
|
24.0 |
% |
|
|
Total Class A and C |
|
19.1 |
% |
|
18.5 |
% |
|
18.3 |
% |
|
18.5 |
% |
|
|
Class B |
|
16.1 |
% |
|
2.8 |
% |
|
3.7 |
% |
|
0.0 |
% |
|
|
|
|
|
(1) |
As reported by Statistical Surveys. |
Company and Business Outlook
The RV industry saw substantial reductions in wholesale motor home shipments (down nearly 50 percent) and retail registrations (down nearly 40 percent) during Calendar 2008 as compared to 2007. The trend has worsened thus far in Calendar 2009, with motor home shipments down nearly 70 percent and retail registrations down over 40 percent, as detailed in the table below:
|
|
|
|
|
|
|
|
|
|
|
|
|
|
|
|
|
|
|
|
|
|
|
|
|
|
|
|
|
|
Industry Wholesale Shipments (1) |
|
Industry Retail Registration (2) |
|||||||||||||||||||||
|
(In units) |
|
|
2008 |
|
|
2007 |
|
Decrease |
|
% of Decrease |
|
|
2008 |
|
|
2007 |
|
Decrease |
|
% of Decrease |
|
||||
|
First quarter |
|
|
10,400 |
|
|
13,600 |
|
(3,200 |
) |
|
(23.5 |
) |
|
|
8,800 |
|
|
11,500 |
|
(2,700 |
) |
|
(23.5 |
) |
|
|
Second quarter |
|
|
8,600 |
|
|
15,000 |
|
(6,400 |
) |
|
(42.7 |
) |
|
|
9,800 |
|
|
15,100 |
|
(5,300 |
) |
|
(35.1 |
) |
|
|
Third quarter |
|
|
4,600 |
|
|
12,400 |
|
(7,800 |
) |
|
(62.9 |
) |
|
|
6,300 |
|
|
12,200 |
|
(5,900 |
) |
|
(48.4 |
) |
|
|
Fourth quarter |
|
|
2,800 |
|
|
11,300 |
|
(8,500 |
) |
|
(75.2 |
) |
|
|
4,100 |
|
|
8,400 |
|
(4,300 |
) |
|
(51.2 |
) |
|
|
|
|
|
26,400 |
|
|
52,300 |
|
(25,900 |
) |
|
(49.5 |
) |
|
|
29,000 |
|
|
47,200 |
|
(18,200 |
) |
|
(38.6 |
) |
|
|
|
|
|
|
|
|
|
|
|
|
|
|
|
|
|
|
|
|
|
|
|
|
|
|
|
|
|
(In units) |
|
|
2009 |
|
|
2008 |
|
Decrease |
|
% of Decrease |
|
|
2009 |
|
|
2008 |
|
Decrease |
|
% of Decrease |
|
||||
|
First quarter |
|
|
2,200 |
|
|
10,400 |
|
(8,200 |
) |
|
(78.8 |
) |
|
|
4,400 |
|
|
8,800 |
|
(4,400 |
) |
|
(50.0 |
) |
|
|
Second quarter |
|
|
2,900 |
|
|
8,600 |
|
(5,700 |
) |
|
(66.3 |
) |
|
|
6,000 |
|
|
9,800 |
|
(3,800 |
) |
|
(38.8 |
) |
|
|
July |
|
|
800 |
|
|
1,500 |
|
(700 |
) |
|
(46.7 |
) |
|
|
1,700 |
|
|
2,300 |
|
(600 |
) |
|
(26.1 |
) |
|
|
August |
|
|
1,000 |
|
|
1,500 |
|
(500 |
) |
|
(33.3 |
) |
|
|
1,600 |
|
|
2,000 |
|
(400 |
) |
|
(20.0 |
) |
|
|
|
|
|
6,900 |
|
|
22,000 |
|
(15,100 |
) |
|
(68.6 |
) |
|
|
13,700 |
|
|
22,900 |
|
(9,200 |
) |
|
(40.2 |
) |
|
|
|
|
|
(1) |
As reported by RVIA Class A and C wholesale shipments, rounded to the nearest hundred. |
|
(2) |
As reported by Statistical Surveys Class A and C retail registrations, rounded to the nearest hundred. |
The motorized market has been significantly impacted by highly unstable market conditions. The tightening of the wholesale and retail credit markets, low consumer confidence, the effect of the global recession and uncertainty related to fuel prices placed pressure on retail sales and as a result, our dealers have significantly reduced their inventory levels. Dealers continue to sell older model year units and during most of Fiscal 2009, they were not reordering inventory on a one-for-one basis, which negatively affected shipments and backlog. The decline in wholesale and retail demand has directly impacted our gross margins as we have produced and delivered far fewer units in Fiscal 2009 and we have also had to increase our discounts to meet competitive pricing and provide retail incentives to help dealers move inventory.
14
Order backlog for our motor homes was as follows:
|
|
|
|
|
|
|
|
|
|
|
|
|
|
|
|
|
|
|
|
|
|
|
|
|
|
|
|
|
|
As Of |
|||||||||||||||||||||||
|
(In units) |
|
August 29, |
|
Product Mix |
|
August 30, |
|
Product Mix |
|
Increase |
|
% |
|
||||||||||||
|
Class A gas |
|
|
|
345 |
|
|
|
|
36.7 |
|
|
|
|
119 |
|
|
20.0 |
|
|
226 |
|
|
|
189.9 |
|
|
Class A diesel |
|
|
|
198 |
|
|
|
|
21.0 |
|
|
|
|
100 |
|
|
16.8 |
|
|
98 |
|
|
|
98.0 |
|
|
Total Class A |
|
|
|
543 |
|
|
|
|
57.7 |
|
|
|
|
219 |
|
|
36.8 |
|
|
324 |
|
|
|
147.9 |
|
|
Class B |
|
|
|
10 |
|
|
|
|
1.1 |
|
|
|
|
46 |
|
|
7.7 |
|
|
(36 |
) |
|
|
(78.3 |
) |
|
Class C |
|
|
|
387 |
|
|
|
|
41.2 |
|
|
|
|
331 |
|
|
55.5 |
|
|
56 |
|
|
|
16.9 |
|
|
Total backlog (1) |
|
|
|
940 |
|
|
|
|
100.0 |
|
|
|
|
596 |
|
|
100.0 |
|
|
344 |
|
|
|
57.7 |
|
|
Total approximate revenue dollars (in thousands) |
|
|
$ |
86,626 |
|
|
|
|
|
|
|
|
$ |
50,599 |
|
|
|
|
|
$ 36,027 |
|
|
|
71.2 |
|
|
Dealer inventory (units) |
|
|
|
1,694 |
|
|
|
|
|
|
|
|
|
3,663 |
|
|
|
|
|
(1,969 |
) |
|
|
(53.8 |
) |
|
|
|
|
(1) |
We include in our backlog all accepted purchase orders from dealers to be shipped within the next six months. Orders in backlog can be canceled or postponed at the option of the dealer at any time without penalty and, therefore, backlog may not necessarily be an accurate measure of future sales. |
As noted above, our dealer inventories were nearly 54 percent lower than last year. We attribute the growth in our backlog to the very low level of dealer inventories and the strong acceptance of our 2010 product lineup. This increase may be a sign that the replenishment process is now beginning. As wholesale and retail credit availability and consumer confidence improve, we expect to see an increase in motor home demand as dealers will again have the ability to order units to maintain their inventory levels after an extended period of inventory reduction. A longer term positive outlook for the recreation vehicle industry is supported by favorable demographics as baby boomers reach the age group that has historically accounted for the bulk of retail RV sales.
Results of Operations
Fiscal 2009 Compared to Fiscal 2008
The following is an analysis of changes in key items included in the consolidated statements of income for the fiscal year ended August 29, 2009 compared to the fiscal year ended August 30, 2008:
|
|
|
|
|
|
|
|
|
|
|
|
|
|
|
|
|
|
|
|
|
|
|
|
|
Year Ended (1) |
||||||||||||||||||
|
(In thousands, except percent and per share data) |
|
August 29, |
|
% of Revenues |
|
August 30, |
|
% of Revenues |
|
(Decrease) |
|
% |
|
|||||||
|
Net revenues |
|
|
$ |
211,519 |
|
100.0 |
|
|
$ |
604,352 |
|
100.0 |
|
|
$ |
(392,833 |
) |
(65.0 |
) |
|
|
Cost of goods sold |
|
|
|
242,265 |
|
114.5 |
|
|
|
569,580 |
|
94.2 |
|
|
|
(327,315 |
) |
(57.5 |
) |
|
|
Gross (deficit) profit |
|
|
|
(30,746 |
) |
(14.5 |
) |
|
|
34,772 |
|
5.8 |
|
|
|
(65,518 |
) |
(188.4 |
) |
|
|
|
|
|
|
|
|
|
|
|
|
|
|
|
|
|
|
|
|
|
|
|
|
Selling |
|
|
|
12,616 |
|
6.0 |
|
|
|
18,482 |
|
3.1 |
|
|
|
(5,866 |
) |
(31.7 |
) |
|
|
General and administrative |
|
|
|
15,298 |
|
7.2 |
|
|
|
21,359 |
|
3.5 |
|
|
|
(6,061 |
) |
(28.4 |
) |
|
|
Asset impairment |
|
|
|
855 |
|
0.4 |
|
|
|
4,686 |
|
0.8 |
|
|
|
(3,831 |
) |
(81.8 |
) |
|
|
Operating expenses |
|
|
|
28,769 |
|
13.6 |
|
|
|
44,527 |
|
7.4 |
|
|
|
(15,758 |
) |
(35.4 |
) |
|
|
|
|
|
|
|
|
|
|
|
|
|
|
|
|
|
|
|
|
|
|
|
|
Operating loss |
|
|
|
(59,515 |
) |
(28.1 |
) |
|
|
(9,755 |
) |
(1.6 |
) |
|
|
(49,760 |
) |
(510.1 |
) |
|
|
Financial income |
|
|
|
1,452 |
|
0.7 |
|
|
|
4,314 |
|
0.7 |
|
|
|
(2,862 |
) |
(66.3 |
) |
|
|
Pre-tax loss |
|
|
|
(58,063 |
) |
(27.4 |
) |
|
|
(5,441 |
) |
(0.9 |
) |
|
|
(52,622 |
) |
(967.1 |
) |
|
|
Provision (benefit) for taxes |
|
|
|
20,703 |
|
9.8 |
|
|
|
(8,225 |
) |
(1.4 |
) |
|
|
28,928 |
|
351.7 |
|
|
|
Net (loss) income |
|
|
$ |
(78,766 |
) |
(37.2 |
) |
|
$ |
2,784 |
|
0.5 |
|
|
$ |
(81,550 |
) |
NMF |
|
|
|
Diluted (loss) income per share |
|
|
$ |
(2.71 |
) |
|
|
|
$ |
0.10 |
|
|
|
|
$ |
(2.81 |
) |
NMF |
|
|
|
Fully diluted average shares outstanding |
|
|
|
29,051 |
|
|
|
|
|
29,144 |
|
|
|
|
|
(93 |
) |
(0.3 |
) |
|
|
|
|
|
(1) |
Fiscal year ended August 29, 2009 contained 52 weeks; fiscal year ended August 30, 2008 contained 53 weeks. |
15
Unit deliveries consisted of the following:
|
|
|
|
|
|
|
|
|
|
|
|
|
|
|
|
|
|
|
|
|
|
|
|
Year Ended (1) |
|||||||||||||||||
|
(In units) |
|
August 29, |
|
Product Mix |
|
August 30, |
|
Product Mix |
|
(Decrease) |
|
% |
|
||||||
|
Class A gas |
|
480 |
|
|
21.8 |
|
|
2,129 |
|
|
33.2 |
|
|
(1,649 |
) |
|
(77.5 |
) |
|
|
Class A diesel |
|
342 |
|
|
15.6 |
|
|
900 |
|
|
14.1 |
|
|
(558 |
) |
|
(62.0 |
) |
|
|
Total Class A |
|
822 |
|
|
37.4 |
|
|
3,029 |
|
|
47.3 |
|
|
(2,207 |
) |
|
(72.9 |
) |
|
|
Class B |
|
149 |
|
|
6.8 |
|
|
140 |
|
|
2.2 |
|
|
9 |
|
|
6.4 |
|
|
|
Class C |
|
1,225 |
|
|
55.8 |
|
|
3,238 |
|
|
50.5 |
|
|
(2,013 |
) |
|
(62.2 |
) |
|
|
Total deliveries |
|
2,196 |
|
|
100.0 |
|
|
6,407 |
|
|
100.0 |
|
|
(4,211 |
) |
|
(65.7 |
) |
|
|
|
|
|
(1) |
Fiscal year ended August 29, 2009 contained 52 weeks; fiscal year ended August 30, 2008 contained 53 weeks. |
Net revenues for the year ended August 29, 2009 decreased $392.8 million, or 65.0 percent, due to the following:
|
|
|
|
1. |
Volume decline: The primary reason for the net revenue decline was due to unit deliveries decreasing by 65.7 percent. |
|
2. |
Pricing and mix: Our motor home average selling price (ASP), net of discounts, decreased 1.4 percent. The decrease in our ASP was due to an increase of product discounts we offered at the wholesale level and a shift in mix to lower-priced products, partially offset by the increase in pricing. Our sales mix for the year was more heavily weighted to lower-priced products as 63 percent of our volume in Fiscal 2009 was Class B and C products as compared to a 53 percent mix of Class B and C products in Fiscal 2008. |
|
3. |
Promotional incentives: Our retail and other incentives increased 3.2 percent (as a percentage of net revenues) due to increased retail promotional activity on significantly lower revenues. We used retail incentive programs to help stimulate dealer retail traffic and the programs have had a substantial impact in reducing the dealer inventory level, as our dealer inventory in units is down 53.8 percent at August 29, 2009 compared to August 30, 2008. |
|
4. |
Repurchases: Our losses on repurchases of motor homes during Fiscal 2009 were significantly higher than previous years as a result of the dramatic decline in the motor home market. As a percentage of net revenues, repurchase expense was 1.2 percent in Fiscal 2009 compared to 0.1 percent in Fiscal 2008. |
|
5. |
Other revenue: Revenues for motor home parts and services and other manufactured products decreased by 32.4 percent. |
Cost of goods sold was $242.3 million, or 114.5 percent, of net revenues for Fiscal 2009 compared to $569.6 million, or 94.2 percent, of net revenues for Fiscal 2008. The change in our variable costs (materials, direct labor, variable overhead, delivery expense and warranty) comprise $316.6 million of the $327.3 million decrease, which was primarily caused by decreased sales volume. Material, labor and variable overhead, as a percent of net revenues, increased to 91.8 percent from 82.2 percent in Fiscal 2009 from Fiscal 2008. The 9.6 percent increase was primarily caused by increased discounting and promotional incentives in Fiscal 2009 to promote sales in a difficult motor home market. Delivery expenses and warranty costs in relation to net sales remained consistent in Fiscal 2009 to Fiscal 2008. Our variable costs were favorably impacted by $7.0 million, or 3.3 percent, of net revenues in Fiscal 2009 due to the reduction of the last-in, first-out (LIFO) inventory liquidation, as compared to LIFO expense in Fiscal 2008 of $4.6 million, or 0.8 percent, of net revenues. Fixed overhead, which consists primarily of manufacturing support labor, depreciation and facility costs, increased to 17.7 percent of net revenues in Fiscal 2009 compared to 7.8 percent in Fiscal 2008. This difference was due primarily to low absorption of fixed costs as a result of significantly lower production volume. All factors considered, gross (deficit) profit decreased from a gross profit of 5.8 percent of net revenues during Fiscal 2008 to a gross deficit of 14.5 percent of net revenues during Fiscal 2009.
Selling expenses decreased $5.9 million, or 31.7 percent, during the fiscal year ended August 29, 2009. However, as a percent of net revenues, selling expenses were 6.0 percent during Fiscal 2009 compared to 3.1 percent for Fiscal 2008. The decrease in dollars was due primarily to reductions in advertising expenses of $2.9 million, labor-related expenses of $1.4 million as a result of reduced head count, salesmen incentives of $400,000, travel and meeting expenses of $400,000 and stock compensation of $200,000, as we did not grant stock awards during Fiscal 2009. The increase in percentage of net revenues was caused by the significant difference in revenue levels between the two fiscal periods.
General and administrative expenses decreased $6.1 million, or 28.4 percent, during the fiscal year ended August 29, 2009. However, as a percent of net revenues, general and administrative expenses were 7.2 percent during Fiscal 2009 compared to 3.5 percent for Fiscal 2008. The decrease in dollars was due primarily to reductions in stock compensation of $2.0 million, as we did not grant stock awards during Fiscal 2009, labor-related expenses of $1.5 million as a result of reduced head count, legal expenses of $1.0 million and lower depreciation expense of $500,000. The increase in percentage of net revenues was caused by the significant difference in revenue levels between the two fiscal periods.
16
Asset impairment expenses of $855,000 were recorded in Fiscal 2009 was a result of the decision to close the Hampton, Iowa fiberglass manufacturing facility.
Financial income decreased $2.9 million, or 66.3 percent, for the fiscal year ended August 29, 2009. The decrease in financial income was primarily due to a decrease in the average yield and to a lesser extent, due to a decrease in average investment balances.
The overall effective income tax rate for Fiscal 2009 was an expense of 35.6 percent compared to a benefit of (151.2) percent for Fiscal 2008. The following table breaks down the two aforementioned tax rates:
|
|
|
|
|
|
|
|
|
|
|
|
|
|
|
|
|
|
Year Ended (1) |
|
||||||||||
|
|
|
August 29, 2009 |
|
August 30, 2008 |
|
||||||||
|
(Dollars in thousands) |
|
Amount |
|
Effective Rate (%) |
|
Amount |
|
Effective Rate (%) |
|
||||
|
Tax benefit on current operations |
|
$ |
(22,898 |
) |
(39.5 |
) |
|
$ |
(3,345 |
) |
(61.5 |
) |
|
|
Valuation allowance |
|
|
44,976 |
|
77.5 |
|
|
|
325 |
|
6.0 |
|
|
|
Settlements of uncertain tax positions |
|
|
(500 |
) |
(0.9 |
) |
|
|
(4,149 |
) |
(76.3 |
) |
|
|
Other |
|
|
(875 |
) |
(1.5 |
) |
|
|
(1,056 |
) |
(19.4 |
) |
|
|
Total provision (benefit) for taxes |
|
$ |
20,703 |
|
35.6 |
|
|
$ |
(8,225 |
) |
(151.2 |
) |
|
|
|
|
|
(1) |
Fiscal year ended August 29, 2009 contained 52 weeks; fiscal year ended August 30, 2008 contained 53 weeks. |
Tax benefit on current operations. At the end of the third quarter of Fiscal 2009, our ability to claim refunds of taxes previously paid was exhausted due to the size of our Fiscal 2009 operating losses. Thus, of the $22.9 million tax benefit on current operations, we have established an associated tax refund receivable of $17.4 million. The effective tax benefit rate of 39.5 percent as compared to a benefit rate of 61.5 percent is primarily attributable to the Fiscal 2009 pre-tax loss of $58.1 million versus the Fiscal 2008 pre-tax loss of $5.4 million. Included within the Fiscal 2009 pre-tax loss of $58.1 million was $1.5 million of financial income, which was primarily tax-free income from investments in municipal and student loan related securities and appreciation in company-owned life insurance (COLI), and resulted in an increase to the tax benefit of $1.2 million and increased the tax benefit rate by 2.0 percent. In Fiscal 2008, tax-free investment income resulted in a tax benefit of $1.8 million (a 32.6 percent increase in the effective benefit rate).
Valuation Allowance. During the fourth quarter of Fiscal 2009, we recorded a non-cash charge of $45.3 million to establish a full valuation allowance on the deferred tax assets. Statement of Financial Accounting Standards (SFAS) No. 109 requires that companies assess whether valuation allowances should be established against their deferred tax assets based on the consideration of all available evidence, using a “more likely than not” standard. In making such assessments, significant weight is given to evidence that can be objectively verified. A company’s current or previous losses are given more weight than its future outlook. Under that standard, our three-year historical cumulative loss was a significant negative factor. This loss, combined with uncertain near-term market and economic conditions, reduced our ability to rely on our projections of any future taxable income in determining whether a valuation allowance is appropriate. Accordingly, we concluded that, based on SFAS No. 109 guidelines, a full valuation allowance should now be established. We will continue to assess the likelihood that our deferred tax assets will be realizable and our valuation allowance will be adjusted accordingly, which could materially impact our financial position and results of operations. During the fourth quarter of Fiscal 2008, we recorded a charge of $325,000 to establish a valuation allowance on tax credits that were determined not to be recoverable prior to the tax credits expiring.
Settlements. During Fiscal 2009, we recognized a tax benefit of $500,000 as a result of favorable settlements with various taxing jurisdictions, which increased the tax benefit rate by 0.9 percent. In Fiscal 2008, we had an effective tax benefit rate of 76.3 percent, which was based on the favorable settlements of uncertain tax positions with various taxing jurisdictions. The original unrecognized tax benefit associated with these positions was $14.6 million, of which $8.0 million was paid in cash per the settlement. The balance of this reserve, net of the related deferred taxes, resulted in a $4.1 million increase in tax benefit.
17
Other. Other primarily represents tax benefits associated with tax planning initiatives implemented during Fiscal 2009, such as the extension of the research and development tax credit. In Fiscal 2008, tax planning initiatives represented additional tax benefits associated with tax-free income from investments in Company-owned life insurance.
Net loss and diluted loss per share were $78.8 million and $2.71 per share, respectively, for Fiscal 2009. In Fiscal 2008, net income was $2.8 million and diluted income was $0.10 per share.
Fiscal 2008 Compared to Fiscal 2007
The following is an analysis of changes in key items included in the consolidated statements of income for the year ended August 30, 2008 compared to the year ended August 25, 2007:
|
|
|
|
|
|
|
|
|
|
|
|
|
|
|
|
|
|
|
|
|
|
|
|
|
Year Ended (1) |
|
|||||||||||||||||
|
(In thousands, except percent and per share data) |
|
August 30, |
|
% of |
|
August 25, |
|
% of |
|
Increase |
|
% |
|
|||||||
|
Net revenues |
|
$ |
604,352 |
|
100.0 |
|
|
$ |
870,152 |
|
100.0 |
|
|
$ |
(265,800 |
) |
(30.5 |
) |
|
|
|
Cost of goods sold |
|
|
569,580 |
|
94.2 |
|
|
|
770,955 |
|
88.6 |
|
|
|
(201,375 |
) |
(26.1 |
) |
|
|
|
Gross profit |
|
|
34,772 |
|
5.8 |
|
|
|
99,197 |
|
11.4 |
|
|
|
(64,425 |
) |
(64.9 |
) |
|
|
|
|
|
|
|
|
|
|
|
|
|
|
|
|
|
|
|
|
|
|
|
|
|
Selling |
|
|
18,482 |
|
3.1 |
|
|
|
19,865 |
|
2.3 |
|
|
|
(1,383 |
) |
(7.0 |
) |
|
|
|
General and administrative |
|
|
21,359 |
|
3.5 |
|
|
|
24,446 |
|
2.8 |
|
|
|
(3,087 |
) |
(12.6 |
) |
|
|
|
Asset impairment |
|
|
4,686 |
|
0.8 |
|
|
|
- - - |
|
- - - |
|
|
|
4,686 |
|
- - - |
|
|
|
|
Operating expenses |
|
|
44,527 |
|
7.4 |
|
|
|
44,311 |
|
5.1 |
|
|
|
216 |
|
0.5 |
|
|
|
|
|
|
|
|
|
|
|
|
|
|
|
|
|
|
|
|
|
|
|
|
|
|
Operating (loss) income |
|
|
(9,755) |
|
(1.6 |
) |
|
|
54,886 |
|
6.3 |
|
|
|
(64,641 |
) |
(117.8 |
) |
|
|
|
Financial income |
|
|
4,314 |
|
0.7 |
|
|
|
6,523 |
|
0.8 |
|
|
|
(2,209 |
) |
(33.9 |
) |
|
|
|
Pre-tax (loss) income |
|
|
(5,441) |
|
(0.9 |
) |
|
|
61,409 |
|
7.1 |
|
|
|
(66,850 |
) |
(108.9 |
) |
|
|
|
(Benefit) provision for taxes |
|
|
(8,225) |
|
(1.4 |
) |
|
|
19,845 |
|
2.3 |
|
|
|
(28,070 |
) |
(141.4 |
) |
|
|
|
Net income |
|
$ |
2,784 |
|
0.5 |
|
|
$ |
41,564 |
|
4.8 |
|
|
$ |
(38,780 |
) |
(93.3 |
) |
|
|
|
Diluted income per share |
|
$ |
0.10 |
|
|
|
|
$ |
1.32 |
|
|
|
|
$ |
(1.22 |
) |
(92.4 |
) |
|
|
|
Fully diluted average shares outstanding |
|
|
29,144 |
|
|
|
|
|
31,415 |
|
|
|
|
|
(2,271 |
) |
(7.2 |
) |
|
|
|
|
|
|
(1) |
Fiscal year ended August 30, 2008 contained 53 weeks; fiscal year ended August 25, 2007 contained 52 weeks. |
Unit deliveries consisted of the following:
|
|
|
|
|
|
|
|
|
|
|
|
|
|
|
|
|
|
|
|
|
|
|
|
Year Ended (1) |
|
||||||||||||||||
|
(In units) |
|
August 30, |
|
Product Mix |
|
August 25, |
|
Product Mix |
|
Increase |
|
% |
|
||||||
|
Class A gas |
|
2,129 |
|
|
33.2 |
|
|
3,539 |
|
|
37.4 |
|
|
(1,410 |
) |
|
(39.8 |
) |
|
|
Class A diesel |
|
900 |
|
|
14.1 |
|
|
1,492 |
|
|
15.7 |
|
|
(592 |
) |
|
(39.7 |
) |
|
|
Total Class A |
|
3,029 |
|
|
47.3 |
|
|
5,031 |
|
|
53.1 |
|
|
(2,002 |
) |
|
(39.8 |
) |
|
|
Class B |
|
140 |
|
|
2.2 |
|
|
- - - |
|
|
- - - |
|
|
140 |
|
|
- - - |
|
|
|
Class C |
|
3,238 |
|
|
50.5 |
|
|
4,438 |
|
|
46.9 |
|
|
(1,200 |
) |
|
(27.0 |
) |
|
|
Total deliveries |
|
6,407 |
|
|
100.0 |
|
|
9,469 |
|
|
100.0 |
|
|
(3,062 |
) |
|
(32.3 |
) |
|
|
|
|
|
(1) |
Fiscal year ended August 30, 2008 contained 53 weeks;
fiscal year ended August 25, 2007 contained 52 weeks.
|
Net revenues for the year ended August 30, 2008 decreased $265.8 million, or 30.5 percent, due to the following:
|
|
|
|
|
|
1. |
Volume decline: The primary reason for the net revenue decline was due to unit deliveries decreasing by 32.3 percent. |
|
|
2. |
Pricing and mix: Our average selling price in Fiscal 2008 as compared to Fiscal 2007 was essentially flat, up only 0.7 percent. Price increases associated with the new model year were partially offset by increased wholesale and retail incentives and a higher mix of lower-priced products. Total Class B and C unit deliveries were 52.7 percent of our total deliveries in Fiscal 2008 as compared to Class C deliveries, which were 46.9 percent of our total deliveries in Fiscal 2007. |
|
|
3. |
Promotional incentives: Our retail and other incentives increased by 0.5 percent (as a percentage of net revenues) due to increased retail promotional activity on lower revenues. |
|
|
4. |
Other revenue: Revenues for motor home parts and services and other manufactured products decreased by 10.3 percent. |
18
Cost of goods sold was $569.6 million, or 94.2 percent, of net revenues for Fiscal 2008 compared to $771.0 million, or 88.6 percent, of net revenues for Fiscal 2007. The change in our variable costs (materials, direct labor, variable overhead, delivery expense and warranty) comprised $199.2 million of the $201.4 million decrease which was primarily caused by decreased sales volume. Material, labor and variable overhead, as a percent of net revenues, increased to 82.2 percent in Fiscal 2008 compared to 79.3 percent in Fiscal 2007. The 2.9 percent increase was primarily caused by a greater percentage of lower-margin motor home deliveries in Fiscal 2008. Also contributing to the reduced margins were additional wholesale and retail promotional programs and an increase in LIFO expense in Fiscal 2008 as compared to Fiscal 2007 due to the increase in inflation and higher inventory levels at the end of the year. Fixed overhead, which consists primarily of manufacturing support labor, depreciation and facility costs, increased to 7.8 percent of net revenues in Fiscal 2008 compared to 5.7 percent in Fiscal 2007. This difference was due primarily to lower absorption of fixed costs due to lower production volumes. All factors considered, gross profit decreased from 11.4 percent of net revenues in Fiscal 2007 to 5.8 percent of net revenues during Fiscal 2009.
Selling expenses decreased $1.4 million, or 7.0 percent, during the fiscal year ended August 30, 2008. However, as a percent of net revenues, selling expenses were 3.1 percent during Fiscal 2008 compared to 2.3 percent for Fiscal 2007. The decrease in dollars was due primarily to reductions in salesmen incentives of $579,000, advertising expenses of $502,000 and wages and wage-related expenses of $422,000. The increase in percentage of net revenues was caused by the significant difference in revenue levels between the two fiscal periods.
General and administrative expenses decreased $3.1 million, or 12.6 percent, during the fiscal year ended August 30, 2008. However, as a percent of net revenues, general and administrative expenses were 3.5 percent during Fiscal 2008 compared to 2.8 percent for Fiscal 2007. The decrease in dollars was due primarily to reduced management incentive compensation of $3.1 million and reduced product liability expense of $1.8 million, partially offset by severance costs of $1.3 million and an increase in legal and professional fees of $659,000. The increase in percentage of net revenues was caused by the significant difference in revenue levels between the two fiscal periods.
Financial income decreased $2.2 million, or 33.9 percent, for the fiscal year ended August 30, 2008. The decrease in financial income was due to a lower average investment balance with similar rates of return.
The overall effective income tax rate for Fiscal 2008 was a benefit of (151.2) percent compared to an expense of 32.3 percent for Fiscal 2007. The following table breaks down the two aforementioned tax rates:
|
|
|
|
|
|
|
|
|
|
|
|
|
|
|
|
|
|
|
Year Ended (1) |
|
|||||||||||
|
|
|
August 30, 2008 |
|
August 25, 2007 |
|
|||||||||
|
(Dollars in thousands) |
|
Amount |
|
Effective |
|
Amount |
|
Effective |
|
|||||
|
Tax (benefit) provision from current operations |
|
$ |
(3,345 |
) |
(61.5 |
) |
|
$ |
19,845 |
|
32.3 |
|
|
|
|
Settlements of uncertain tax positions |
|
|
(4,149 |
) |
(76.3 |
) |
|
|
- - - |
|
- - - |
|
|
|
|
Other |
|
|
(1,056 |
) |
(19.4 |
) |
|
|
- - - |
|
- - - |
|
|
|
|
Valuation allowance |
|
|
325 |
|
6.0 |
|
|
|
- - - |
|
- - - |
|
|
|
|
Total (benefit) provision for taxes |
|
$ |
(8,225 |
) |
(151.2 |
) |
|
$ |
19,845 |
|
32.3 |
|
|
|
|
|
|
|
(1) |
Fiscal year ended August 30, 2008 contained 53 weeks; fiscal year ended August 25, 2007 contained 52 weeks. |
Tax (benefit) provision from current operations. The effective tax benefit rate of 61.5 percent as compared to a 32.3 percent expense was primarily attributable to the Fiscal 2008 pre-tax loss of $5.4 million versus the Fiscal 2007 pre-tax income of $61.4 million. Included within the Fiscal 2008 pre-tax loss of $5.4 million was $4.3 million of financial income, which was primarily tax-free income from investments in municipal and student loan related securities which resulted in an increase to the tax benefit of $1.8 million and increased the effective tax benefit rate by 32.6 percent. In the prior year, tax-free investment income resulted in a tax benefit of $1.8 million (a 2.9 percent reduction in the effective tax rate).
Settlements of uncertain tax positions. An effective tax benefit rate of 76.3 percent was based on the favorable settlements of uncertain tax positions with various taxing jurisdictions. The original unrecognized tax benefit associated with these positions was $14.6 million, of which $8.0 million was paid in cash per the settlement. The balance of this reserve, net of the related deferred taxes, resulted in a $4.1 million increase in tax benefit.
Other. Other primarily represents tax benefits associated with tax planning initiatives implemented during the fiscal year. These tax planning initiatives represented additional tax benefits associated with tax-free income from investments in COLI.
19
Valuation allowance. During the fourth quarter of Fiscal 2008, we recorded a charge of $325,000 to establish a valuation allowance on certain state tax credits that were determined not likely to be recoverable prior to the tax credits expiring.
Net income decreased by 93.3 percent and income per diluted share decreased by 92.4 percent when comparing Fiscal 2008 to Fiscal 2007.
Analysis of Financial Condition, Liquidity and Resources
In most fiscal years, we generated cash from operations, which enabled us to meet our working capital needs and make appropriate investments in manufacturing equipment and facilities, as well as pay cash dividends and repurchase stock. Working capital at August 29, 2009 and August 30, 2008 was $79.5 million and $108.5 million, respectively, a decrease of $29.0 million.
Cash and cash equivalents totaled $36.6 million and $17.9 million as of August 29, 2009 and August 30, 2008, respectively. Short-term and long-term investments net of temporary impairments totaled $33.3 million as of August 29, 2009 and $40.6 million as of August 30, 2008. (See Notes 3 and 4 to the Consolidated Financial Statements.)
Due to extremely challenging market conditions which have resulted in a severe decline in our revenues in Fiscal 2009, maintaining liquidity and conserving capital have been the primary goals of management in order to enhance our financial flexibility. During Fiscal 2009, we increased our cash position by $18.7 million despite a pre-tax loss of $58.1 million. Multiple steps were taken during Fiscal 2009 to conserve capital and maintain liquidity, as follows:
|
|
|
|
|
|
1. |
Inventories were significantly reduced (58%) during the fiscal year which resulted in an improvement of working capital of approximately $63.7 million. |
|
|
2. |
We elected to participate in a “no net cost” loan program and borrowed $9.1 million through UBS during the second quarter, secured by a portion of the ARS owned by us and held by UBS. |
|
|
3. |
We suspended cash dividend payments starting in the second quarter of Fiscal 2009. This suspension reduces the amount of cash which we would have used by approximately $10.5 million for Fiscal 2009. |
As of August 29, 2009, we had $36.6 million of cash. Due to the ability to carryback a large portion of our tax loss in Fiscal 2009 to prior years, we expect to receive a federal tax refund in excess of $17 million in the second quarter of Fiscal 2010. We also have the ability to put the remaining $4.4 million of unencumbered ARS held by UBS to UBS in the fourth quarter of Fiscal 2010. In aggregate, this provides liquidity of approximately $58 million. When considering all of these factors, we expect to have sufficient liquidity for at least the next 12 months, even at the current depressed sales levels.
In addition, we placed multiple assets for sale, including our plane and two manufacturing facilities. Total listing price of these assets is in excess of $10 million.
We also have in place a new $20 million revolving credit facility, as described in further detail in Note 7, that allows us to borrow up to $12.5 million without financial covenant restrictions if there is adequate asset coverage. Subject to certain provisions, the facility also includes an option that can be exercised to increase the facility size up to $50 million. This potential additional borrowing capacity may be beneficial to us if inventory levels need to substantially increase rapidly as a result of product demand.
We also have taken significant actions over the past year to reduce our fixed cost structure and mitigate against certain rising costs, which resulted in reductions of approximately $24 million in Fiscal 2009 as compared to Fiscal 2008. Specifically, actions taken include:
|
|
|
|
|
|
1. |
Compensation-related expenses: Total head count was reduced by approximately 28 percent (in addition to the 32 percent reductions in Fiscal 2008), compensation reductions ranging from 3 to 20 percent for salaried employees (including executive officers) was made mid-year, no stock grants were made to key management or the board, the 401(k) match was reduced by 50 percent and all employees participated in two mandatory unpaid weeks off. |
|
|
2. |
Facility closures: We closed Charles City manufacturing facility at the end of the fourth quarter in Fiscal 2008. We are now in the process of closing our Hampton, Iowa fiberglass manufacturing facility which will be completed in the first quarter of Fiscal 2010. |
|
|
3. |
Other: Certain promotional events typically held were cancelled and other spending reductions occurred throughout the Company. |
20
Some of the actions described above were one-time events, such as the mandatory unpaid weeks off, unless we decide to do these types of events again in Fiscal 2010. We believe that we have the ability to sustain our current operational costs and maintain physical capacity at present levels for the foreseeable future (in excess of 12 months). Additional cost reduction activities will continue if market conditions do not improve.
We currently expect cash on hand, funds generated from operations (if any) and the availability of borrowings under the new credit facility to be sufficient to cover both short-term and long-term operation requirements.
Operating Activities
Cash provided by operating activities was $8.3 million for the fiscal year ended August 29, 2009 compared to cash used in operating activities of $14.4 million for the fiscal year ended August 30, 2008. Cash provided in Fiscal 2009 was due to significant inventory reductions of $63.7 million and a reduction of deferred tax assets of $37.4 million, partially offset by a $78.8 million net loss and $10.6 million reduction in accounts payable. Cash used in Fiscal 2008 was $31.3 million for the reduction in accounts payable and $9.4 million due to an increase in inventories. The receipt of accounts receivable payments of $21 million helped to partially offset the cash used during Fiscal 2008.
Investing Activities
Cash provided by investing activities was $5.0 million in Fiscal 2009 compared to $56.4 million in Fiscal 2008. Cash provided in Fiscal 2009 was due to ARS redemptions of $8.9 million, partially offset by capital spending of $3.5 million. During Fiscal 2008, we had proceeds of $288.1 million from the sale of short-term investments, partially offset by purchases of $228.1 million. Another use of cash in Fiscal 2008 was $3.7 million for capital spending.
Financing Activities
Cash provided by financing activities for the fiscal year ended August 29, 2009 was $9.1 million on borrowings from our ARS portfolio, partially offset by $3.5 million in cash dividends paid in the first quarter. Primary uses of cash in financing activities for the fiscal year ended August 30, 2008 were $17.8 million for repurchases of outstanding common stock and payments of $14.0 million in dividends.
Anticipated Use of Funds
Estimated uses of our liquid assets for Fiscal 2010 include capital expenditures of approximately $2 million, primarily for manufacturing equipment and facilities.
Contractual Obligations and Commercial Commitments
Our principal contractual obligations and commercial commitments as of August 29, 2009 were as follows:
|
|
|
|
|
|
|
|
|
|
|
|
|
|
|
|
|
|
|
|
|
Payments Due By Period |
|
|||||||||||||
|
(In thousands) |
|
Total |
|
Fiscal |
|
Fiscal |
|
Fiscal |
|
More than |
|
|||||
|
Postretirement health care obligations (1) |
|
$ |
35,312 |
|
$ |
1,193 |
|
$ |
2,951 |
|
$ |
3,607 |
|
$ |
27,561 |
|
|
Deferred compensation obligations (1) |
|
|
26,152 |
|
|
2,590 |
|
|
4,751 |
|
|
4,157 |
|
|
14,654 |
|
|
Executive share option obligations (1) |
|
|
8,444 |
|
|
- - - |
|
|
558 |
|
|
2,792 |
|
|
5,094 |
|
|
Supplemental executive retirement plan benefit obligations (1) |
|
|
3,259 |
|
|
247 |
|
|
407 |
|
|
325 |
|
|
2,280 |
|
|
Operating leases (2) |
|
|
373 |
|
|
158 |
|
|
169 |
|
|
46 |
|
|
- - - |
|
|
Contracted services |
|
|
56 |
|
|
56 |
|
|
- - - |
|
|
- - - |
|
|
- - - |
|
|
Unrecognized tax benefits (3) |
|
|
9,012 |
|
|
- - - |
|
|
- - - |
|
|
- - - |
|
|
- - - |
|
|
Total contractual cash obligations |
|
$ |
82,608 |
|
$ |
4,244 |
|
$ |
8,836 |
|
$ |
10,927 |
|
$ |
49,589 |
|
|
|
|
|
|
|
|
|
|
|
|
|
|
|
|
|
|
|
|
|
|
Expiration By Period |
|
|||||||||||||
|
(In thousands) |
|
Total |
|
Fiscal |
|
Fiscal |
|
Fiscal |
|
More than |
|
|||||
|
Formal repurchase obligations (3) |
|
$ |
90,599 |
|
$ |
65,508 |
|
|
25,091 |
|
|
- - - |
|
|
- - - |
|
|
|
|
|
(1) |
See Note 9 to the Consolidated Financial Statements. |
|
(2) |
See Note 10 to the Consolidated Financial Statements. |
|
(3) |
We are not able to reasonably estimate in which future periods these amounts will ultimately be settled. |
21
Critical Accounting Policies
Our consolidated financial statements are prepared in accordance with generally accepted accounting principles (GAAP). In connection with the preparation of our financial statements, we are required to make assumptions and estimates about future events and apply judgments that affect the reported amounts of assets, liabilities, revenue, expenses and the related disclosures. We base our assumptions, estimates and judgments on historical experience, current trends and other factors that we believe to be relevant at the time our consolidated financial statements are prepared. On a regular basis, we review the accounting policies, assumptions, estimates and judgments to ensure that our financial statements are presented fairly and in accordance with GAAP. However, because future events and their effects cannot be determined with certainty, actual results could differ from our assumptions and estimates and such differences could be material.
Our significant accounting policies are discussed in Note 1, Summary of Significant Accounting Policies, of the Notes to Consolidated Financial Statements, included in Item 8, Financial Statements and Supplementary Data, of this Annual Report on Form 10-K. We believe that the following accounting estimates and policies are the most critical to aid in fully understanding and evaluating our reported financial results and they require our most difficult, subjective or complex judgments, resulting from the need to make estimates about the effect of matters that are inherently uncertain. We have reviewed these critical accounting estimates and related disclosures with the Audit Committee of our Board.
Revenue Recognition. Generally, revenues for motor homes are recorded when all of the following conditions are met: an order for a product has been received from a dealer, written or verbal approval for payment has been received from the dealer’s floorplan financing institution, and the product is delivered to the dealer who placed the order. Most sales are financed under floorplan financing arrangements with banks or finance companies.
Revenues from the sales of our OEM and motor home related parts are recorded as the products are shipped from our location. The title of ownership transfers on these products as they leave our location due to the freight terms of F.O.B. - Forest City, Iowa.
Sales Promotions and Incentives. We accrue for sales promotions and incentive expenses, which are recognized as a reduction to revenues, at the time of sale to the dealer or when the sales incentive is offered to the dealer or retail customer. Examples of sales promotions and incentive programs include dealer and consumer rebates, volume discounts, retail financing programs and dealer sales associate incentives. Sales promotion and incentive expenses are estimated based upon current program parameters, such as unit or retail volume, and historical rates. Actual results may differ from these estimates if market conditions dictate the need to enhance or reduce sales promotion and incentive programs or if the retail customer usage rate varies from historical trends. Historically, sales promotion and incentive expenses have been within our expectations and differences have not been material.
Repurchase Commitments. It is customary practice for companies in the recreation vehicle industry to enter into repurchase agreements with financing institutions that provide financing to their dealers. Our repurchase agreements generally provide that, in the event of a default by a dealer in its obligation to these lenders, we will repurchase vehicles sold to the dealer that have not been resold to retail customers. The terms of these agreements, which can last up to 18 months, provide that our liability will be the lesser of remaining principal owed by the dealer or dealer invoice less periodic reductions based on the time since the date of the original invoice. Our liability cannot exceed 100 percent of the dealer invoice. In certain instances, we also repurchase inventory from our dealers due to state law or regulatory requirements that govern voluntary or involuntary relationship terminations. Our risk of loss is reduced by the potential resale value of any products that are subject to repurchase and is spread over numerous dealers and lenders. The aggregate contingent liability related to our repurchase agreements represents all financed dealer inventory at the period reporting date subject to a repurchase agreement, net of the greater of periodic reductions per the agreement or dealer principal payments.
Based on these repurchase agreements, we establish an associated loss reserve. This loss reserve is disclosed separately in the consolidated balance sheets. Repurchased sales are not recorded as a revenue transaction, but the net difference between the original repurchase price and the resale price are recorded against the loss reserve, which is a deduction from gross revenue. There are two significant assumptions associated with establishing our loss reserve for repurchase commitments: (1) the percentage of dealer inventory that we will be required to repurchase as a result of defaults by the dealer, and (2) the loss that will be incurred, if any, when repurchased inventory is resold. Prior to Fiscal 2009, losses under these agreements were not material. However, the substantial decrease in retail demand for recreation vehicles in the past 12 months and tightened credit standards by lenders has resulted in a significant increase in defaults by our dealers. To the extent that dealers are reducing their inventories, which they have been doing the past 12 months, our overall exposure under repurchase agreements is likewise reduced. The percentage of dealer inventory we estimate we will repurchase is based on historical information, current trends
22
and an analysis of dealer inventory aging for all dealers with inventory subject to this obligation. The estimated loss per repurchased unit was based primarily on recent history because until Fiscal 2009, we were generally able to sell repurchased units for minimal losses. In the first three quarters of Fiscal 2009, we incurred a significant increase in losses associated with repurchases due to the challenging motor home industry conditions. As a result, we have revised our underlying loss reserve estimate assumptions during Fiscal 2009 based on rapidly changing circumstances and significantly increased our repurchase loss reserve. Further discussion of our repurchase commitments and related assumptions is included in Note 10 to the Consolidated Financial Statements.
Warranty. We provide with the purchase of any new motor home, a comprehensive 12-month/15,000-mile warranty on Class A, B and C motor homes and a 3-year/36,000-mile warranty on Class A and C sidewalls and floors. Estimated costs related to product warranty are accrued at the time of sale and are based upon past warranty claims and unit sales history and adjusted as required to reflect actual costs incurred, as information becomes available. A significant increase in dealership labor rates, the cost of parts or the frequency of claims could have a material adverse impact on our operating results for the period or periods in which such claims or additional costs materialize. We also incur costs as a result of additional service actions not covered by our warranties, including product recalls and customer satisfaction actions. Estimated costs are accrued at the time the service action is implemented and are based upon past claim rate experiences and the estimated cost of the repairs. Further discussion of our warranty costs and associated accruals is included in Note 8 to the Consolidated Financial Statements.
Stock-Based Compensation. Prior to Fiscal 2007, we granted stock options to our key employees and nonemployee directors as part of their compensation. In Fiscal 2007 and 2008, we granted restricted stock awards to key employees and nonemployee directors instead of stock options. No stock options or restricted stock awards were granted in Fiscal 2009.
The amount of stock-based compensation expense incurred and to be incurred in future periods is dependent upon a number of factors, such as the number of options and shares granted, the timing of stock option exercises, age of the recipient and actual forfeiture rates.
The value of the restricted stock is based on the closing price of our common stock on the date of grant. The fair value of each award is amortized on a straight-line basis over the requisite service period or to an employee’s eligible retirement date, if earlier. This amortization method is used because our awards typically vest over three years, beginning one year after date of grant or upon retirement if earlier; thus, options and restricted stock awards are expensed immediately upon grant for retirement-eligible employees. This feature accelerates expense in the period of grant (typically our first fiscal quarter) and creates an uneven pattern of stock-based compensation that results in relatively higher expense in our first fiscal quarter and relatively lower expense in our second through fourth quarters. The impact of this feature is significant since a majority of our awards are made to retirement-eligible employees. Further discussion of our stock-based compensation is included in Note 13 to the Consolidated Financial Statements.
Unrecognized Tax Benefits. We only recognize tax benefits for filing positions that are considered more likely than not of being sustained under audit by the relevant taxing authority, without regard to the likelihood of such an audit occurring. We record a liability for uncertain tax positions when it is more likely than not that our filed tax positions will not be sustained. We record deferred tax assets related to reserves for filing positions in a particular jurisdiction that would result in tax deductions in another tax jurisdiction if we were unable to sustain our filing position in an audit. Our income tax returns are periodically audited by various taxing authorities. These audits include questions regarding our tax filing positions, including the timing and the amount of deductions and the allocation of income among various tax jurisdictions. At any one time, multiple years are subject to audit by the various taxing authorities. We continually assess our tax positions for all periods that are open to examination or have not been effectively settled based on the most current available information. We adjust our liability for unrecognized tax benefits and income tax provision in the period in which an uncertain tax position is effectively settled, the statute of limitations expires for the relevant taxing authority to examine the tax position or when more information becomes available.
Our liability for unrecognized tax benefits contains uncertainties because we are required to make assumptions and apply judgment to estimate the exposure associated with our various filing positions. Our effective tax rate is also affected by changes in tax laws, the level of our earnings or losses and the results of tax audits.
Although we believe that the judgments and estimates discussed herein are reasonable, actual results could differ, and we may be exposed to losses or realize gains that could be material. To the extent that we prevail in matters for which a liability has been established or are required to pay amounts in excess of our established liability, our effective income tax rate in a given financial statement period could be materially affected. An unfavorable tax settlement generally would require use of our cash and may result in an increase in our effective tax rate in the period of resolution. A favorable tax settlement may be recognized as a reduction in our effective tax rate in the period of resolution.
23
Income Taxes. We account for income taxes in accordance with SFAS No. 109, Accounting for Income Taxes. As part of the process of preparing our consolidated financial statements, we are required to estimate our income taxes in each of the jurisdictions in which we operate. Significant judgment is required in determining our provision for income taxes, our deferred tax assets and liabilities and any valuation allowance recorded against our deferred tax assets. Valuation allowances arise due to the uncertainty of realizing deferred tax assets. SFAS No. 109 requires that companies assess whether valuation allowances should be established against their deferred tax assets based on the consideration of all available evidence, using a “more likely than not” standard. In making such assessments, significant weight is to be given to evidence that can be objectively verified. A company’s current or previous losses are given more weight than its future outlook. Under that standard, our three-year historical cumulative loss was a significant negative factor. We have evaluated the sustainability of our deferred tax assets on our consolidated balance sheet which includes the assessment of cumulative income or losses over recent prior periods. Based on SFAS No. 109 guidelines, we determined a full valuation allowance was appropriate as of August 29, 2009. We will continue to assess the likelihood that our deferred tax assets will be realizable at each reporting period and our valuation allowance will be adjusted accordingly, which could materially impact our financial position and results of operations.
Postretirement Benefits, Obligations and Costs. We provide certain health care and other benefits for retired employees hired before April 1, 2001, who have fulfilled eligibility requirements at age 55 with 15 years of continuous service. Postretirement benefit liabilities are determined by actuaries using assumptions about the discount rate and health care cost-trend rates. Assumed health care cost trend rates do not have a significant effect on the amounts reported for our health care plan due to the fact that in, Fiscal 2004, caps were placed on the amount we are required to pay for postretirement health care benefits per retiree on an annual basis. However, a significant increase or decrease in interest rates could have a significant impact on our operating results. Further discussion of our postretirement benefit plan and related assumptions is included in Note 9 to the Consolidated Financial Statements.
Other. We have reserves for other loss exposures, such as litigation, product liability, worker’s compensation, employee medical claims, inventory and accounts receivable. Establishing loss reserves for these matters requires the use of estimates and judgment in regards to risk exposure and ultimate liability. We estimate losses under the programs using consistent and appropriate methods; however, changes in assumptions could materially affect our recorded assets or liabilities.
New Accounting Pronouncements
See Note 1 to the Consolidated Financial Statements.
Impact of Inflation
Historically, the impact of inflation on our operations has not been significantly detrimental, as we have usually been able to adjust our prices to reflect the inflationary impact on the cost of manufacturing our product. In recent months, the costs of a number of raw materials and component parts utilized in manufacturing our motor homes have increased. While we have historically been able to pass on these increased costs, in the event we are unable to continue to do so due to market conditions, future increases in manufacturing costs could have a material adverse effect on our results of operations.
ITEM 7A. Quantitative and Qualitative Disclosures About Market Risk
We have market risk exposure to our ARS, which is described in further detail in Note 4 to the Consolidated Financial Statements.
24
ITEM 8. Financial Statements and Supplementary Data
Index to Financial Statements
|
|
|
|
|
|
|
Page |
|
|
|
|
|
Management’s Report on Internal Control Over Financial Reporting |
|
26 |
|
|
27 |
|
|
|
28 |
|
|
|
29 |
|
|
Consolidated Balance Sheets as of August 29, 2009 and August 30, 2008 |
|
30 |
|
|
31 |
|
|
|
32 |
|
|
|
33 |
25
MANAGEMENT’S REPORT ON INTERNAL CONTROL OVER FINANCIAL REPORTING
Management of Winnebago Industries, Inc. (the “Company”) is responsible for establishing and maintaining effective internal control over financial reporting and for the assessment of the effectiveness of internal control over financial reporting. The Company’s internal control over financial reporting is a process designed, as defined in Rule 13a-15(f) under the Securities Exchange Act of 1934, as amended, to provide reasonable assurance regarding the reliability of financial reporting and the preparation of consolidated financial statements for external purposes in accordance with generally accepted accounting principles.
The Company’s internal control over financial reporting is supported by written policies and procedures that:
|
|
|
|
|
(1) pertain to the maintenance of records that, in reasonable detail, accurately and fairly reflect the transactions and dispositions of the Company’s assets; |
|
|
|
|
|
(2) provide reasonable assurance that transactions are recorded as necessary to permit preparation of consolidated financial statements in accordance with generally accepted accounting principles and that receipts and expenditures of the Company are being made only in accordance with authorizations of the Company’s management and directors; and |
|
|
|
|
|
(3) provide reasonable assurance regarding prevention or timely detection of unauthorized acquisition, use or disposition of the Company’s assets that could have a material effect on the consolidated financial statements. |
In addition, the Audit Committee of the Board of Directors, consisting solely of independent directors, meets periodically with Management, the internal auditors and the independent registered public accounting firm to review internal accounting controls, audit results and accounting principles and practices and annually selects the independent registered public accounting firm.
Because of its inherent limitations, internal control over financial reporting may not prevent or detect misstatements. Projections of any evaluation of effectiveness to future periods are subject to the risk that controls may become inadequate because of changes in conditions or that the degree of compliance with the policies or procedures may deteriorate.
In connection with the preparation of the Company’s annual consolidated financial statements, management of the Company has undertaken an assessment of the effectiveness of the Company’s internal control over financial reporting based on criteria established in Internal Control - Integrated Framework issued by the Committee of Sponsoring Organizations of the Treadway Commission (COSO). Management’s assessment included an evaluation of the design of the Company’s internal control over financial reporting and testing of the operational effectiveness of the Company’s internal control over financial reporting.
Based on this assessment, management has concluded that the Company’s internal control over financial reporting was effective as of August 29, 2009.
Deloitte & Touche LLP, the independent registered public accounting firm that audited the Company’s consolidated financial statements included in this Annual Report on Form 10-K, has issued an unqualified attestation report included herein, on management’s assessment of internal control over financial reporting.
|
|
|
|
|
|
|
/s/ Robert J. Olson |
|
/s/ Sarah N. Nielsen |
|
|
|
Robert J. Olson |
Sarah N. Nielsen |
|
||
|
Chairman of the Board, Chief |
Vice President, |
|
||
|
Executive Officer and President |
Chief Financial Officer |
|
||
|
|
|
|
||
|
October 27, 2009 |
|
|
||
26
REPORT OF INDEPENDENT REGISTERED PUBLIC ACCOUNTING FIRM
To the Board
of Directors and Shareholders
Winnebago Industries, Inc.
Forest City, Iowa
We have audited the internal control over financial reporting of Winnebago Industries, Inc. (the “Company”) as of August 29, 2009, based on criteria established in Internal Control — Integrated Framework issued by the Committee of Sponsoring Organizations of the Treadway Commission. The Company’s management is responsible for maintaining effective internal control over financial reporting and for its assessment of the effectiveness of internal control over financial reporting, included in the accompanying Management’s Report on Internal Control Over Financial Reporting. Our responsibility is to express an opinion on the Company’s internal control over financial reporting based on our audit.
We conducted our audit in accordance with the standards of the Public Company Accounting Oversight Board (United States). Those standards require that we plan and perform the audit to obtain reasonable assurance about whether effective internal control over financial reporting was maintained in all material respects. Our audit included obtaining an understanding of internal control over financial reporting, assessing the risk that a material weakness exists, testing and evaluating the design and operating effectiveness of internal control based on the assessed risk and performing such other procedures as we considered necessary in the circumstances. We believe that our audit provides a reasonable basis for our opinion.
A company’s internal control over financial reporting is a process designed by, or under the supervision of, the company’s principal executive and principal financial officers, or persons performing similar functions, and effected by the company’s board of directors, management, and other personnel to provide reasonable assurance regarding the reliability of financial reporting and the preparation of financial statements for external purposes in accordance with generally accepted accounting principles. A company’s internal control over financial reporting includes those policies and procedures that (1) pertain to the maintenance of records that, in reasonable detail, accurately and fairly reflect the transactions and dispositions of the assets of the company; (2) provide reasonable assurance that transactions are recorded as necessary to permit preparation of financial statements in accordance with generally accepted accounting principles and that receipts and expenditures of the company are being made only in accordance with authorizations of management and directors of the company; and (3) provide reasonable assurance regarding prevention or timely detection of unauthorized acquisition, use, or disposition of the company’s assets that could have a material effect on the financial statements.
Because of the inherent limitations of internal control over financial reporting, including the possibility of collusion or improper management override of controls, material misstatements due to error or fraud may not be prevented or detected on a timely basis. Also, projections of any evaluation of the effectiveness of the internal control over financial reporting to future periods are subject to the risk that the controls may become inadequate because of changes in conditions, or that the degree of compliance with the policies or procedures may deteriorate.
In our opinion, the Company maintained, in all material respects, effective internal control over financial reporting as of August 29, 2009, based on the criteria established in Internal Control — Integrated Framework issued by the Committee of Sponsoring Organizations of the Treadway Commission.
We have also audited, in accordance with the standards of the Public Company Accounting Oversight Board (United States), the financial statements as of and for the year ended August 29, 2009, of the Company and our report dated October 27, 2009 expressed an unqualified opinion on those financial statements.
|
|
|
|
/s/ Deloitte & Touche LLP |
|
|
Deloitte & Touche LLP |
|
|
Minneapolis, Minnesota |
|
|
|
|
|
October 27, 2009 |
|
27
To the Board
of Directors and Shareholders
Winnebago Industries, Inc.
Forest City, Iowa
We have audited the accompanying balance sheets of Winnebago Industries, Inc. (the “Company”) as of August 29, 2009 and August 30, 2008, and the related statements of income, stockholders’ equity, and cash flows for each of the three years in the period ended August 29, 2009. These financial statements are the responsibility of the Company’s management. Our responsibility is to express an opinion on these financial statements based on our audits.
We conducted our audits in accordance with the standards of the Public Company Accounting Oversight Board (United States). Those standards require that we plan and perform the audit to obtain reasonable assurance about whether the financial statements are free of material misstatement. An audit includes examining, on a test basis, evidence supporting the amounts and disclosures in the financial statements. An audit also includes assessing the accounting principles used and significant estimates made by management, as well as evaluating the overall financial statement presentation. We believe that our audits provide a reasonable basis for our opinion.
In our opinion, such financial statements present fairly, in all material respects, the financial position of the Company at August 29, 2009 and August 30, 2008, and the results of its operations and its cash flows for each of the three years in the period ended August 29, 2009 in conformity with accounting principles generally accepted in the United States of America.
As discussed in Note 11 to the financial statements, the Company changed its method of accounting for unrecognized tax benefits to conform to Statement of Financial Accounting Standards Interpretation No. 48 as of August 26, 2007.
We have also audited, in accordance with the standards of the Public Company Accounting Oversight Board (United States), the Company’s internal control over financial reporting as of August 29, 2009, based on the criteria established in Internal Control — Integrated Framework issued by the Committee of Sponsoring Organizations of the Treadway Commission and our report dated October 27, 2009 expressed an unqualified opinion on the Company’s internal control over financial reporting.
|
|
|
|
/s/ Deloitte & Touche LLP |
|
|
Deloitte & Touche LLP |
|
|
Minneapolis, Minnesota |
|
|
|
|
|
October 27, 2009 |
|
28
Winnebago Industries, Inc.
Consolidated Statements of Income
|
|
|
|
|
|
|
|
|
|
|
|
|
|
|
|
Year Ended (1) |
|
||||||||
|
(In thousands, except per share data) |
|
August 29, |
|
|
August 30, |
|
August 25, |
|
|||
|
|
|
|
|
|
|
|
|
|
|
|
|
|
Net revenues |
|
$ |
211,519 |
|
|
$ |
604,352 |
|
$ |
870,152 |
|
|
Cost of goods sold |
|
|
242,265 |
|
|
|
569,580 |
|
|
770,955 |
|
|
Gross (deficit) profit |
|
|
(30,746 |
) |
|
|
34,772 |
|
|
99,197 |
|
|
|
|
|
|
|
|
|
|
|
|
|
|
|
Operating expenses: |
|
|
|
|
|
|
|
|
|
|
|
|
Selling |
|
|
12,616 |
|
|
|
18,482 |
|
|
19,865 |
|
|
General and administrative |
|
|
15,298 |
|
|
|
21,359 |
|
|
24,446 |
|
|
Asset impairment |
|
|
855 |
|
|
|
4,686 |
|
|
- - - |
|
|
Total operating expenses |
|
|
28,769 |
|
|
|
44,527 |
|
|
44,311 |
|
|
|
|
|
|
|
|
|
|
|
|
|
|
|
Operating (loss) income |
|
|
(59,515 |
) |
|
|
(9,755 |
) |
|
54,886 |
|
|
|
|
|
|
|
|
|
|
|
|
|
|
|
Financial income |
|
|
1,452 |
|
|
|
4,314 |
|
|
6,523 |
|
|
(Loss) income before income taxes |
|
|
(58,063 |
) |
|
|
(5,441 |
) |
|
61,409 |
|
|
|
|
|
|
|
|
|
|
|
|
|
|
|
Provision (benefit) for taxes |
|
|
20,703 |
|
|
|
(8,225 |
) |
|
19,845 |
|
|
Net (loss) income |
|
$ |
(78,766 |
) |
|
$ |
2,784 |
|
$ |
41,564 |
|
|
|
|
|
|
|
|
|
|
|
|
|
|
|
(Loss) income per common share: |
|
|
|
|
|
|
|
|
|
|
|
|
Basic |
|
$ |
(2.71 |
) |
|
$ |
0.10 |
|
$ |
1.33 |
|
|
Diluted |
|
$ |
(2.71 |
) |
|
$ |
0.10 |
|
$ |
1.32 |
|
|
|
|
|
|
|
|
|
|
|
|
|
|
|
Weighted average common shares outstanding: |
|
|
|
|
|
|
|
|
|
|
|
|
Basic |
|
|
29,040 |
|
|
|
29,093 |
|
|
31,162 |
|
|
Diluted |
|
|
29,051 |
|
|
|
29,144 |
|
|
31,415 |
|
(1) Fiscal year ended August 30, 2008 contained 53 weeks; all other fiscal years contained 52 weeks.
See notes to consolidated financial statements.
29
Winnebago Industries, Inc.
Consolidated Balance Sheets
|
|
|
|
|
|
|
|
|
|
|
|
(In thousands, except per share data) |
|
|
August 29, 2009 |
|
|
August 30, 2008 |
|
||
|
Assets |
|
|
|
|
|
|
|
|
|
|
Current assets: |
|
|
|
|
|
|
|
|
|
|
Cash and cash equivalents |
|
|
$ |
36,566 |
|
|
$ |
17,851 |
|
|
Short-term investments |
|
|
|
13,500 |
|
|
|
3,100 |
|
|
Receivables, less allowance for doubtful accounts ($185 and $177, respectively) |
|
|
|
11,717 |
|
|
|
9,426 |
|
|
Inventories |
|
|
|
46,850 |
|
|
|
110,596 |
|
|
Prepaid expenses and other assets |
|
|
|
3,425 |
|
|
|
3,715 |
|
|
Income taxes receivable |
|
|
|
17,356 |
|
|
|
6,618 |
|
|
Deferred income taxes |
|
|
|
- - - |
|
|
|
11,575 |
|
|
Total current assets |
|
|
|
129,414 |
|
|
|
162,881 |
|
|
Property, plant and equipment, net |
|
|
|
28,040 |
|
|
|
40,097 |
|
|
Assets held for sale |
|
|
|
6,515 |
|
|
|
- - - |
|
|
Long-term investments |
|
|
|
19,794 |
|
|
|
37,538 |
|
|
Investment in life insurance |
|
|
|
22,451 |
|
|
|
22,123 |
|
|
Deferred income taxes |
|
|
|
- - - |
|
|
|
26,862 |
|
|
Other assets |
|
|
|
14,252 |
|
|
|
15,954 |
|
|
Total assets |
|
|
$ |
220,466 |
|
|
$ |
305,455 |
|
|
|
|
|
|
|
|
|
|
|
|
|
Liabilities and Stockholders’ Equity |
|
|
|
|
|
|
|
|
|
|
Current liabilities: |
|
|
|
|
|
|
|
|
|
|
Accounts payable |
|
|
$ |
10,370 |
|
|
$ |
15,631 |
|
|
Short-term ARS borrowings |
|
|
|
9,100 |
|
|
|
- - - |
|
|
Income taxes payable |
|
|
|
299 |
|
|
|
76 |
|
|
Accrued expenses: |
|
|
|
|
|
|
|
|
|
|
Accrued compensation |
|
|
|
10,204 |
|
|
|
10,070 |
|
|
Product warranties |
|
|
|
6,408 |
|
|
|
9,859 |
|
|
Self-insurance |
|
|
|
5,356 |
|
|
|
6,630 |
|
|
Accrued loss on repurchases |
|
|
|
1,199 |
|
|
|
661 |
|
|
Promotional |
|
|
|
2,270 |
|
|
|
2,642 |
|
|
Accrued dividends |
|
|
|
- - - |
|
|
|
3,489 |
|
|
Other |
|
|
|
4,748 |
|
|
|
5,275 |
|
|
Total current liabilities |
|
|
|
49,954 |
|
|
|
54,333 |
|
|
Total long-term liabilities: |
|
|
|
|
|
|
|
|
|
|
Unrecognized tax benefits |
|
|
|
9,012 |
|
|
|
9,469 |
|
|
Postretirement health care and deferred compensations benefits |
|
|
|
69,169 |
|
|
|
67,729 |
|
|
Total long-term liabilities |
|
|
|
78,181 |
|
|
|
77,198 |
|
|
Contingent liabilities and commitments |
|
|
|
|
|
|
|
|
|
|
Stockholders’ equity: |
|
|
|
|
|
|
|
|
|
|
Capital stock common, par value $0.50; authorized 60,000 shares, issued 51,776 shares |
|
|
|
25,888 |
|
|
|
25,888 |
|
|
Additional paid-in capital |
|
|
|
29,726 |
|
|
|
29,632 |
|
|
Retained earnings |
|
|
|
410,428 |
|
|
|
489,194 |
|
|
Accumulated other comprehensive income |
|
|
|
6,540 |
|
|
|
9,813 |
|
|
Treasury stock, at cost (22,690 and 22,706 shares, respectively) |
|
|
|
(380,251 |
) |
|
|
(380,603 |
) |
|
Total stockholders’ equity |
|
|
|
92,331 |
|
|
|
173,924 |
|
|
Total liabilities and stockholders’ equity |
|
|
$ |
220,466 |
|
|
$ |
305,455 |
|
See notes to consolidated financial statements.
30
Winnebago Industries, Inc.
Consolidated Statements of Changes in Stockholders’ Equity
|
|
|
|
|
|
|
|
|
|
|
|
|
|
|
|
|
|
|
|
|
|
|
|
|
|
(In thousands, except per share data) |
|
|
|
Additional |
|
Retained |
|
Accumulated |
|
|
|
Total |
|
||||||||||
|
Common Shares |
|
Treasury Stock |
|||||||||||||||||||||
|
Number |
|
Amount |
|
Number |
|
Amount |
|||||||||||||||||
|
Balance, August 26, 2006 |
|
51,776 |
|
$ |
25,888 |
|
$ |
22,268 |
|
$ |
480,446 |
|
|
- - - |
|
(20,633 |
) |
$ |
(310,280 |
) |
$ |
218,322 |
|
|
|
|
|
|
|
|
|
|
|
|
|
|
|
|
|
|
|
|
|
|
|
|
|
|
|
Stock option exercises |
|
- - - |
|
|
- - - |
|
|
3,312 |
|
|
- - - |
|
|
- - - |
|
449 |
|
|
6,799 |
|
|
10,111 |
|
|
Issuance of stock to directors |
|
- - - |
|
|
- - - |
|
|
241 |
|
|
- - - |
|
|
- - - |
|
15 |
|
|
219 |
|
|
460 |
|
|
Issuance of restricted stock |
|
- - - |
|
|
- - - |
|
|
(1,586 |
) |
|
- - - |
|
|
- - - |
|
106 |
|
|
1,586 |
|
|
- - - |
|
|
Stock-based compensation |
|
- - - |
|
|
- - - |
|
|
4,411 |
|
|
- - - |
|
|
- - - |
|
- - - |
|
|
- - - |
|
|
4,411 |
|
|
Payments for the purchase of common stock |
|
- - - |
|
|
- - - |
|
|
- - - |
|
|
- - - |
|
|
- - - |
|
(2,160 |
) |
|
(64,650 |
) |
|
(64,650 |
) |
|
Cash dividends paid and accrued on common stock - $0.42 per share |
|
- - - |
|
|
- - - |
|
|
- - - |
|
|
(12,954 |
) |
|
- - - |
|
- - - |
|
|
- - - |
|
|
(12,954 |
) |
|
Adjustments to initially apply new accounting standards, net of $6,474 tax |
|
- - - |
|
|
- - - |
|
|
- - - |
|
|
- - - |
|
|
11,090 |
|
- - - |
|
|
- - - |
|
|
11,090 |
|
|
Net income |
|
- - - |
|
|
- - - |
|
|
- - - |
|
|
41,564 |
|
|
- - - |
|
- - - |
|
|
- - - |
|
|
41,564 |
|
|
Balance, August 25, 2007 |
|
51,776 |
|
$ |
25,888 |
|
$ |
28,646 |
|
$ |
509,056 |
|
$ |
11,090 |
|
(22,223 |
) |
$ |
(366,326 |
) |
$ |
208,354 |
|
|
|
|
|
|
|
|
|
|
|
|
|
|
|
|
|
|
|
|
|
|
|
|
|
|
|
Stock option exercises |
|
- - - |
|
|
- - - |
|
|
(159 |
) |
|
- - - |
|
|
- - - |
|
59 |
|
|
992 |
|
|
833 |
|
|
Utilization of APIC pool due to stock award |
|
- - - |
|
|
- - - |
|
|
(268 |
) |
|
- - - |
|
|
- - - |
|
- - - |
|
|
- - - |
|
|
(268 |
) |
|
Issuance of stock to directors |
|
- - - |
|
|
- - - |
|
|
60 |
|
|
- - - |
|
|
- - - |
|
23 |
|
|
383 |
|
|
443 |
|
|
Issuance of restricted stock, net of forfeitures |
|
- - - |
|
|
- - - |
|
|
(2,119 |
) |
|
- - - |
|
|
- - - |
|
128 |
|
|
2,119 |
|
|
- - - |
|
|
Stock-based compensation |
|
- - - |
|
|
- - - |
|
|
3,472 |
|
|
- - - |
|
|
- - - |
|
- - - |
|
|
- - - |
|
|
3,472 |
|
|
Payments for the purchase of common stock |
|
- - - |
|
|
- - - |
|
|
- - - |
|
|
- - - |
|
|
- - - |
|
(693 |
) |
|
(17,771 |
) |
|
(17,771 |
) |
|
Cash dividends paid and accrued on common stock - $0.48 per share |
|
- - - |
|
|
- - - |
|
|
- - - |
|
|
(13,940 |
) |
|
- - - |
|
- - - |
|
|
- - - |
|
|
(13,940 |
) |
|
Adjustments to initially apply accounting standards net of $1,111 tax |
|
- - - |
|
|
- - - |
|
|
- - - |
|
|
(8,706 |
) |
|
- - - |
|
- - - |
|
|
- - - |
|
|
(8,706 |
) |
|
Prior service cost and actuarial loss, net of $180 tax |
|
- - - |
|
|
- - - |
|
|
- - - |
|
|
- - - |
|
|
(53 |
) |
- - - |
|
|
- - - |
|
|
(53 |
) |
|
Temporary impairment of investments, net of $738 tax |
|
- - - |
|
|
- - - |
|
|
- - - |
|
|
- - - |
|
|
(1,224 |
) |
- - - |
|
|
- - - |
|
|
(1,224 |
) |
|
Net income |
|
- - - |
|
|
- - - |
|
|
- - - |
|
|
2,784 |
|
|
- - - |
|
- - - |
|
|
- - - |
|
|
2,784 |
|
|
Balance, August 30, 2008 |
|
51,776 |
|
$ |
25,888 |
|
$ |
29,632 |
|
$ |
489,194 |
|
$ |
9,813 |
|
(22,706 |
) |
$ |
(380,603 |
) |
$ |
173,924 |
|
|
|
|
|
|
|
|
|
|
|
|
|
|
|
|
|
|
|
|
|
|
|
|
|
|
|
Stock option exercises |
|
- - - |
|
|
- - - |
|
|
(7 |
) |
|
- - - |
|
|
- - - |
|
1 |
|
|
17 |
|
|
10 |
|
|
Utilization of APIC pool due to stock award |
|
- - - |
|
|
- - - |
|
|
(411 |
) |
|
- - - |
|
|
- - - |
|
- - - |
|
|
- - - |
|
|
(411 |
) |
|
Issuance of stock to directors |
|
- - - |
|
|
- - - |
|
|
(312 |
) |
|
- - - |
|
|
- - - |
|
31 |
|
|
518 |
|
|
206 |
|
|
Forfeitures of restricted stock |
|
- - - |
|
|
- - - |
|
|
20 |
|
|
- - - |
|
|
- - - |
|
(1 |
) |
|
(20 |
) |
|
- - - |
|
|
Stock-based compensation |
|
- - - |
|
|
- - - |
|
|
804 |
|
|
- - - |
|
|
- - - |
|
- - - |
|
|
- - - |
|
|
804 |
|
|
Payments for the purchase of |
|
|
|
|
|
|
|
|
|
|
|
|
|
|
|
|
|
|
|
|
|
|
|
|
common stock |
|
- - - |
|
|
- - - |
|
|
- - - |
|
|
- - - |
|
|
- - - |
|
(15 |
) |
|
(163 |
) |
|
(163 |
) |
|
Prior service cost and actuarial loss, net of $2,263 tax |
|
- - - |
|
|
- - - |
|
|
- - - |
|
|
- - - |
|
|
(4,243 |
) |
- - - |
|
|
- - - |
|
|
(4,243 |
) |
|
Temporary impairment of investments, net of $586 tax |
|
- - - |
|
|
- - - |
|
|
- - - |
|
|
- - - |
|
|
970 |
|
- - - |
|
|
- - - |
|
|
970 |
|
|
Net loss |
|
- - - |
|
|
- - - |
|
|
- - - |
|
|
(78,766 |
) |
|
- - - |
|
- - - |
|
|
- - - |
|
|
(78,766 |
) |
|
Balance, August 29, 2009 |
|
51,776 |
|
$ |
25,888 |
|
$ |
29,726 |
|
$ |
410,428 |
|
$ |
6,540 |
|
(22,690 |
) |
$ |
(380,251 |
) |
$ |
92,331 |
|
See notes to consolidated financial statements.
31
Winnebago Industries, Inc.
Consolidated Statements of Cash Flows
|
|
|
|
|
|
|
|
|
|
|
|
|
|
|
|
|
|
Year Ended (1) |
|
||||||||
|
(In thousands) |
|
|
August 29, |
|
|
August 30, |
|
August 25, |
|
|||
|
|
|
|
|
|
|
|
|
|
|
|
|
|
|
Operating activities: |
|
|
|
|
|
|
|
|
|
|
|
|
|
Net (loss) income |
|
|
$ |
(78,766 |
) |
|
$ |
2,784 |
|
$ |
41,564 |
|
|
Adjustments to reconcile net (loss) income to net cash provided by operating activities: |
|
|
|
|
|
|
|
|
|
|
|
|
|
Depreciation |
|
|
|
7,834 |
|
|
|
9,907 |
|
|
10,495 |
|
|
Asset impairment |
|
|
|
855 |
|
|
|
4,686 |
|
|
- - - |
|
|
Stock-based compensation |
|
|
|
1,010 |
|
|
|
3,915 |
|
|
4,871 |
|
|
Deferred income taxes including valuation allowance |
|
|
|
37,440 |
|
|
|
3,490 |
|
|
(3,232 |
) |
|
Postretirement benefit income and deferred compensation expense |
|
|
|
1,252 |
|
|
|
1,414 |
|
|
1,539 |
|
|
Provision for doubtful accounts |
|
|
|
73 |
|
|
|
103 |
|
|
187 |
|
|
Loss on disposal of property |
|
|
|
75 |
|
|
|
64 |
|
|
4 |
|
|
Other |
|
|
|
132 |
|
|
|
74 |
|
|
39 |
|
|
Excess tax benefit from stock-based compensation |
|
|
|
- - - |
|
|
|
(92 |
) |
|
(1,587 |
) |
|
Increase in cash surrender value of life insurance policies |
|
|
|
(858 |
) |
|
|
(759 |
) |
|
(871 |
) |
|
Change in assets and liabilities: |
|
|
|
|
|
|
|
|
|
|
|
|
|
Inventories |
|
|
|
63,746 |
|
|
|
(9,388 |
) |
|
(24,127 |
) |
|
Receivables and prepaid assets |
|
|
|
(2,074 |
) |
|
|
21,022 |
|
|
(8,325 |
) |
|
Income taxes receivable and unrecognized tax benefits |
|
|
|
(8,708 |
) |
|
|
(17,665 |
) |
|
(3,243 |
) |
|
Accounts payable and accrued expenses |
|
|
|
(10,567 |
) |
|
|
(31,301 |
) |
|
11,686 |
|
|
Postretirement and deferred compensation benefits |
|
|
|
(3,172 |
) |
|
|
(2,632 |
) |
|
(1,249 |
) |
|
Net cash provided by (used in) operating activities |
|
|
|
8,272 |
|
|
|
(14,378 |
) |
|
27,751 |
|
|
|
|
|
|
|
|
|
|
|
|
|
|
|
|
Investing activities: |
|
|
|
|
|
|
|
|
|
|
|
|
|
Purchases of investments |
|
|
|
- - - |
|
|
|
(228,069 |
) |
|
(308,149 |
) |
|
Proceeds from the sale or maturity of short-term investments |
|
|
|
8,900 |
|
|
|
288,119 |
|
|
335,449 |
|
|
Purchases of property and equipment |
|
|
|
(3,473 |
) |
|
|
(3,720 |
) |
|
(5,245 |
) |
|
Proceeds from the sale of property |
|
|
|
296 |
|
|
|
298 |
|
|
279 |
|
|
Other |
|
|
|
(737 |
) |
|
|
(255 |
) |
|
(564 |
) |
|
Net cash provided by investing activities |
|
|
|
4,986 |
|
|
|
56,373 |
|
|
21,770 |
|
|
|
|
|
|
|
|
|
|
|
|
|
|
|
|
Financing activities: |
|
|
|
|
|
|
|
|
|
|
|
|
|
Payments for purchases of common stock |
|
|
|
(163 |
) |
|
|
(17,771 |
) |
|
(64,650 |
) |
|
Payments of cash dividends |
|
|
|
(3,489 |
) |
|
|
(13,997 |
) |
|
(12,517 |
) |
|
Borrowings on ARS portfolio |
|
|
|
9,100 |
|
|
|
- - - |
|
|
- - - |
|
|
Proceeds from issuance of treasury stock |
|
|
|
9 |
|
|
|
643 |
|
|
8,014 |
|
|
Excess tax benefit of stock-based compensation |
|
|
|
- - - |
|
|
|
92 |
|
|
1,587 |
|
|
Net cash provided by (used in) financing activities |
|
|
|
5,457 |
|
|
|
(31,033 |
) |
|
(67,566 |
) |
|
|
|
|
|
|
|
|
|
|
|
|
|
|
|
Net increase (decrease) in cash and cash equivalents |
|
|
|
18,715 |
|
|
|
10,962 |
|
|
(18,045 |
) |
|
Cash and cash equivalents at beginning of year |
|
|
|
17,851 |
|
|
|
6,889 |
|
|
24,934 |
|
|
Cash and cash equivalents at end of year |
|
|
$ |
36,566 |
|
|
$ |
17,851 |
|
$ |
6,889 |
|
|
|
|
|
|
|
|
|
|
|
|
|
|
|
|
Supplement cash flow disclosure: |
|
|
|
|
|
|
|
|
|
|
|
|
|
Income taxes paid |
|
|
$ |
191 |
|
|
$ |
8,487 |
|
$ |
26,319 |
|
(1) Fiscal year ended August 30, 2008 contained 53 weeks; all other fiscal years contained 52 weeks.
See notes to consolidated financial statements.
32
Winnebago Industries, Inc.
Notes to Consolidated Financial Statements
Note 1: Summary of Significant Accounting Policies
Principles of Consolidation
The consolidated
financial statements include the parent company and in years prior to Fiscal
2009, subsidiary companies. All material intercompany balances and transactions
with subsidiaries have been eliminated.
Fiscal Period
We follow a
52-/53-week fiscal year, ending the last Saturday in August. The financial
statements for Fiscal 2009 and 2007 contained 52 weeks; Fiscal 2008 contained
53 weeks.
Use of Estimates
The preparation of
financial statements in conformity with accounting principles generally
accepted in the U.S. requires management to make estimates and assumptions that
affect the reported amounts of assets and liabilities and disclosure of
contingent assets and liabilities at the date of the financial statements and
the reported amounts of revenues and expenses during the reporting periods.
Actual results could differ from those estimates.
Cash and Cash Equivalents
Cash and cash
equivalents consist primarily of highly liquid investments with an original
maturity of three months or less. The carrying amount approximates fair value
due to the short maturity of the investments.
Fair Value Disclosures of Financial Instruments
All financial
instruments are carried at amounts believed to approximate fair value.
Derivative Instruments and Hedging Activities
All contracts that
contain provisions meeting the definition of a derivative also meet the
requirements of, and have been designated as, normal purchases or sales. Our
policy is to not enter into contracts with terms that cannot be designated as
normal purchases or sales.
Allowance for Doubtful Accounts
The allowance for
doubtful accounts is based on historical loss experience and any specific
customer collection issues identified. Additional amounts are provided through
charges to income as we believe necessary after evaluation of receivables and
current economic conditions. Amounts which are considered to be uncollectible
are written off and recoveries of amounts previously written off are credited
to the allowance upon recovery.
Inventories
Substantially, all
inventories are stated at the lower of cost or market, determined on the LIFO
basis. Manufacturing cost includes materials, labor and manufacturing overhead.
Unallocated overhead and abnormal costs are expensed as incurred.
Property and Equipment
Depreciation of
property and equipment is computed using the straight-line method on the cost
of the assets, less allowance for salvage value where appropriate, at rates
based upon their estimated service lives as follows:
|
|
|
|
|
|
Asset Class |
|
Asset Life |
|
|
Buildings |
|
10-30 yrs. |
|
|
Machinery and equipment |
|
3-10 yrs. |
|
|
Transportation equipment |
|
4-6 yrs. |
|
We review our long-lived depreciable assets for impairment annually or whenever events or changes in circumstances indicate that the carrying value of an asset may not be recoverable from future cash flows. If the carrying value of a long-lived asset is impaired, an impairment charge is recorded for the amount by which the carrying value of the long-lived asset exceeds its fair value. We assess the potential impairment of long-lived assets in accordance with Statement of Financial Accounting Standards (SFAS) No. 144, Accounting for the Impairment or Disposal of Long-Lived Assets. We assessed the fair value of certain properties which were idled and are listed for sale (see Note 6). We also reviewed all other long-lived depreciable assets for impairment, noting no additional impairment.
33
Winnebago Industries, Inc.
Notes to Consolidated Financial Statements
Income Taxes
We account for income
taxes in accordance with SFAS No. 109, Accounting
for Income Taxes. As part of the process of preparing our
consolidated financial statements, we are required to estimate our income taxes
in each of the jurisdictions in which we operate. This process involves
estimating our current tax exposure together with assessing temporary
differences resulting from differing treatment of items for tax and accounting
purposes. These temporary differences result in deferred tax assets and
liabilities, which are included within our consolidated balance sheet. We then
assess the likelihood that our deferred tax assets will be realized based on
future taxable income and, to the extent we believe that recovery is not
likely, we establish a valuation allowance. To the extent we establish a
valuation allowance or change this allowance in a period, we include an expense
or a benefit within the tax provision in our Consolidated Statements of Income.
Legal
Our accounting policy
regarding litigation expense is to accrue for probable exposure including
estimated defense costs if we are able to estimate the financial impact.
Revenue Recognition
Generally, revenues
for motor homes are recorded when all of the following conditions are met: an
order for a product has been received from a dealer, written or verbal approval
for payment has been received from the dealer’s floorplan financing
institution, and the product is delivered to the dealer who placed the order.
Most sales are financed under floorplan financing arrangements with banks or
finance companies.
Revenues of our OEM components and motor home related parts are recorded as the products are shipped from our location. The title of ownership transfers on these products as they leave our location due to the freight terms of F.O.B. - Forest City, Iowa.
Sales Promotions and Incentives
We accrue for sales
promotions and incentive expenses, which are recognized as a reduction to
revenues, at the time of sale to the dealer or when the sales incentive is
offered to the dealer or retail customer. Examples of sales promotions and
incentive programs include dealer and consumer rebates, volume discounts,
retail financing programs and dealer sales associate incentives. Sales
promotion and incentive expenses are estimated based upon then current program
parameters, such as unit or retail volume and historical rates. Actual results
may differ from these estimates if market conditions dictate the need to
enhance or reduce sales promotion and incentive programs or if the retail
customer usage rate varies from historical trends. Historically, sales
promotion and incentive expenses have been within our expectations and
differences have not been material.
Shipping Revenues and Expenses
Shipping revenues for
products shipped are included within sales, while shipping expenses are
included within cost of goods sold.
Research and Development
Research and
development expenditures are expensed as incurred. A portion of these
expenditures qualify for state and federal tax benefits. Development activities
generally relate to creating new products and improving or creating variations
of existing products to meet new applications. During Fiscal 2009, 2008 and
2007, we spent approximately $3.3 million, $4.1 million and $4.3 million,
respectively, on research and development activities.
Income Per Common Share
Basic income per
common share is computed by dividing net income by the weighted average common shares
outstanding during the period.
Diluted income per common share is computed by dividing net income by the weighted average common shares outstanding plus the incremental shares that would have been outstanding upon the assumed exercise of dilutive stock options. (See Note 15 to the Consolidated Financial Statements.)
Subsequent Events
We evaluated events
occurring between the end of our most recent fiscal year and October 27, 2009,
the date the financial statements were issued. There were no material
subsequent events, except for those described in Note 7.
34
Winnebago Industries, Inc.
Notes to Consolidated Financial Statements
New Accounting Pronouncements
In June 2008, the
Financial Accounting Standards Board (FASB) issued a FASB Staff Position (FSP)
on the FASB’s Emerging Issues Task Force (EITF) Issue No. 03-06-1, Determining Whether Instruments Granted in
Share-Based Payment Transactions Are Participating Securities, (FSP
EITF 03-06-1). This FSP addresses whether instruments granted in share-based
payment transactions are participating securities prior to vesting and,
therefore, need to be included in the earnings allocation in computing earnings
per share (EPS) under the two-class method described in SFAS No. 128, Earnings Per Share. It affects entities
that accrue or pay nonforfeitable cash dividends on share-based payment awards
during the awards’ service period. FSP EITF 03-06-1 is effective for fiscal
years beginning after December 15, 2008 (our Fiscal 2010) and interim periods
within those fiscal years and will require a retrospective adjustment to all
prior period EPS. We are currently evaluating the impact this FSP will have on
our calculation and presentation of EPS.
Note 2: Restructuring Costs
On June 11, 2009, we announced the decision to close our Hampton, Iowa fiberglass manufacturing facility. A portion of the production capabilities for fiberglass components will be relocated to our Forest City, Iowa facility with the balance being outsourced. As a result of the Hampton facility closure, we incurred a noncash impairment charge of approximately $855,000. We also recorded severance charges of approximately $100,000 and relocation expenses of approximately $100,000 in Fiscal 2009. The closure is expected to be completed in the first quarter of Fiscal 2010. The severance will be paid out during the first quarter of Fiscal 2010, as well as approximately $300,000 in other costs associated with the idling of the facility. The Hampton facility was listed for sale during the fourth quarter of Fiscal 2009.
During the fourth quarter of Fiscal 2008, we closed our manufacturing facility in Charles City, Iowa which primarily assembled Class C motor homes and moved that production to our Forest City, Iowa campus. As a result of idling this facility, we recorded a noncash asset impairment charge of approximately $4.7 million in Fiscal 2008. Also, as a result of position eliminations in Charles City and other position eliminations within the Company throughout the fiscal year, severance charges of $1.3 million were incurred and paid. The Charles City facility was listed for sale during the fourth quarter of Fiscal 2009.
Note 3: Fair Value Measurements
We adopted SFAS No. 157 on August 31, 2008. This standard defines fair value, establishes a framework for measuring fair value and expands disclosure requirements about fair value measurements. SFAS No. 157 defines fair value as the price that would be received to sell an asset or paid to transfer a liability (an exit price) in the principal or most advantageous market for the asset or liability in an orderly transaction between market participants on the measurement date. The fair value hierarchy prescribed by SFAS No. 157 contains three levels as follows:
Level 1 — Unadjusted quoted prices that are available in active markets for the identical assets or liabilities at the measurement date.
Level 2 — Other observable inputs available at the measurement date, other than quoted prices included in Level 1, either directly or indirectly, including:
|
|
|
|
|
|
• |
Quoted prices for similar assets or liabilities in active markets; |
|
|
• |
Quoted prices for identical or similar assets in nonactive markets; |
|
|
• |
Inputs other than quoted prices that are observable for the asset or liability; and |
|
|
• |
Inputs that are derived principally from or corroborated by other observable market data. |
Level 3 — Unobservable inputs that cannot be corroborated by observable market data and reflect the use of significant management judgment. These values are generally determined using pricing models for which the assumptions utilize management’s estimates of market participant assumptions.
Assets and Liabilities that are Measured at Fair Value on a Recurring Basis
The fair value hierarchy requires the use of observable market data when available. In instances in which the inputs used to measure fair value fall into different levels of the fair value hierarchy, the fair value measurement has been determined based
35
Winnebago Industries, Inc.
Notes to Consolidated Financial Statements
on the lowest level input that is significant to the fair value measurement in its entirety. Our assessment of the significance of a particular item to the fair value measurement in its entirety requires judgment, including the consideration of inputs specific to the asset or liability. The following table sets forth by level within the fair value hierarchy our financial assets that were accounted for at fair value on a recurring basis at August 29, 2009, according to the valuation techniques we used to determine their fair values:
|
|
|
|
|
|
|
|
|
|
|
|
|
|
|
|
|
|
|
|
|
Fair Value at |
|
|
Fair Value Measurements |
|
||||||||
|
|
|
|
August 29, |
|
|
Using Inputs Considered As |
|
||||||||
|
(In thousands) |
|
|
2009 |
|
|
Level 1 |
|
Level 2 |
|
Level 3 |
|
||||
|
Assets |
|
|
|
|
|
|
|
|
|
|
|
|
|
|
|
|
Cash and cash equivalents |
|
|
$ |
36,566 |
|
|
$ |
36,566 |
|
$ |
- - - |
|
$ |
- - - |
|
|
Short-term investments (includes Put Rights) |
|
|
|
13,500 |
|
|
|
- - - |
|
|
- - - |
|
|
13,500 |
|
|
Long-term investments |
|
|
|
19,794 |
|
|
|
- - - |
|
|
- - - |
|
|
19,794 |
|
|
Assets that fund deferred compensation |
|
|
|
10,858 |
|
|
|
10,858 |
|
|
- - - |
|
|
- - - |
|
The following table provides a reconciliation between the beginning and ending balances of items measured at fair value on a recurring basis in the table above that used significant unobservable inputs (Level 3):
|
|
|
|
|
|
|
|
(In thousands) |
|
|
August 29, 2009 |
|
|
|
Balance at beginning of period |
|
|
$ |
37,538 |
|
|
Net realized loss included in earnings |
|
|
|
- - - |
|
|
Net change included in other comprehensive income |
|
|
|
1,556 |
|
|
Sales |
|
|
|
(5,800 |
) |
|
Balance at the end of the year |
|
|
$ |
33,294 |
|
The following methods and assumptions were used to estimate the fair value of each class of financial instrument:
Cash and cash equivalents. The carrying value of cash equivalents approximates fair value as maturities are less than three months. Our cash equivalents are comprised of money market funds traded in an active market with no restrictions and are classified as Level 1.
Short-term and long-term investments. Our debt securities are comprised of ARS and Put Rights (as defined and as described in Note 4). Our short-term and long-term ARS related investments are classified as Level 3 as quoted prices were unavailable due to events described in Note 4. Due to limited market information, we utilized a discounted cash flow (“DCF”) model to derive an estimate of fair value at August 29, 2009. The assumptions used in preparing the DCF model included estimates with respect to the amount and timing of future interest and principal payments, forward projections of the interest rate benchmarks, the probability of full repayment of the principal considering the credit quality and guarantees in place and the rate of return required by investors to own such securities given the current liquidity risk associated with ARS.
Assets that fund deferred compensation. Our assets that fund deferred compensation are marketable equity securities measured at fair value using quoted market prices and primarily consist of equity-based mutual funds. They are classified as Level 1 as they are traded in an active market for which closing stock prices are readily available. These securities fund the Executive Share Option Plan, a deferred compensation program, and are presented as other assets in the accompanying consolidated balance sheets.
Note 4: Investments
We own investments in marketable securities that have been designated as “available for sale” or “trading securities” in accordance with SFAS No. 115, Accounting for Certain Investments in Debt and Equity Securities. Available for sale securities are carried at fair value with the unrealized gains and losses reported in “Accumulated Other Comprehensive Income,” a component of stockholders’ equity. Trading securities are carried at fair value with unrealized gains and losses reported in financial income/expense.
At August 29, 2009, we held $33.7 million (par value) of investments comprised of tax-exempt auction rate securities (ARS), which are variable-rate debt securities and have a long-term maturity with the interest rate being reset through Dutch auctions that are typically held every 7, 28 or 35 days. Prior to February 2008, these securities traded at par and are callable at par at
36
Winnebago Industries, Inc.
Notes to Consolidated Financial Statements
the option of the issuer. Interest is typically paid at the end of each auction period or semiannually. The vast majority of the ARS we hold are AAA/Aaa rated with most collateralized by student loans guaranteed by the U.S. Government under the Federal Family Education Loan Program.
Since February 2008, most ARS auctions have failed for these securities and there is no assurance that future auctions will succeed and, as a result, our ability to liquidate our investment and fully recover the par value in the near term may be limited or nonexistent. We have no reason to believe that any of the underlying issuers of our ARS are presently at risk of default. We have continued to receive interest payments on the ARS in accordance with their terms. We believe we will ultimately be able to liquidate our ARS related investments without significant loss primarily due to the collateral securing the ARS and the legal settlement agreement we have entered into with UBS AG (“UBS”). As noted below, our UBS settlement allows for a portion of our ARS to be redeemed at par as early as June 30, 2010. However, the remaining portfolio could take until final maturity of the ARS (up to 25 years) to realize the par value of our investments. Due to the changes and uncertainty in the ARS market, we believe the recovery period for these investments is likely to be longer than 12 months and as a result, we have classified these investments as long-term as of August 29, 2009. Our short-term ARS investments of $13.5 million relate to the UBS portion of our portfolio including the Put Rights provided to us by the legal settlement described below.
In November 2008, we elected to participate in a rights offering by UBS, one of our brokers, which provide us with rights (the “Put Rights”) to sell to them $13.5 million at par value of our ARS portfolio, purchased through UBS, at any time during a two-year sale period beginning June 30, 2010. By electing to participate in the rights offering, we granted UBS the right, exercisable at any time prior to June 30, 2010 or during the two-year sale period, to purchase or cause the sale of our ARS (the “Call Right”). UBS has stated that it will only exercise the Call Right for the purpose of restructurings, dispositions or other solutions that will provide their clients with par value for their ARS. UBS has agreed to pay their clients the par value of their ARS within one day of settlement of any Call Right transaction. Notwithstanding the Call Right, we are permitted to sell ARS to parties other than UBS, in which case the Put Rights attached to the ARS that are sold would be extinguished. The terms of the legal settlement agreement also allowed us to borrow on a portion of our portfolio at “no net cost” and as a result, we borrowed $9.1 million under this arrangement, which is presented as short-term ARS borrowings on our balance sheet. We have the ability to maintain the “no net cost” loans until the securities are liquidated or they reach the June 2010 put date.
At August 29, 2009, there was insufficient observable ARS market information available to determine the fair value of our ARS investments, including the Put Rights. Therefore, we estimated fair value by incorporating assumptions that market participants would use in their estimates of fair value. Some of these assumptions included credit quality, final stated maturities, estimates on the probability of the issue being called prior to final maturity, impact due to extended periods of maximum auction rates and broker quotes from independent evaluators. Based on this analysis, we recorded a temporary impairment of $406,000 related to our long-term ARS investments of $20.2 million (par value) that were not part of the UBS settlement as of August 29, 2009. These same assumptions were used to estimate the fair value of our UBS ARS portfolio described above, including the Put Rights.
Note 5: Inventories
Inventories consist of the following:
|
|
|
|
|
|
|
|
|
|
|
|
(In thousands) |
|
|
August 29, 2009 |
|
|
August 30, 2008 |
|
||
|
Finished goods |
|
|
$ |
18,709 |
|
|
$ |
41,716 |
|
|
Work-in-process |
|
|
|
24,982 |
|
|
|
31,187 |
|
|
Raw materials |
|
|
|
33,505 |
|
|
|
75,010 |
|
|
|
|
|
|
77,196 |
|
|
|
147,913 |
|
|
LIFO reserve |
|
|
|
(30,346 |
) |
|
|
(37,317 |
) |
|
Total inventories |
|
|
$ |
46,850 |
|
|
$ |
110,596 |
|
The above value of inventories, before reduction for the LIFO reserve, approximates replacement cost at the respective dates. Due to a liquidation of LIFO inventory values as a result of a significant reduction of inventory levels during Fiscal 2009, we recorded a reduction to LIFO reserves of $7.0 million, which is net of inflation.
37
Winnebago Industries, Inc.
Notes to Consolidated Financial Statements
Note 6: Property, Plant and Equipment and Assets Held for Sale
Property, plant and equipment is stated at cost, net of accumulated depreciation and consists of the following:
|
|
|
|
|
|
|
|
|
|
|
|
(In thousands) |
|
|
August 29, 2009 |
|
|
August 30, 2008 |
|
||
|
Land |
|
|
$ |
772 |
|
|
$ |
934 |
|
|
Buildings |
|
|
|
49,220 |
|
|
|
55,977 |
|
|
Machinery and equipment |
|
|
|
92,625 |
|
|
|
97,002 |
|
|
Transportation |
|
|
|
3,457 |
|
|
|
9,455 |
|
|
|
|
|
|
146,074 |
|
|
|
163,368 |
|
|
Less accumulated depreciation |
|
|
|
(118,034 |
) |
|
|
(123,271 |
) |
|
Total property, plant and equipment, net |
|
|
$ |
28,040 |
|
|
$ |
40,097 |
|
Assets held for sale consists of the following:
|
|
|
|
|
|
|
|
|
|
|
|
(In thousands) |
|
|
August 29, 2009 |
|
|
|
|
||
|
Airplane, net |
|
|
$ |
2,276 |
|
|
|
|
|
|
Manufacturing facilities, net (1) |
|
|
|
4,239 |
|
|
|
|
|
|
Total assets held for sale |
|
|
$ |
6,515 |
|
|
|
|
|
|
|
|
|
(1) |
Manufacturing facilities consist of an idled manufacturing facility in Charles City, Iowa and a fiberglass manufacturing facility in Hampton, Iowa. |
We recorded an impairment of $855,000 for the Hampton facility in the fourth quarter of Fiscal 2009 and an impairment of $4.7 million for the Charles City manufacturing facility in the fourth quarter of Fiscal 2008.
Note 7: Credit Facilities
On September 17, 2008, we entered into a two-year $25.0 million credit and security agreement with Wells Fargo Bank, National Association. No borrowings were made during Fiscal 2009 under this agreement. As of August 29, 2009, our net equity of $92.3 million was not in compliance with the minimum tangible net worth financial covenant of this agreement. On October 13, 2009, we terminated this agreement in accordance with its terms in order to enter into a new credit facility that would provide more financial flexibility over a longer period of time.
On October 13, 2009, the Company entered into a Loan and Security Agreement (the “Loan Agreement”) with Burdale Capital Finance, Inc., as Agent. The Loan Agreement provides for an initial $20.0 million revolving credit facility, based on the Company’s eligible accounts receivable and eligible inventory, expiring on October 13, 2012, unless terminated earlier in accordance with its terms. The Loan Agreement contains no financial covenant restrictions for borrowings up to $12.5 million; provided that borrowings cannot exceed the Asset Coverage Amount (as defined in the Loan Agreement) divided by 2.25. The Loan Agreement also includes a framework to expand the size of the facility up to $50.0 million, based on mutually agreeable covenants to be determined at the time of expansion. Interest on loans made under the credit facility will be based on the greater of LIBOR or 2.0 percent plus a margin of 4.0 percent or the greater of prime rate or 4.25 percent plus a margin of 3.0 percent. No borrowings have been made under the Loan Agreement through October 27, 2009. The Company intends to use any loan proceeds from the Loan Agreement for working capital and for other general corporate purposes, if needed.
The Loan Agreement contains typical affirmative representations and covenants for a credit agreement of this size and nature. The Loan Agreement requires us to comply with certain financial covenants if we borrow more than $12.5 million, including minimum EBITDA and minimum liquidity as defined in the agreement and limitations on capital expenditures. Additionally, the Loan Agreement contains negative covenants limiting our ability, among other things, to incur debt, grant liens, make acquisitions, make certain investments, pay certain dividends and distributions (including stock repurchases), engage in mergers, consolidations or acquisitions and sell certain assets. Our obligations under the Loan Agreement are secured by a security interest in all of our accounts and other receivables, chattel paper, documents, deposit accounts, instruments, equipment, inventory, investment property, leasehold interest, cash and cash equivalents, letter-of-credit rights, most real property and fixtures and certain other business assets.
38
Winnebago Industries, Inc.
Notes to Consolidated Financial Statements
Note 8: Warranty
We provide our motor home customers a comprehensive 12-month/15,000-mile warranty on our Class A, B and C motor homes, and a 3-year/36,000-mile structural warranty on Class A and C sidewalls and floors. We have also incurred costs for certain warranty-type expenses which occurred after the normal warranty period. We have voluntarily agreed to pay such costs to help protect the reputation of our products and the goodwill of our customers. We record our warranty liabilities based on our estimate of the amounts necessary to settle future and existing claims on products sold as of the balance sheet date. We also incur costs as a result of additional service actions not covered by our warranties, including product recalls and customer satisfaction actions.
Changes in our product warranty liability during Fiscal 2009 and Fiscal 2008 are as follows:
|
|
|
|
|
|
|
|
|
|
|
|
(In thousands) |
|
|
August 29, 2009 |
|
|
August 30, 2008 |
|
||
|
Balance at beginning of year |
|
|
$ |
9,859 |
|
|
$ |
11,259 |
|
|
Provision |
|
|
|
3,843 |
|
|
|
10,967 |
|
|
Claims paid |
|
|
|
(7,294 |
) |
|
|
(12,367 |
) |
|
Balance at end of year |
|
|
$ |
6,408 |
|
|
$ |
9,859 |
|
Note 9: Employee and Retiree Benefits
Postretirement health care and deferred compensation benefits are as follows:
|
|
|
|
|
|
|
|
|
|
|
|
(In thousands) |
|
|
August 29, 2009 |
|
|
August 30, 2008 |
|
||
|
Postretirement health care benefit cost |
|
|
$ |
35,312 |
|
|
$ |
30,827 |
|
|
Non-qualified deferred compensation |
|
|
|
26,092 |
|
|
|
26,583 |
|
|
Executive share option plan liability |
|
|
|
8,444 |
|
|
|
10,999 |
|
|
SERP benefit liability |
|
|
|
3,259 |
|
|
|
2,953 |
|
|
Executive deferred compensation |
|
|
|
59 |
|
|
|
55 |
|
|
Total postretirement health care and deferred compensation benefits |
|
|
|
73,166 |
|
|
|
71,417 |
|
|
Less current portion |
|
|
|
(3,997 |
) |
|
|
(3,688 |
) |
|
Long-term postretirement health care and deferred compensation benefits |
|
|
$ |
69,169 |
|
|
$ |
67,729 |
|
Postretirement Health Care Benefits
We provide certain health
care and other benefits for retired employees hired before April 1, 2001, who
have fulfilled eligibility requirements at age 55 with 15 years of continuous
service. Retirees are required to pay a monthly premium for medical coverage
based on years of service and current age at retirement. Our postretirement health
care plan currently is not funded. We use a September 1 measurement date for
this plan.
We adopted SFAS No. 158, Employers’ Accounting for Defined Benefit Pension and Other Postretirement Plans — an amendment of FASB Statement Nos. 87, 88, 106, and 132(R) at the end of Fiscal 2007. SFAS No. 158 requires that the full benefit obligation be included on the balance sheet. Prior service credit and actuarial gains and losses are included in accumulated other comprehensive income and reclassified into net income in future periods. The adoption resulted in a decrease in total assets of $6.4 million, a decrease in total liabilities of $17.6 million and an increase in total stockholders’ equity of $11.1 million, net of tax. The adoption of this standard had no impact on our consolidated results of operations.
The following tables present reconciliations of the benefit obligation and the funded status of the plan:
|
|
|
|
|
|
|
|
|
|
|
|
(In thousands) |
|
|
August 29, 2009 |
|
|
August 30, 2008 |
|
||
|
Change in benefit obligation: |
|
|
|
|
|
|
|
|
|
|
Accumulated benefit obligation at beginning of year |
|
|
$ |
30,827 |
|
|
$ |
32,560 |
|
|
Interest cost |
|
|
|
2,119 |
|
|
|
2,003 |
|
|
Service cost |
|
|
|
590 |
|
|
|
734 |
|
|
Net benefits paid |
|
|
|
(829 |
) |
|
|
(1,046 |
) |
|
Actuarial loss (gain) |
|
|
|
2,605 |
|
|
|
(3,424 |
) |
|
Benefit obligation at end of year |
|
|
$ |
35,312 |
|
|
$ |
30,827 |
|
39
Winnebago Industries, Inc.
Notes to Consolidated Financial Statements
The discount rate used in determining the accumulated postretirement benefit obligation was 5.7 percent at August 29, 2009 and 7.0 percent at August 30, 2008. In Fiscal 2009, the decrease in the discount rate resulted in an increase to the benefit obligation, presented as an actuarial loss in the table above. The average assumed health care cost trend rate used in measuring the accumulated postretirement benefit obligations as of August 29, 2009 was 8.5 percent, decreasing each successive year until it reaches 4.5 percent in 2018, after which it remains constant.
Net periodic postretirement benefit income for the past three fiscal years consisted of the following components:
|
|
|
|
|
|
|
|
|
|
|
|
|
|
|
(In thousands) |
|
|
August 29, 2009 |
|
|
August 30, 2008 |
|
August 25, 2007 |
|
|||
|
Interest cost |
|
|
$ |
2,119 |
|
|
$ |
2,003 |
|
$ |
1,888 |
|
|
Service cost |
|
|
|
590 |
|
|
|
734 |
|
|
809 |
|
|
Net amortization and deferral |
|
|
|
(3,498 |
) |
|
|
(3,298 |
) |
|
(3,187 |
) |
|
Net periodic postretirement benefit income |
|
|
$ |
(789 |
) |
|
$ |
(561 |
) |
$ |
(490 |
) |
Amounts not yet recognized in net periodic benefit cost and included in accumulated other comprehensive income (before taxes) are as follows:
|
|
|
|
|
|
|
|
|
|
|
|
(In thousands) |
|
|
August 29, 2009 |
|
|
August 30, 2008 |
|
||
|
Prior service credit |
|
|
$ |
(26,200 |
) |
|
$ |
(30,399 |
) |
|
Net actuarial loss |
|
|
|
14,613 |
|
|
|
12,709 |
|
|
Accumulated other comprehensive income |
|
|
$ |
(11,587 |
) |
|
$ |
(17,690 |
) |
The estimated actuarial net loss and prior service credit that will be amortized from accumulated other comprehensive income as a reduction to net periodic benefit cost in Fiscal 2010 will be $3.3 million.
Expected future benefit payments for postretirement health care for the next ten years are as follows:
|
|
|
|
|
|
|
|
(In thousands) |
|
|
|
|
|
|
Year Ended |
|
|
Amount |
|
|
|
2010 |
|
|
$ |
1,193 |
|
|
2011 |
|
|
|
1,393 |
|
|
2012 |
|
|
|
1,558 |
|
|
2013 |
|
|
|
1,714 |
|
|
2014 |
|
|
|
1,893 |
|
|
2015-2019 |
|
|
|
11,814 |
|
|
|
|
|
$ |
19,565 |
|
The expected benefits have been estimated based on the same assumptions used to measure our benefit obligation as of August 29, 2009 and include benefits attached to estimated current employees’ future services.
Deferred Compensation Benefits
Non-Qualified Deferred Compensation Program
(1981)
We have a
Non-Qualified Deferred Compensation Program which permitted key employees to
annually elect to defer a portion of their compensation until their retirement.
The plan has been closed to any additional deferrals since January 2001. The
retirement benefit to be provided is based upon the amount of compensation
deferred and the age of the individual at the time of the contracted deferral.
An individual generally vests at the later of age 55 and five years of service
since the deferral was made. For deferrals prior to December 1992, vesting
occurs at the later of age 55 and five years of service from first deferral or
20 years of service. Deferred compensation expense was $1.9 million, $1.8
million and $1.8 million in Fiscal 2009, 2008 and 2007, respectively. Total
deferred compensation liabilities were $26.1million and $26.6 million at August
29, 2009 and August 30, 2008, respectively.
Supplemental Executive Retirement Plan
(SERP) (Formerly Split Dollar Life Insurance)
The primary
purpose of this plan was to provide the Company’s officers and managers with
supplemental retirement income for a period of 15 years after retirement. We
have not offered this plan on a continuing basis to members of management since
1998. The plan was funded with individual whole life insurance policies owned
by the named insured officer or manager. We initially paid the life insurance
premiums on the life of the individual and the individual would receive life
insurance and supplemental cash payment during the 15 years following
retirement. In October 2008, the plan was amended as a result of changes in the
tax and accounting regulations and rising administrative costs. Under the
redesigned SERP, the
40
Winnebago Industries, Inc.
Notes to Consolidated Financial Statements
underlying life insurance policies previously owned by the insured individual became company-owned life insurance (COLI) by a release of all interests by the participant and assignment to us as a prerequisite to participation in the SERP and transition from the Split Dollar Program. Total SERP liabilities were $3.3 million and $3.0 million at August 29, 2009 and August 30, 2008, respectively. This program remains closed to new employee participation.
To assist in funding the deferred compensation and SERP liabilities, we have invested in COLI policies. The cash surrender value of these policies is presented as investment in life insurance in the accompanying consolidated balance sheets and consist of the following:
|
|
|
|
|
|
|
|
|
|
|
|
(In thousands) |
|
|
August 29, 2009 |
|
|
August 30, 2008 |
|
||
|
Cash value |
|
|
$ |
49,907 |
|
|
$ |
40,495 |
|
|
Borrowings |
|
|
|
(27,456 |
) |
|
|
(24,159 |
) |
|
Cash surrender value |
|
|
|
22,451 |
|
|
|
16,336 |
|
|
Split dollar life insurance |
|
|
|
- - - |
|
|
|
5,787 |
|
|
Total investment in life insurance |
|
|
$ |
22,451 |
|
|
$ |
22,123 |
|
Non-Qualified Share Option Program (2001)
The Non-Qualified
Share Option Program permitted participants in the Executive Share Option Plan
(the “Executive Plan”) to choose to exchange a portion of their salary or other
eligible compensation for options on selected securities, primarily
equity-based mutual funds. These assets are treated as trading securities and
are recorded at fair value. The Executive Plan has been closed to any
additional deferrals since January 2005. Total Executive Plan assets are
included in other assets in the accompanying consolidated balance sheets. Such
assets on August 29, 2009 and August 30, 2008 were $10.9 million and $13.5
million, respectively, and the liabilities were $8.4 million and $11.0 million,
respectively. The difference between the asset and liability balances
represents the additional 25 percent we contributed at the time of the initial
deferrals to aid in potential additional earnings to the participant. This
contribution is required to be paid back to us when the option is exercised. A
participant may exercise his or her options per the plan document, but there is
a requirement that after these dollars have been invested for fifteen years the
participant is required to exercise such option.
Executive Deferred Compensation Plan (2007)
In December 2006,
we adopted the Winnebago Industries, Inc. Executive Deferred Compensation Plan
(the “Executive Deferred Compensation Plan”). Under the Executive Deferred
Compensation Plan, corporate officers and certain key employees may annually
choose to defer up to 50 percent of their salary and up to 100 percent of their
cash incentive awards. The assets are presented as other assets and the
liabilities are presented as postretirement health care and deferred
compensation benefits in the accompanying consolidated balance sheets. Such
assets on August 29, 2009 and August 30, 2008 were $59,000 and $55,000,
respectively, and liabilities were $59,000 and $55,000, respectively.
Profit Sharing Plan
We have a qualified profit
sharing and contributory 401(k) plan for eligible employees. The plan provides
quarterly discretionary cash contributions as approved by our Board of
Directors. Contributions to the plan for Fiscal 2009, 2008 and 2007 were
$859,000, $2.3 million and $2.5 million, respectively.
Note 10: Contingent Liabilities and Commitments
Repurchase Commitments
Generally, companies in the
RV industry enter into repurchase agreements with lending institutions which
have provided wholesale floorplan financing to dealers. Most dealers’ motor
homes are financed on a “floorplan” basis under which a bank or finance company
lends the dealer all, or substantially all, of the purchase price,
collateralized by a security interest in the motor homes purchased.
Our repurchase agreements provide that, in the event of default by the dealer on the agreement to pay the lending institution, we will repurchase the financed merchandise. The terms of these agreements, which can last up to 18 months, provide that our liability will be the lesser of remaining principal owed by the dealer or dealer invoice less periodic reductions based on the time since the date of the original invoice. Our liability cannot exceed 100 percent of the dealer invoice. Our contingent liability on these repurchase agreements was approximately $90.6 million and $199.7 million at August 29, 2009 and August 30, 2008, respectively.
In certain instances, we also repurchase inventory from our dealers due to state law or regulatory requirements that govern
41
Winnebago Industries, Inc.
Notes to Consolidated Financial Statements
voluntary or involuntary relationship terminations. Although laws vary from state to state, some states have laws in place that require manufacturers of motor vehicles to repurchase current inventory if a dealership exits the business. Incremental repurchase exposure beyond existing repurchase agreements, related to dealer inventory in states that we have had historical experience of repurchasing inventory, totaled $3.1 million at August 29, 2009.
Based on the repurchase exposure as previously described, we established an associated loss reserve. Accrued loss on repurchases were $1.2 million as of August 29, 2009 and $661,000 as of August 30, 2008. A summary of the activity for the fiscal years stated for repurchased units is as follows:
|
|
|
|
|
|
|
|
|
|
|
|
|
|
|
(Dollars in thousands) |
|
Fiscal 2009 |
|
|
Fiscal 2008 |
|
|
Fiscal 2007 |
|
|||
|
Inventory repurchased |
|
|
|
|
|
|
|
|
|
|
|
|
|
Units |
|
|
136 |
|
|
|
36 |
|
|
|
48 |
|
|
Dollars |
|
$ |
12,664 |
|
|
$ |
3,021 |
|
|
$ |
3,735 |
|
|
Inventory resold |
|
|
|
|
|
|
|
|
|
|
|
|
|
Units |
|
|
142 |
|
|
|
29 |
|
|
|
48 |
|
|
Cash collected |
|
$ |
11,283 |
|
|
$ |
2,185 |
|
|
$ |
3,618 |
|
|
Loss recognized |
|
$ |
1,984 |
|
|
$ |
162 |
|
|
$ |
117 |
|
Self-Insured Product Liability
We have an insurance policy covering product liability
claims, however, we self-insure for a portion of product liability claims.
Self-insurance retention liability varies annually based on market conditions
and for at least the last five fiscal years was at $2.5 million per occurrence
and $6.0 million in aggregate per policy year. In the event that the annual
aggregate of the self-insured retention is exhausted by payment of claims and
defense expenses, a deductible of $1.0 million, excluding defense expenses, is
applicable to each claim covered under this policy. Our product liability
accrual is included within accrued self-insurance on our consolidated balance
sheet along with other types of self-insured liabilities, such as workers’
compensation and employee medical claims.
Litigation
We are involved in various legal proceedings which are
ordinary routine litigation incidental to our business, some of which are
covered in whole or in part by insurance. While it is impossible to estimate
with certainty the ultimate legal and financial liability with respect to this
litigation, we believe that while the final resolution of any such litigation
may have an impact on our consolidated results for a particular reporting
period, the ultimate disposition of such litigation will not have any material
adverse effect on our financial position, results of operations or liquidity.
Lease Commitments
We lease certain facilities and equipment under
operating leases. Lease expense was $263,000 for Fiscal 2009, $294,000 for
Fiscal 2008 and $281,000 for Fiscal 2007. Minimum future lease commitments
under noncancelable lease agreements in excess of one year as of August 29,
2009 are as follows:
|
|
|
|
|
|
|
(In thousands) |
|
|
|
|
|
Year Ended |
|
Amount |
|
|
|
2010 |
|
$ |
158 |
|
|
2011 |
|
|
138 |
|
|
2012 |
|
|
31 |
|
|
2013 |
|
|
31 |
|
|
2014 |
|
|
15 |
|
|
Total |
|
$ |
373 |
|
42
Winnebago Industries, Inc.
Notes to Consolidated Financial Statements
Note 11: Income Taxes
The components of the provision (benefit) for income taxes are as follows:
|
|
|
|
|
|
|
|
|
|
|
|
|
|
|
|
|
Year Ended |
|
|||||||||
|
(In thousands) |
|
August 29, 2009 |
|
|
August 30, 2008 |
|
|
August 25, 2007 |
|
|||
|
Current |
|
|
|
|
|
|
|
|
|
|
|
|
|
Federal |
|
$ |
(17,882 |
) |
|
$ |
(2,132 |
) |
|
$ |
21,427 |
|
|
State |
|
|
(1,049 |
) |
|
|
(4,212 |
) |
|
|
1,650 |
|
|
Total current (benefit) provision |
|
|
(18,931 |
) |
|
|
(6,344 |
) |
|
|
23,077 |
|
|
Deferred |
|
|
|
|
|
|
|
|
|
|
|
|
|
Federal |
|
|
34,559 |
|
|
|
(1,630 |
) |
|
|
(2,799 |
) |
|
State |
|
|
5,075 |
|
|
|
(251 |
) |
|
|
(433 |
) |
|
Total deferred provision (benefit) |
|
|
39,634 |
|
|
|
(1,881 |
) |
|
|
(3,232 |
) |
|
Total provision (benefit) |
|
$ |
20,703 |
|
|
$ |
(8,225 |
) |
|
$ |
19,845 |
|
The following is a reconciliation of the U.S. statutory income tax rate to our effective tax rate:
|
|
|
|
|
|
|
|
|
|
|
|
|
|
|
|
|
Year Ended |
|
|||||||||
|
(Stated as a percentage) |
|
August 29, 2009 |
|
|
August 30, 2008 |
|
|
August 25, 2007 |
|
|||
|
U.S. federal statutory rate |
|
|
(35.0 |
)% |
|
|
(35.0 |
)% |
|
|
35.0 |
% |
|
Tax-free and dividend income |
|
|
(2.0 |
) |
|
|
(69.6 |
) |
|
|
(2.9 |
) |
|
Domestic production activities credit |
|
|
- - - |
|
|
|
- - - |
|
|
|
(1.1 |
) |
|
State taxes, net of federal benefit |
|
|
(2.5 |
) |
|
|
1.3 |
|
|
|
1.5 |
|
|
Incentive stock options |
|
|
- - - |
|
|
|
2.1 |
|
|
|
0.3 |
|
|
Provision for uncertain tax positions |
|
|
- - - |
|
|
|
24.1 |
|
|
|
- - - |
|
|
Settlement of uncertain tax positions |
|
|
(0.9 |
) |
|
|
(76.3 |
) |
|
|
- - - |
|
|
Other |
|
|
(1.5 |
) |
|
|
(3.8 |
) |
|
|
(0.5 |
) |
|
Valuation allowance |
|
|
77.5 |
|
|
|
6.0 |
|
|
|
- - - |
|
|
Effective tax provision (benefit) rate |
|
|
35.6 |
% |
|
|
(151.2 |
)% |
|
|
32.3 |
% |
Significant items comprising our net deferred tax assets are as follows:
|
|
|
|
|
|
|
|
|
|
|
|
|
|
|
|
|
|
|
|
|
|
|
|
|
August 29, 2009 |
|
|
August 30, 2008 |
|
||||||||||||||
|
(In thousands) |
|
Assets |
|
Liabilities |
|
Total |
|
|
Assets |
|
Liabilities |
|
Total |
|
||||||
|
Current |
|
|
|
|
|
|
|
|
|
|
|
|
|
|
|
|
|
|
|
|
|
Warranty reserves |
|
$ |
2,393 |
|
$ |
- - - |
|
$ |
2,393 |
|
|
$ |
3,661 |
|
$ |
- - - |
|
$ |
3,661 |
|
|
Self-insurance reserve |
|
|
1,752 |
|
|
- - - |
|
|
1,752 |
|
|
|
2,068 |
|
|
- - - |
|
|
2,068 |
|
|
Accrued vacation |
|
|
1,842 |
|
|
- - - |
|
|
1,842 |
|
|
|
1,817 |
|
|
- - - |
|
|
1,817 |
|
|
Miscellaneous reserves |
|
|
4,087 |
|
|
(1,147 |
) |
|
2,940 |
|
|
|
3,999 |
|
|
(1,039 |
) |
|
2,960 |
|
|
Carry forward tax credits |
|
|
- - - |
|
|
- - - |
|
|
- - - |
|
|
|
1,394 |
|
|
- - - |
|
|
1,394 |
|
|
Total current |
|
|
10,074 |
|
|
(1,147 |
) |
|
8,927 |
|
|
|
12,939 |
|
|
(1,039 |
) |
|
11,900 |
|
|
Noncurrent |
|
|
|
|
|
|
|
|
|
|
|
|
|
|
|
|
|
|
|
|
|
Deferred compensation |
|
|
14,439 |
|
|
- - - |
|
|
14,439 |
|
|
|
15,665 |
|
|
- - - |
|
|
15,665 |
|
|
Postretirement health care |
|
|
12,940 |
|
|
- - - |
|
|
12,940 |
|
|
|
11,560 |
|
|
- - - |
|
|
11,560 |
|
|
Unrecognized tax benefit |
|
|
2,249 |
|
|
- - - |
|
|
2,249 |
|
|
|
2,493 |
|
|
- - - |
|
|
2,493 |
|
|
Tax credits and net |
|
|
8,370 |
|
|
- - - |
|
|
8,370 |
|
|
|
39 |
|
|
- - - |
|
|
39 |
|
|
Depreciation |
|
|
- - - |
|
|
(2,766 |
) |
|
(2,766 |
) |
|
|
- - - |
|
|
(3,631 |
) |
|
(3,631 |
) |
|
Other |
|
|
1,142 |
|
|
- - - |
|
|
1,142 |
|
|
|
736 |
|
|
- - - |
|
|
736 |
|
|
Total noncurrent |
|
|
39,140 |
|
|
(2,766 |
) |
|
36,374 |
|
|
|
30,493 |
|
|
(3,631 |
) |
|
26,862 |
|
|
Total gross deferred tax assets |
|
|
49,214 |
|
|
(3,913 |
) |
|
45,301 |
|
|
|
43,432 |
|
|
(4,670 |
) |
|
38,762 |
|
|
Valuation allowance |
|
|
(49,214 |
) |
|
3,913 |
|
|
(45,301 |
) |
|
|
(325 |
) |
|
- - - |
|
|
(325 |
) |
|
Total deferred tax assets |
|
$ |
- - - |
|
$ |
- - - |
|
$ |
- - - |
|
|
$ |
43,107 |
|
$ |
(4,670 |
) |
$ |
38,437 |
|
43
Winnebago Industries, Inc.
Notes to
Consolidated Financial Statements
Deferred income taxes reflect the net tax effects of temporary differences between the carrying amounts of assets and liabilities for financial reporting purposes and the amounts used for income tax purposes. At August 29, 2009, our deferred tax assets included $3.1 million of unused tax credits, of which $1.2 million can be carried forward indefinitely, $500,000 can be carried forward 20 years and $1.4 million will expire in 2014. In addition, at August 29, 2009, our deferred tax assets also included $5.3 million of NOL carryforwards, $4.0 million of which is Federal NOLs that can be carried forward 20 years, and state NOLs in the amount of $1.3 million that will begin to expire in 2013, if not otherwise used by us. A valuation allowance of $45.3 million has been recognized to offset the related deferred tax assets due to the uncertainty of realizing the deferred tax assets.
On August 26, 2007, we adopted FASB Interpretation No. 48, Accounting for Uncertainty in Income Taxes – An Interpretation of FASB Statement No. 109 (FIN 48). FIN 48 prescribes criteria for the financial statement recognition and measurement of tax positions taken or expected to be taken in a tax return, among other items. In addition, FIN 48 provides guidance on classification of tax liabilities, interest and penalties, accounting interim periods, disclosure and transition with respect to the application of the new accounting standard. As a result of adoption in the first quarter of Fiscal 2008, we recognized a cumulative effect adjustment of $8.5 million as a reduction to the balance of retained earnings, an increase of $7.1 million in deferred tax assets, and an increase of $15.6 million in tax liabilities. The amount of unrecognized tax benefits totaled $21.8 million, of which $8.3 million was accrued for interest and penalties. It is our policy to recognize interest and penalties accrued relative to unrecognized tax benefits into tax expense.
Changes in the unrecognized tax benefits are as follows:
|
|
|
|
|
|
|
|
||
|
(In thousands) |
|
2009 |
|
|
2008 |
|
||
|
Unrecognized tax benefits - opening balance |
|
$ |
(9,469 |
) |
|
$ |
(21,807 |
) |
|
Gross increases - tax positions in a prior period |
|
|
(57 |
) |
|
|
(979 |
) |
|
Gross decreases - tax positions in a prior period |
|
|
677 |
|
|
|
7,218 |
(1) |
|
Gross increases - current period tax positions |
|
|
(163 |
) |
|
|
(1,862 |
) |
|
Settlements |
|
|
- - - |
|
|
|
7,961 |
(1) |
|
Unrecognized tax benefits - ending balance |
|
$ |
(9,012 |
) |
|
$ |
(9,469 |
) |
|
|
|
|
(1) |
During Fiscal 2008, there were favorable settlements of uncertain tax positions with various taxing jurisdictions. The original unrecognized tax benefit associated with these positions was $14.6 million, of which $8.0 million was paid in cash and is included in “Settlements.” The $6.6 million balance of this reserve, inclusive of related deferred taxes, is included in “Gross decreases-tax positions in a prior period.” |
If the remaining uncertain positions are ultimately resolved, approximately $5.5 million could have a positive impact on our effective tax rate. Currently, $2.9 million is accrued for interest and penalties.
We file tax returns in the U.S. federal jurisdiction, as well as various international and state jurisdictions. Our federal income tax returns for Fiscal 2006 through Fiscal 2008 are currently under examination by the IRS. An estimate of the range of possible changes that may result from the examination cannot be made at this time. Although certain years are no longer subject to examinations by the IRS and various state taxing authorities, NOL carryforwards generated in those years may still be adjusted upon examination by the IRS or state taxing authorities if they either have been or will be used in a future period. A number of years may elapse before an uncertain tax position is audited and finally resolved, and it is often very difficult to predict the outcome of such audits. Periodically, various state and local jurisdictions conduct audits, therefore, a variety of other years are subject to state and local jurisdiction review.
We do not believe within the next twelve months there will be a significant change in the total amount of unrecognized tax benefits as of August 29, 2009.
44
Winnebago Industries, Inc.
Notes to Consolidated Financial Statements
Note 12: Financial Income and Expense
The following is a reconciliation of financial income:
|
|
|
|
|
|
|
|
|
|
|
|||
|
|
|
Year Ended (1) |
|
|||||||||
|
(In thousands) |
|
August 29, 2009 |
|
|
August 30, 2008 |
|
|
August 25, 2007 |
|
|||
|
Interest income from investments and receivables |
|
$ |
1,440 |
|
|
$ |
4,091 |
|
|
$ |
2,895 |
|
|
Dividend income |
|
|
- - - |
|
|
|
231 |
|
|
|
3,634 |
|
|
Gain (loss) on foreign currency transactions |
|
|
12 |
|
|
|
(8 |
) |
|
|
(6 |
) |
|
Total financial income |
|
$ |
1,452 |
|
|
$ |
4,314 |
|
|
$ |
6,523 |
|
|
|
|
|
(1) |
Fiscal year ended August 30, 2008 contained 53 weeks; all other fiscal years contained 52 weeks. |
Note 13: Stock-Based Compensation Plans
We have a 2004 Incentive Compensation Plan, as amended (the “Plan”), in place which allows us to grant stock options and other equity compensation to key employees and to non-employee directors. Prior to Fiscal 2007, stock-based compensation generally consisted only of stock options. In Fiscal 2007 and Fiscal 2008, we granted restricted stock awards to key employees and directors instead of stock options. No stock options or restricted stock awards were granted in Fiscal 2009. The value of the restricted stock awards is based on the number of shares granted and the closing price of our common stock on the date of grant. The grant price of an option under the Plan was determined by the mean of the high and low prices of our common stock on the date of grant. Stock options are granted at the closing market price on the date of grant. The term of any options granted under the Plan may not exceed ten years from the date of the grant. Options and awards issued to key employees generally vest over a three-year period in equal annual installment, beginning one year after the date of grant, with immediate vesting upon retirement or upon a change of control (as defined in the Plan), if earlier. Historically, options issued to directors vested six months after grant. No more than 4,000,000 shares of common stock may be issued under the Plan and no more than 2,000,000 of those shares may be used for awards other than stock options or stock appreciation rights. Shares subject to awards that are forfeited, terminated, expire unexercised, settled in cash, exchanged for other awards, tendered to satisfy the purchase price of an award, withheld to satisfy tax obligations or otherwise lapse again become available for awards.
The Plan replaced the 1997 Stock Option Plan. Any stock options previously granted under the 1997 Stock Option Plan shall continue to be exercisable in accordance with their original terms and conditions.
Stock Options
Total stock option expense included in our
statements of income for the fiscal years ended August 29, 2009, August 30,
2008 and August 25, 2007, was $33,000, $401,000 and $1.7 million, respectively.
A summary of stock option activity for Fiscal 2009, 2008 and 2007 is as follows:
|
|
|
|
|
|
|
|
|
|
|
|
|
|
|
|
|
|
|
|
|
|
|
|
|
|
|
|
|
|
|
|
|
|
2009 |
|
|
2008 |
|
2007 |
|
|||||||||||||||||||||
|
|
|
Shares |
|
Price
per |
|
Wtd.
Avg. |
|
|
Shares |
|
Price
per |
|
Wtd.
Avg. |
|
Shares |
|
Price |
|
Wtd.
Avg. |
|
|||||||||
|
Outstanding at beginning of year |
|
|
1,044,899 |
|
$ |
7 - $36 |
|
$ |
27.10 |
|
|
|
1,137,975 |
|
$ |
5 - $36 |
|
$ |
26.32 |
|
|
1,591,676 |
|
$ |
4 - $36 |
|
$ |
23.93 |
|
|
Options granted |
|
|
- - - |
|
|
- - - |
|
|
- - - |
|
|
|
- - - |
|
|
- - - |
|
|
- - - |
|
|
- - - |
|
|
- - - |
|
|
- - - |
|
|
Options exercised |
|
|
(1,000 |
) |
|
9 |
|
|
9.25 |
|
|
|
(59,201 |
) |
|
5 - 27 |
|
|
10.86 |
|
|
(449,690 |
) |
|
4 - 32 |
|
|
17.82 |
|
|
Options canceled |
|
|
(33,675 |
) |
|
7 - 32 |
|
|
21.29 |
|
|
|
(33,875 |
) |
|
26 - 32 |
|
|
29.25 |
|
|
(4,011 |
) |
|
31 |
|
|
31.48 |
|
|
Outstanding at end of year |
|
|
1,010,224 |
|
$ |
9 - $36 |
|
$ |
27.31 |
|
|
|
1,044,899 |
|
$ |
7 - $36 |
|
$ |
27.10 |
|
|
1,137,975 |
|
$ |
5 - $36 |
|
$ |
26.32 |
|
|
Exercisable at end of year |
|
|
1,010,224 |
|
$ |
9 - $36 |
|
$ |
27.31 |
|
|
|
971,540 |
|
$ |
7 - $36 |
|
$ |
27.09 |
|
|
859,242 |
|
$ |
5 - $36 |
|
$ |
25.57 |
|
45
Winnebago Industries, Inc.
Notes to Consolidated Financial Statements
The weighted average remaining contractual life for options outstanding and exercisable at August 29, 2009 was 4.51 years. The aggregate intrinsic value of options outstanding and exercisable at August 29, 2009 was $109,000. Other values related to options are as follows:
|
|
|
|
|
|
|
|
|
|
|
|
|
|
|
(In thousands) |
|
2009 |
|
|
2008 |
|
|
2007 |
|
|||
|
Aggregate intrinsic value of options exercised (1) |
|
$ |
2 |
|
|
$ |
497 |
|
|
$ |
6,934 |
|
|
Net cash proceeds from the exercise of stock options |
|
|
9 |
|
|
|
643 |
|
|
|
8,014 |
|
|
Actual income tax benefit realized from stock option exercises |
|
|
1 |
|
|
|
190 |
|
|
|
2,396 |
|
|
|
|
|
|
(1) |
The amount by which the closing price of our stock on the date of exercise exceeded the exercise price. |
|
|
|
|
Stock Awards |
|
Total restricted stock award expense included in our statements of income for the fiscal years ended August 29, 2009 and August 30, 2008 was $978,000 and $3.5 million, respectively. |
|
|
|
Employee Stock Awards |
|
A summary of employee stock award activity for Fiscal 2009 and 2008 is as follows: |
|
|
|
|
|
|
|
|
|
|
|
|
|
|
|
|
|
|
|
|
2009 |
|
|
2008 |
|
|||||||||
|
|
|
|
Shares |
|
|
|
Weighted Average |
|
|
Shares |
|
|
|
Weighted Average |
|
|
Beginning of year |
|
|
138,112 |
|
|
$ |
30.36 |
|
|
89,850 |
|
|
$ |
34.36 |
|
|
Granted |
|
|
- - - |
|
|
|
- - - |
|
|
129,200 |
|
|
|
26.61 |
|
|
Vested |
|
|
(54,672 |
) |
|
|
30.95 |
|
|
(79,938 |
) |
|
|
28.79 |
|
|
Cancelled |
|
|
(1,200 |
) |
|
|
30.26 |
|
|
(1,000 |
) |
|
|
30.67 |
|
|
End of year |
|
|
82,240 |
|
|
$ |
29.97 |
|
|
138,112 |
|
|
$ |
30.36 |
|
The aggregate intrinsic value of employee awards outstanding at August 29, 2009 was $956,000.
As of August 29, 2009, there was $413,000 of unrecognized compensation expense related to restricted stock awards that is expected to be recognized over a weighted average period of ten months. The aggregate intrinsic value and total fair value of awards vested during Fiscal 2009 was $595,000 and $1.7 million, respectively.
|
|
|
Director’s Awards |
|
As of August 29, 2009, there were 15,000 shares of restricted stock that had been awarded to our non-employee directors, which had an aggregate intrinsic value of $174,000. There were no restricted stock awards granted during Fiscal 2009. These awards vest immediately, but the directors are restricted from selling this stock until their retirement from the Board of Directors. |
Non-employee directors may elect to receive all or part of their annual retainer and board fees in the form of Winnebago Industries stock units credited in the form of shares of our common stock instead of cash. These shares are also restricted from being sold until the individual retires from the Board. The aggregate intrinsic value of these awards as of August 29, 2009 was $1.0 million with 87,881 shares outstanding.
A summary of the stock units activity under the exchange arrangement for the past three fiscal years is as follows:
|
|
|
|
|
|
|
|
|
|
|
|
|
|
|
|
|
|
|
2009 |
|
|
2008 |
|
|
2007 |
|
|||
|
Shares issued to trust |
|
|
|
30,927 |
|
|
|
12,527 |
|
|
|
7,524 |
|
|
Related expense |
|
|
$ |
206,000 |
|
|
$ |
211,000 |
|
|
$ |
239,000 |
|
46
Winnebago Industries, Inc.
Notes to Consolidated Financial Statements
Note 14: Net Revenues Classifications
Net revenue by product class:
|
|
|
|
|
|
|
|
|
|
|
|
|
|
|
|
|
|
|
|
|
|
|
|
|
|
|
|
Year Ended (1) |
|
||||||||||||||||||||
|
(In thousands) |
|
|
August 29, 2009 |
|
|
% |
|
|
August 30, 2008 |
|
|
% |
|
|
August 25, 2007 |
|
|
|
% |
|
|||
|
Motor homes |
|
|
$ |
178,619 |
|
|
84.5 |
|
|
$ |
555,671 |
|
|
91.9 |
|
|
$ |
815,895 |
|
|
|
93.8 |
|
|
Motor home parts and services |
|
|
|
12,559 |
|
|
5.9 |
|
|
|
16,923 |
|
|
2.8 |
|
|
|
16,413 |
|
|
|
1.9 |
|
|
Other manufactured products |
|
|
|
20,341 |
|
|
9.6 |
|
|
|
31,758 |
|
|
5.3 |
|
|
|
37,844 |
|
|
|
4.3 |
|
|
Total net revenues |
|
|
$ |
211,519 |
|
|
100.0 |
|
|
$ |
604,352 |
|
|
100.0 |
|
|
$ |
870,152 |
|
|
|
100.0 |
|
|
|
|
|
(1) |
Fiscal year ended August 30, 2008 contained 53 weeks; all other fiscal years contained 52 weeks. |
Net revenue by geographic area:
|
|
|
|
|
|
|
|
|
|
|
|
|
|
|
|
|
|
|
|
|
|
|
|
|
|
|
|
|
Year Ended (1) |
|
|||||||||||||||||||
|
(In thousands) |
|
|
August 29, 2009 |
|
|
% |
|
|
August 30, 2008 |
|
|
% |
|
|
August 25, 2007 |
|
|
|
% |
|
|||
|
United States |
|
|
$ |
199,579 |
|
|
94.4 |
|
|
$ |
560,602 |
|
|
92.8 |
|
|
$ |
823,287 |
|
|
|
94.6 |
|
|
International |
|
|
|
11,940 |
|
|
5.6 |
|
|
|
43,750 |
|
|
7.2 |
|
|
|
46,865 |
|
|
|
5.4 |
|
|
Total net revenues |
|
|
$ |
211,519 |
|
|
100.0 |
|
|
$ |
604,352 |
|
|
100.0 |
|
|
$ |
870,152 |
|
|
|
100.0 |
|
|
|
|
|
(1) |
Fiscal year ended August 30, 2008 contained 53 weeks; all other fiscal years contained 52 weeks. |
Note 15: Income Per Share
The following table reflects the calculation of basic and diluted income per share for the past three fiscal years:
|
|
|
|
|
|
|
|
|
|
|
|
|
|
|
|
|
|
|
Year Ended (1) |
|
|||||||||
|
(In thousands, except per share data) |
|
|
August 29, 2009 |
|
|
August 30, 2008 |
|
|
August 25, 2007 |
|
|||
|
Income per share - basic |
|
|
|
|
|
|
|
|
|
|
|
|
|
|
Net (loss) income |
|
|
$ |
(78,766 |
) |
|
$ |
2,784 |
|
|
$ |
41,564 |
|
|
Weighted average shares outstanding |
|
|
|
29,040 |
|
|
|
29,093 |
|
|
|
31,162 |
|
|
Net (loss) income per share - basic |
|
|
$ |
(2.71 |
) |
|
$ |
0.10 |
|
|
$ |
1.33 |
|
|
|
|
|
|
|
|
|
|
|
|
|
|
|
|
|
Income per share - assuming dilution |
|
|
|
|
|
|
|
|
|
|
|
|
|
|
Net (loss) income |
|
|
$ |
(78,766 |
) |
|
$ |
2,784 |
|
|
$ |
41,564 |
|
|
Weighted average shares outstanding |
|
|
|
29,040 |
|
|
|
29,093 |
|
|
|
31,162 |
|
|
Dilutive impact of awards and options outstanding |
|
|
|
11 |
|
|
|
51 |
|
|
|
253 |
|
|
Weighted average shares and potential dilutive shares outstanding |
|
|
|
29,051 |
|
|
|
29,144 |
|
|
|
31,415 |
|
|
Net (loss) income per share - assuming dilution |
|
|
$ |
(2.71 |
) |
|
$ |
0.10 |
|
|
$ |
1.32 |
|
|
|
|
|
(1) |
Fiscal year ended August 30, 2008 contained 53 weeks; all other fiscal years contained 52 weeks. |
For the fiscal years ended August 29, 2009, August 30, 2008 and August 25, 2007, there were options outstanding to purchase 1,010,224 shares, 881,591 shares and 273,555 shares, respectively, of common stock at an average price of $27.31, $29.36 and $32.82, respectively, which were not included in the computation of diluted income per share because they are considered anti-dilutive under the treasury stock method per SFAS No. 128, Earnings Per Share (as amended).
Note 16: Preferred Stock and Shareholders Rights Plan
The Board of Directors may authorize the issuance from time to time of preferred stock in one or more series with such designations, preferences, qualifications, limitations, restrictions, and optional or other special rights as the Board may fix by resolution. In connection with the Shareholders Rights Plan (the “Rights Plan”) discussed below, the Board of Directors has reserved, but not issued, 300,000 shares of preferred stock.
In May 2000, we adopted a Rights Plan providing for a dividend distribution of one preferred share purchase right for each share of common stock outstanding on and after May 26, 2000. The rights can be exercised only if an individual or group
47
Winnebago Industries, Inc.
Notes to Consolidated Financial Statements
acquires or announces a tender offer for 15 percent or more of our common stock, except as described below. Certain members of the Hanson family (including trusts and estates established by such Hanson family members and the John K. and Luise V. Hanson Foundation) are exempt from the applicability of the Rights Plan as it relates to the acquisition of 15 percent or more of our outstanding common stock. If the rights first become exercisable as a result of an announced tender offer, each right would entitle the holder (other than the individual or group acquiring or announcing a tender offer for 15 percent or more of our common stock), except as described below, to buy 1/200 of a share of a new series of preferred stock at an exercise price of $33.625. The preferred shares will be entitled to 100 times the per share dividend payable on our common stock and to 100 votes on all matters submitted to a vote of the shareowners. Once an individual or group acquires 15 percent or more of our common stock, each right held by such individual or group becomes void and the remaining rights will then entitle the holder to purchase the number of common shares having a market value of twice the exercise price of the right. In the event that we are acquired in a merger or 50 percent or more of our consolidated assets or earnings power are sold, each right will then entitle the holder to purchase a number of the acquiring company’s common shares having a market value of twice the exercise price of the right. After an individual or group acquires 15 percent, except as described below, of our common stock and before they acquire 50 percent, our Board of Directors may exchange the rights in whole or in part, at an exchange ratio of one share of common stock per right. Before an individual or group acquires 15 percent of our common stock, the rights are redeemable for $0.01 per right at the option of our Board of Directors. Our Board of Directors is authorized to reduce the 15 percent threshold to no less than 10 percent. Each right will expire on May 3, 2010, unless earlier redeemed by us. An Amendment, dated January 13, 2003, was made to the Rights Plan to permit FMR Corp., its affiliates and associates (collectively, “FMR”) and an amendment dated May 17, 2006, was made to the Rights Plan to permit Royce & Associates, LLC, its affiliates and associates (“Royce”), to be the beneficial owner of up to 20 percent of our outstanding stock provided that FMR or Royce, in its filings under the Securities Exchange Act of 1934, as amended, does not state any present intention to hold shares of our common stock with the purpose or effect of changing or influencing control of us. An individual or group that becomes the beneficial owner of 15 percent or more (20 percent in the case of FMR or Royce) of our common stock as a result of an acquisition of the common stock by us or the acquisition by such individual or group of new-issued shares directly from us, such individual’s or group’s ownership shall not trigger the issuance of rights under the Rights Plan unless such individual or group after such share repurchase or direct issuance by us, becomes the beneficial owner of any additional shares of our common stock.
Note 17: Interim Financial Information (Unaudited)
|
|
|
|
|
|
|
|
|
|
|
|
|
|
|
|
|
Fiscal 2009 |
|
|
Quarter Ended |
|
||||||||||
|
(In thousands, except per share data) |
|
|
November 29, |
|
February 28, |
|
May 30, |
|
August 29, |
|
||||
|
Net revenues |
|
|
$ |
69,398 |
|
$ |
31,808 |
|
$ |
50,848 |
|
$ |
59,465 |
|
|
Gross deficit |
|
|
|
(8,894 |
) |
|
(11,792 |
) |
|
(8,285 |
) |
|
(1,775 |
) |
|
Operating loss |
|
|
|
(16,890 |
) |
|
(18,611 |
) |
|
(14,782 |
) |
|
(9,232 |
) |
|
Net loss |
|
|
$ |
(9,596 |
) |
$ |
(10,381 |
) |
$ |
(8,553 |
) |
$ |
(50,236 |
) |
|
Net loss per share (basic) |
|
|
$ |
(0.33 |
) |
$ |
(0.36 |
) |
$ |
(0.29 |
) |
$ |
(1.73 |
) |
|
Net loss per share (diluted) |
|
|
$ |
(0.33 |
) |
$ |
(0.36 |
) |
$ |
(0.29 |
) |
$ |
(1.73 |
) |
|
|
|
|
|
|
|
|
|
|
|
|
|
|
|
|
|
Fiscal 2008 |
|
|
Quarter Ended |
|
||||||||||
|
(In thousands, except per share data) |
|
|
December 1, |
|
March 1, |
|
May 31, |
|
August 30, |
|
||||
|
Net revenues |
|
|
$ |
215,142 |
|
$ |
164,203 |
|
$ |
139,736 |
|
$ |
85,271 |
|
|
Gross profit (deficit) |
|
|
|
25,640 |
|
|
12,169 |
|
|
2,624 |
|
|
(5,661 |
) |
|
Operating income (loss) |
|
|
|
13,584 |
|
|
2,454 |
|
|
(6,903 |
) |
|
(18,890 |
) |
|
Net income (loss) |
|
|
$ |
9,962 |
|
$ |
2,517 |
|
$ |
3,000 |
|
$ |
(12,695 |
) |
|
Net income (loss) per share (basic) |
|
|
$ |
0.34 |
|
$ |
0.09 |
|
$ |
0.10 |
|
$ |
(0.44 |
) |
|
Net income (loss) per share (diluted) |
|
|
$ |
0.34 |
|
$ |
0.09 |
|
$ |
0.10 |
|
$ |
(0.44 |
) |
|
|
|
|
(1) |
Quarter ended December 1, 2007 contained 14 weeks. |
48
Winnebago Industries, Inc.
Notes to Consolidated Financial Statements
Note 18: Comprehensive Income
Comprehensive income, net of tax, consists of:
|
|
|
|
|
|
|
|
|
|
|
|
|
|
|
|
|
|
|
|
Year Ended (1) |
|
||||||||||
|
(In thousands) |
|
|
August 29, |
|
|
August 30, |
|
|
August 25, |
|
||||
|
Net (loss) income |
|
|
$ |
(78,766 |
) |
|
$ |
2,784 |
|
|
$ |
41,564 |
|
|
|
Temporary impairment of investments |
|
|
|
970 |
|
|
|
(1,224 |
) |
|
|
- - - |
|
|
|
Amortization of actuarial (loss) gain |
|
|
|
(1,550 |
) |
|
|
2,858 |
|
|
|
- - - |
|
|
|
Amortization of prior service credit |
|
|
|
(2,693 |
) |
|
|
(2,911 |
) |
|
|
- - - |
|
|
|
Comprehensive (loss) income |
|
|
$ |
(82,039 |
) |
|
$ |
1,507 |
|
|
$ |
41,564 |
|
|
|
|
|
|
(1) |
Year ended August 30, 2008 contained 53 weeks; all other fiscal years contained 52 weeks. |
Components of accumulated other comprehensive income, net of tax, were:
|
|
|
|
|
|
|
|
|
|
|
|
|
|
|
As Of |
|
|||||
|
(In thousands) |
|
|
August 29, |
|
|
August 30, |
|
||
|
Impairment of investments |
|
|
$ |
(254 |
) |
|
$ |
(1,224 |
) |
|
Actuarial loss |
|
|
|
(9,479 |
) |
|
|
(7,929 |
) |
|
Prior service benefit |
|
|
|
16,273 |
|
|
|
18,966 |
|
|
Total |
|
|
$ |
6,540 |
|
|
$ |
9,813 |
|
49
ITEM 9. Changes in and Disagreements with Accountants on Accounting and Financial Disclosure
None
ITEM 9A. Controls and Procedures
Evaluation of Disclosure Controls and Procedures
We maintain “disclosure controls and procedures,” as such term is defined under Securities Exchange Act of 1934, as amended (“Exchange Act”) Rule 13a-15(e), that are designed to ensure that information required to be disclosed in our reports filed or submitted under the Exchange Act is recorded, processed, summarized and reported within the time periods specified in the Securities and Exchange Commission’s rules and forms, and that such information is accumulated and communicated to our management, including our Chief Executive Officer and Chief Financial Officer, as appropriate, to allow timely decisions regarding required disclosures. Management necessarily applied its judgment in assessing the costs and benefits of such controls and procedures, which, by their nature, can provide only reasonable assurance regarding management’s disclosure control objectives.
We have carried out an evaluation, under the supervision and with the participation of our management, including our Chief Executive Officer and Chief Financial Officer, of the effectiveness of the design and operation of our disclosure controls and procedures, required by Exchange Act Rule 13a-15(b), as of the end of the period covered by this Annual Report (the “Evaluation Date”). Based on this evaluation, the Chief Executive Officer and Chief Financial Officer have concluded that our disclosure controls and procedures were effective as of the Evaluation Date.
Evaluation of Internal Control Over Financial Reporting
Management’s report on internal control over financial reporting as of August 29, 2009 is included within Item 8 of this Annual Report on Form 10-K and is incorporated herein by reference. The report of Deloitte & Touche LLP on the effectiveness of internal control over financial reporting is included within Item 8 of this Annual Report on Form 10-K and is incorporated herein by reference.
Changes in Internal Control Over Financial Reporting
There were no changes in our internal control over financial reporting (as defined in Exchange Act Rule 13a-15(f)) that occurred during our last fiscal quarter that have materially affected, or are reasonably likely to materially affect, our internal control over financial reporting.
None
ITEM 10. Directors, Executive Officers and Corporate Governance
Reference is made to the table entitled “Executive Officers of the Registrant” in Part I of this report and to the information included under the captions “Election of Directors” and “Board of Directors, Committees of the Board and Corporate Governance” in our Proxy Statement for the Annual Meeting of Shareholders scheduled to be held December 15, 2009, which information is incorporated by reference herein.
Section 16(a) of the Exchange Act requires our officers, directors and persons who beneficially own more than 10 percent of our common stock (collectively “Reporting Persons”) to file reports of ownership and changes in ownership with the Securities and Exchange Commission (SEC) and the New York Stock Exchange. Reporting Persons are required by the SEC regulations to furnish us with copies of all Section 16(a) forms they file. Based solely on its review of the copies of such forms received or written representations from certain Reporting Persons that no Forms 5 were required for those persons, the Company believes that, during Fiscal 2009, all Reporting Persons complied with all applicable filing requirements, except that due to administrative oversight, delinquent Form 4 filings for Ms. Nielsen and Messrs. Gossett, Martin, Olson and Potts were made on November 14, 2008 regarding the exercise of an option to have a portion of restricted stock vesting on October 13, 2008 withheld by the Company to cover a tax obligation relating thereto for the stated executive officers.
50
We have adopted a written code of ethics, the “Code of Ethics for CEO and Senior Financial Officers” (the “Code”) which is applicable to our Chief Executive Officer, Chief Financial Officer, Controller and Treasurer (collectively, the “Senior Officers”). In accordance with the rules and regulations of the SEC, a copy of the Code has been filed as an exhibit to this Form 10-K and is posted on our Web Site.
We intend to disclose any changes in or waivers from the Code applicable to any Senior Officer on our Web Site at http://www.winnebagoind.com or by filing a Form 8-K.
ITEM 11. Executive Compensation
Reference is made to the information included under the captions “Director Compensation” and “Executive Compensation” in our Proxy Statement for the Annual Meeting of Shareholders scheduled to be held December 15, 2009, which information is incorporated by reference herein.
ITEM 12. Security Ownership of Certain Beneficial Owners and Management and Related Stockholder Matters
Reference is made to the table entitled “Equity Compensation Plan Information” in Part II of this report and to the share ownership information included under the caption “Voting Securities and Principal Holders Thereof” in our Proxy Statement for the Annual Meeting of Shareholders scheduled to be held December 15, 2009, which information is incorporated by reference herein.
ITEM 13. Certain Relationships and Related Transactions and Director Independence
Reference is made to the information included under the caption “Board of Directors, Committees of the Board and Corporate Governance” in our Proxy Statement for the Annual Meeting of Shareholders scheduled to be held December 15, 2009, which information is incorporated by reference herein.
ITEM 14. Principal Accounting Fees and Services
Reference is made to the information included under the caption “Independent Registered Public Accountants Fees and Services” in our Proxy Statement for the Annual Meeting of Shareholders scheduled to be held December 15, 2009, which information is incorporated by reference herein.
ITEM 15. Exhibits, Financial Statement Schedules
|
|
|
|
|
(a) |
1. |
Our consolidated financial statements are included in Item 8 and an index to financial statements appears on page 25 of this report. |
|
|
|
|
|
|
2. |
Consolidated Financial Statement Schedules |
|
|
|
Winnebago Industries, Inc. and Subsidiaries |
|
|
|
|
|
|
|
All schedules are omitted because of the absence of the conditions under which they are required or because the information required is shown in the consolidated financial statements or the notes thereto. |
|
|
|
|
|
|
3. |
Exhibits |
|
|
|
|
|
|
|
See Exhibit Index on page 54. |
UNDERTAKING
For the purposes of complying with the amendments to the rules governing Form S-8 (effective July 13, 1990) under the Securities Act of 1933, the undersigned registrant hereby undertakes as follows, which undertaking shall be incorporated by reference into registrant’s Registration Statements on Form S-8 Nos. 333-31595 (which became effective on or about July 18, 1997), 333-47123 (which became effective on or about February 27, 1998) and 333-113246 (which became effective on or about March 3, 2004).
Insofar as indemnification for liabilities arising under the Securities Act of 1933, as amended (the “Act”) may be permitted to directors, officers and controlling persons of the registrant pursuant to the foregoing provisions, or otherwise, the registrant has been advised that in the opinion of the Securities and Exchange Commission such indemnification is against public policy as expressed in the Act and is, therefore, unenforceable. In the event that a claim for indemnification against such liabilities (other than the payment by the registrant of expenses incurred or paid by a director, officer or controlling person of the
51
registrant in the successful defense of any action, suit or proceeding) is asserted by such director, officer or controlling person in connection with the securities being registered, the registrant will, unless in the opinion of its counsel the matter has been settled by controlling precedent, submit to a court of appropriate jurisdiction the question whether such indemnification by it is against public policy as expressed in the Act and will be governed by the final adjudication of such issue.
52
SIGNATURES
Pursuant to the requirements of Section 13 or 15(d) of the Securities Exchange Act of 1934, the Registrant has duly caused this report to be signed on its behalf by the undersigned, thereunto duly authorized.
|
|
|
|
|
|
|
WINNEBAGO INDUSTRIES, INC. |
||
|
|
|
|
|
|
|
By |
/s/ Robert J. Olson |
|
|
|
|
Robert J. Olson |
|
|
|
|
|
|
|
|
|
Chairman of the Board, Chief Executive |
|
|
|
|
Officer, President and Director |
|
|
|
|
(Principal Executive Officer) |
|
Date: October 27, 2009
Pursuant to the requirements of the Securities Exchange Act of 1934, this report has been signed below on, October 27, 2009, by the following persons on behalf of the Registrant and in the capacities indicated.
|
|
|
|
|
|
|
Signature |
|
Capacity |
||
|
|
|
|
|
|
|
/s/ Robert J. Olson |
|
|
|
|
|
Robert J. Olson |
|
Chairman of the Board, Chief Executive |
||
|
|
|
|
Officer, President and Director |
|
|
|
|
|
(Principal Executive Officer) |
|
|
/s/ Sarah N. Nielsen |
|
|
|
|
|
Sarah N. Nielsen |
|
Vice President, Chief Financial Officer |
||
|
|
|
|
(Principal Financial Officer) |
|
|
|
|
|
|
|
|
/s/ Brian J. Hrubes |
|
|
|
|
|
Brian J. Hrubes |
|
Controller |
||
|
|
|
|
(Principal Accounting Officer) |
|
|
|
|
|
|
|
|
/s/ Irvin E. Aal |
|
|
|
|
|
Irvin E. Aal |
|
Director |
||
|
|
|
|
|
|
|
/s/ Robert M. Chiusano |
|
|
|
|
|
Robert M. Chiusano |
|
Director |
||
|
|
|
|
|
|
|
/s/ Jerry N. Currie |
|
|
|
|
|
Jerry N. Currie |
|
Director |
||
|
|
|
|
|
|
|
/s/ Joseph W. England |
|
|
|
|
|
Joseph W. England |
|
Director |
||
|
|
|
|
|
|
|
/s/ Lawrence A. Erickson |
|
|
||
|
Lawrence A. Erickson |
|
Director |
||
|
|
|
|
|
|
|
/s/ John V. Hanson |
|
|
|
|
|
John V. Hanson |
|
Director |
||
|
|
|
|
|
|
|
/s/ Gerald C. Kitch |
|
|
|
|
|
Gerald C. Kitch |
|
Director |
||
53
Exhibit Index
|
|
|
|
3a. |
Articles of Incorporation previously filed with the Registrant’s Quarterly Report on Form 10-Q for the quarter ended May 27, 2000 (Commission File Number 001-06403) and incorporated by reference herein. |
|
|
|
|
3b. |
Amended By-Laws of the Registrant previously filed with the Registrant’s Annual Report on Form 10-K for the fiscal year ended August 28, 2004 (Commission File Number 001-06403) and incorporated by reference herein. |
|
|
|
|
4a. |
Credit and Security Agreement between Wells Fargo Bank, National Association and Winnebago Industries, Inc. dated September 17, 2008 previously filed with the Registrant’s Annual Report on Form 10-K for the fiscal year ended August 30, 2008 (Commission File Number 001-06403) and incorporated by reference herein. |
|
|
|
|
4b. |
Loan and Security Agreement between Burdale Capital Finance, Inc. and Winnebago Industries, Inc. dated October 13, 2009. |
|
|
|
|
10a. |
Winnebago Industries, Inc. Deferred Compensation Plan previously filed with the Registrant’s Quarterly Report on Form 10-Q for the quarter ended March 2, 1991 (Commission File Number 001-06403), and incorporated by reference herein and the Amendment dated June 29, 1995 previously filed with the Registrant’s Annual Report on Form 10-K for the fiscal year ended August 26, 1995 (Commission File Number 001-06403) and incorporated by reference herein.* |
|
|
|
|
10b. |
Winnebago Industries, Inc. Profit Sharing and Deferred Savings Investment Plan previously filed with the Registrant’s Annual Report on Form 10-K for the fiscal year ended August 31, 1985 (Commission File Number 001-06403), and incorporated by reference herein and the Amendment dated July 1, 1995 previously filed with the Registrant’s Annual Report on Form 10-K for the fiscal year ended August 26, 1995 (Commission File Number 001-06403) and incorporated by reference herein and the Amendment dated March 21, 2007 (Commission File Number 001-06403) and incorporated by reference herein.* |
|
|
|
|
10c. |
Winnebago Industries, Inc. 2004 Incentive Compensation Plan previously filed as Appendix B with the Registrant’s Proxy Statement for the Annual Meeting of Shareholders held on January 13, 2004 (Commission File Number 001-06403) and incorporated by reference herein and the Amendment dated October 11, 2006 previously filed with the Registrant’s Quarterly Report on Form 10-Q for the quarter ended November 25, 2006 (Commission File Number 001-06403) and incorporated by reference herein.* |
|
|
|
|
10d. |
Winnebago Industries, Inc. Directors’ Deferred Compensation Plan previously filed with the Registrant’s Annual Report on Form 10-K for the fiscal year ended August 30, 1997 (Commission File Number 001-06403), and incorporated by reference herein and the Amendment dated October 15, 2003 previously filed with the Registrant’s Quarterly Report on Form 10-Q for the quarter ended November 29, 2003 (Commission File Number 001-06403) and incorporated by reference herein and the Amendment dated October 11, 2006 previously filed with the Registrant’s Quarterly Report on Form 10-Q for the quarter ended November 25, 2006 (Commission File Number 001-06403) and incorporated by reference herein.* |
|
|
|
|
10e. |
Winnebago Industries, Inc. 1997 Stock Option Plan previously filed with the Registrant’s Annual Report on Form 10-K for the fiscal year ended August 30, 1997 (Commission File Number 001-06403) and incorporated by reference herein.* |
|
|
|
|
10f. |
Winnebago Industries, Inc. Executive Share Option Plan previously filed with the Registrant’s Annual Report on Form 10-K for the fiscal year ended August 29, 1998 (Commission File Number 001-06403) and incorporated by reference herein, and the Amendment dated July 1, 1999 previously filed with the Registrant’s Quarterly Report on Form 10-Q for the quarter ended May 29, 1999 (Commission File Number 001-06403) and incorporated by reference herein and the Amendment dated January 1, 2001 previously filed with the Registrant’s Quarterly Report on Form 10-Q for the quarter ended February 24, 2001 (Commission File Number 001-06403) and incorporated by reference herein.* |
|
|
|
|
10g. |
Winnebago Industries, Inc. Rights Plan Agreement previously filed with the Registrant’s Current Report on Form 8-K dated May 3, 2000 (Commission File Number 001-06403) and incorporated by reference herein, the Amendment dated January 13, 2003 previously filed with the Registrant’s Quarterly Report on Form 10-Q for the quarter ended March 1, 2003 (Commission File Number 001-06403) and incorporated by reference herein and the Amendment dated May 17, 2006 previously filed with the Registrant’s Current Report on Form 8-K dated May 23, 2006 (Commission File Number 001-06403) and incorporated by reference herein. |
54
Exhibit Index
Page Two
|
|
|
|
10h. |
Amended and Restated Executive Change of Control Agreement dated December 17, 2008 between Winnebago Industries, Inc. and Raymond M. Beebe.* |
|
|
|
|
10i. |
Amended and Restated Executive Change of Control Agreement dated December 17, 2008 between Winnebago Industries, Inc. and Robert L. Gossett.* |
|
|
|
|
10j. |
Amended and Restated Executive Change of Control Agreement dated December 17, 2008 between Winnebago Industries, Inc. and Robert J. Olson.* |
|
|
|
|
10k. |
Amended and Restated Executive Change of Control Agreement dated December 17, 2008 between Winnebago Industries, Inc. and William J. O’Leary.* |
|
|
|
|
10l. |
Amended and Restated Executive Change of Control Agreement dated December 17, 2008 between Winnebago Industries, Inc. and Sarah N. Nielsen.* |
|
|
|
|
10m. |
Amended and Restated Executive Change of Control Agreement dated December 17, 2008 between Winnebago Industries, Inc. and Roger W. Martin.* |
|
|
|
|
10n. |
Form of Winnebago Industries, Inc. Incentive Stock Option Agreement for grants of Incentive Stock Options under the 2004 Incentive Compensation Plan previously filed with the Registrant’s Current Report on Form 8-K dated October 13, 2004 (Commission File Number 001-06403) and incorporated by reference herein.* |
|
|
|
|
10o. |
Form of Winnebago Industries, Inc. Non-Qualified Stock Option Agreement for grants of Non-Qualified Stock Options under the 2004 Incentive Compensation Plan previously filed with the Registrant’s Report on Form 8-K dated October 13, 2004 (Commission File Number 001-06403) and incorporated by reference herein.* |
|
|
|
|
10p. |
Winnebago Industries, Inc. Officers’ Long-Term Incentive Plan, fiscal three-year period 2010, 2011 and 2012 previously filed with the Registrant’s Current Report on Form 8-K dated June 24, 2009 (Commission File Number 001-06403) and incorporated by reference herein.* |
|
|
|
|
10q. |
Winnebago Industries, Inc. Officers’ Long-Term Incentive Plan, fiscal three-year period 2008, 2009 and 2010 previously filed with the Registrant’s Current Report on Form 8-K dated June 26, 2007 (Commission File Number 001-06403) and incorporated by reference herein.* |
|
|
|
|
10r. |
Winnebago Industries, Inc. Executive Deferred Compensation Plan previously filed with the Registrant’s Quarterly Report on Form 10-Q for the quarter ended November 25, 2006 (Commission File Number 001-06403) and incorporated by reference herein.* |
|
|
|
|
10s. |
Amended and Restated Executive Change of Control Agreement dated December 17, 2008 between Winnebago Industries, Inc. and Randy J. Potts.* |
|
|
|
|
10t. |
Winnebago Industries, Inc. Restricted Stock Grant Award Agreement under the 2004 Incentive Compensation Plan previously filed with the Registrant’s Current Report on Form 8-K dated October 12, 2006 (Commission File Number 001-06403) and incorporated by reference herein.* |
|
|
|
|
10u. |
Winnebago Industries, Inc. Officers’ Long-Term Incentive Plan, fiscal three-year period 2009, 2010 and 2011 previously filed with the Registrant’s Current Report on Form 8-K dated August 14, 2008 (Commission File Number 001-06403) and incorporated by reference herein.* |
|
|
|
|
10v. |
Winnebago Industries, Inc. Officers’ Incentive Compensation Plan for Fiscal 2007 previously filed with the Registrant’s Current Report on Form 8-K dated June 27, 2006 (Commission File Number 001-06403) and incorporated by reference herein.* |
|
|
|
|
10w. |
Winnebago Industries, Inc. Officers’ Incentive Compensation Plan for Fiscal 2008 previously filed with the Registrant’s Current Report on Form 8-K dated June 26, 2007 (Commission File Number 001-06403) and incorporated by reference herein.* |
55
Exhibit Index
Page Three
|
|
|
|
10x. |
Winnebago Industries, Inc. Officers’ Incentive Compensation Plan for Fiscal 2009 previously filed with the Registrant’s Current Report on Form 8-K dated August 14, 2008 (Commission File Number 001-06403) and incorporated by reference herein.* |
|
|
|
|
10y. |
Winnebago Industries, Inc. Officers’ Incentive Compensation Plan for Fiscal 2010 previously filed with the Registrant’s Current Report on Form 8-K dated June 24, 2009 (Commission File Number 001-06403) and incorporated by reference herein.* |
|
|
|
|
10z. |
Winnebago Industries, Inc. Supplemental Executive Retirement Plan * |
|
|
|
|
10aa. |
Winnebago Industries, Inc. Officers’ Long-Term Incentive Plan, fiscal three-year period 2005, 2006 and 2007 previously filed with the Registrant’s Annual Report on Form 10-K for the fiscal year ended August 28, 2004 (Commission File Number 001-06403) and incorporated by reference herein.* |
|
|
|
|
10bb. |
Winnebago Industries, Inc. Officers’ Long-Term Incentive Plan, fiscal three-year period 2006, 2007 and 2008 previously filed with the Registrant’s Current Report on Form 8-K dated August 30, 2005 (Commission File Number 001-06403) and incorporated by reference herein.* |
|
|
|
|
10cc. |
Winnebago Industries, Inc. Officers’ Long-Term Incentive Plan, fiscal three-year period 2007, 2008 and 2009 previously filed with the Registrant’s Current Report on Form 8-K dated June 27, 2006 (Commission File Number 001-06403) and incorporated by reference herein.* |
|
|
|
|
14.1 |
Winnebago Industries, Inc. Code of Ethics for CEO and Senior Financial Officers previously filed with the Registrant’s Annual Report on Form 10-K for the fiscal year ended August 30, 2003 (Commission File Number 001-06403) and incorporated by reference herein. |
|
|
|
|
23. |
Consent of Independent Registered Public Accounting Firm. |
|
|
|
|
31.1 |
Certification by the Chief Executive Officer pursuant to Section 302 of the Sarbanes-Oxley Act of 2002 dated October 27, 2009. |
|
|
|
|
31.2 |
Certification by the Chief Financial Officer pursuant to Section 302 of the Sarbanes-Oxley Act of 2002 dated October 27, 2009. |
|
|
|
|
32.1 |
Certification by the Chief Executive Officer pursuant to Section 1350, as adopted pursuant to Section 906 of the Sarbanes-Oxley Act of 2002 dated October 27, 2009. |
|
|
|
|
32.2 |
Certification by the Chief Financial Officer pursuant to Section 1350, as adopted pursuant to Section 906 of the Sarbanes-Oxley Act of 2002 dated October 27, 2009. |
*Management contract or compensation plan or arrangement.
56
ITEM 6. 11-Year Selected Financial Data (1)
|
|
|
|
|
|
|
|
|
|
|
|
|
|
|
|
(In thousands, except percent and per share
data) |
|
Aug. 29, |
|
Aug. 30, |
|
Aug. 25, |
|
Aug. 26, |
|
||||
|
For the Year |
|
|
|
|
|
|
|
|
|
|
|
|
|
|
Net revenues |
|
$ |
211,519 |
|
$ |
604,352 |
|
$ |
870,152 |
|
$ |
864,403 |
|
|
(Loss) income before taxes |
|
|
(58,063 |
) |
|
(5,441 |
) |
|
61,409 |
|
|
68,195 |
|
|
Pretax (loss) profit percent of revenue |
|
|
(27.4 |
)% |
|
(0.9 |
)% |
|
7.1 |
% |
|
7.9 |
% |
|
Provision for (credits) income taxes |
|
|
20,703 |
|
|
(8,225 |
) |
|
19,845 |
|
|
23,451 |
|
|
Income tax (benefit) rate |
|
|
35.7 |
% |
|
(151.2 |
)% |
|
32.3 |
% |
|
34.4 |
% |
|
(Loss) income from continuing operations |
|
|
(78,766 |
) |
|
2,784 |
|
|
41,564 |
|
|
44,744 |
|
|
Income from discontinued operations (4) |
|
|
- - - |
|
|
- - - |
|
|
- - - |
|
|
- - - |
|
|
Cum. effect of change in accounting principle |
|
|
- - - |
|
|
- - - |
|
|
- - - |
|
|
- - - |
|
|
Net (loss) income |
|
$ |
(78,766 |
) |
$ |
2,784 |
|
$ |
41,564 |
|
$ |
44,744 |
|
|
(Loss) income per share |
|
|
|
|
|
|
|
|
|
|
|
|
|
|
Continuing operations |
|
|
|
|
|
|
|
|
|
|
|
|
|
|
Basic |
|
$ |
(2.71 |
) |
$ |
0.10 |
|
$ |
1.33 |
|
$ |
1.39 |
|
|
Diluted |
|
|
(2.71 |
) |
|
0.10 |
|
|
1.32 |
|
|
1.37 |
|
|
Discontinued operations |
|
|
|
|
|
|
|
|
|
|
|
|
|
|
Basic |
|
|
- - - |
|
|
- - - |
|
|
- - - |
|
|
- - - |
|
|
Diluted |
|
|
- - - |
|
|
- - - |
|
|
- - - |
|
|
- - - |
|
|
Cum. effect of change in accounting principle |
|
|
|
|
|
|
|
|
|
|
|
|
|
|
Basic |
|
|
- - - |
|
|
- - - |
|
|
- - - |
|
|
- - - |
|
|
Diluted |
|
|
- - - |
|
|
- - - |
|
|
- - - |
|
|
- - - |
|
|
Net (loss) income per share |
|
|
|
|
|
|
|
|
|
|
|
|
|
|
Basic |
|
$ |
(2.71 |
) |
$ |
0.10 |
|
$ |
1.33 |
|
$ |
1.39 |
|
|
Diluted |
|
|
(2.71 |
) |
|
0.10 |
|
|
1.32 |
|
|
1.37 |
|
|
Weighted average common shares outstanding (in thousands) |
|
|
|
|
|
|
|
|
|
|
|
|
|
|
Basic |
|
|
29,040 |
|
|
29,093 |
|
|
31,162 |
|
|
32,265 |
|
|
Diluted |
|
|
29,051 |
|
|
29,144 |
|
|
31,415 |
|
|
32,550 |
|
|
Cash dividends paid per share |
|
$ |
0.12 |
|
$ |
0.48 |
|
$ |
0.40 |
|
$ |
0.36 |
|
|
Book value per share |
|
|
3.17 |
|
|
5.98 |
|
|
7.05 |
|
|
7.01 |
|
|
Return on assets (ROA) (5) |
|
|
(30.0 |
)% |
|
0.8 |
% |
|
11.1 |
% |
|
11.2 |
% |
|
Return on equity (ROE) (6) |
|
|
(59.2 |
)% |
|
1.5 |
% |
|
19.5 |
% |
|
19.7 |
% |
|
Return on invested capital (ROIC) (7) |
|
|
(61.1 |
)% |
|
1.7 |
% |
|
26.2 |
% |
|
24.9 |
% |
|
Unit Sales |
|
|
|
|
|
|
|
|
|
|
|
|
|
|
Class A |
|
|
822 |
|
|
3,029 |
|
|
5,031 |
|
|
4,455 |
|
|
Class B |
|
|
149 |
|
|
140 |
|
|
- - - |
|
|
- - - |
|
|
Class C |
|
|
1,225 |
|
|
3,238 |
|
|
4,438 |
|
|
5,388 |
|
|
Total Motor Homes |
|
|
2,196 |
|
|
6,407 |
|
|
9,469 |
|
|
9,843 |
|
|
At Year End |
|
|
|
|
|
|
|
|
|
|
|
|
|
|
Total assets |
|
$ |
220,466 |
|
$ |
305,455 |
|
$ |
366,510 |
|
$ |
384,715 |
|
|
Stockholders’ equity |
|
|
92,331 |
|
|
173,924 |
|
|
208,354 |
|
|
218,322 |
|
|
Market capitalization |
|
|
337,991 |
|
|
329,956 |
|
|
821,282 |
|
|
884,789 |
|
|
Working capital |
|
|
79,460 |
|
|
108,548 |
|
|
168,863 |
|
|
187,038 |
|
|
Current ratio |
|
|
2.6 to 1 |
|
|
3.0 to 1 |
|
|
2.9 to 1 |
|
|
3.3 to 1 |
|
|
Number of employees |
|
|
1,630 |
|
|
2,250 |
|
|
3,310 |
|
|
3,150 |
|
|
Dealer inventory |
|
|
1,694 |
|
|
3,551 |
|
|
4,471 |
|
|
4,733 |
|
|
|
|
|
(1) |
Certain prior periods’ information has been reclassified to conform to the current year-end presentation. |
|
|
|
|
(2) |
The fiscal years ended August 31, 2002 and August 30, 2008 contained 53 weeks; all other fiscal years contained 52 weeks. |
|
|
|
|
(3) |
Includes a noncash after-tax cumulative effect of change in accounting principle of $1.1 million expense or $0.05 per share due to the adoption of SAB No. 101, Revenue Recognition in Financial Statements. |
|
|
|
|
(4) |
Includes discontinued operations of Winnebago Acceptance Corporation for all years presented. |
57
|
|
|
|
|
|
|
|
|
|
|
|
|
|
|
|
|
|
|
|
|
|
||
|
Aug. 27, |
|
Aug. 28, |
|
Aug. 30, |
|
Aug. 31, |
|
Aug. 25, |
|
Aug. 26, |
|
Aug. 28, |
|
|||||||||
|
|
|
|
|
|
|
|
|
|
|
|
|
|
|
|
|
|
|
|
|
|
||
|
$ |
991,975 |
|
$ |
1,114,154 |
|
$ |
845,210 |
|
$ |
825,269 |
|
$ |
671,686 |
|
$ |
743,729 |
|
$ |
668,658 |
|
||
|
|
100,890 |
|
|
112,234 |
|
|
78,693 |
|
|
81,324 |
|
|
55,754 |
|
|
70,583 |
|
|
62,848 |
|
||
|
|
10.2 |
% |
|
10.1 |
% |
|
9.3 |
% |
|
9.9 |
% |
|
8.3 |
% |
|
9.5 |
% |
|
9.4 |
% |
||
|
|
35,817 |
|
|
41,593 |
|
|
29,961 |
|
|
28,431 |
|
|
14,258 |
|
|
24,400 |
|
|
21,033 |
|
||
|
|
35.5 |
% |
|
37.1 |
% |
|
38.1 |
% |
|
35.0 |
% |
|
25.6 |
% |
|
34.6 |
% |
|
33.5 |
% |
||
|
|
65,073 |
|
|
70,641 |
|
|
48,732 |
|
|
52,893 |
|
|
41,496 |
|
|
46,183 |
|
|
41,815 |
|
||
|
|
- - - |
|
|
- - - |
|
|
1,152 |
|
|
1,778 |
|
|
2,258 |
|
|
2,216 |
|
|
2,445 |
|
||
|
|
- - - |
|
|
- - - |
|
|
- - - |
|
|
- - - |
|
|
(1,050 |
) |
|
- - - |
|
|
- - - |
|
||
|
$ |
65,073 |
|
$ |
70,641 |
|
$ |
49,884 |
|
$ |
54,671 |
|
$ |
42,704 |
|
$ |
48,399 |
|
$ |
44,260 |
|
||
|
|
|
|
|
|
|
|
|
|
|
|
|
|
|
|
|
|
|
|
|
|
||
|
|
|
|
|
|
|
|
|
|
|
|
|
|
|
|
|
|
|
|
|
|
||
|
$ |
1.95 |
|
$ |
2.06 |
|
$ |
1.32 |
|
$ |
1.33 |
|
$ |
1.00 |
|
$ |
1.07 |
|
$ |
0.94 |
|
||
|
|
1.92 |
|
|
2.03 |
|
|
1.30 |
|
|
1.30 |
|
|
0.99 |
|
|
1.05 |
|
|
0.93 |
|
||
|
|
|
|
|
|
|
|
|
|
|
|
|
|
|
|
|
|
|
|
|
|
||
|
|
- - - |
|
|
- - - |
|
|
0.03 |
|
|
0.04 |
|
|
0.05 |
|
|
0.05 |
|
|
0.06 |
|
||
|
|
- - - |
|
|
- - - |
|
|
0.03 |
|
|
0.04 |
|
|
0.05 |
|
|
0.05 |
|
|
0.05 |
|
||
|
|
|
|
|
|
|
|
|
|
|
|
|
|
|
|
|
|
|
|
|
|
||
|
|
- - - |
|
|
- - - |
|
|
- - - |
|
|
- - - |
|
|
(0.02 |
) |
|
- - - |
|
|
- - - |
|
||
|
|
- - - |
|
|
- - - |
|
|
- - - |
|
|
- - - |
|
|
(0.02 |
) |
|
- - - |
|
|
- - - |
|
||
|
|
|
|
|
|
|
|
|
|
|
|
|
|
|
|
|
|
|
|
|
|
||
|
$ |
1.95 |
|
$ |
2.06 |
|
$ |
1.35 |
|
$ |
1.37 |
|
$ |
1.03 |
|
$ |
1.12 |
|
$ |
1.00 |
|
||
|
|
1.92 |
|
|
2.03 |
|
|
1.33 |
|
|
1.34 |
|
|
1.02 |
|
|
1.10 |
|
|
0.98 |
|
||
|
|
|
|
|
|
|
|
|
|
|
|
|
|
|
|
|
|
|
|
|
|
||
|
|
|
|
|
|
|
|
|
|
|
|
|
|
|
|
|
|
|
|
|
|
||
|
|
33,382 |
|
|
34,214 |
|
|
36,974 |
|
|
39,898 |
|
|
41,470 |
|
|
43,360 |
|
|
44,418 |
|
||
|
|
33,812 |
|
|
34,789 |
|
|
37,636 |
|
|
40,768 |
|
|
42,080 |
|
|
44,022 |
|
|
45,074 |
|
||
|
$ |
0.28 |
|
$ |
0.20 |
|
$ |
0.10 |
|
$ |
0.10 |
|
$ |
0.10 |
|
$ |
0.10 |
|
$ |
0.10 |
|
||
|
|
7.15 |
|
|
6.01 |
|
|
5.78 |
|
|
4.81 |
|
|
5.00 |
|
|
4.11 |
|
|
3.35 |
|
||
|
|
16.1 |
% |
|
18.3 |
% |
|
14.0 |
% |
|
15.9 |
% |
|
12.9 |
% |
|
16.3 |
% |
|
17.1 |
% |
||
|
|
29.7 |
% |
|
34.4 |
% |
|
25.6 |
% |
|
28.2 |
% |
|
22.3 |
% |
|
29.8 |
% |
|
33.3 |
% |
||
|
|
30.7 |
% |
|
35.4 |
% |
|
25.5 |
% |
|
29.1 |
% |
|
24.1 |
% |
|
28.2 |
% |
|
32.7 |
% |
||
|
|
|
|
|
|
|
|
|
|
|
|
|
|
|
|
|
|
|
|
|
|
||
|
|
6,674 |
|
|
8,108 |
|
|
6,705 |
|
|
6,725 |
|
|
5,666 |
|
|
6,819 |
|
|
6,054 |
|
||
|
|
- - - |
|
|
- - - |
|
|
308 |
|
|
763 |
|
|
703 |
|
|
854 |
|
|
600 |
|
||
|
|
3,963 |
|
|
4,408 |
|
|
4,021 |
|
|
4,329 |
|
|
3,410 |
|
|
3,697 |
|
|
4,222 |
|
||
|
|
10,637 |
|
|
12,516 |
|
|
11,034 |
|
|
11,817 |
|
|
9,779 |
|
|
11,370 |
|
|
10,876 |
|
||
|
|
|
|
|
|
|
|
|
|
|
|
|
|
|
|
|
|
|
|
|
|
||
|
$ |
412,960 |
|
$ |
394,556 |
|
$ |
377,462 |
|
$ |
337,077 |
|
$ |
351,922 |
|
$ |
308,686 |
|
$ |
285,889 |
|
||
|
|
235,887 |
|
|
201,875 |
|
|
210,626 |
|
|
179,815 |
|
|
207,464 |
|
|
174,909 |
|
|
149,384 |
|
||
|
|
1,073,165 |
|
|
1,071,570 |
|
|
898,010 |
|
|
713,500 |
|
|
581,779 |
|
|
272,733 |
|
|
538,322 |
|
||
|
|
197,469 |
|
|
164,175 |
|
|
164,017 |
|
|
144,303 |
|
|
173,677 |
|
|
141,096 |
|
|
123,245 |
|
||
|
|
3.2 to 1 |
|
|
2.6 to 1 |
|
|
2.8 to 1 |
|
|
2.6 to 1 |
|
|
3.2 to 1 |
|
|
3.0 to 1 |
|
|
2.5 to 1 |
|
||
|
|
3,610 |
|
|
4,220 |
|
|
3,750 |
|
|
3,685 |
|
|
3,325 |
|
|
3,300 |
|
|
3,400 |
|
||
|
|
4,794 |
|
|
4,978 |
|
|
3,945 |
|
|
4,000 |
|
|
3,549 |
|
|
3,756 |
|
|
3,638 |
|
||
|
|
|
|
(5) |
ROA - Current period net income divided by average total asset balance using current and previous ending periods. |
|
|
|
|
(6) |
ROE - Current period net income divided by average equity balance using current and previous ending periods. |
|
|
|
|
(7) |
ROIC - Current period net income divided by average invested capital (total assets minus cash, short-term and long-term investments and noninterest liabilities) using current ending periods. |
58
|
|
|
|
|
|
|
|
BOARD OF DIRECTORS |
|
SHAREHOLDER INFORMATION
Publications A notice of Annual Meeting of Shareholders and Proxy Statement is furnished to shareholders upon request in advance of the annual meeting. Copies of our quarterly financial earnings releases, the annual report on Form 10-K (without exhibits), the quarterly reports on Form 10-Q (without exhibits) and current reports on Form 8-K (without exhibits) as filed by us with the Securities and Exchange Commission, may be obtained without charge from the corporate offices as follows: Sheila Davis, PR/IR Manager Winnebago Industries, Inc. 605 W. Crystal Lake Road P.O. Box 152 Forest City, Iowa 50436-0152 Telephone: (641) 585-3535 Fax: (641) 585-6966 E-Mail: ir@winnebagoind.com All news releases issued by us, reports filed by us with the Securities and Exchange Commission (including exhibits) and information on our Corporate Governance Policies and Procedures may also be viewed at the Winnebago Industries’ Web Site: http://winnebagoind.com/investor.html. Information contained on Winnebago Industries’ Web Site is not incorporated into this Annual Report or other securities filings. Number of Shareholders of Record As of October 6, 2009, Winnebago Industries had 3,642 shareholders of record. Dividends Paid Winnebago Industries paid a cash dividend of 12 cents a share to shareholders of record in the first quarter of Fiscal 2009. Cash dividend payments were suspended starting with the second quarter of Fiscal 2009. Shareholder Account Assistance Transfer Agent to contact for address changes, account certificates and stock holdings: Wells Fargo Shareowner Services P.O. Box 64854 St. Paul, Minnesota 55164-0854 or 161 North Concord Exchange South St. Paul, Minnesota 55075-1139 Telephone: (800) 468-9716 or (651) 450-4064 Inquiries: www.wellsfargo.com/shareownerservices Annual Meeting The Annual Meeting of Shareholders is scheduled to be held on Tuesday, December 15, 2009, at 4:00 p.m. (CST) in Winnebago Industries’ South Office Complex Theater, 605 W. Crystal Lake Road, Forest City, Iowa. |
|
Independent Auditors
Deloitte & Touche LLP 400 One Financial Plaza 120 South Sixth Street Minneapolis, Minnesota 55402-1844 (612) 397-4000 NYSE Annual CEO Certification and Sarbanes-Oxley Section 302 Certifications We submitted the annual
Chief Executive Officer Certification to the New York Stock Exchange (NYSE)
as required under the corporate governance rules of the NYSE. We also filed
as exhibits to our 2009 Annual Report on Form 10-K, the Chief Executive
Officer and Chief Financial Officer certifications required under Section 302
of the Sarbanes-Oxley Act of 2002.
Winnebago Industries is an equal opportunity employer.
The letter to Shareholders contains forward-looking statements within the meaning of the Private Securities Litigation Reform Act of 1995. Investors are cautioned that forward-looking statements are inherently uncertain. A number of factors could cause actual results to differ materially from these statements. These factors are included under “Item 1A. Risk Factors” in Part 1 of the accompanying Annual Report on Form 10-K. |

59